Article

Wear Behavior of Austempered and Quenched and Tempered Gray Cast Irons under Similar Hardness

1
Faculty of Mechanical Engineering and Automation, Zhejiang Sci-Tech University, Hangzhou 310018, China
2
Automotive Tribology Center, Department of Mechanical Engineering, School of Engineering and Computer Science, Oakland University, Rochester, MI 48309, USA
*
Author to whom correspondence should be addressed.
Current address: 201 N. Squirrel Rd Apt 1204, Auburn Hills, MI 48326, USA.
Metals 2019, 9(12), 1329; https://doi.org/10.3390/met9121329
Submission received: 14 November 2019 / Revised: 3 December 2019 / Accepted: 4 December 2019 / Published: 8 December 2019

Abstract

:
In this research, an austempering heat treatment was applied on gray cast iron using various austempering temperatures ranging from 232 °C to 371 °C and holding times ranging from 1 min to 120 min. The microstructure and hardness were examined using optical microscopy and a Rockwell hardness tester. Rotational ball-on-disk sliding wear tests were carried out to investigate the wear behavior of austempered gray cast iron samples and to compare with conventional quenched and tempered gray cast iron samples under equivalent hardness. For the austempered samples, it was found that acicular ferrite and carbon saturated austenite were formed in the matrix. The ferritic platelets became coarse when increasing the austempering temperature or extending the holding time. Hardness decreased due to a decreasing amount of martensite in the matrix. In wear tests, austempered gray cast iron samples showed slightly higher wear resistance than quenched and tempered samples under similar hardness while using the austempering temperatures of 232 °C, 260 °C, 288 °C, and 316 °C and distinctly better wear resistance while using the austempering temperatures of 343 °C and 371 °C. After analyzing the worn surface, abrasive wear and fatigue wear with the presence of pits, spalls, voids, long cracks, and wear debris were the main mechanisms for austempered gray cast iron with a low austempering temperature. However, only small pits and short cracks were observed on the wear track of austempered gray cast iron with high austempering temperature. Furthermore, the graphite flakes were exposed and ground by the counterpart surface during wear tests. Then, the graphite particles would form a tribo-layer to protect the contact surface.

1. Introduction

Gray cast iron (GI) is one of the conventional iron-carbon alloys with a carbon content of 2.5–4% and a silicon content of 1–3%. Its typical microstructure contains graphite flakes surrounded by pearlite or ferrite. In terms of morphology, size, and distribution, graphite flakes are divided into five patterns from A to E in the ASTM Standard A247 [1]. Due to its excellent machinability and damping capacity with low production cost, GI has been broadly used in the manufacturing of brake rotors, clutch discs, cylinder liners, and tool mounts. Most of the GI applications require superior resistance to retard wear loss on contact surfaces. Therefore, heat treatment processes such as austempering treatment and quenching and tempering treatment are expected to provide benefits for the tribological properties of GI.
The austempering heat treatment was first proposed by Edgar C. Bain in the 1930s [2]. In this process, GI is austenitized above the Acm critical temperature to convert the ferrite or pearlite into unstable austenite. Then, the full austenitized GI is transferred and soaked in a salt bath furnace at a constant temperature for a specific period. The isothermal temperatures should be between the pearlite formation temperature and martensite formation temperature, which are similar to the bainite formation temperatures of steel. The final microstructure of austempered gray cast iron (AGI) consists of acicular ferrite and carbon saturated austenite. In the austempering process, a salt bath furnace is typically used in order to eliminate or minimize surface oxidation and carburization.
A quenching and tempering treatment is one common heat treatment process applied on cast irons and steels. Additional tempering is introduced on as-quenched materials to improve the ductility and relieve some internal stress. The tempering temperature should be set below the eutectoid temperature. Precise control of tempering temperature and holding duration is vital for the desired mechanical properties. In the tempering process, the martensite formed during the quenching step is transformed into tempered martensite by carbon precipitation and diffusion.
The tribological performance of GI has been studied by several researchers using different alloy elements and heat treatment processes through various test configurations. Hassani et al. [3] studied the influence of hard carbide forming elements such as vanadium and chromium on the wear properties of GI by using a pin-on-disk rotational fixture. The presence of vanadium and chromium induced the formation of oxidative layers to reduce the wear loss. Sarkar et al. [4] investigated the wear behavior of copper alloyed AGI using six austempering temperatures by a block-on-roller tribometer. Low wear resistance was obtained for high austempering temperature due to the significant drop in hardness and tensile strength. Vadiraj [5] studied the wear resistance of quenched and tempered gray cast iron (QTGI) on a pin-on-disk test rig. It was found that the wear rate increased when increasing the tempering temperature. This was attributed to the softening of the martensitic matrix with the tempering reaction. Vadiraj et al. [6] also evaluated the wear performance of a series of alloyed AGIs using a pin-on-disk tribometer. The specific wear rate had a decreasing trend when increasing the graphite content since more graphite could be engaged into the contact interface as solid lubricant. Furthermore, the wear rate would increase when the ferritic laths became thick due to the low wear resistance of the soft ferrite phase. Balachandran et al. [7] found that the wear resistance of AGI was degraded after adding nickel alloy since the presence of nickel would stabilize the austenite and inhibit the stress induced transformation.
Some recent studies have reported better wear resistance of AGI compared with as-cast GI [8,9,10]. However, few research studies have paid attention to the comparison of the tribological characteristics between AGI and conventional QTGI. Since it has been well known that the wear resistance of cast irons and steels is often correlated with surface hardness, the comparison in wear resistance is reasonable under equivalent hardness [11,12,13,14]. In the current research, AGI samples were prepared by a wide range of austempering temperatures and holding times. Various tempering temperatures were applied on quenched GI to match the hardness of AGI samples for the comparison in wear performance. Wear resistance of AGI and QTGI samples was tested using a rotational ball-on-disk sliding rig. In addition, the microstructure of AGI and QTGI produced by the different heat treatment parameters was evaluated by optical microscopy, and the worn surface was examined through scanning electron microscopy (SEM) and energy dispersive X-ray spectroscopy (EDS) to analyze the potential mechanisms. The results will be helpful for the possible substitution of traditional QTGI by AGI in existing and future applications.

2. Materials and Methods

2.1. Chemical Composition

The percentage of main alloy elements of the GI was measured by a carbon-sulfur analyzer (CS-200, LECO, San Jose, MI, USA) and an optical spectrometer (3460, Applied Research Laboratories ARL, Austin, TX, USA), as shown in Table 1. More specific details of the GI used in this research are available on the supplier’s website at www.mcmaster.com/8928k79.

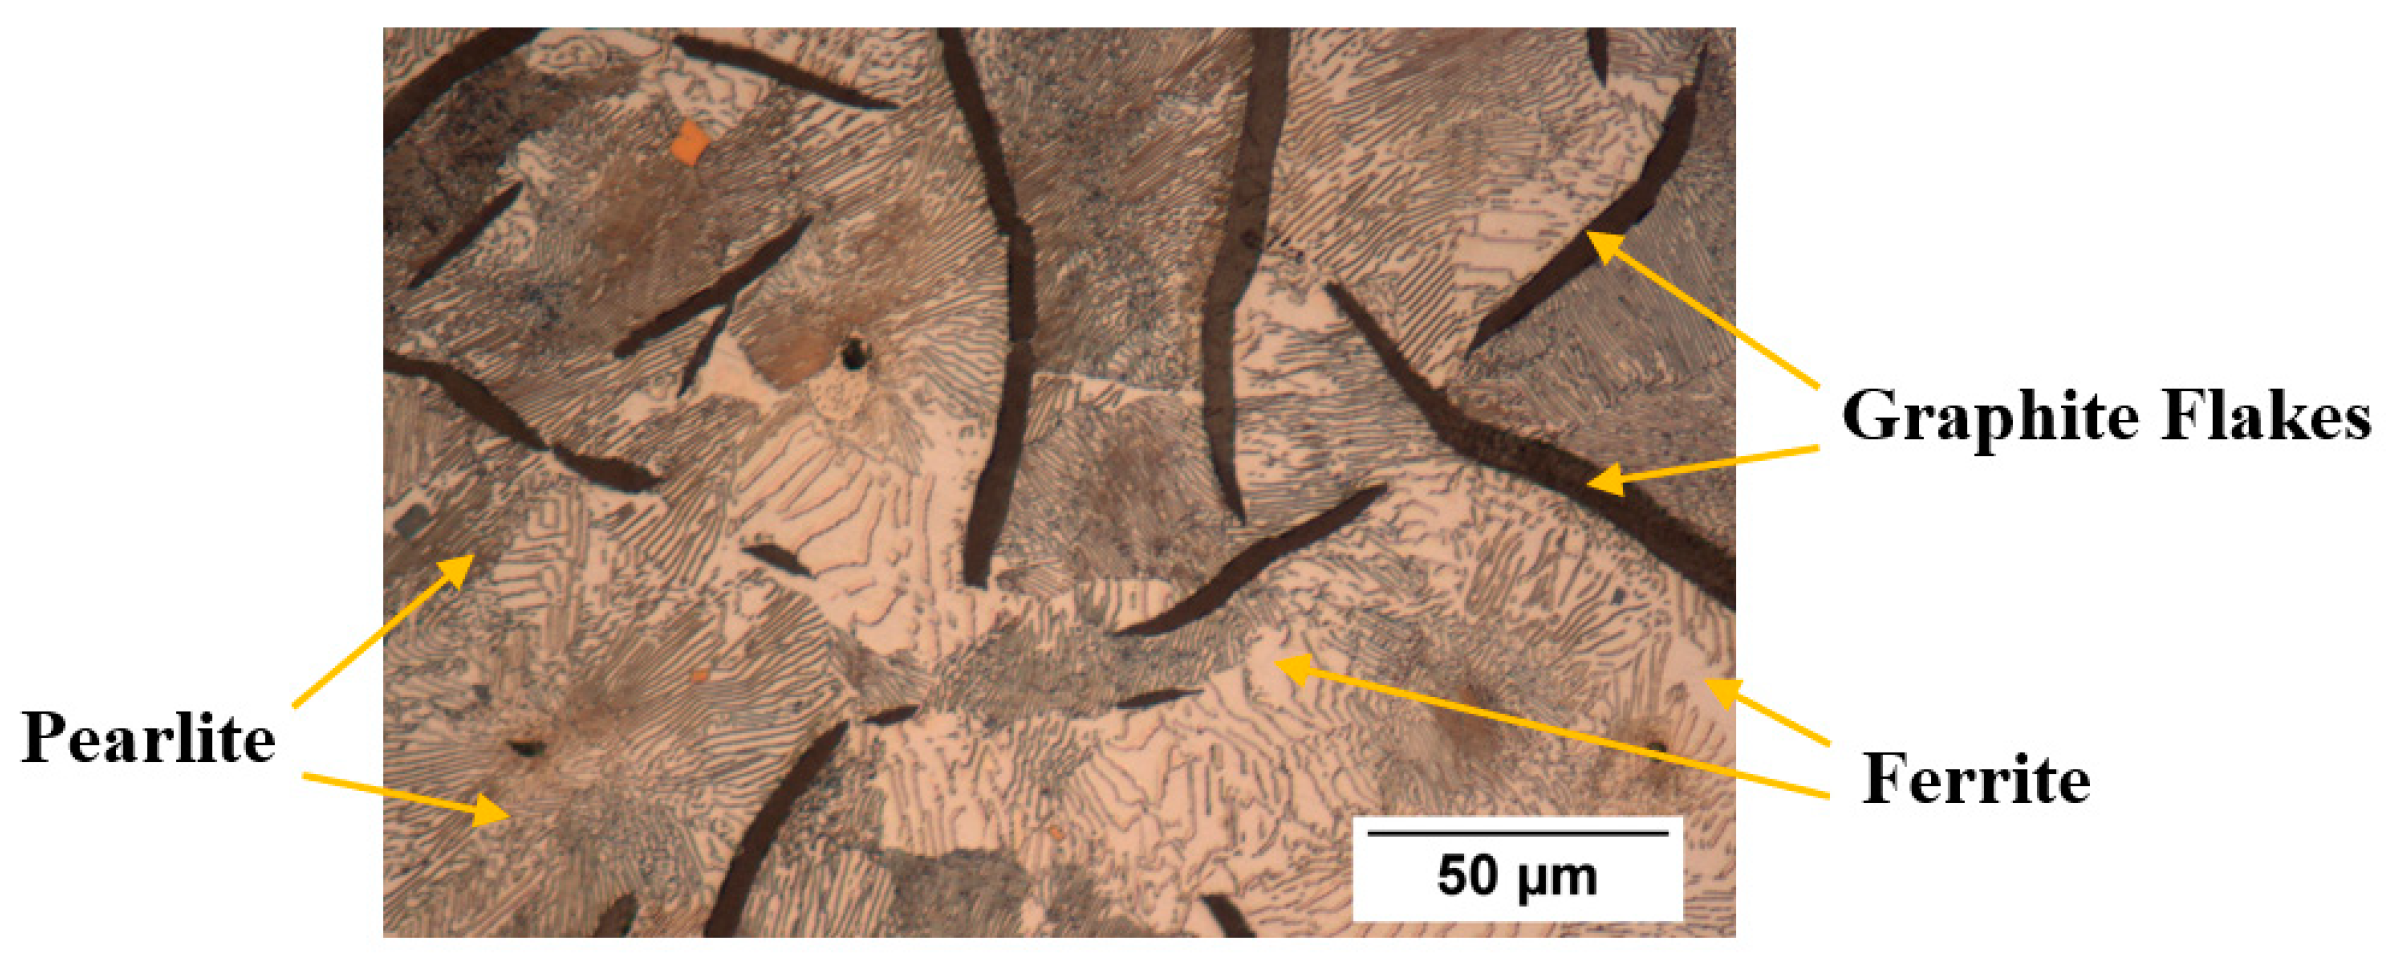
2.2. As-Cast Gray Cast Iron

The original microstructure of the as-cast GI is shown in Figure 1. The main components in the matrix were graphite flakes, ferrite, and pearlite.

2.3. Austempering Heat Treatment

The as-cast GI samples were austenitized at a temperature of 832 °C for 20 min in a medium temperature salt bath furnace (50% KCl + 20% NaCl + 30% CaCl2). The pearlite was transformed into unstable austenite, and the alloy elements were distributed uniformly. Then, the fully austenitized GI samples were quickly transferred to another pre-heated low temperature salt bath furnace (50% KNO3 + 50% NaNO3) for the austempering process at various austempering temperatures (232 °C, 260 °C, 288 °C, 316 °C, 343 °C, and 371 °C) and holding times (1 min, 2 min, 3 min, 6 min, 10 min, 20 min, 30 min, 60 min, 90 min, and 120 min). The above parameters were selected in terms of the previous related research [6,10,15,16,17,18,19]. Then, the AGI samples were cooled to room temperature by water. The austempering process diagram is displayed in Figure 2a and Table 2.

2.4. Quenching and Tempering Heat Treatment

The as-cast GI samples were first austenitized at a temperature of 832 °C for 20 min in a medium temperature salt bath furnace (50% KCl + 20% NaCl + 30% CaCl2) to obtain unstable austenite. After that, the fully austenitized GI samples were quenched by oil. Then, different tempering temperatures (316 °C, 371 °C, 399 °C, 454 °C, 482 °C, 510 °C) with a constant holding time of 60 min were applied on quenched GI samples to match the hardness of the AGI samples, respectively. The tempering process was conducted using an electrical heating furnace under air atmosphere (Lindberg-M, Thermo Scientific, Waltham, MA, USA). Finally, the tempered samples were cooled to room temperature in oil. The quenching and tempering process diagram is displayed in Figure 2b, and Table 2 gives the details.

2.5. Metallurgical Evaluation

Fifteen millimeter cubic coupons were used for metallurgical evaluation. Coupons were hot mounted using Diallyl Phthalate powder. The coupons were ground and polished to a mirror-like surface using Si-carbide sandpaper from 240 grit to 1200 grit and polishing cloths with 0.3 μm alumina oxide suspension. Then, coupons were thoroughly rinsed by water and etched by 3% nital solutions for 2 s to 3 s. Metallurgical evaluation was carried out using optical microscopy (PME-3, Olympus, Tokyo, Japan).

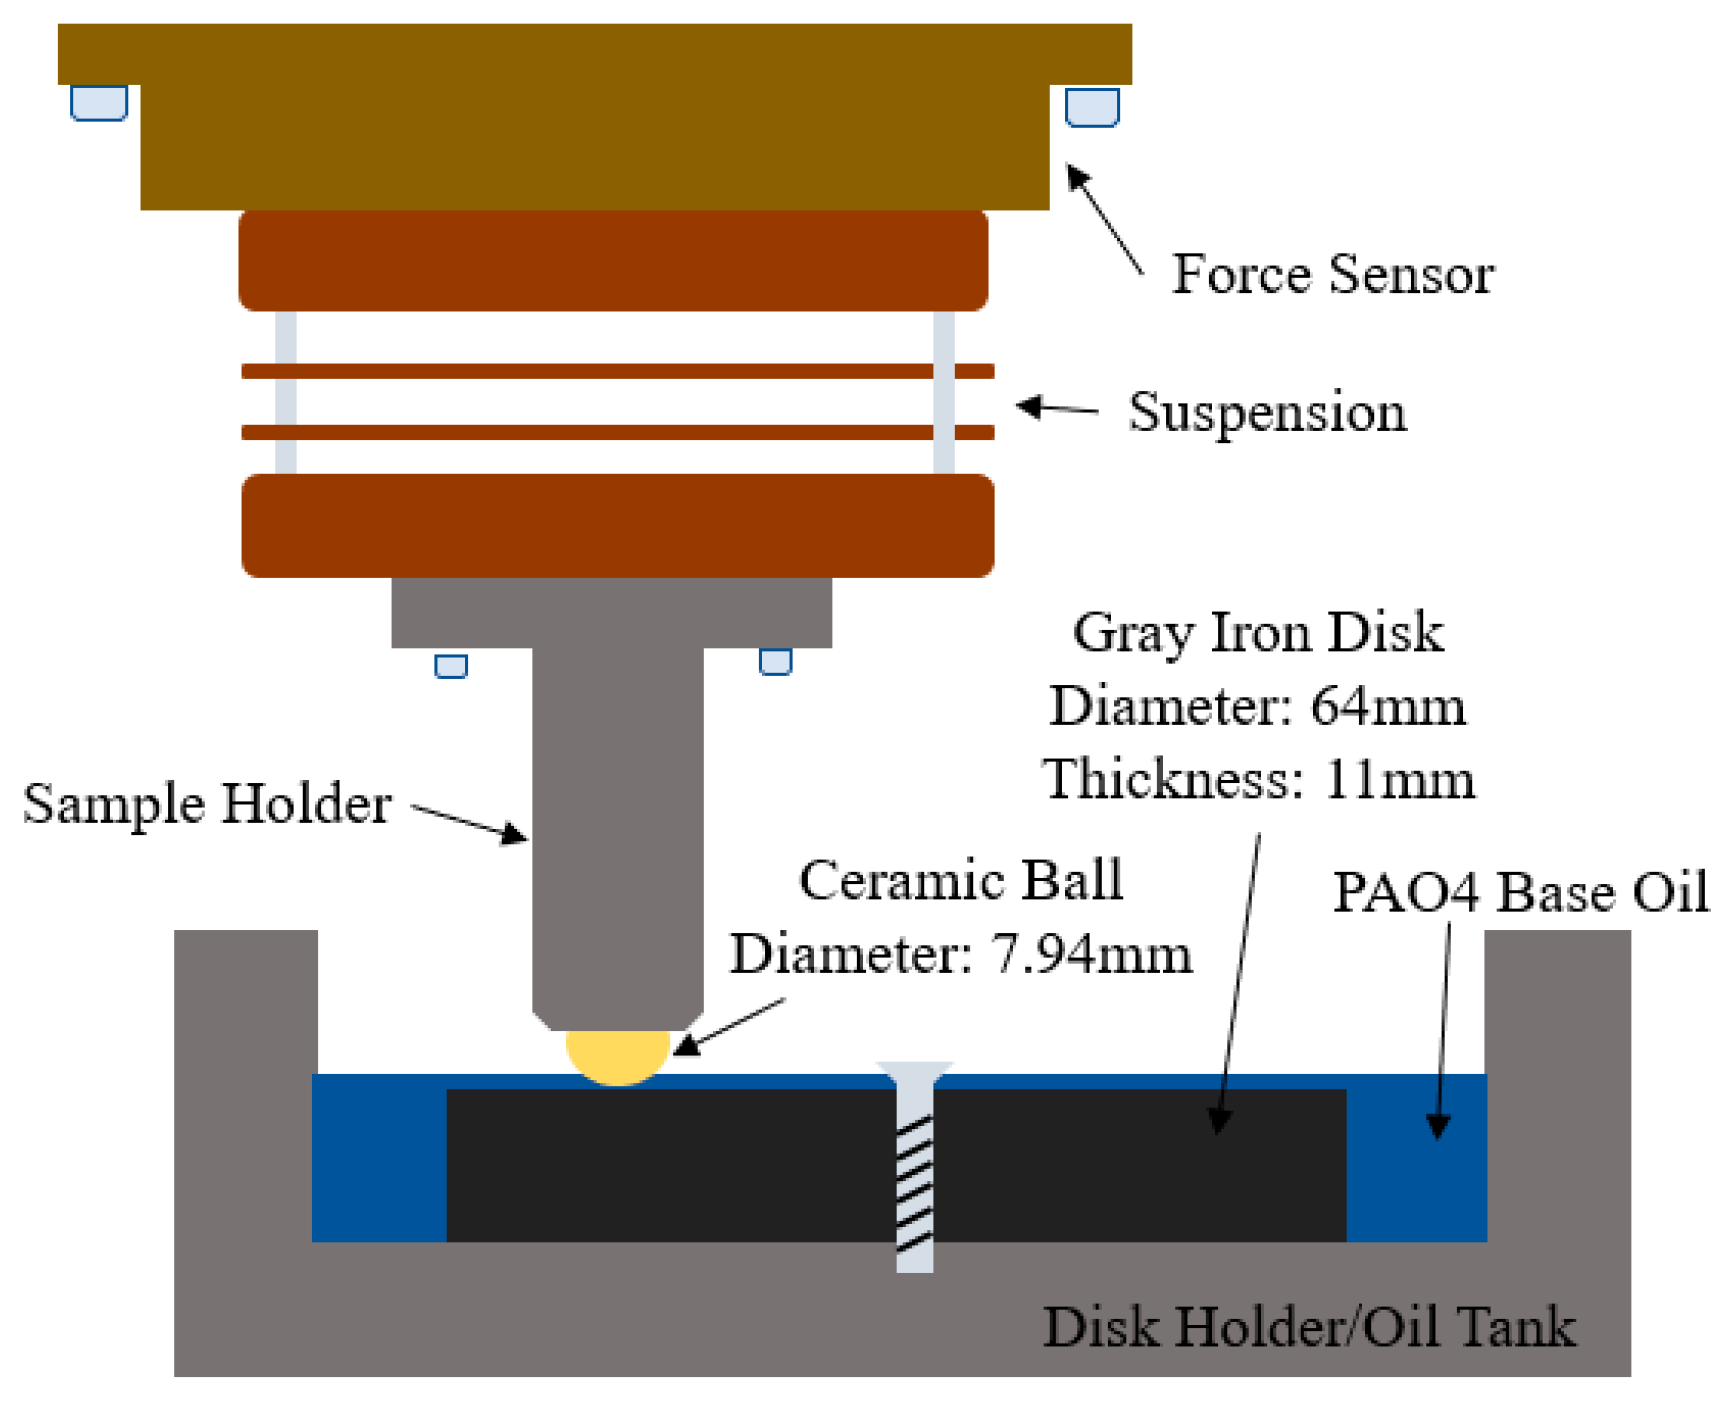
2.6. Rotational Ball-on-Disk Sliding Wear Test

Sliding wear tests were conducted on a universal mechanical tribometer (UMT-3, Bruker, Billica, MA, USA) with a rotational ball-on-disk configuration at room temperature. An alumina ball was used as the counterpart to simulate the ceramic ball bearings. The dimensions of the AGI and QTGI sample disks are shown in Figure 3. The AGI and QTGI sample disks were ground and polished to approximately 300 nm (Arithmetic Roughness/Ra), which was measured by a 3-dimensional surface profilometer (ContourGT-K, Bruker, Billica, MA, USA). The normal load was 300 N, and the rotational speed was 240 rpm. In sliding wear tests, the sample disks were submerged into PAO4 base oil (kinematic viscosity of 16.8 cSt at 40 °C). The test duration was 30 min. Each test was repeated three times, and the averages were reported. After the wear tests, an SEM (JSM-6510, JEOL, Tokyo, Japan) equipped with EDS was used to observe the worn tracks for potential mechanisms. The details of the wear tests are summarized in Table 2.

2.7. Rockwell C Hardness Measurement

The hardness of the GI samples under different heat treatments was measured by a Rockwell hardness tester (R-260, LECO, St. Joseph, MI, USA) under the ASTM Standard E18-16 [20]. The sample surfaces were first ground flat and then polished by Si-carbide sandpaper with 240 grit before each hardness measurement. Each sample was measured three times and then averaged (Table 2).

3. Results

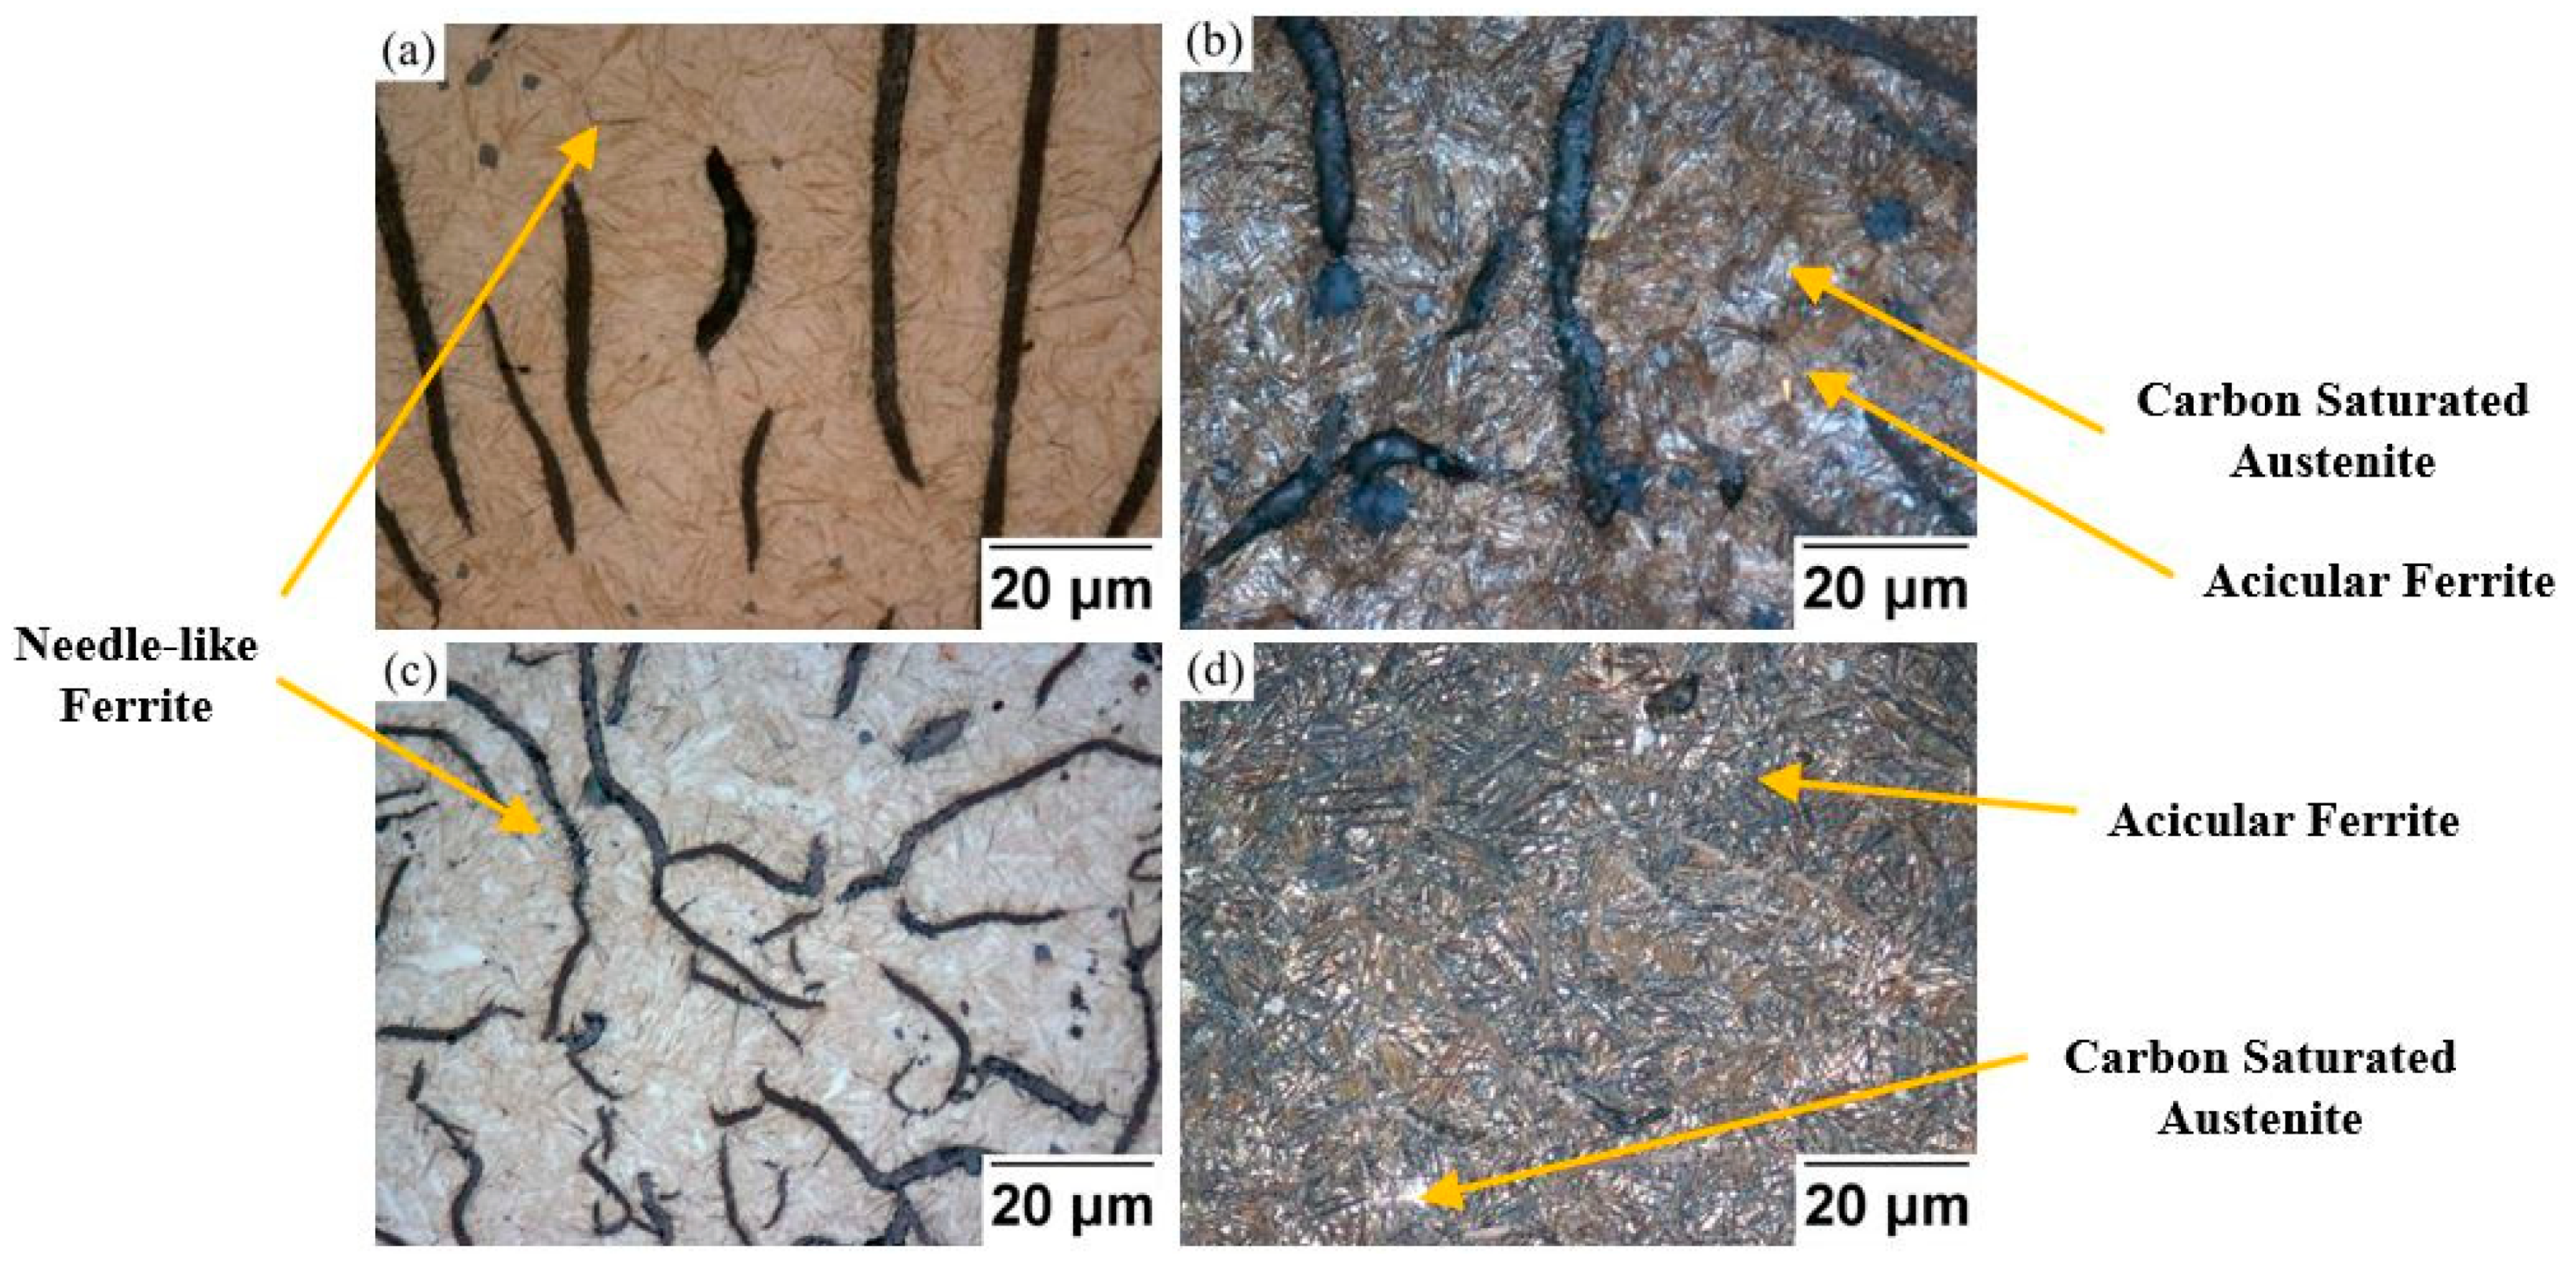
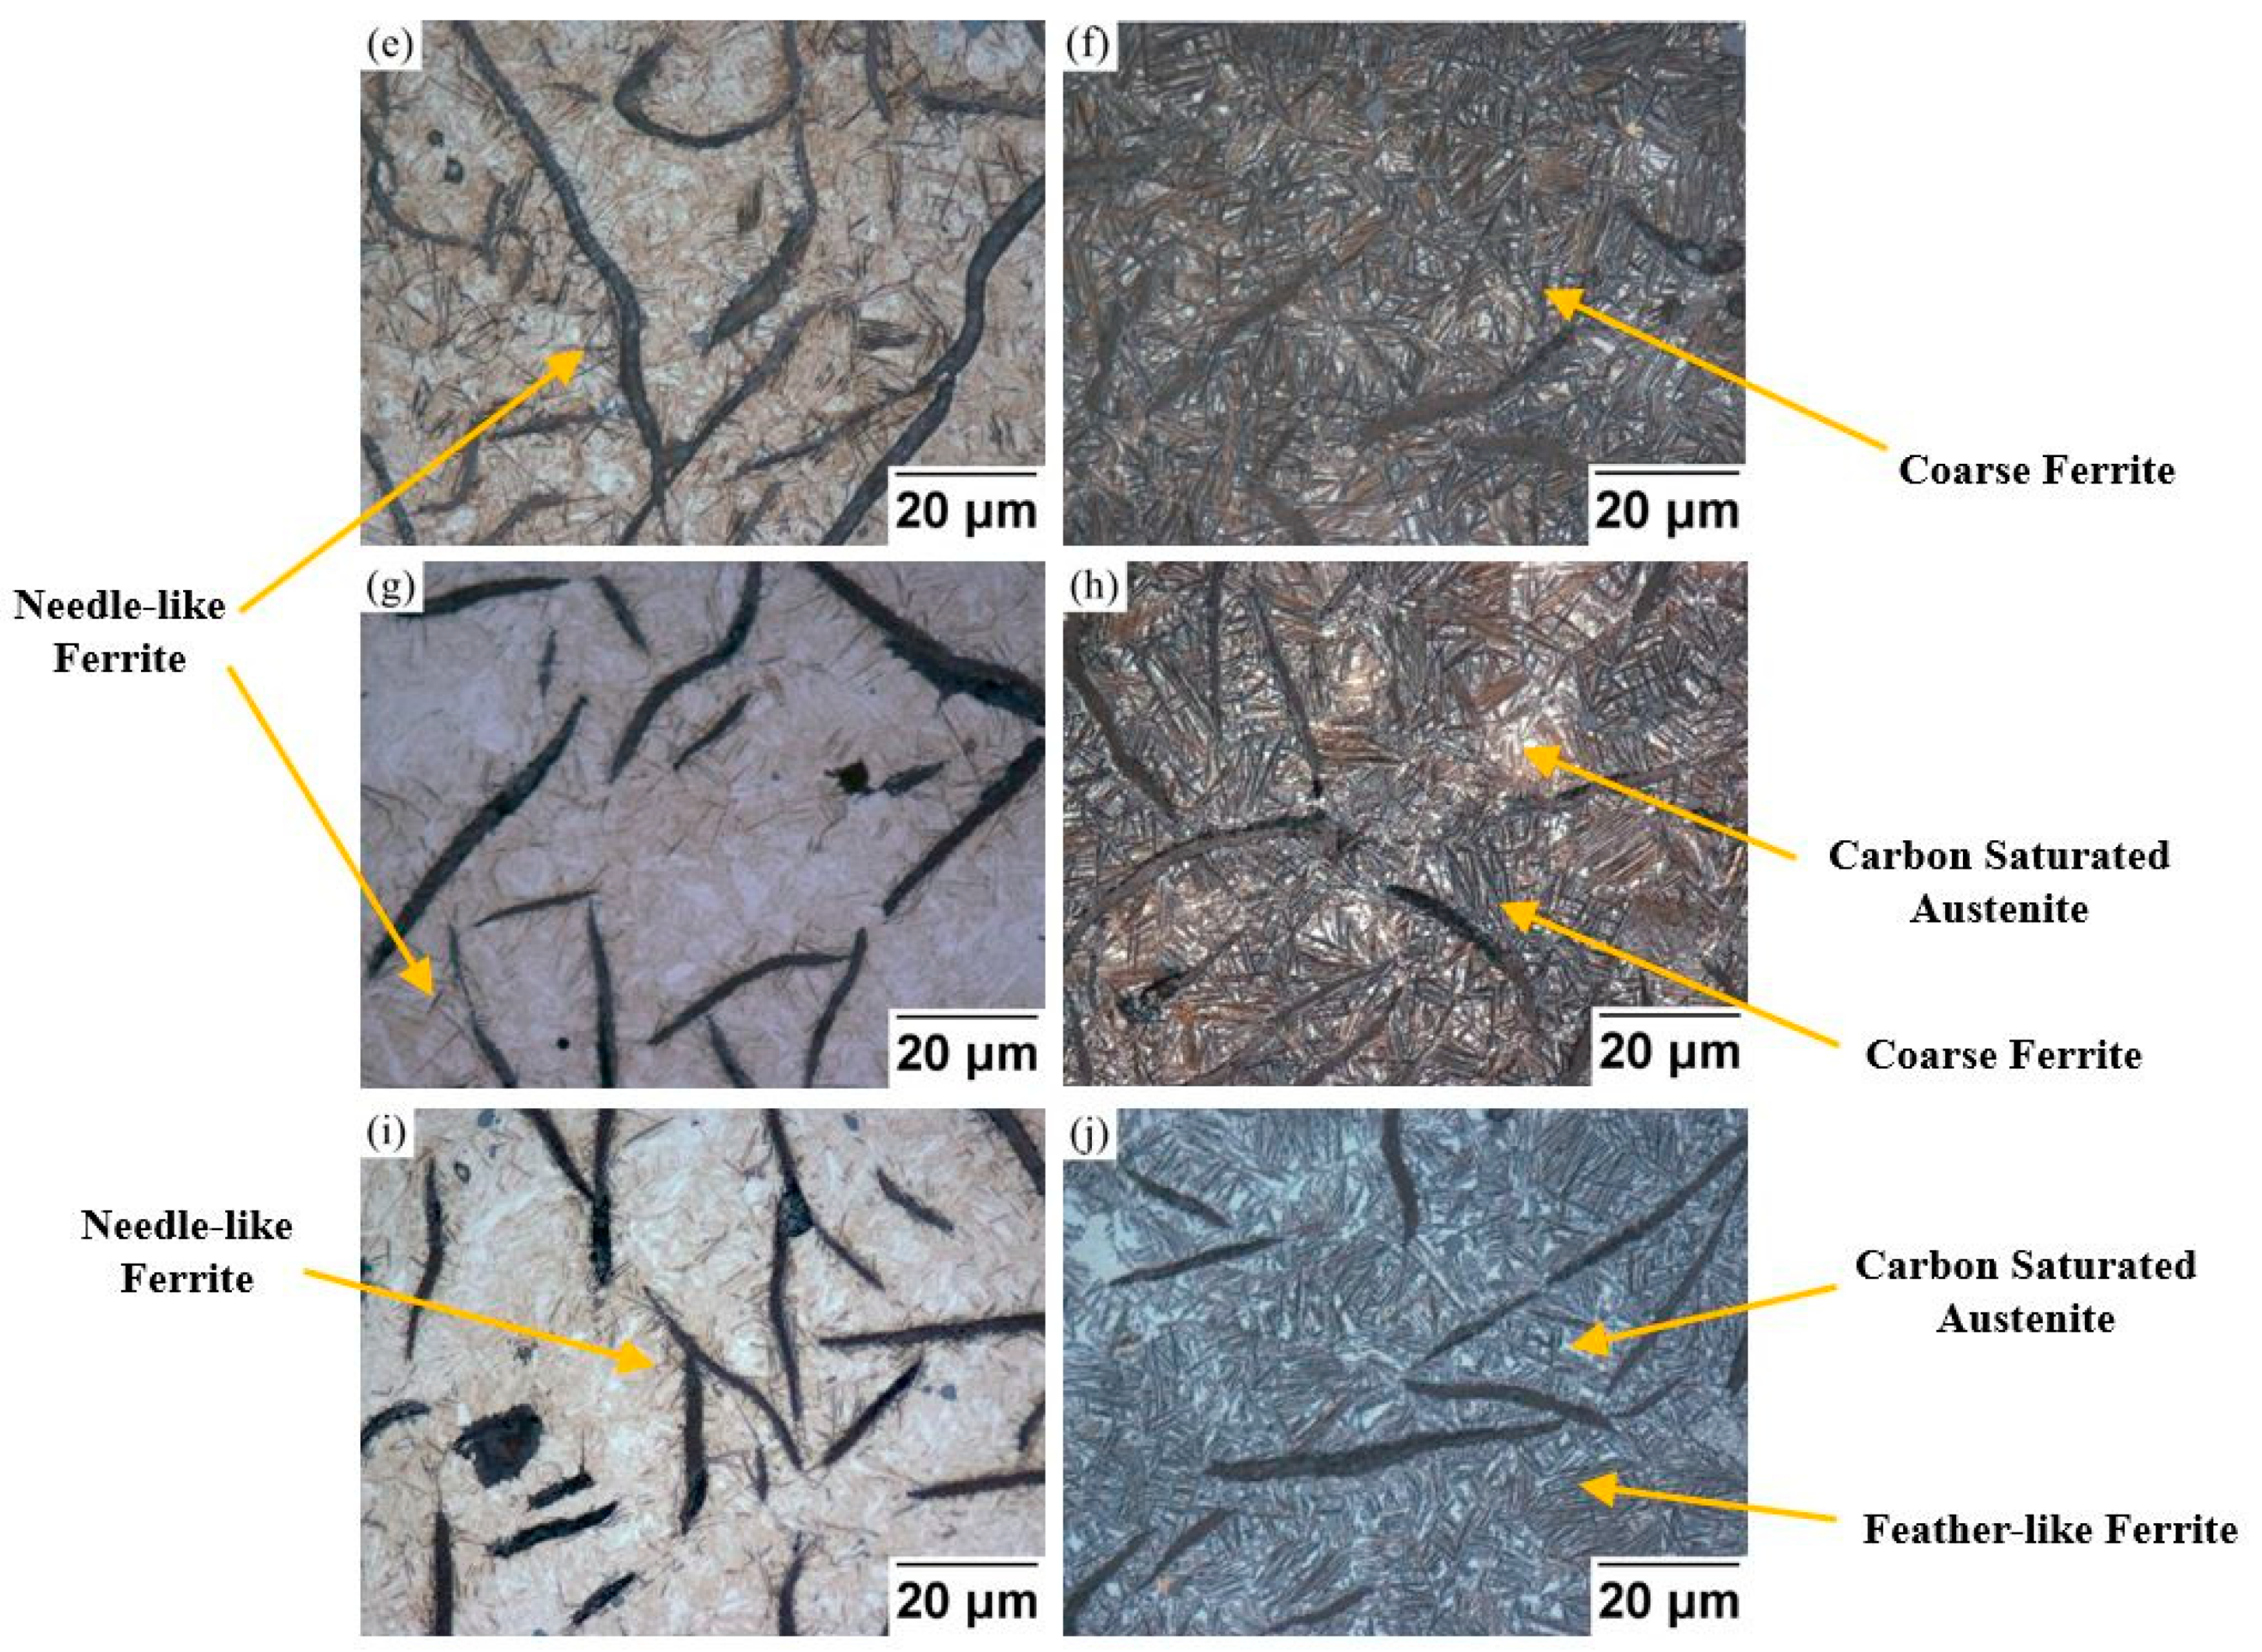
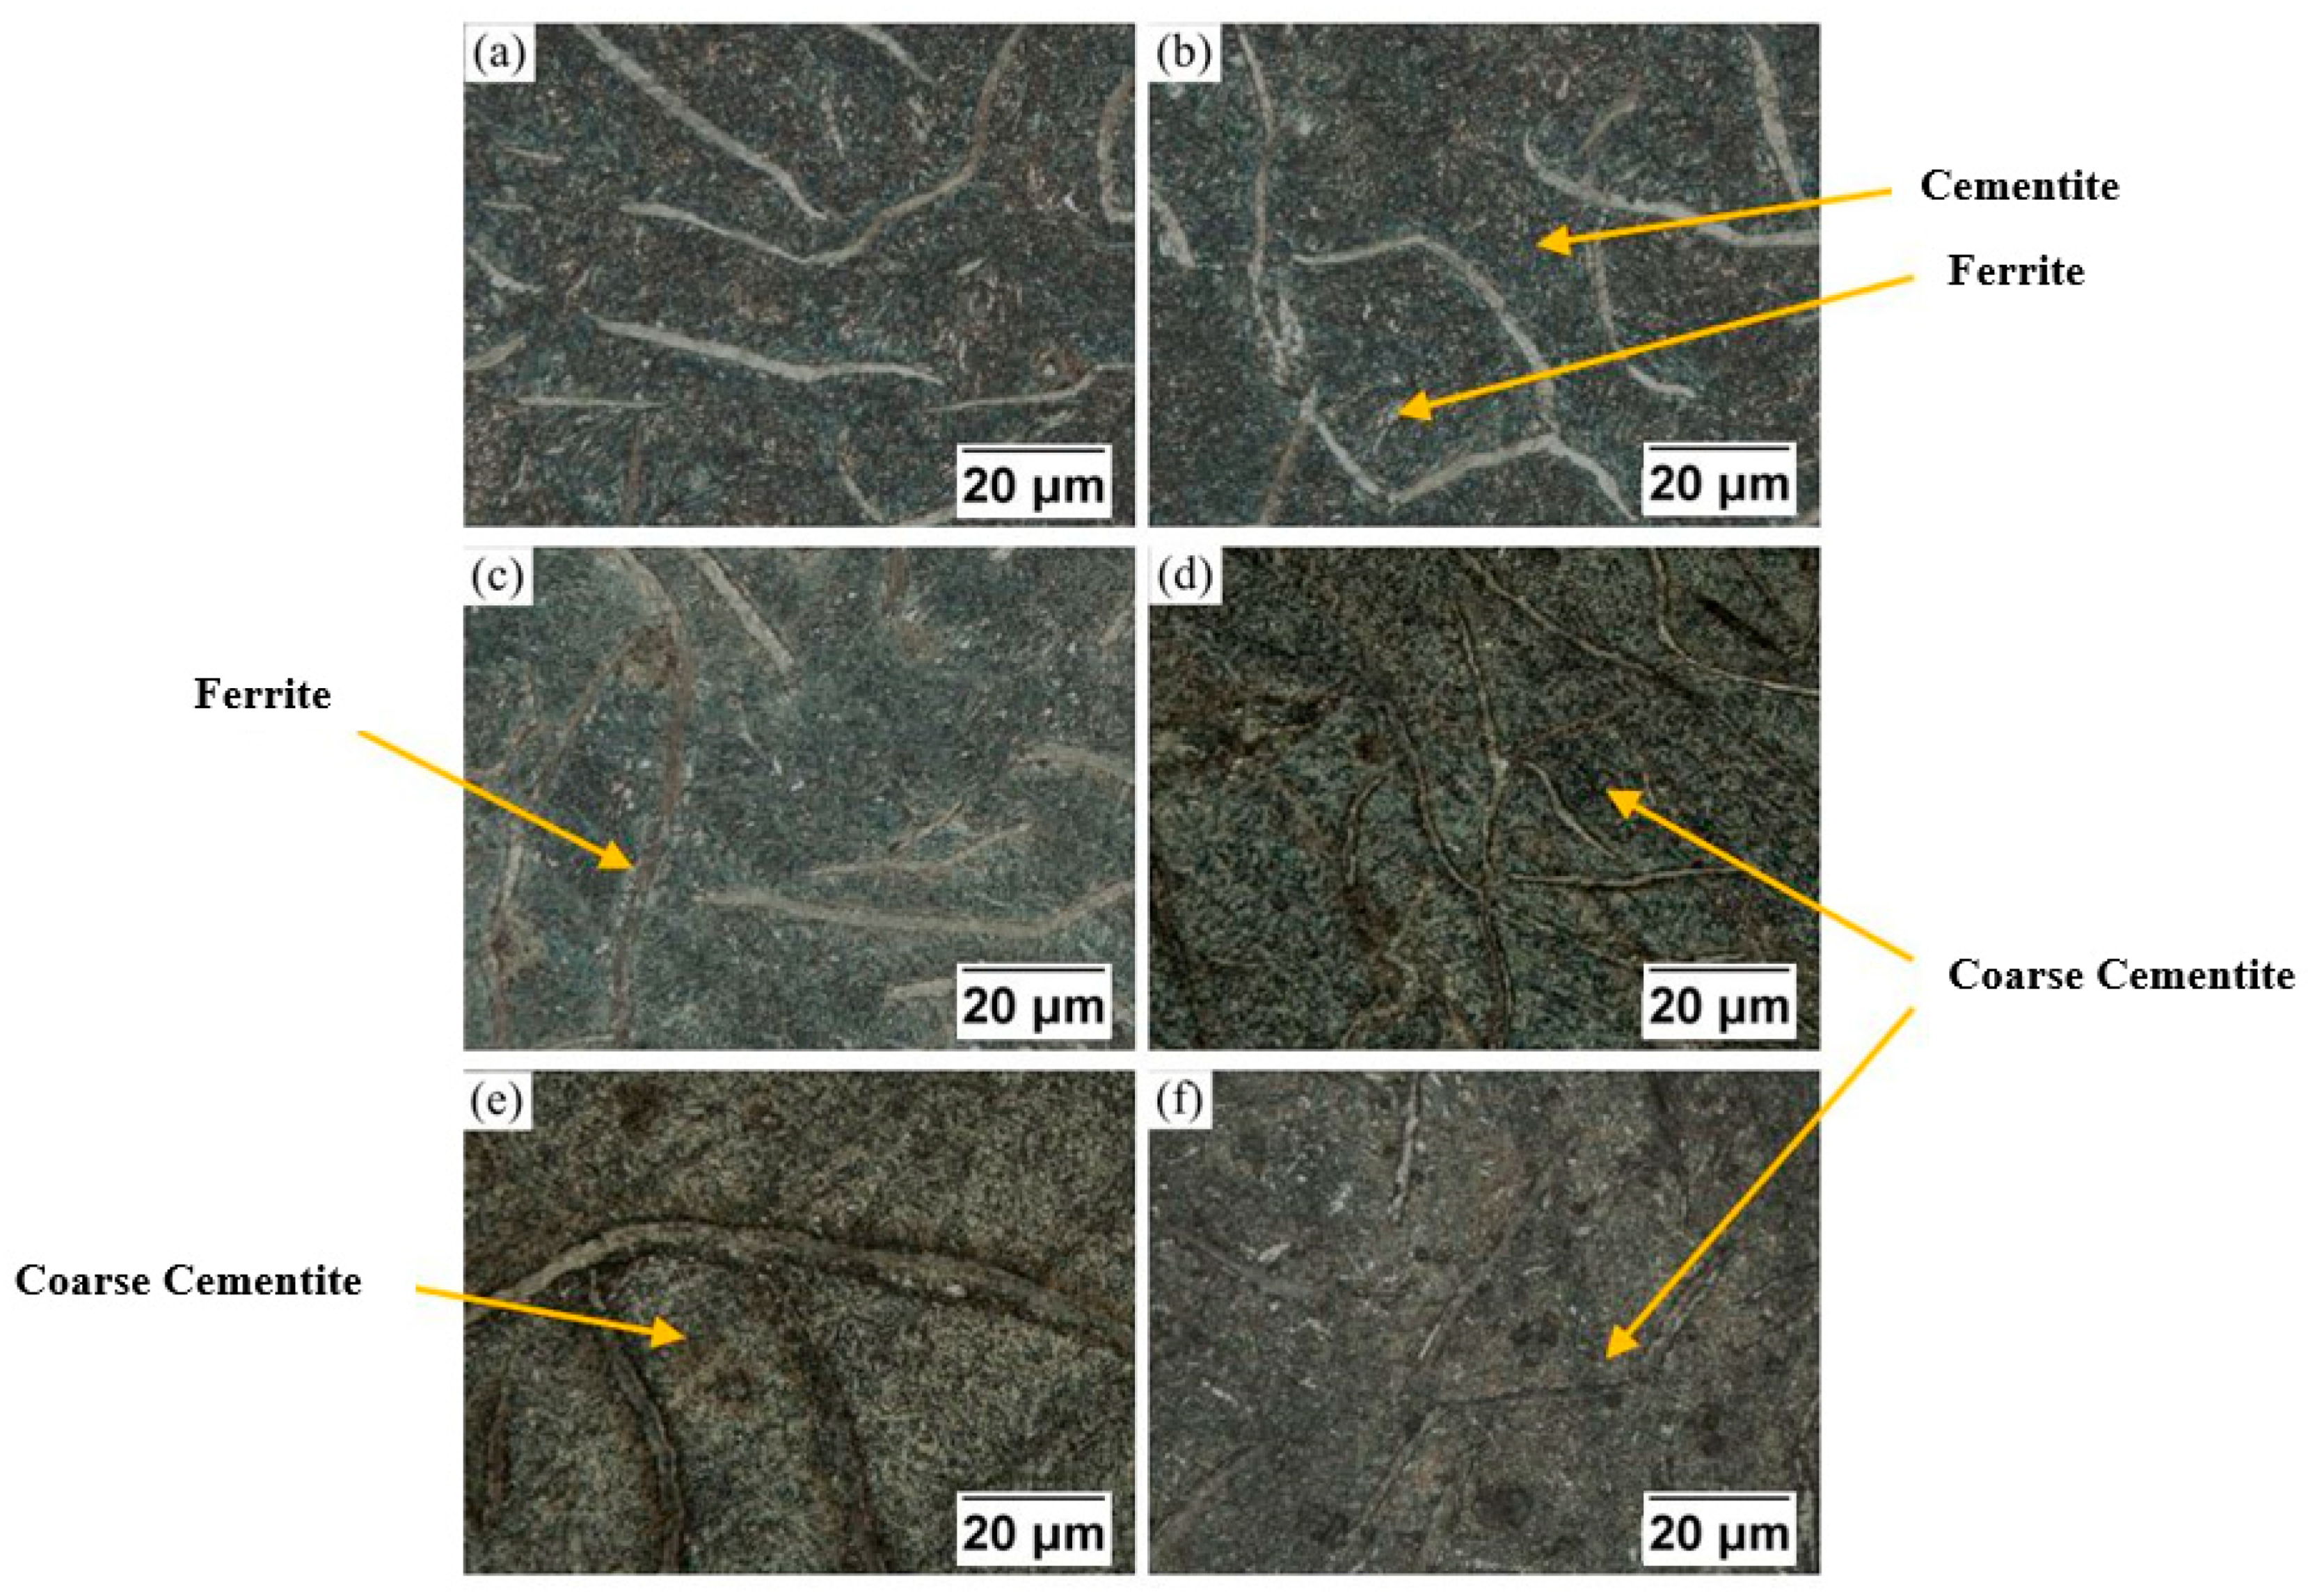
3.1. Metallurgical Evaluation of AGI and QTGI

As compared with the microstructure of as-cast GI in Figure 1, no changes could be found related to the characteristics of graphite flakes after receiving the austempering heat treatment. The original pearlitic structure was transformed into acicular ferrite and carbon saturated austenite, as shown in Figure 4. Figure 4a,c,e,g,i shows the microstructure of AGI samples at the beginning of the transformation reaction under each austempering temperature. It could be seen that the amount of acicular phases became more with decreasing austempering temperature because of the high degree of supercooling. It was also observed that most of the thin needle-like ferrite initiated around graphite flakes where the potential energy was high. After extending the holding duration, thin needle-like ferrite grew coarse since more carbon atoms diffused into adjacent austenitic areas, as is evident in Figure 4b,d,f,h,j. In addition, ferritic sheaves became thicker after increasing the austempering temperature, and feather-like ferrite was formed in the matrix at the austempering temperature of 371 °C with the holding time of 120 min. In Figure 4b,d,f,h,j, the light areas are carbon saturated austenite, which were stable at room temperature. In addition, some researchers reported that the carbon saturated austenite would be decomposed into the equivalent ferrite and carbide once the holding time was too long. The formation of ferrite and carbide would degrade the mechanical properties of austempered cast irons [21,22,23,24]. In the present research, no carbidic particles and islands could be found among the ferritic plates when the highest austempering temperature and longest holding duration were applied, which suggested that the carbon saturated austenite had not been decomposed into equilibrium phases.
In the microstructure analysis of QTGI samples, graphite flakes were retained, and as-quenched martensite and retained austenite were transformed into tempered martensite containing the cementitic and ferritic phases, as shown in Figure 5. When increasing the tempering temperatures with the same holding time, the cementite particles continuously developed. Finally, coarse cementite particles could be found within the ferritic matrix.

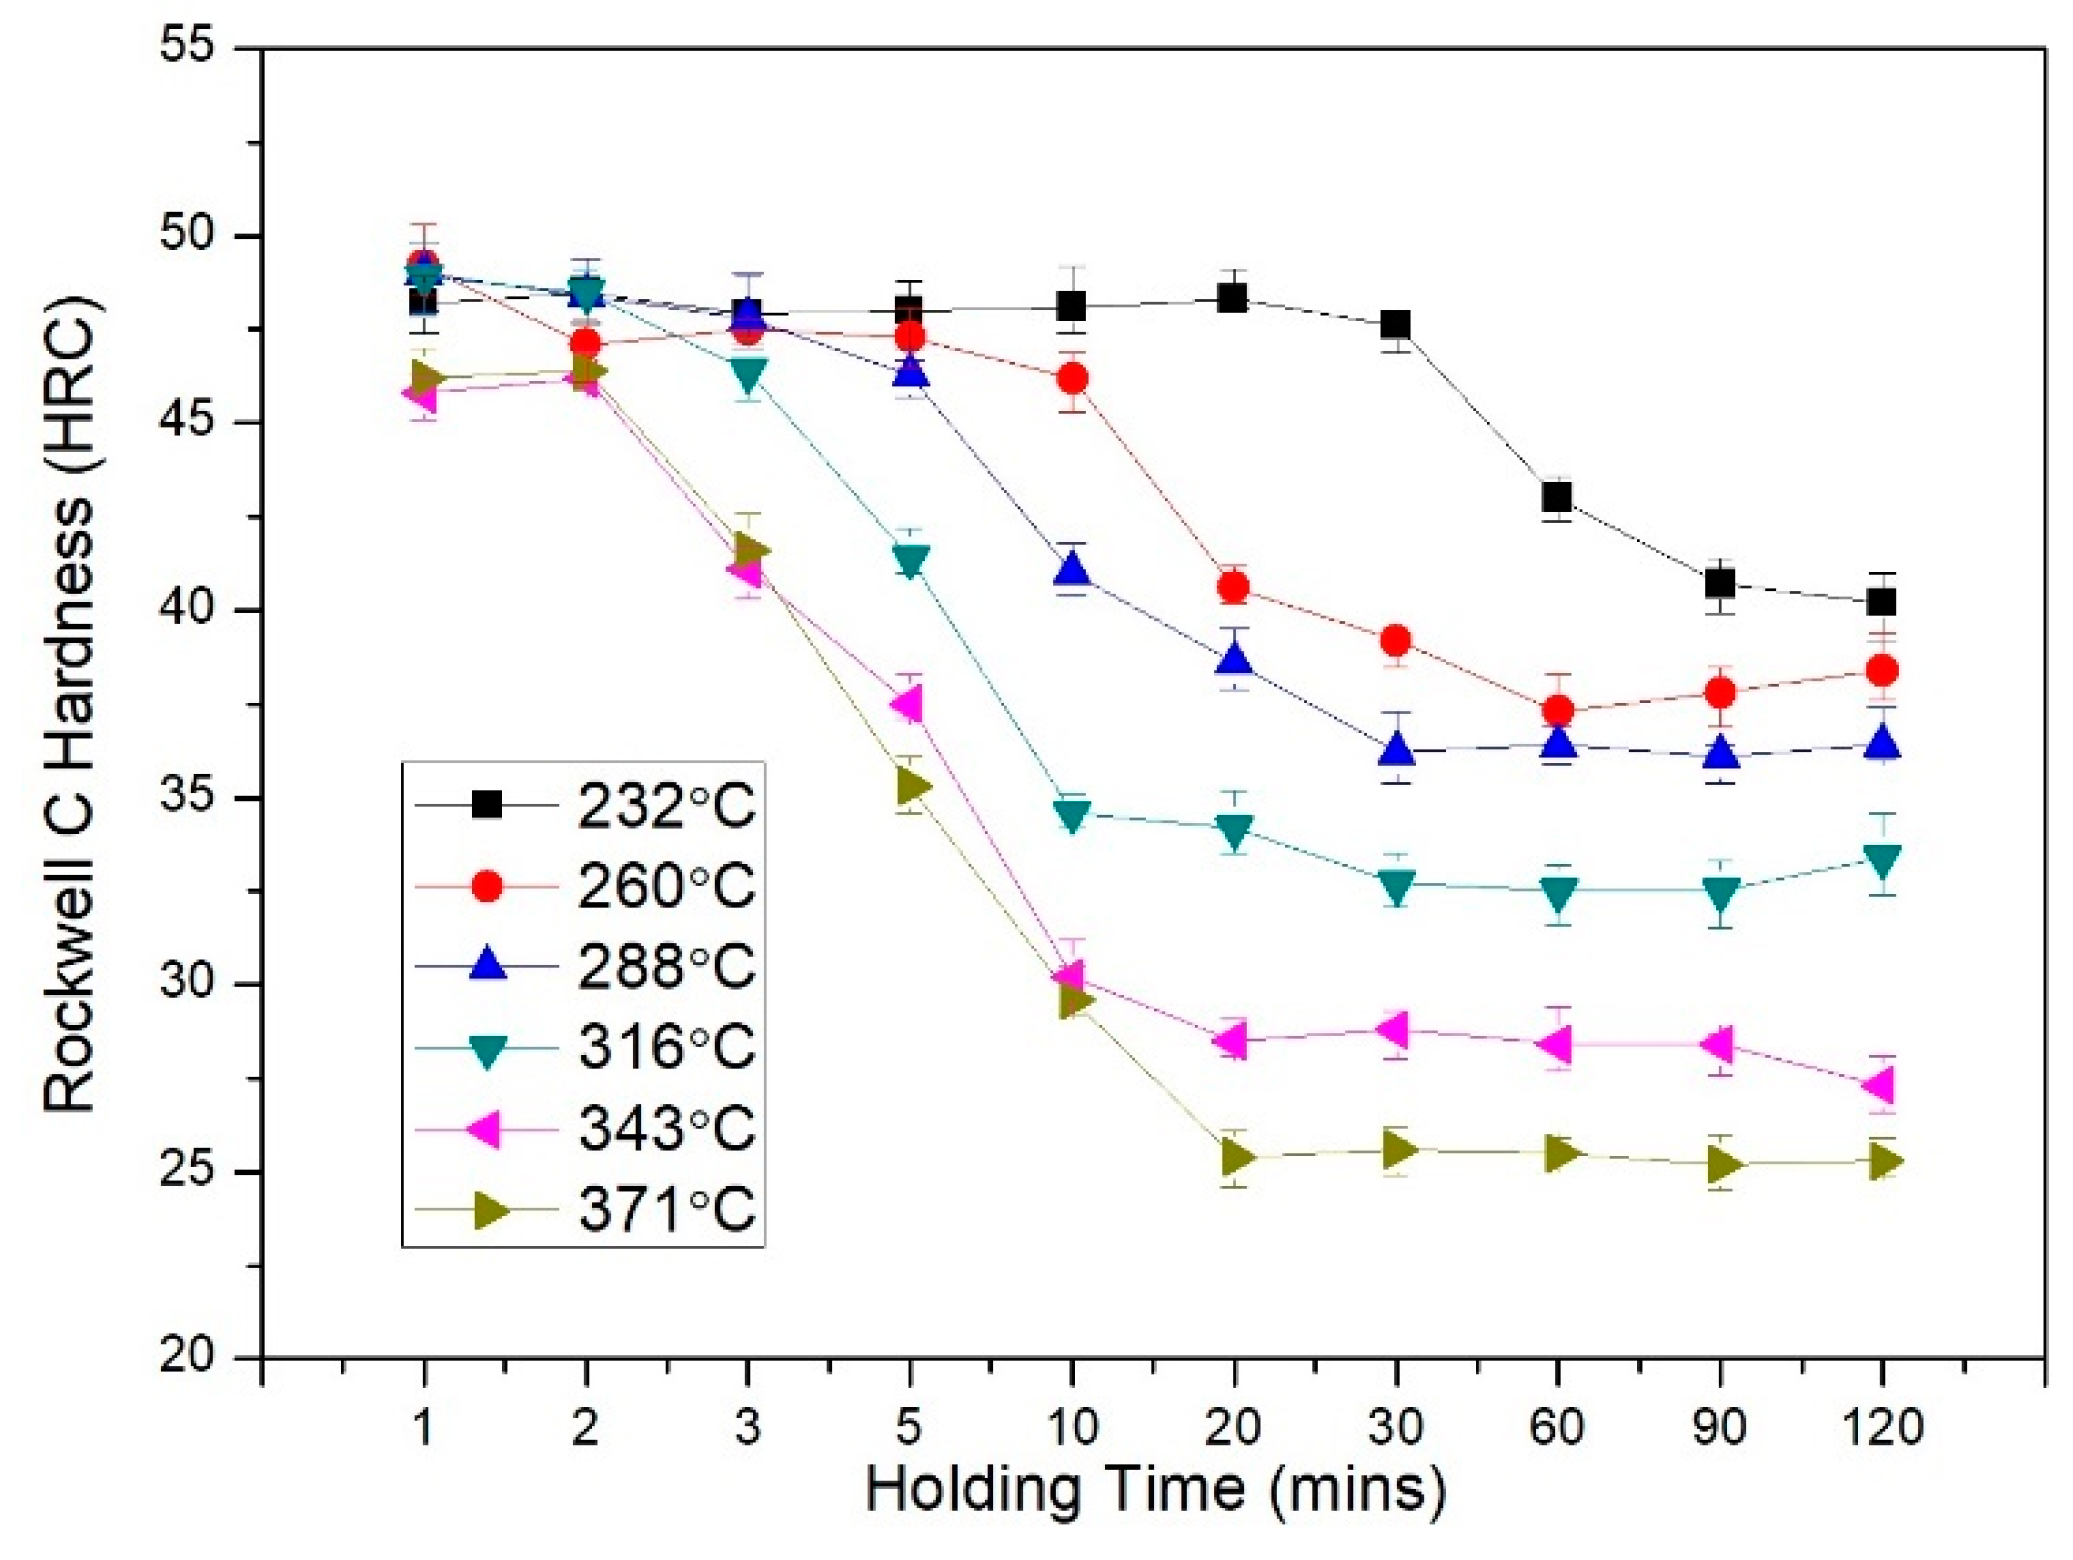
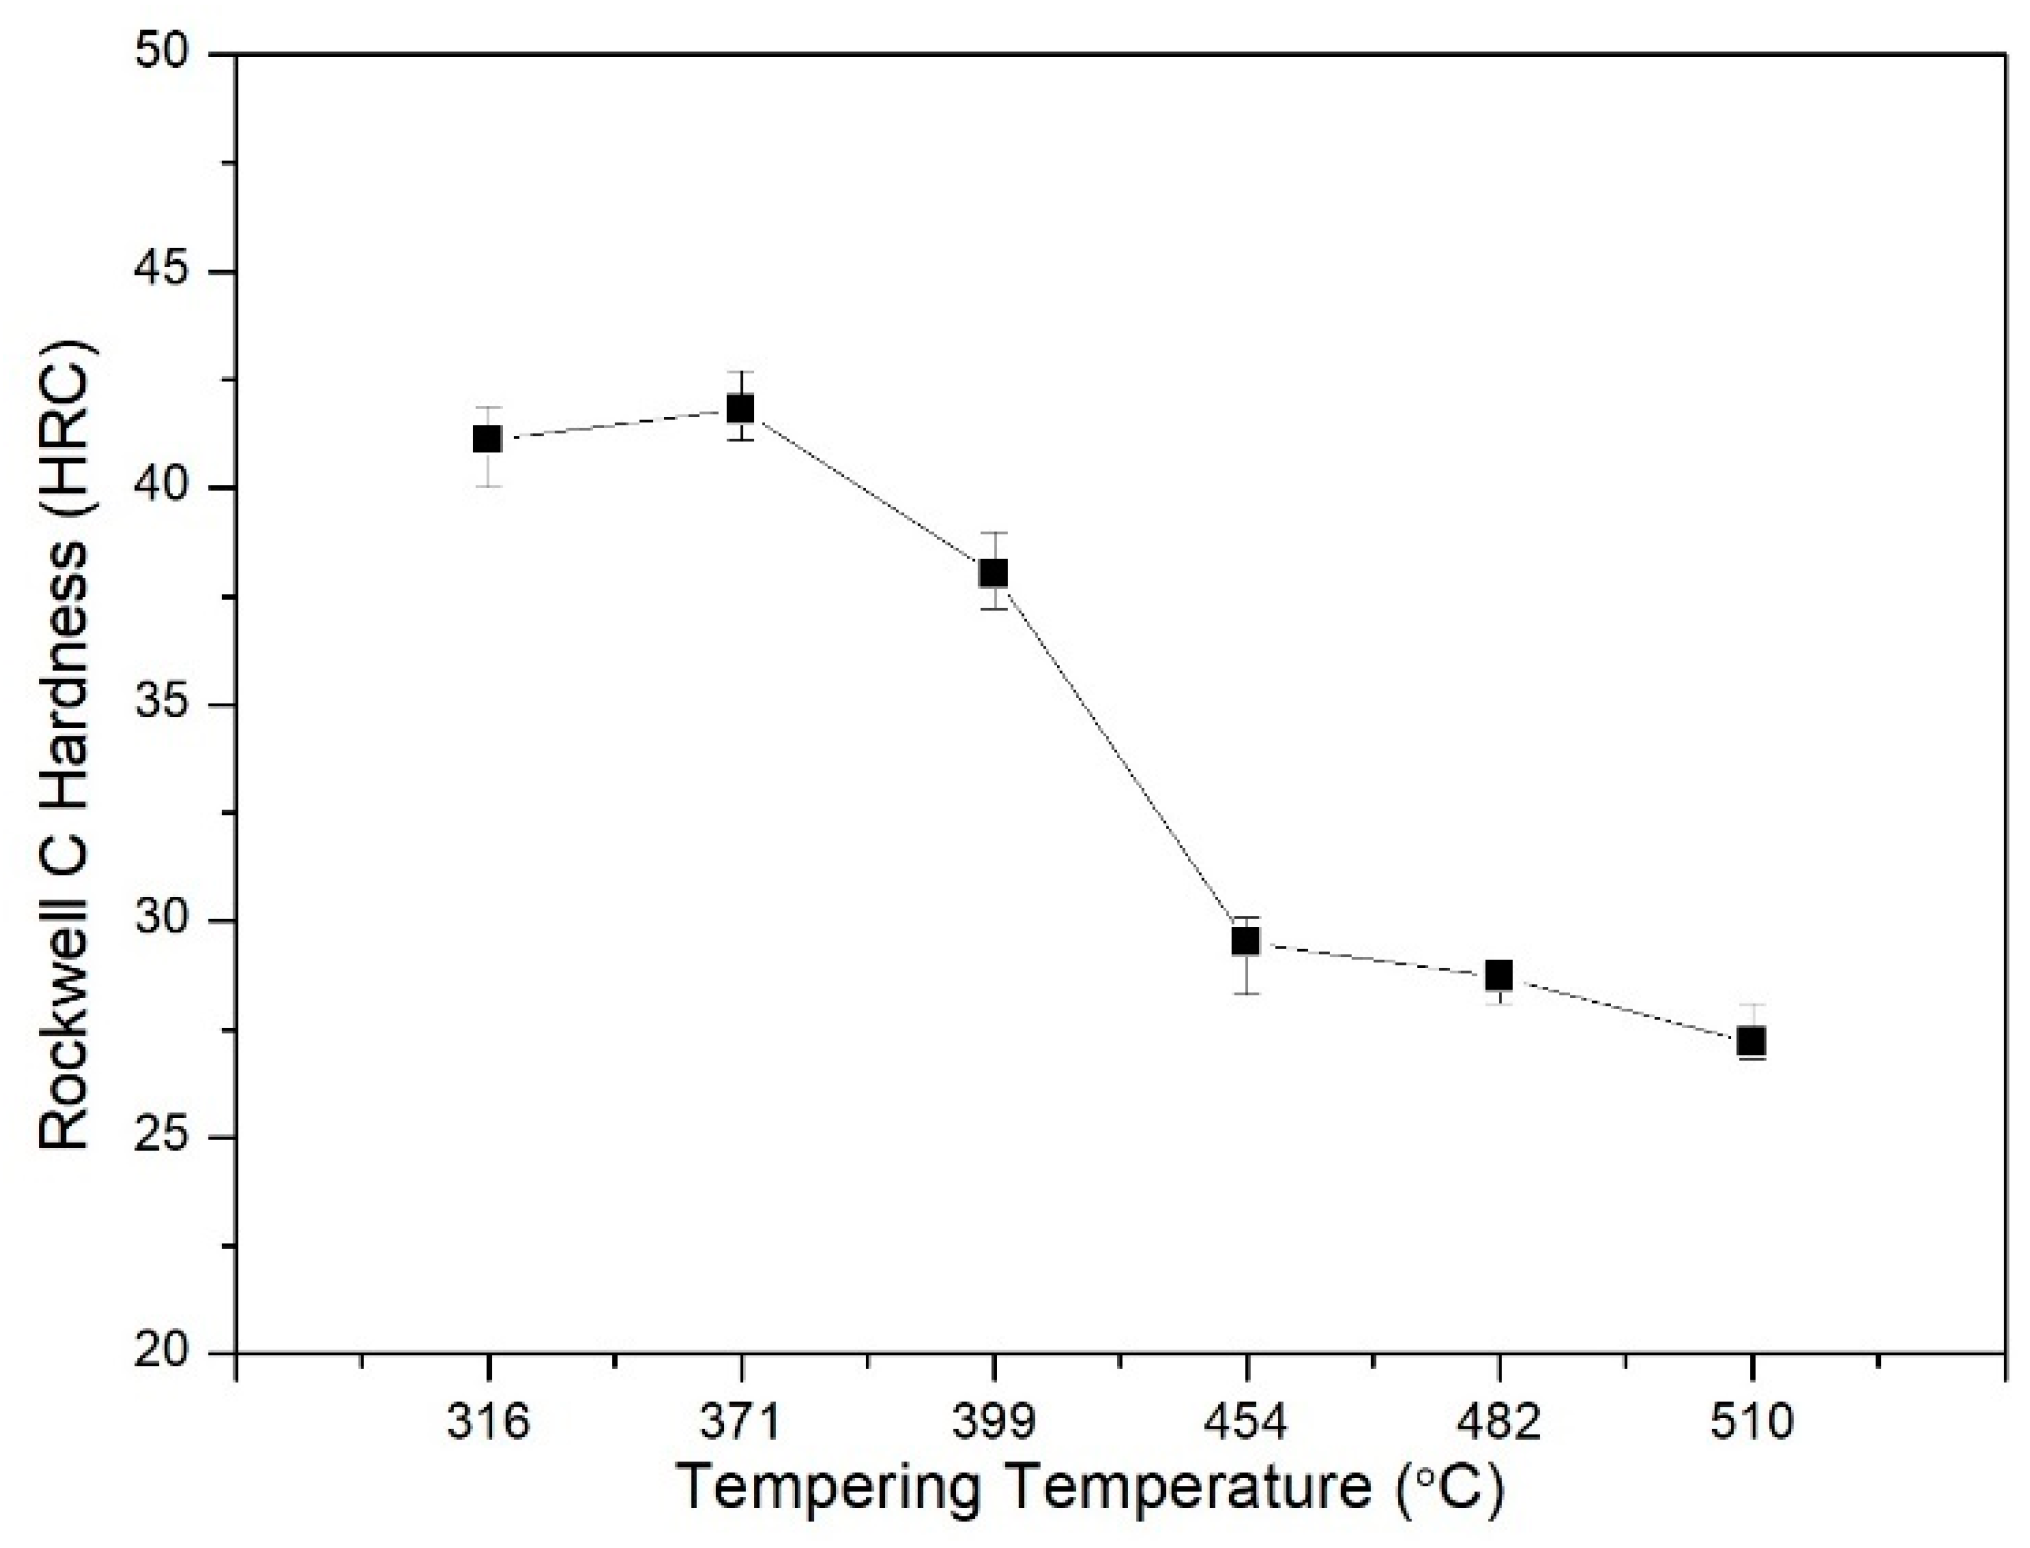
3.2. Hardness Measurement

The hardness measurements of AGI and QTGI samples are plotted in Figure 6 and Figure 7. At the same austempering temperature, the hardness of AGI samples decreased first when extending the holding time and became almost constant after a critical point in time. When using the long holding time, more unstable austenite was transformed into acicular ferrite and carbon saturated austenite rather than martensite, which would result in the decrease in hardness. The hardness of AGI under each austempering temperature becoming gradually flat indicated that most of the acicular ferrite and carbon saturated austenite were still maintained in the matrix. Otherwise, the hardness would vary once the carbon saturated austenite was decomposed [24,25]. This suggested that the longest holding time utilized in the present work was within the “processing window”, which was defined as the time interval between where 3% martensite existed and where 10% stable austenite was decomposed [26]. The hardness measurements also demonstrated that there were no carbides found in the matrix, as mentioned in Section 3.1. For the same holding time, AGI samples became softer when increasing the austempering temperature. This is because the high carbon diffusion rate accelerated the transformation of acicular ferrite and carbon saturated austenite. For QTGI samples, it could be seen that the hardness decreased with increasing tempering temperature. The slight increase in hardness under tempering temperatures of 371 °C was probably caused by the effects of tempered brittleness [27,28,29]. Increasing the tempering temperature would promote the decomposition of martensite into dispersive cementite particles and ferrite, which facilitated the softening rate.

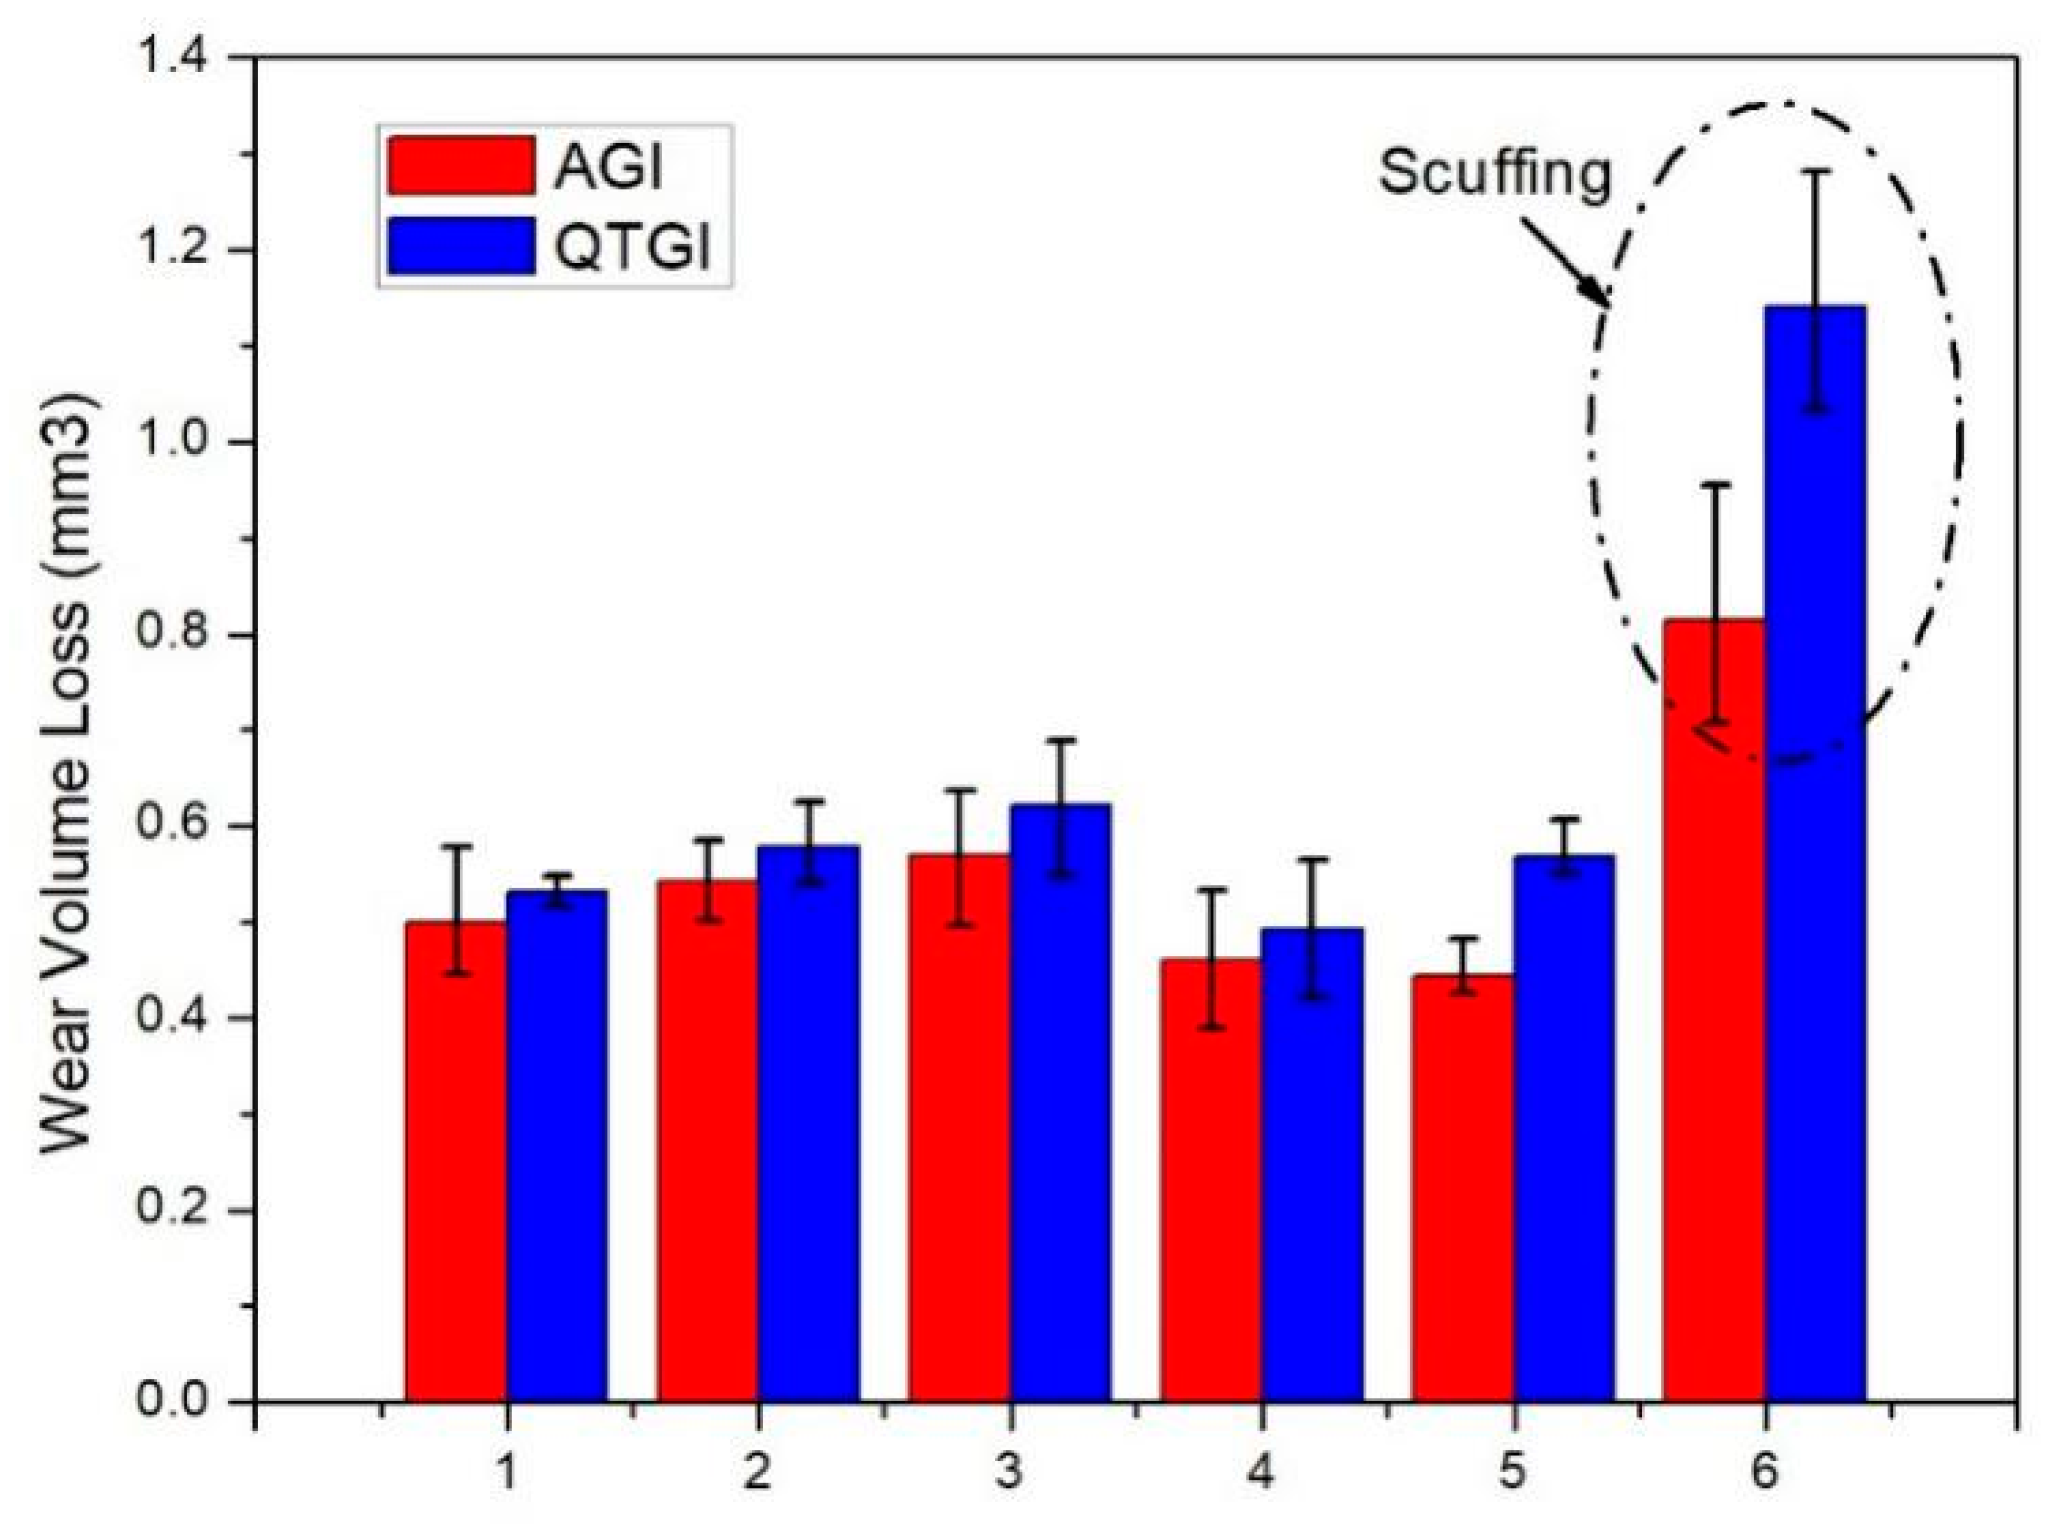
3.3. Ball-on-Disk Rotational Wear Tests

In the rotational ball-on-disk sliding wear tests, fully transformed AGI samples with a 120 min holding time at each austempering temperature were utilized and compared with corresponding QTGI samples under equivalent hardness, as shown in Table 3 and Figure 8. The upper error bars represent the maximum wear loss, and lower error bars represent the minimum wear loss of AGI and QTGI samples under each heat treatment condition. In Groups 1, 2, and 3, AGI samples had higher wear volume loss when increasing the austempering temperature since the softening effect dominated the wear resistance. A similar behavior was also found on QTGI samples even though the hardness was improved slightly in Group 2 since it has been reported that the tempered brittleness would significantly reduce the toughness and promote wear loss [27,30]. In Groups 4 and 5, higher austempering temperature could enhance the carbon content and austenitic percentage. More austenite with a high percentage of carbon would provide superior fracture toughness to inhibit material removal, which could compensate for the reduction in hardness. Similar results were reported by Yang, J et al. [31] in the study of tensile toughness and fracture toughness in dual step austempered ductile iron with high austenitic content and carbon content. The QTGI samples in Groups 4 and 5 also showed lower wear volume loss, which could be associated with the presence of a significant amount of dispersive coarse cementite particles. Dong, C et al. [32] found that coarse granular cementite phases could have a large binding force, which could slow down the cleavage separations inside the matrix of tempered steel. In Group 6, scuffing with high vibration and noise occurred on both AGI and QTGI samples because of the low hardness. Overall, AGI samples had slightly lower wear volume loss than QTGI samples under similar hardness, approximately 6%, 6.2%, 8.4%, and 6.5% while using the austempering temperatures of 232 °C, 260 °C, 288 °C, and 316 °C and distinctly better wear resistance while using the austempering temperatures of 343 °C and 371 °C. The best result with a wear loss of around 0.44 mm3 was obtained using AGI samples with the austempering temperature of 343 °C, which was 21.7% lower than that of QTGI samples. In all wear tests, the upper ceramic balls were much harder than GI disks and had no detectable wear scars.

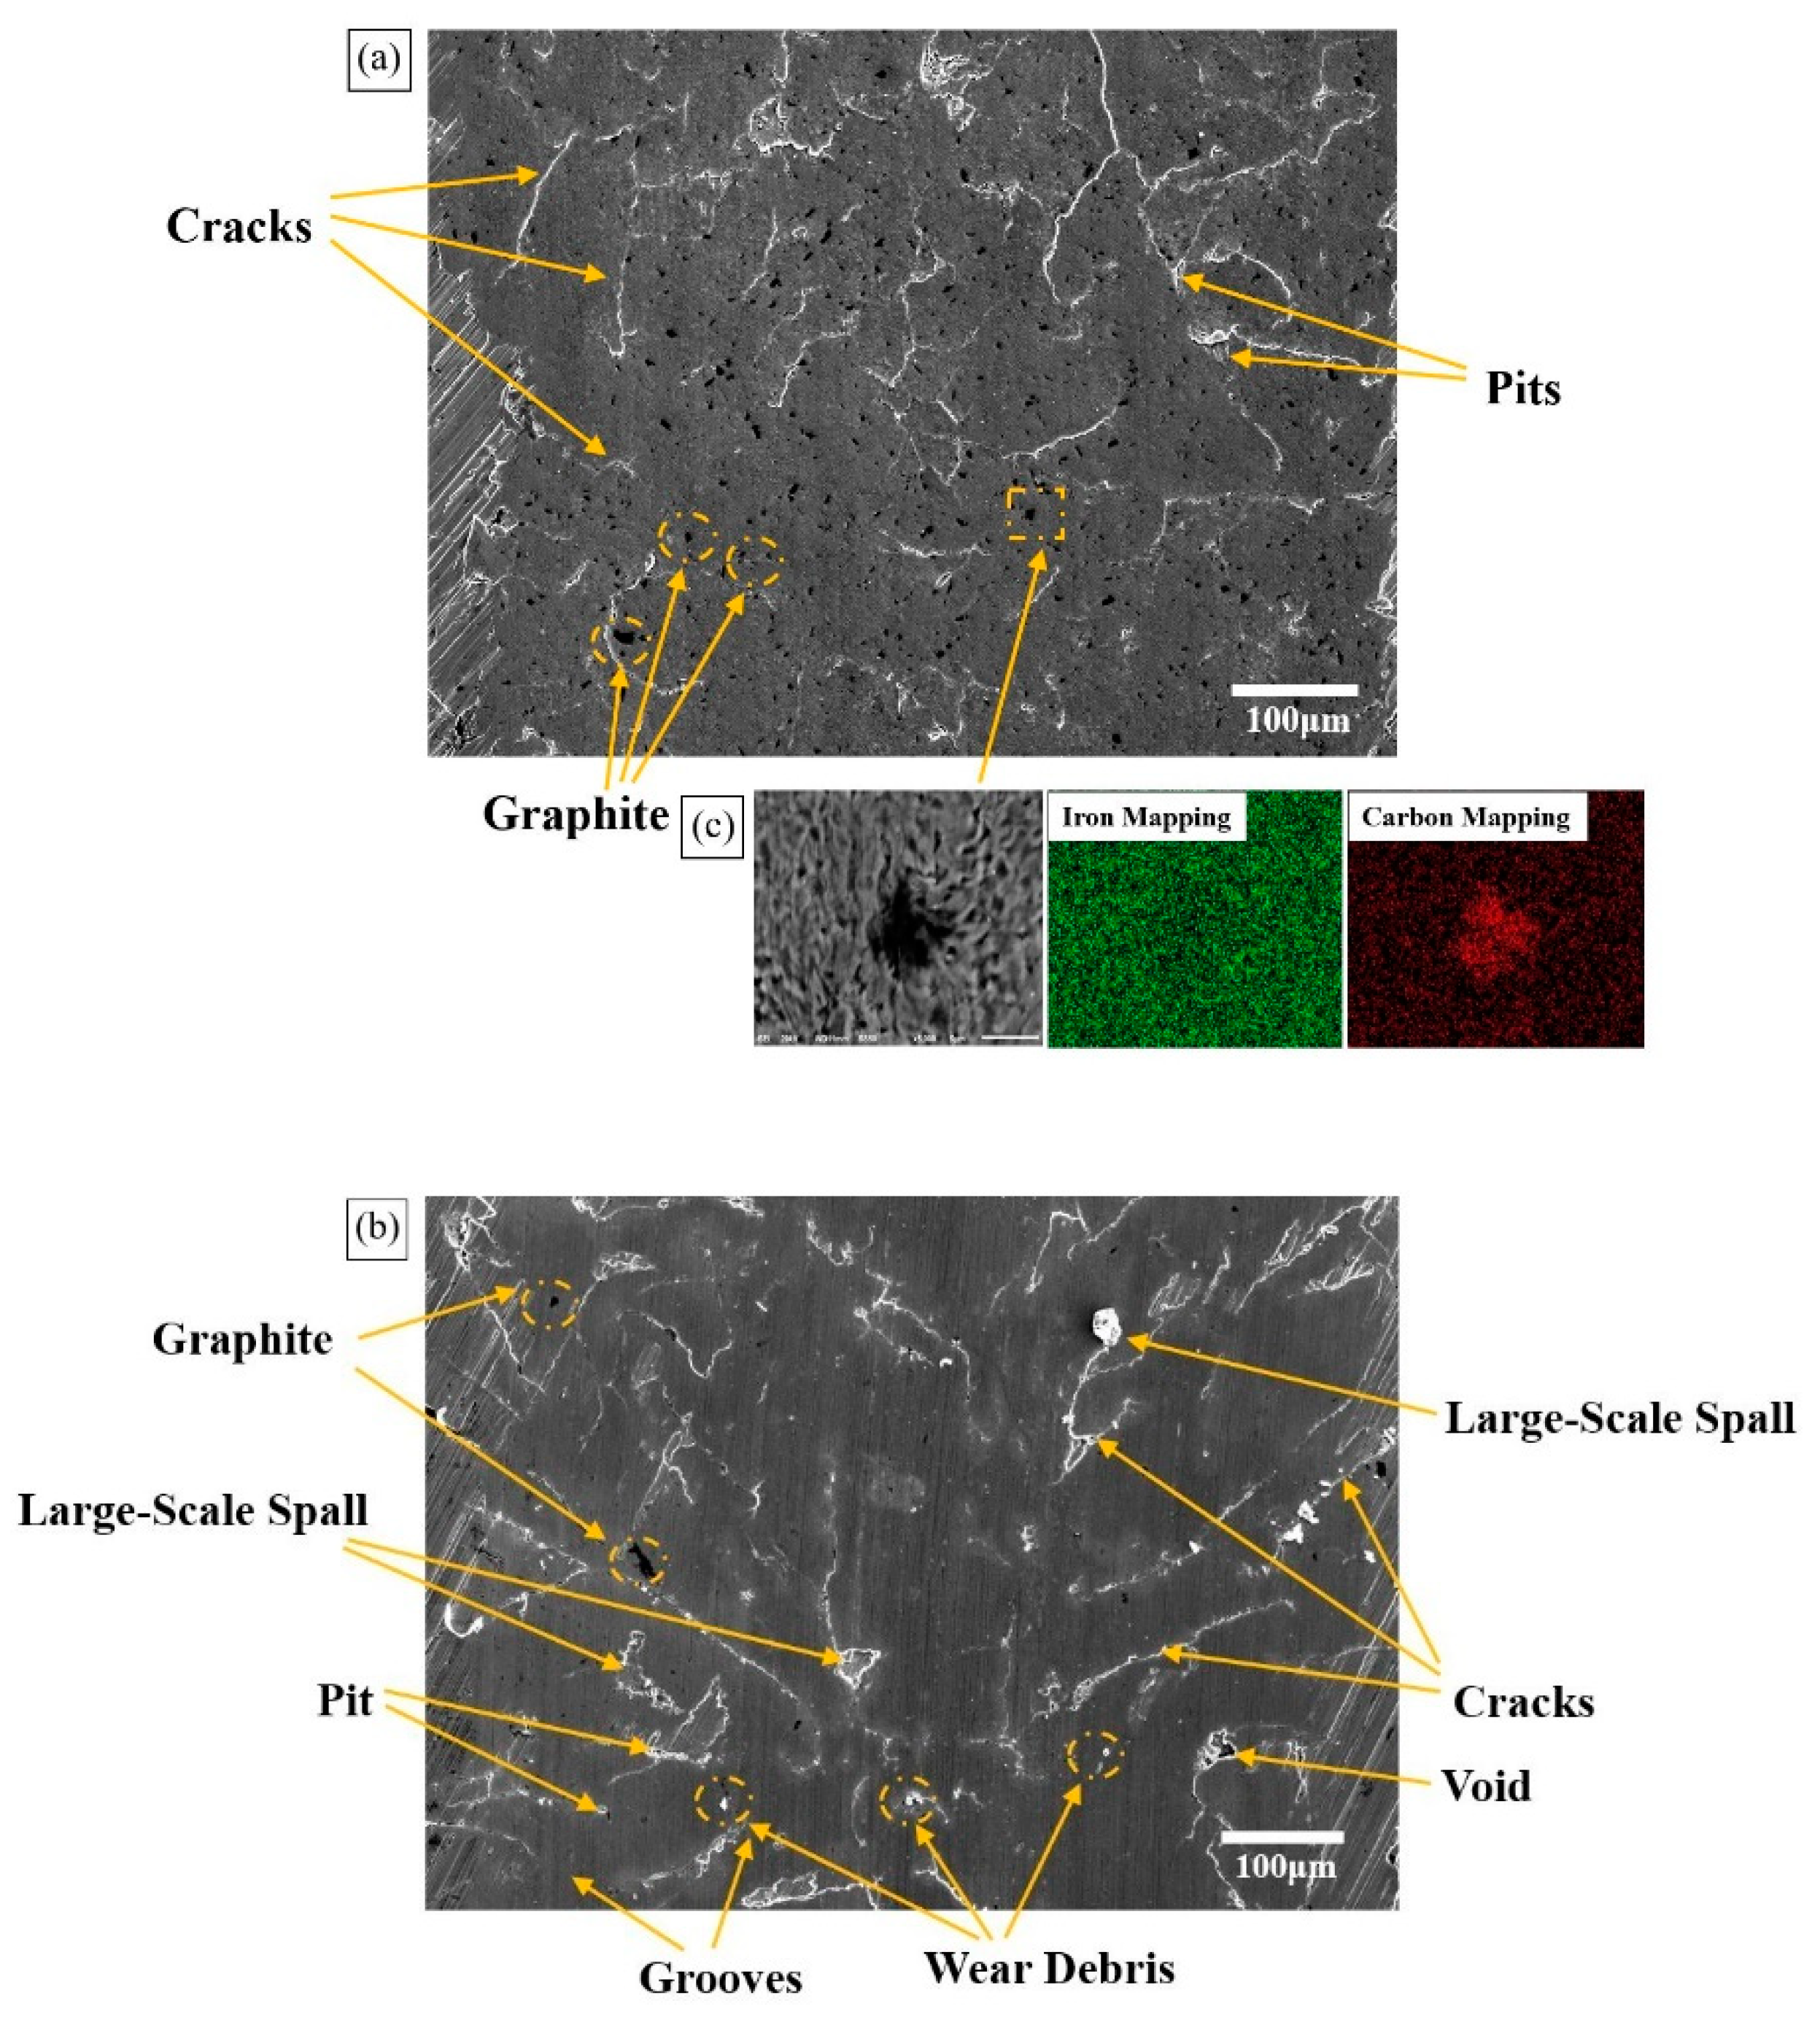
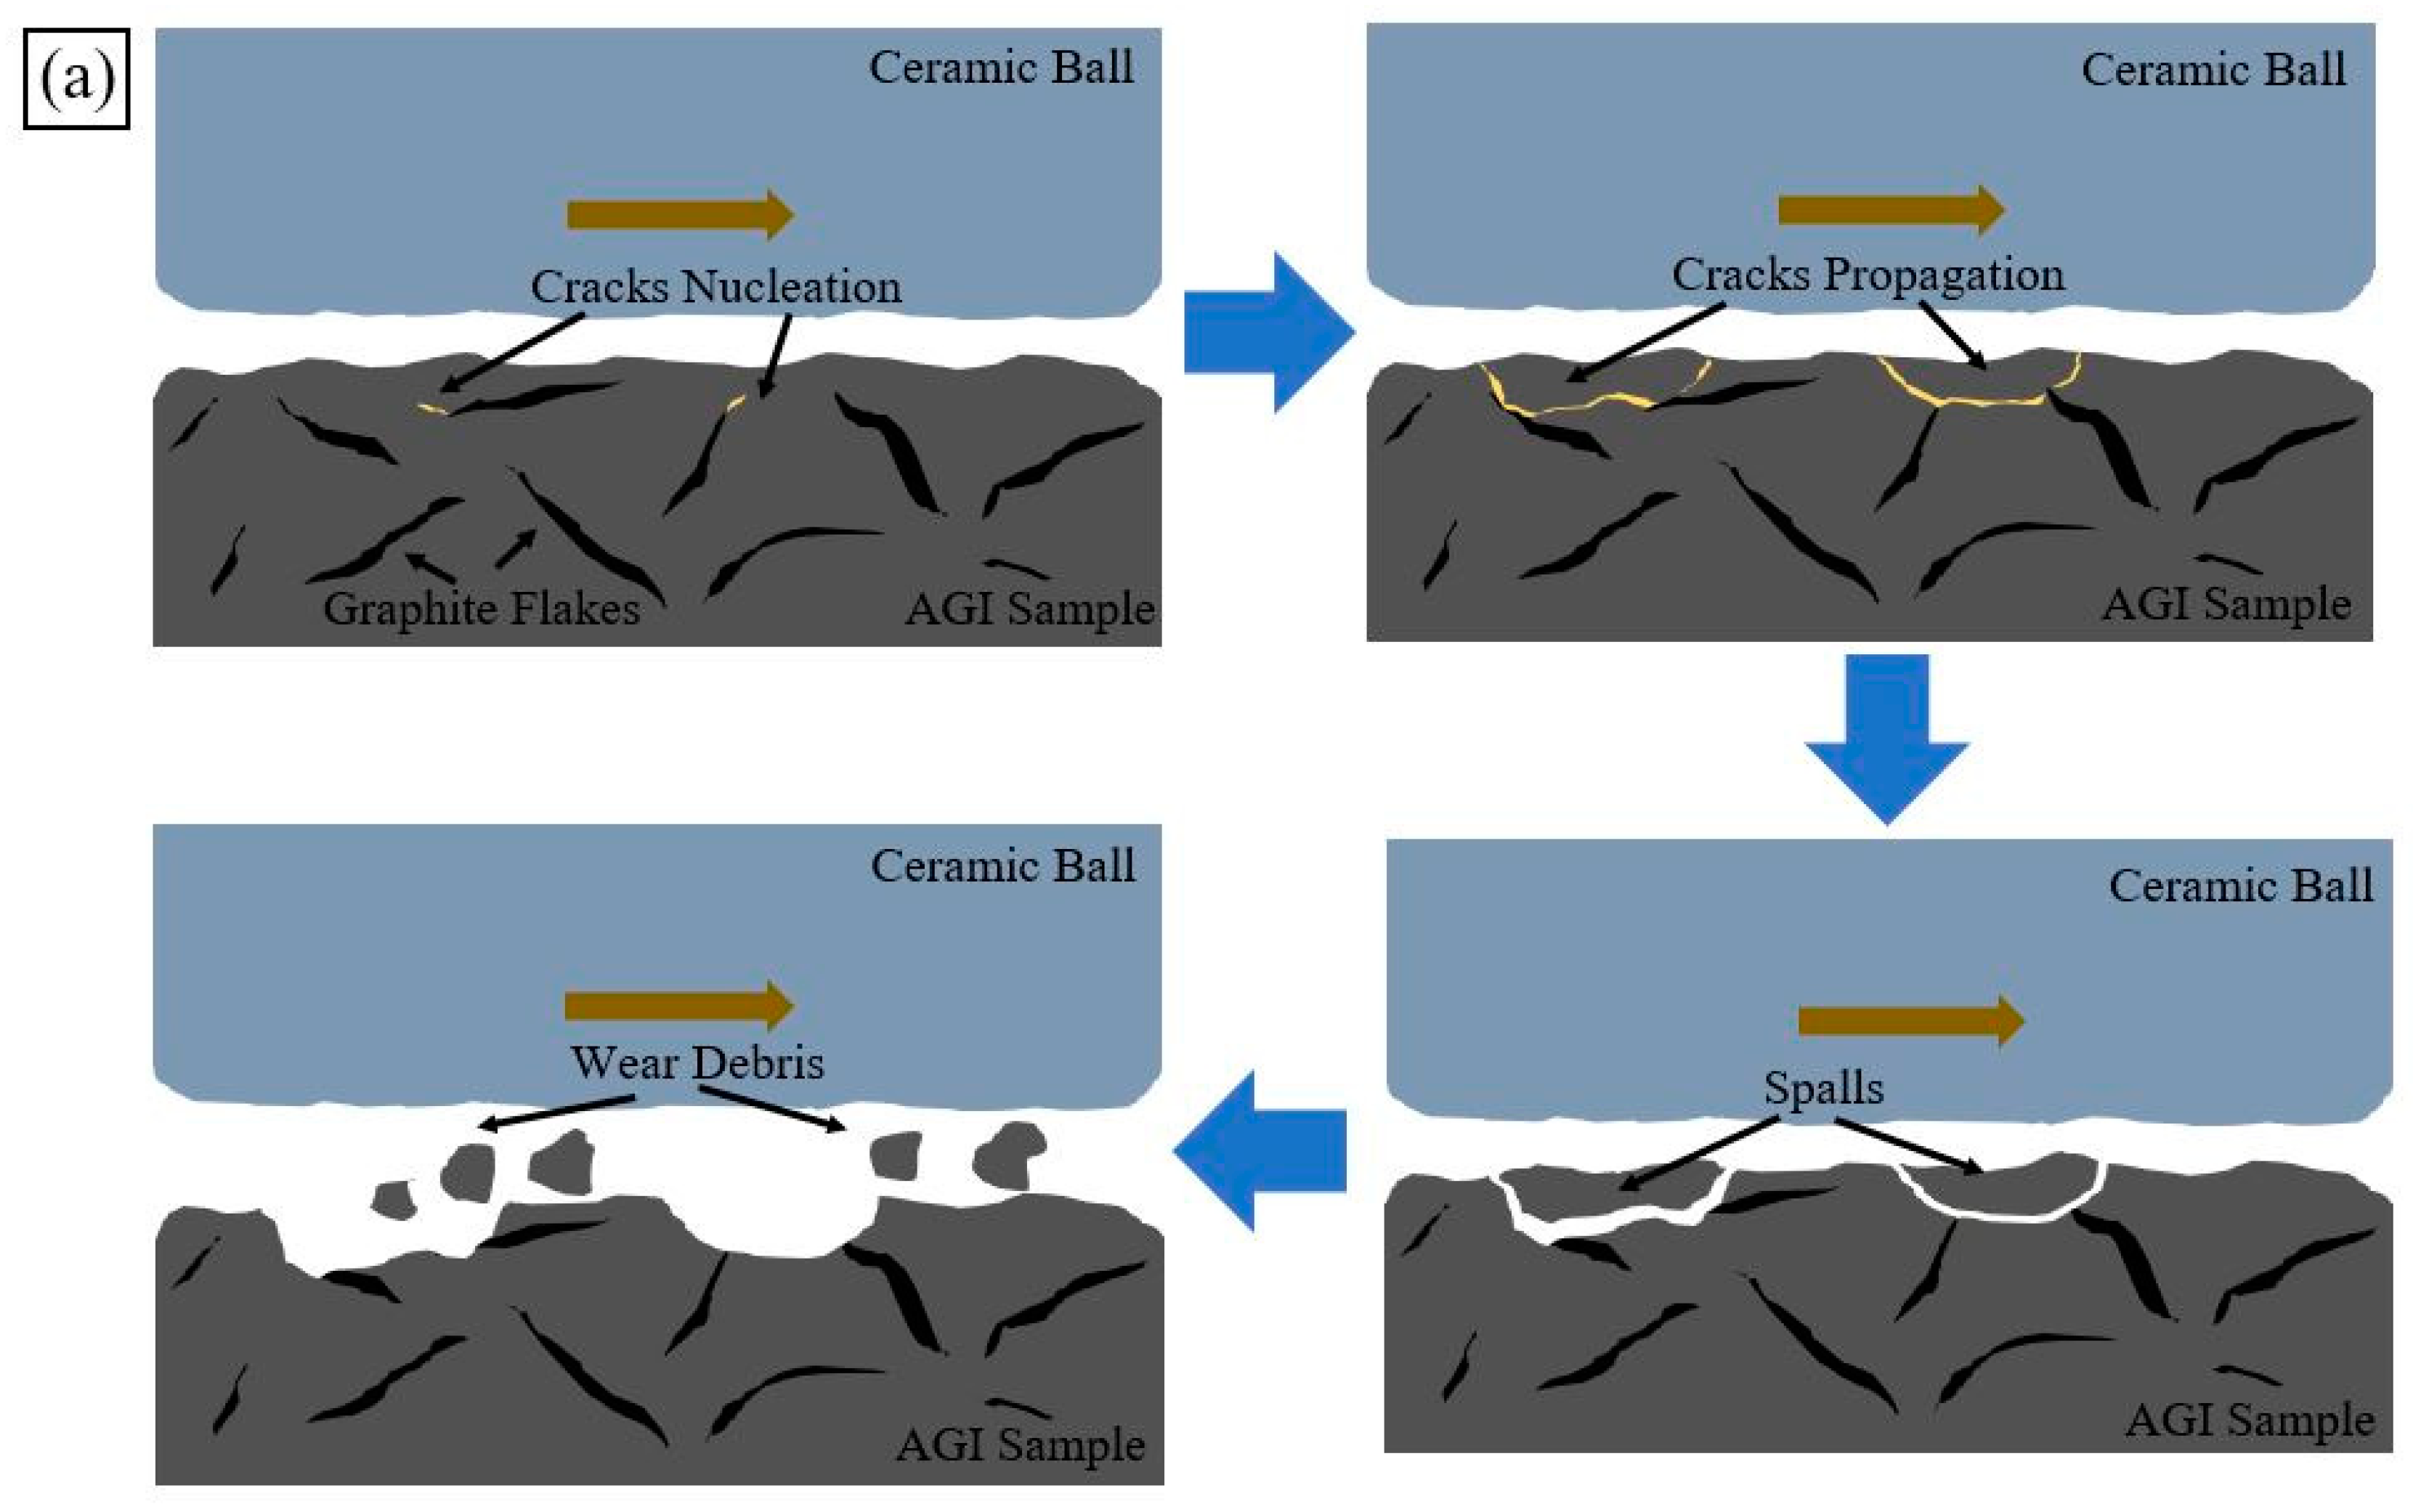
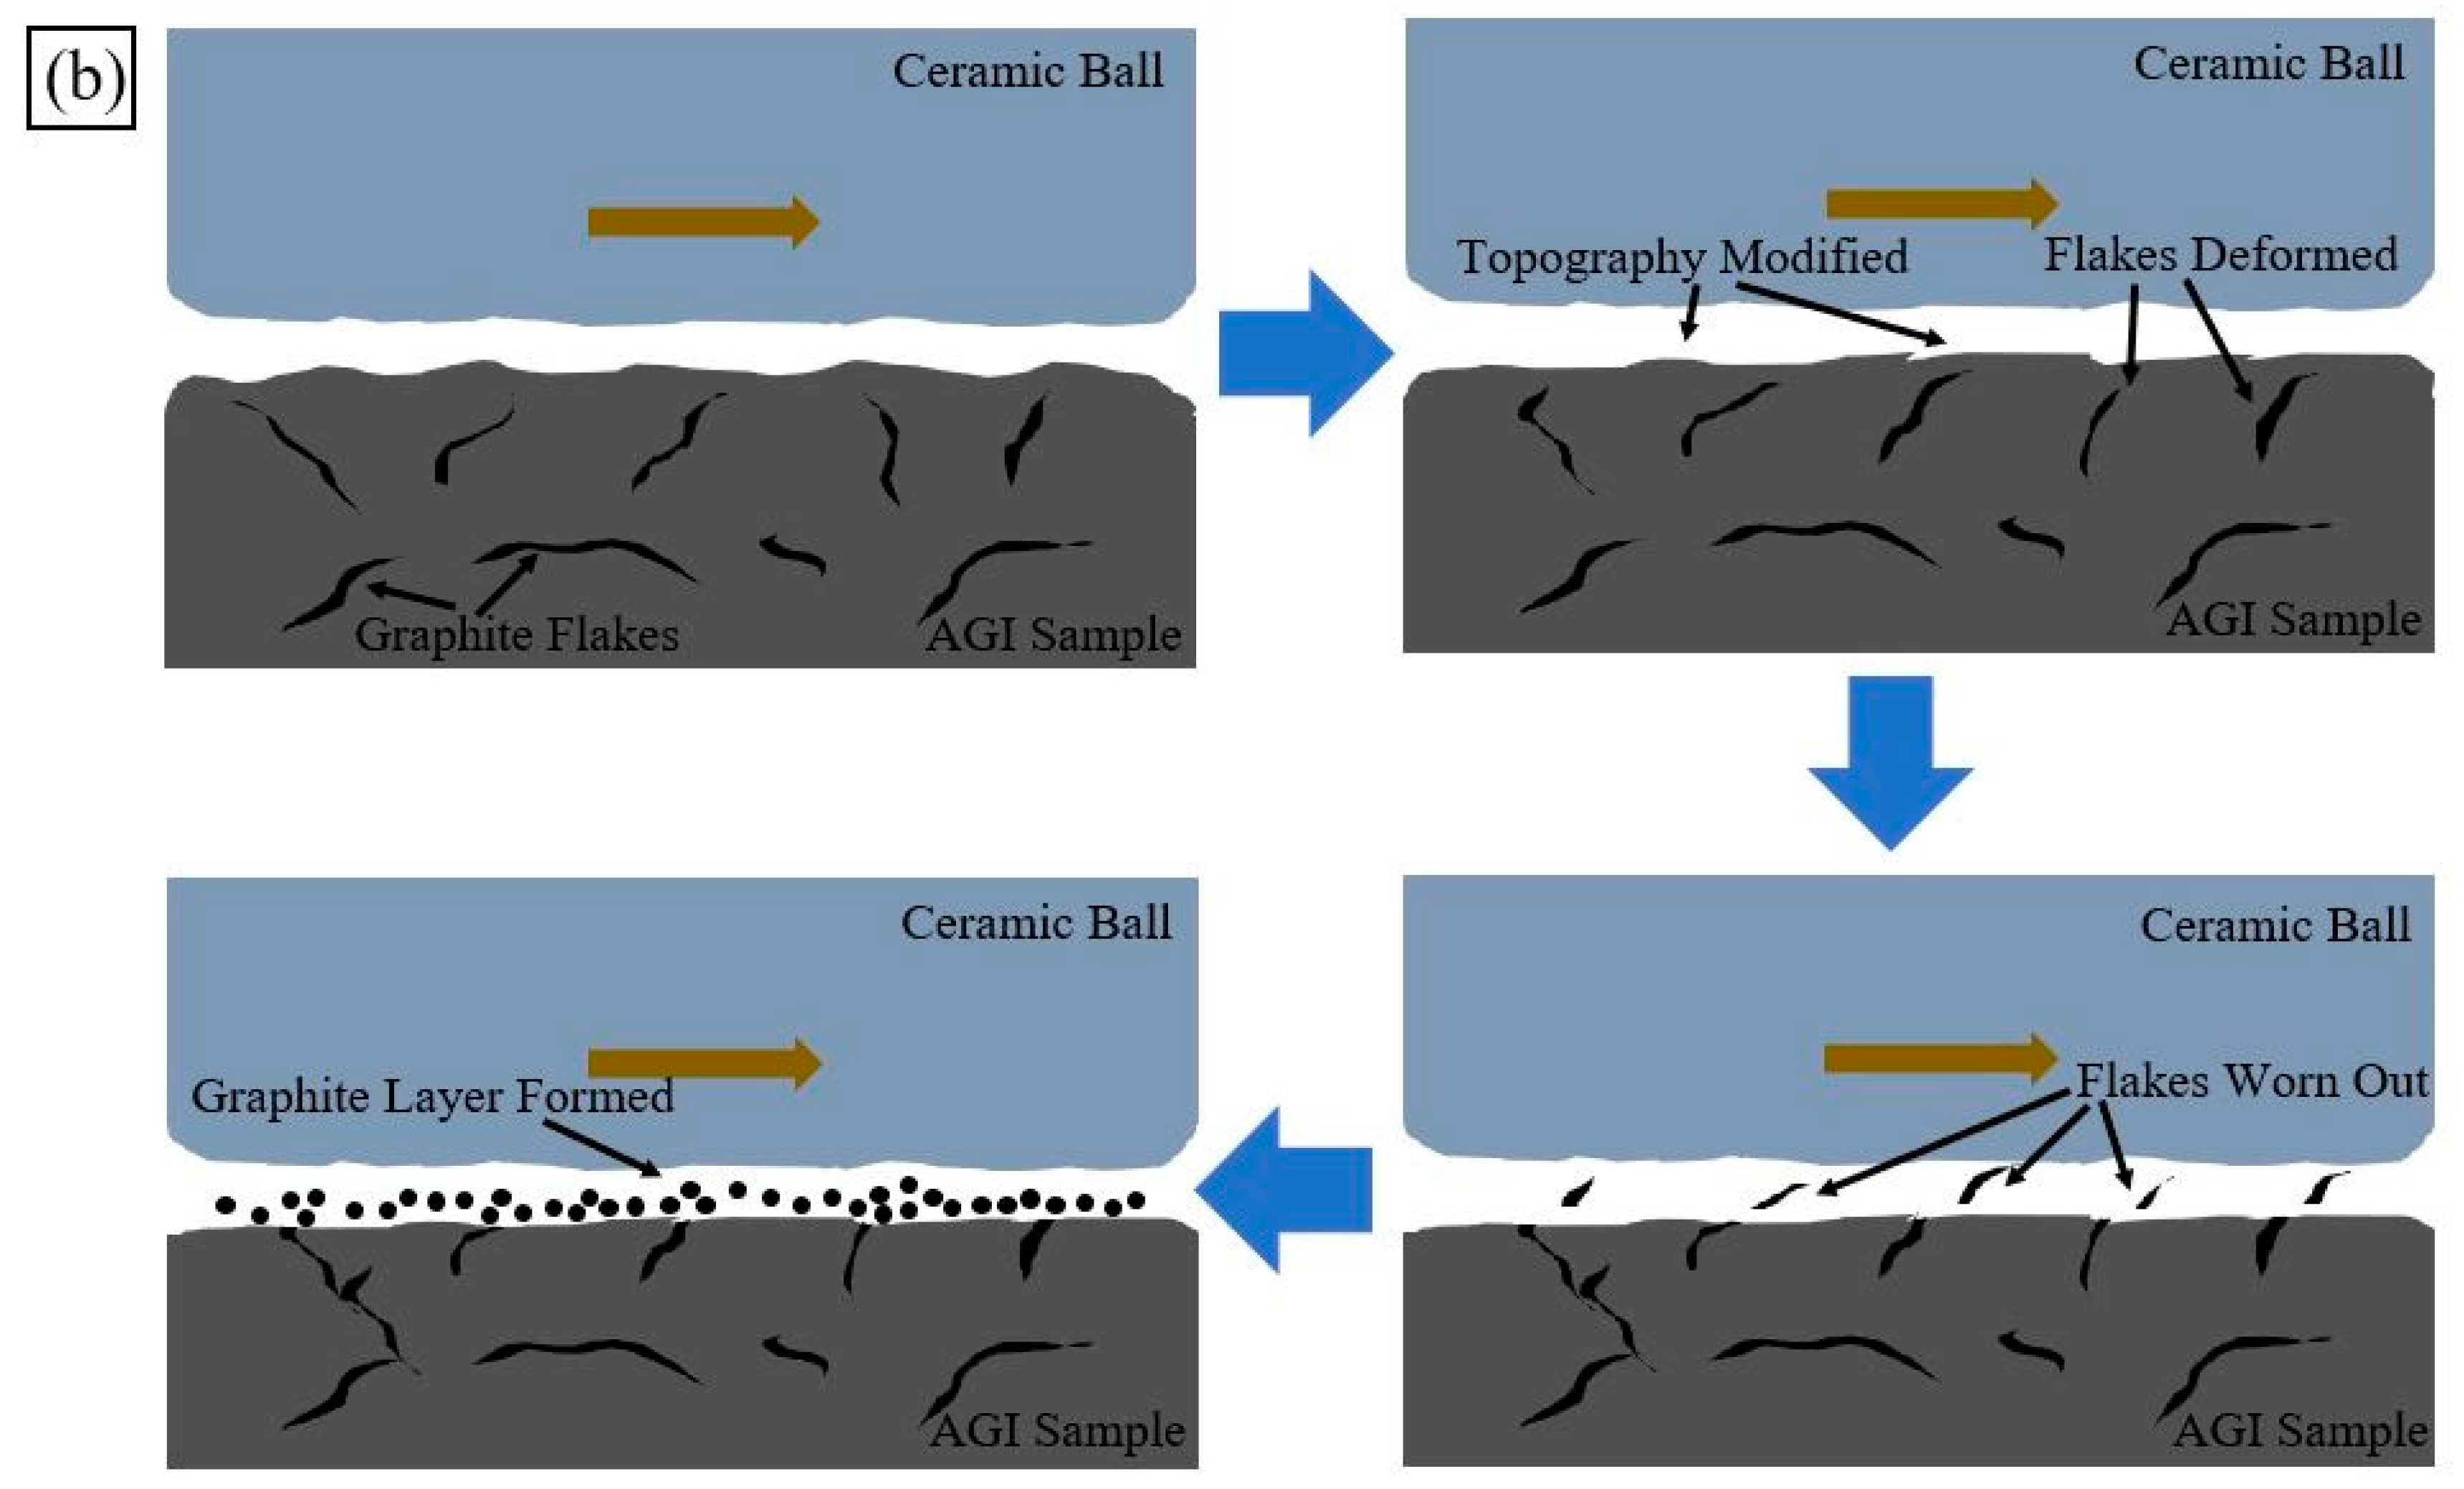
3.4. Worn Surface Analysis

SEM analysis was conducted to evaluate the worn surface of AGI samples; see Figure 9. It can be seen that cracks spread out on the wear track. In Group 1, which was also representative of Groups 2 and 3 (Figure 9a), some parallel grooves along the sliding direction were found on the wear track, which suggested abrasive wear was one of the main mechanisms for these AGI samples with relatively high hardness. Furthermore, some spalls were observed, which were caused by the linkages of cracks on the surface and sub-surface, which introduced fatigue wear as another main mechanism. It is well known that the tips of graphite flakes act as stress concentration sites. Cracks can nucleate around graphite flakes and grow towards the adjacent graphite flakes and the outer surface easily due to the brittleness of AGI samples. During the wear tests, voids were produced by the graphite flakes being peeled out from the surface. Similar findings were also reported by Sarkar, T et al. [4,10]. In addition, they concluded that adhesive wear with plastic flow and oxidative wear were also important mechanisms for AGI. However, plastic flow and oxidation areas were not detected in the current research. As the wear test continued, large scale debris was broken up into small wear debris. Then, the small particles would plough the AGI surfaces under the high Hertzian contact stress; see Figure 10a.
In Group 5, which was also representative of Group 4 (Figure 9b), more darks spots were seen than in Group 1. These dark spots were identified as carbon by using EDS; see Figure 9c. On the wear track, only small pits and cracks could be found, and the crack length was shorter than that in Group 1. These findings could be explained as follows: More stable austenite in Group 5 with high carbon content could withstand severe plastic deformation on the surface and sub-surface under the high shearing force. The resulting higher fracture toughness would retard the nucleation and propagation of cracks. Therefore, no spalls were observed. Under high normal load and shear force, the graphite flakes on the surface and sub-surface would be deformed with the substrate along the sliding direction. Graphite flakes were then exposed and ground by the ceramic ball to produce graphite powder. The graphite powder resulted in a tribo-layer which lowered the wear, as shown in Figure 10b.

4. Conclusions

In this research, AGI samples were prepared using different austempering temperatures and holding durations. Rotational ball-on-disk sliding wear tests were carried out on AGI samples and compared with conventional QTGI samples under similar hardness. In addition, microstructure and hardness were evaluated using optical microscopy and a Rockwell hardness tester. Several conclusions can be drawn: The original pearlite was transformed into acicular ferrite and carbon saturated austenite in the austempering heat treatment. Most of the ferritic platelets nucleated around graphite flakes due to the high potential energy. Thin needle-like ferrite became coarse after increasing the austempering temperature or extending the holding time. The hardness of AGI samples decreased when either increasing the austempering temperature or extending the holding time and became nearly constant beyond a critical time (mostly between 20 min to 30 min). This critical time occurred when the phase transformation had been fully completed in the matrix. The hardness drop was caused by the formation of soft acicular ferrite and stable austenite rather than hard martensite. The slight increase in hardness of QTGI samples while using the tempering temperature of 371 °C was associated with the effects of tempered brittleness. In rotational ball-on-disk sliding wear tests, the average wear volume loss of AGI samples was slightly lower than that of QTGI samples under equivalent hardness, approximately 6%, 6.2%, 8.4%, and 6.5% while using the austempering temperatures of 232 °C, 260 °C, 288 °C, and 316 °C, respectively. In addition, excellent wear resistance of AGI samples was found while using the austempering temperatures of 343 °C and 371 °C. The best result having a wear loss around 0.44 mm3 was obtained using AGI samples with the austempering temperature of 343 °C, which was 21.7% lower than that of QTGI samples. In the analysis of worn tracks, AGI samples produced by low austempering temperature showed abrasive wear and fatigue wear mechanisms with the presence of pits, spalls, voids, and long cracks on the wear track. However, only small pits and short cracks could be detected on the wear track of AGI samples with a high austempering temperature. It was believed the graphite flakes were ground during the wear tests. Then, the graphite particles would form a tribo-layer to protect the contact surface.

Author Contributions

Conceptualization, B.W. and G.C.B.; methodology, B.W. and Y.P.; data curation, B.W.; formal analysis, B.W., X.H. and Y.P.; investigation, B.W., X.H. and Y.P.; resources, G.C.B.; writing, original draft preparation, B.W. and Y.P.; writing, review and editing, B.W. and G.C.B.; project administration, G.C.B.

Funding

This research received no external funding.

Conflicts of Interest

The authors declare no conflict of interest.

References

  1. ASTM International. ASTM Standard A247-Standard Test Method for Evaluating the Microstructure of Graphite in Iron Castings; ASTM International: West Conshohocken, PA, USA, 2017. [Google Scholar]
  2. Bain, E.C. Functions of the Alloying Elements in Steel; American Society for Metals: Materials Park, OH, USA, 1939. [Google Scholar]
  3. Hassani, A.; Habibollahzadeh, A.; Sadeghinejad, S. Influence of Vanadium and Chromium Additions on the Wear Resistance of a Gray Cast Iron. Int. J. Min. Metall. Mater. 2012, 19, 602–607. [Google Scholar] [CrossRef]
  4. Sarkar, T.; Bose, P.; Sutradhar, G. Mechanical and Tribological Characteristics of Copper Alloyed Austempered Gray Cast Iron (AGI). Mater. Today Proc. 2018, 5, 3664–3673. [Google Scholar] [CrossRef]
  5. Vadiraj, A.; Balachandran, G.; Kamaraj, M.; Kazuya, E. Mechanical and Wear Behavior of Quenched and Tempered Alloyed Hypereutectic Gray Cast Iron. Mater. Des. 2011, 32, 2438–2443. [Google Scholar] [CrossRef]
  6. Vadiraj, A.; Balachandran, G.; Kamaraj, M.; Gopalakrisshna, B.; Rao, K. Structure-Property Correlation in Austempered Alloyed Hypereutectic Gray Cast Irons. Mater. Sci. Eng. A 2010, 527, 782–788. [Google Scholar] [CrossRef]
  7. Balachandran, G.; Vadiraj, A.; Kamaraj, M.; Kazuya, E. Mechanical and Wear Behavior of Alloyed Gray Cast Iron in the Quenched and Tempered and Austempered Conditions. Mater. Des. 2011, 2, 4042–4049. [Google Scholar] [CrossRef]
  8. Vadiraj, A.; Balachandran, G.; Kamaraj, M.; Gopalakrishna, B.; Rao, K. Studies on Mechanical and Wear Properties of Alloyed Hypereutectic Gray Cast Irons in the As-Cast Pearlitic and Austempered Conditions. Mater. Des. 2010, 31, 951–955. [Google Scholar] [CrossRef]
  9. Ghaderi, A.; Ahmadabadi, M.; Ghasemi, H. Effect of Graphite Morphologies on the Tribological Behavior of Austempered Cast Iron. Wear 2003, 255, 410–416. [Google Scholar] [CrossRef]
  10. Sarkar, T.; Sutradhara, G. Investigation of Austenitizing Temperature on Wear Behavior of Austempered Gray Iron (AGI). IOP Conf. Ser. Mater. Sci. Eng. 2016, 149, 012048. [Google Scholar] [CrossRef] [Green Version]
  11. Solic, S.; Godec, M.; Schauperl, Z.; Donik, C. Improvement in Abrasion Wear Resistance and Microstructure Changes with Deep Cryogenic Treatment of Austempered Ductile Cast Iron (ADI). Metall. Mater. Trans. A 2016, 47, 5058–5070. [Google Scholar] [CrossRef]
  12. Sahin, Y.; Erdogan, M.; Kilicli, V. Wear Behavior of Austempered Ductile Irons with Dual Matrix Structures. Mater. Sci. Eng. A 2007, 444, 31–38. [Google Scholar] [CrossRef]
  13. Haseeb, A.; Islam, M.; Bepari, M. Tribological Behavior of Quenched and Tempered, and Austempered Ductile Iron at the Same Hardness Level. Wear 2000, 244, 15–19. [Google Scholar] [CrossRef]
  14. PourAsiabi, H.; Saghafian, H.; Pourasiabi, H. Effect of Austempering Process on Microstructure and Wear Behavior of Ductile Iron Containing Mn-Ni-Cu-Mo. Met. Mater. Int. 2013, 19, 67–76. [Google Scholar] [CrossRef]
  15. Wang, B.; Barber, G.; Sun, X.; Shaw, M.; Seaton, P. Characteristics of the Transformation of Retained Austenite in Tempered Austempered Ductile Iron. J. Mater. Eng. Perform. 2017, 26, 2095–2101. [Google Scholar] [CrossRef]
  16. Wang, B.; Barber, G.; Qiu, F.; Zou, Q.; Yang, H. A Review: Phase Transformation and Wear Mechanisms of Single-Step and Dual-Step Austempered Ductile Iron. J. Mater. Res. Technol. 2019. [Google Scholar] [CrossRef]
  17. Wang, C.; Du, X.; Li, S.; Sun, Y.; Yang, P. Morphology and Crystallography of Ausferrite in Austempered Ductile Iron. Metals 2017, 7, 238. [Google Scholar] [CrossRef]
  18. Konca, E.; Tur, K.; Koc, E. Effects of Alloying Elements (Mo, Ni, and Cu) on the Austemperability of GGG-60 Ductile Cast Iron. Metals 2017, 7, 320. [Google Scholar] [CrossRef] [Green Version]
  19. Sellamuthu, P.; Smuel, D.; Dinakaran, D.; Premkumar, V. Austempered Ductile Iron (ADI): Influence of Austempering Temperature on Microstructure, Mechanical and Wear Properties and Energy Consumption. Metals 2018, 8, 53. [Google Scholar] [CrossRef] [Green Version]
  20. ASTM International. ASTM Standard E18-16-Standard Test Methods for Rockwell Hardness of Metallic Materials; ASTM International: West Conshohocken, PA, USA, 2016. [Google Scholar]
  21. Amran, Y.; Katsman, A.; Schaaf, P.; Bamberger, M. Influence of Copper Addition and Temperature on the Kinetics of Austempering in Ductile Iron. Metall. Mater. Trans. B 2010, 41, 1052–1058. [Google Scholar] [CrossRef] [Green Version]
  22. Gorny, M.; Tyrala, E.; Lopez, H. Effect of Copper and Nickel on the Transformation Kinetics of Austempered Ductile Iron. J. Mater. Eng. Perform. 2014, 23, 3505–3510. [Google Scholar] [CrossRef] [Green Version]
  23. Wang, B.; Barber, G.; Tao, C.; Han, X.; Sun, X. Tribological Performance of Austempered and Tempered Ductile Iron. Metall. Mater. Trans. B 2018, 49, 2261–2269. [Google Scholar] [CrossRef]
  24. Panneerelvam, S.; Martis, C.; Putatunda, S.; Boileau, J. An investigation on the Stability of Austenite in Austempered Ductile Cast Iron (ADI). Mater. Sci. Eng. A 2015, 626, 237–246. [Google Scholar] [CrossRef]
  25. Tyrala, E.; Gorny, M.; Kawalec, M.; Muszynska, A.; Lopez, H. Evaluation of Volume Fraction of Austenite in Austempering Process of Austempered Ductile Iron. Metals 2019, 9, 893. [Google Scholar] [CrossRef] [Green Version]
  26. Zahiri, S.; Pereloma, E.; Davies, C. Model for Prediction of Processing Window for Austempered Ductile Iron. Mater. Sci. Technol. 2002, 18, 1163–1167. [Google Scholar] [CrossRef]
  27. Mutavdzic, M.; Lazic, V.; Milosavljevic, D.; Aleksandrovic, S.; Nikolic, R.; Cukic, R. Determination of the Optimal Tempering Temperature in the Hard Facing of the Forging Dies. Mater. Eng. 2012, 19, 95–103. [Google Scholar]
  28. Chandra, T.; Ionescu, M.; Mantovani, D. Effect of Tempering on Mechanical Properties and Microstructure of 1 9% Cr Heat Treatment Steel. Mater. Sci. Forum 2012, 706–709, 841–846. [Google Scholar]
  29. Materkowski, J.; Krauss, G. Tempered Martensite Embrittlement in SAE 4340 Steel. Metall. Mater. Trans. A 1979, 10, 1643–1651. [Google Scholar] [CrossRef]
  30. Wei, M.; Wang, S.; Wang, L.; Cui, X.; Chen, K. Effect of Tempering Conditions on Wear Resistance in Various Wear Mechanisms of H13 Steel. Tribol. Int. 2011, 44, 898–905. [Google Scholar] [CrossRef]
  31. Yang, J.; Putatunda, S. Improvement in Strength and Toughness of Austempered Ductile Cast Iron by A Novel Two-Step Austempering Process. Mater. Des. 2004, 25, 219–230. [Google Scholar] [CrossRef]
  32. Dong, C.; Wu, H.; Wang, X. Effect of Tempering Temperatures on Microstructure and Properties of 0.28C-0.22Ti Wear Resistance Steel. Mater. Sci. Technol. 2018, 34, 86–94. [Google Scholar] [CrossRef]
Figure 1. Original microstructure of as-cast gray cast iron.
Metals 09 01329 g001
Figure 2. Heat treatment processes: (a) austempering heat treatment; (b) quenching and tempering heat treatment.
Metals 09 01329 g002
Figure 3. Sectional view of the rotational ball-on-disk sliding wear test fixture.
Metals 09 01329 g003
Figure 4. Metallurgical evaluation of AGI Samples Produced by different austempering temperatures and holding durations: (a) 232 °C, 20 min; (b) 232 °C, 120 min; (c) 288 °C, 3 min; (d) 288 °C, 120 min; (e) 316 °C, 2 min; (f) 316 °C, 120 min; (g) 343 °C, 1 min; (h) 343 °C, 120 min; (i) 371 °C, 1 min; (j) 371 °C, 120 min.
Metals 09 01329 g004aMetals 09 01329 g004b
Figure 5. Metallurgical evaluation of QTGI samples produced by different tempering temperatures: (a) 316 °C; (b) 371 °C; (c) 399 °C; (d) 454 °C; (e) 482 °C; (f) 510 °C.
Metals 09 01329 g005
Figure 6. Rockwell C hardness of AGI under various austempering temperatures and holding times.
Metals 09 01329 g006
Figure 7. Rockwell C hardness of QTGI under various tempering temperatures.
Metals 09 01329 g007
Figure 8. Wear volume loss of AGI and QTGI samples under equivalent hardness.
Metals 09 01329 g008
Figure 9. Surface evaluation on wear track: (a) AGI sample in Group 1; (b) AGI sample in Group 5; (c) elemental examination of dark spot by EDS.
Metals 09 01329 g009
Figure 10. Potential failure mechanisms on AGI Samples in sliding wear tests: (a) production of wear debris; (b) formation of graphite tribo-layer.
Metals 09 01329 g010aMetals 09 01329 g010b
Table 1. Alloy content for gray cast iron.
ElementsPercentage
Carbon, C3.53%
Silicon, Si2.71%
Manganese, Mn0.74%
Chromium, Cr0.12%
Copper, Cu0.94%
Sulfur, S0.03%
Phosphorous, P0.08%
Iron, FeRemainder
Table 2. Details of heat treatment designs and experiments.
Heat Treatment Designs
Austempering Heat Treatment (AGI)
Austenitizing Process:Temperature: 832 °C;
Time: 20 min;
Medium Temp Salt Bath Furnace
Austempering Process:Temperatures: 232 °C, 260 °C, 288 °C,
316 °C, 343 °C, 371 °C;
Times: 1 min, 2 min, 3 min, 6 min, 10 min, 20 min, 30 min, 60 min, 90 min and 120 min;
Water Cool;
Low Temp Salt Bath Furnace
Quenching and Tempering Heat Treatment (QTGI)
Austenitizing Process:Temperature: 832 °C;
Time: 20 min;
Oil Cool;
Medium Temp Salt Bath Furnace
Tempering Process:Temperatures: 316 °C, 371 °C, 399 °C, 454 °C, 482 °C, 510 °C;
Time: 60 min;
Oil Cool;
Electrical Heating Furnace
Experiments
Metallurgical Evaluations
SampleAGI and QTGI Coupons (15 mm × 15 mm × 15 mm)
Etching3% Nital for 2 s or 3 s
Test FacilityOptical Microscopy with 500× Magnification
Sample Size16
Hardness Measurements
SampleAGI and QTGI Sample Coupons/Disks
Test FacilityRockwell Hardness Tester
Repetition3 Times
Sample Size234
Wear Tests
Upper SampleAlumina Ball (Diameter: 7.94 mm; Hardness: 75 HRC;
Surface Roughness (Ra): 10 nm)
Lower SampleAGI and QTGI Disks (Diameter: 64 mm; Thickness: 11 mm; Surface Roughness (Ra): ≈ 300 nm)
Normal Load300 N
Rotational Speed240 rpm
LubricantPAO4 Base Oil
Test Duration30 min
Test FacilityRotational Ball-on-Disk Sliding Configuration
Repetition3 Times
Sample Size36
Table 3. Average hardness of AGI and QTGI sample groups in rotational ball-on-disk sliding wear tests.
Group Number123456
Austempering Temperature (°C)232260288316343371
Hardness (HRC)42.34237.428.928.126.8
Tempering Temperature (°C)316371399454482510
Hardness (HRC)41.141.83829.528.727.2

