Article

Structure and Stability of the Stoichiometric Al3Fe Phase

State Key Laboratory of Metastable Materials Science and Technology, Yanshan University, Qinhuangdao 066004, China
*
Author to whom correspondence should be addressed.
Metals 2019, 9(12), 1322; https://doi.org/10.3390/met9121322
Submission received: 17 October 2019 / Revised: 5 December 2019 / Accepted: 5 December 2019 / Published: 7 December 2019

Abstract

:
A disordered stoichiometric Al3Fe phase was obtained when synthesizing Al8Fe3 by the spark plasma sintering (SPS) approach and its crystal structure was determined by the single-crystal X-ray diffraction (SXRD) techniques. The refined structure is an isotype of the reported Al5Fe2 phase, only different in the site occupation factors (s. o. f.) of Al2 and Al3 atoms, which was refined to be 0.431 (13) and 0.569 (13), respectively. Stimulated by the structural refinement results, an ordered stoichiometric Al3Fe phase was established. First-principles calculations reveal that the ordered Al3Fe phase is mechanically and dynamically stable and has a much lower value of enthalpy of formation than any other proposed Al3Fe phases, although it is also metallic and metastable.

1. Introduction

The complex intermetallic compounds in the Al–Fe binary alloy system have been extensively studied for their high hardness, high wear resistance, high corrosion resistance, and light weight properties applied in the industrial field [1,2,3,4,5]. Meanwhile, the constitution of element aluminum and iron in the earth’s crust is very high, thus investigating the aluminum-iron alloy is also of vital importance in understanding the evolution of the earth [6,7,8,9].
Specially, the fascinating phase of Al3Fe in binary Al–Fe system has triggered continuously efforts in the first half 20th century [10,11,12,13,14]. Later its crystal structure has been generally accepted to be the λ-Al13Fe4 phase with C2/m space group [15,16,17]. An icosahedral quasicrystal phase was reported to form in a melt-spun Al75Fe25 alloy by the selected area electron diffraction patterns (SAED) [18]. A new alloy mineral named Hollisterite with nominal Al2.89Fe0.77Cu0.32Si0.02 composition was indexed to be monoclinic C2/m Al13Fe4-type structure by single-crystal electron backscatter diffraction (EBSD) [19]. Very recently, an Al13Fe3 phase was uncovered by our group during deciphering the formation and stability mechanism of the Hollisterite phase [20].
In the present work, we report a disordered orthorhombic phase with ideal Al3Fe composition which was discovered when investigating the Al2+δFe intermetallic phase for δ = 0.67 [21,22,23]. Furthermore, an ordered Al3Fe phase was constructed encouraged by the refined disordered structural model.

2. Materials and Methods

The single crystal sample was prepared by the spark plasma sintering (SPS) method. The pure aluminum powder (indicated purity 99.8%) and pure iron powder (indicated purity 99.8%) were mixed according to the atomic ratio 8:3 and initially ground in an agate mortar. Blended powders were packed with a graphite paper and then filled into a graphite die of diameter 20 mm. In the following, the packed graphite die was placed between the upper and lower conductive plates of the SPS machine. To start the experiment, the ambient atmosphere was firstly pumped to a high vacuum of 6 × 10⁻³ Pa. The sintering pressure was set to a value of ~50 MPa and the sintering temperature was set to 1000 °C. These conditions were maintained for 10 min then cooled rapidly to room temperature by shutting off the power. Finally, the sintered block was removed from the graphite mold and broke into small pieces. A cuboid-shaped fragment with a size of 100 × 50 × 20 μm3 was selected and mounted on a thin glass fiber for single-crystal X-ray diffraction (SXRD) measurements. Scanning Electron Microscope (SEM, Hitachi S-3400N type, Hitachi, Tokyo, Japan) equipped with EDS (EDAX Inc., Mahwah, NJ, USA) at a cathode voltage of 20 kV and a current of 80 mA were used to characterize the morphology and chemical composition. Diffraction measurements were carried out with a four-circle single crystal X-ray diffractometer (Bruker D8 venture, Bruker AXS GmbH, Karlsruhe, Germany).
Density functional theory (DFT) based first-principles calculations as implanted in the VASP code [24,25] were used for all calculations including the mechanical and dynamical stability, electronic properties, and bonding features of the proposed new phase. The generalized gradient approximation (GGA) [26] and projected augmented wave (PAW) were used for describing the exchange-correlation function and the pseudopotentials [27]. The k-point samplings in the Brillouin zone were performed using the Monkhorst–Pack scheme [28]. It has been tested that an 8 × 8 × 8 mesh k-point and a 500 eV plane wave cutoff energy can satisfy the self-consistent convergence criteria: 1 × 10⁻⁶ eV. The phonon dispersion curves were simulated using the supercell approach by applying the Phonopy code [29,30]. Spin polarization was not considered due most Al–Fe phases with a Fe-concentration below 25 at.% are considered to be non-magnetic [31] but the spin-polarized ground state of pure iron was considered to obtain a conservative estimation of enthalpy of formation (see Table S4 in the Supplementary Material).

3. Results

The crystal data, data collection, and structure refinement details are summarized in Table 1. The crystal was refined with PART and EADP commands for Al2 and Al3 atoms. The site of occupancies of Al2 and Al3 were refined to be 0.431 (13) and 0.569 (13), respectively. All data processing was performed with the APEX3 program suit, including data reduction by SAINT, absorption correction by SADABS, structural solving, and refinement by SHELXT and SHELXL [32,33,34], respectively. The detailed crystal structure information of the present phase has been accepted by the Cambridge Crystallographic Data Centre (CCDC) with a deposition number: 1967090. All data sets collected by a four-circle single crystal X-ray diffractometer (Bruker D8 Venture, Bruker AXS GmbH, Karlsruhe, Germany) have been published at the public repository Mendeley Data: https://data.mendeley.com/datasets/cgp7jbwghm/3. The detailed crystal structure information of the refined Al3Fe are illustrated in Table 2.
The present refined results are slightly different from that of Burkhardt et al.’s work [1], which refined the site of occupancy of Wyckoff position 4b (Al2) and 8f (Al3) separately to be 0.32(4) and 0.24 (2), respectively. Such strategy has also been adopted initially but significant Alert A appears (Atom Al2 and Al3 has ADP max/min Ratio of 6.2 and 5.7, respectively). In the present refinement, when the corresponding sites of occupancy of Wyckoff positions 4c (Al2) and 4a (Al3) were refined simultaneously by the PART and EADP commands, we find that the best quality indicators of the refinement can be obtained (The ADP max/min Ratio of both Atom Al2 and Al3 were reduced to 3.1).
It can clarify that the refined model is actually an average structure of Al3Fe. In the ideal case, the Al2 and Al3 should place one-by-one and each with a site occupancy factor 0.5. In the present work, the site occupation factor of Al3 is 0.569 (13), quite close to the golden ratio 0.618, implying it may have some relation with the formation of quasicrystals. In other words, the Al3Fe model has a much clearer physical picture and may benefit the understanding the complex crystal structures of the Al2+δFe intermetallic phases [21,22,23].
Concerning the selected fragment of the single crystal sample, EDS analysis was carried out on three areas and three spots (see Figure 1) and the corresponding results are listed in Table 3. One can find that most estimated values Al:Fe atomic ratios are less than 3 except that of spot 2. It is well known that the chemical compositions of each element were analyzed by comparing the integrated net intensities with corresponding data collected automatically by the EDAX Inc. However, it needs to be noted that the single crystal sample was inclined to and hardly to be adjusted to parallel to the incident electron beam, thus most measured values are probably underestimated.
Figure 2a shows the 2 × 2 × 2 supercell of the Al3Fe phase projected in the [001] direction. The Al2 and Al3 atoms locate at the center of the channels formed by Fe4 and Al1 atoms along the [001] direction. The distributions of Al2 and Al3 atoms can be clearly seen in Figure 2b,c. From Figure 2b, one can observe that Al2 and Al3 atoms arrange along the [001] direction in a zigzag way. The dashed circles surrounded the Al2 and Al3 atoms in Figure 2b mean vacancies may exist at these positions as the distance between them is too short (d = 1.0900 (33) Å) thus they cannot occupy simultaneously. There are 16 (12 Al plus four Fe) atoms in the unit cell, where Fe4/Al2, Al1, and Al3 atoms occupy the 4c, 8g, and 4a Wyckoff sites, respectively. Each Al3 atom is surrounded by twelve atoms (8Al1, 2Al3, 2Fe4) that forming a distorted icosahedron, resulting in an icosahedron chain along [001] direction as shown in Figure 2c.
Encouraged by the refined disordered Al3Fe phase, we constructed an ideal stoichiometric Al3Fe model as following (see Figure 3). Firstly, a 1 × 1 × 2 supercell along the [001] direction of the disordered Al3Fe phase was built up where Al2 and Al3 atoms are kept at the lower and upper half part, respectively, as shown in Figure 3b. It needs to be noted that in order to keep the balance of the crystal structure, the vertical positions of the Al3 atoms were moved down about 0.125 c. Secondly, the symmetry of the model was removed and geometry optimizations were performed by first-principles calculations method with the model’s primitive cell. Finally, symmetry operation was added to the optimized model and a new orthorhombic phase was discovered, as shown in Figure 3c. It needs to be emphasized that there is an infinite number of real structural models corresponding to the average structure. The one built in this case is the simplest one, with Al2 atoms remaining in a unit cell and Al3 atoms remaining in its neighboring unit cell. Transformations have to be operated to the supercell to keep the balance of the Al2 and Al3 atoms along the c direction of the unit cells. The final optimized structural model (Figure 3c) is still closely related to the original disorder model by removing the Al3 atoms (Figure 3a), but with slightly different lattice parameters. Later, it was found that the final relaxed model can also be obtained by directly optimizing the original disorder model when removing the Al3 atoms. However, Figure 3b is very useful for understanding the aforementioned physical picture.
One can find that the framework of the new Al3Fe structure is quite similar to that of the disordered Al3Fe phase but with quite different lattice parameters especially the value of c (a = 7.48 Å, b = 6.21 Å, c = 4.82 Å), although it still adopts the same space group of the disorder phase (S.G. No.63). Compared to the disordered phase, the distance between the flat layer formed by all Al2 atoms along c axis the increased about 14.2% (from 2.11 Å to 2.41 Å). Such differences are also easily deduced from the simulated powder diffraction patterns for the refined disorder Al3Fe phase and the proposed ordered stoichiometric Al3Fe phase (see Figure 4). However, the single crystal diffraction patterns are still quite similar (see Figure S1 in the Supplementary Material), implying strong pertinence between the refined disorder Al3Fe model and the proposed ideal Al3Fe model.
The enthalpy of formation is calculated as follows:
ΔΗ = ΗAl3Fe − 3ΗAl (fcc)ΗFe (bcc)
where ΔΗAl3Fe is the total enthalpy of the newly uncovered Al3Fe phase, and ΗAl (fcc) and ΗFe (bcc) denote the enthalpy of the A1 and Fe atoms in the face-centered cubic (FCC) and body-centered cubic (BCC) system, respectively.
The calculated phonon spectrums were illustrated in Figure 5a, implying the new phase is dynamically stable as there are no negative frequencies detected in the whole Brillouin zone. Meanwhile, the enthalpy formation of the new phase is calculated to be negative, −0.25 eV/atom, implying it is thermodynamically favorable, although it is a metastable phase.
The elastic constants Cij were calculated with the strain-stress method [36]. It can be easily found that the calculated elastic constants satisfy the mechanical stability criterion for the orthorhombic crystal system as listed in expressions (2) [36].
Cii > 0; Cii + C jj − 2Cij > 0;
C11 + C22 − 2C12 > 0; C11 + C33 − 2C13 > 0
C22 + C33 − 2C23 > 0; C11 + C22 + C33 + (C12 + C13 + C23) > 0
In order to characterize its resistance to volume deformation and shear strain, the bulk modulus (B) and shear modulus (G) were obtained by the Voigt-Reuss-Hill method [37] and the Young’s modulus (E), Poisson’s ratio (σ) were then deduced from the B and G (see Tables S2 and S3 in the Supplementary Material). All these values of the new Al3Fe phase and another two related Al–Fe intermetallic compounds Al13Fe3 and Al13Fe4 [38] (Their crystal structures information can be found in Table S1 of the Supplementary Material) are compared and shown in Table 4. It reveals that the new Al3Fe phase has the highest value of B and G, implying that the new phase has the highest resistance to compression and shear strain.
The Poisson’s ratio of a material usually ranges from −1 to 0.5, the bigger the value is, the better ductility the material has. From the results in Table 4, one can find that the new phase has the largest Poisson’s ratio and thus should have the best ductility. The B/G value of the Al3Fe phase is about 1.60, suggesting it is still a brittle material, although approaching the 1.75 value for a ductile material. Three-dimensional representations of Poisson’s ratio, shear modulus, and Young’s modulus of the proposed Al3Fe are illustrated in Figures S2–S4 of the Supplementary Material for interested readers.
Finally, the hardness of the Al3Fe phase was calculated by Chen’s simple empirical hardness formula [39]:
Hv = 2 (G3/B2) 0.585 – 3
In the following, we have investigated the electronic properties of the new Al3Fe phase. Its energy band structures, total, and partial density of states (DOS) were calculated and shown in Figure 6a,b. One can find that the new phase is metallic evidenced by the finite electronic DOS at the Fermi level as well as the overlap of the valence band and the conduction band around the Fermi level in the band structure. The Fermi energy does not locate at the minimum of the pseudo gap of the DOS as other complex metallic alloys, may provide some clues why no stoichiometric Al3Fe phase has been observed in experiments up until now. From the total and the partial DOS patterns, one can also find that the total DOS between −5 eV and 5 eV is mainly contributed by the Fe-d state.
Furthermore, the electronic localization function (ELF) patterns, which can measure the relative electron localization, have been simulated for the new Al3Fe phase in order to investigate its detailed chemical bonding features [40]. ELF is a uniquely defined dimensionless quantity, and only takes values in the range between 0 and 1, where 1 refers to the fully localized electrons, and 0.5 corresponds to fully delocalized electrons, while 0 represents very low charge density. Two slices parallel to the (100) and (001) planes which cross the Al2 and Al1 with Fe atoms are plotted in Figure 7a,b, respectively. From Figure 7, one can find that the bonding between Al2 atoms (max. ELF = 0.70) is much stronger than those between Al1 atoms (max. ELF = 0.49) while no bonding formed between the Fe atoms. Comparing Figure 7a,b, we can conclude that the bonding between Al1 and Fe atoms (max. ELF = 0.65) are slightly stronger than that between Al2 and Fe atoms (max. ELF = 0.54) and both of them are stronger than bonding between Al1 atoms (max. ELF = 0.49). According to the ELF analysis results, the new Al3Fe phase has a mixed covalent bonding formed mainly by the Fe 3d and Al 3p orbitals hybridization and jellium-like metallic bonding formed by delocalizing electrons. The covalent bonding by Al2 atoms along the [001] direction contributes to the forming the stable chain structures as shown in Figure 7c while no close networks are forming in the (001) planes as shown in Figure 7d.

4. Discussion

First of all, it is necessary to emphasize that the ordered stoichiometric Al3Fe phase was established based on the structural refinement results in the present work. There are two aspects of fact: (1) Different from other metallic phases in Cu3Au (FCC lattice) types or other stoichiometric in the Al–Fe like Fe3Al (bcc lattice) [41,42], there is no ideal stoichiometric Al3Fe that has been synthesized and characterized up until now; (2) previously reported results are all off-stoichiometric Al3Fe phases, like Al5Fe2, Al13Fe4 etc. [1,43]. Very recently, the low-temperature phase of the ƞ-Fe2Al5 phase has been extensively studied with powder-X-ray diffraction, single-crystal synchrotron X-ray diffraction, and scanning transmission electron microscopy analysis [21,22,23], and it was evidenced that the Al:Fe atom ratio does not have to follow the original refined value of 2.80 in the parent orthorhombic unit cell of ƞ-Fe2Al5, as reported initially [1]. Owing to the remarkable anisotropy of thermal motion of Al2 and Al3 atoms and physically non-meaningful distances between them, however, the sums of the s. o. f. of both atoms should be less or equal to 1. In the present work, the Al2 and Al3 are restrained simultaneously (sums of s. o. f. set to be 1) can avoid the “alert A” during refinement as appeared in the Burckhardt’s work without deteriorating reliability factors. Furthermore, the present refined ideal stoichiometric Al3Fe phase has a clear physical picture: (1) The site occupation factor of Al3 is 0.569 (13), quite close to the golden ratio 0.618, implying it may have some relation with the formation of one dimensional quasicrystal if the Al2 and Al3 atoms are packed in the Fibonacci sequence; (2) in another ideal case, the Al2 and Al3 should place one-by-one and each with a site occupancy factor 0.5 as the ordered ideal stoichiometric Al3Fe phase established and discussed in the present work. In addition, the chemical composition by EDS of the “measured” single crystal has been measured. As revealed by the EDS results, most sites reveal an approximately composition of Al70Fe30, but one site reveals Al76.52Fe23.48, and this site has the highest intensity, implying it is the most reliable one and support the refined model in the present work.
Concerning the stability of the established ordered ideal stoichiometric Al3Fe phase, the calculated enthalpy of formation of the new phase has the lowest values (−0.25 eV/atom) when compared with other proposed ideal stoichiometric Al3Fe phases (see Figure S5 of the Supplementary Material). However, it is a metastable phase as the enthalpy of formation does not lie on the line of the convex hull of the Al–Fe binary diagram [26,44]. It should be noted that the calculated total energy of pure iron is scattered (see Table S4 of the Supplementary Material) and the spin-polarized ground state of pure iron should be considered when calculating the enthalpy of formation, although most Al–Fe phases with a Fe-concentration below 25 at.% are considered to be non-magnetic [26]. As the enthalpy of formation of the new phase lies only 90 meV/atom above the tie line, suggesting its existence at un-ambient conditions like high or low temperature and/or high pressures. On the one hand, we expect some more sophisticated ideal stoichiometric Al3Fe phases, where a different packing sequence of Al2 and Al3 atoms in the neighboring unit cell, compared to the simple one established in the present work, may have more favorable enthalpy of formation. On the other hand, as more and more peculiar low temperature phases (ƞ′-,η″-, and η‴-) have been determined based on the parent ƞ-Fe2Al5 phase [21,22,23,45], we may also be persuaded that intrinsic defects as vacancies probably play a dominating role in stabilizing the Al–Fe intermetallics at the vicinity of stoichiometric Al3Fe portion.

5. Conclusions

In the binary Al–Fe alloy system, a disordered phase isotype of the reported Al5Fe2 phase but with an ideal stoichiometric of Al3Fe (S.G. Cmcm) was uncovered when refining the synthesized Al8Fe3 by the spark plasma sintering approach. An ordered Al3Fe phase was then proposed, encouraged by the refined phase and it was found that the new phase is mechanical, thermodynamic and dynamical stable, as indicated by the calculated elastic constants, formation enthalpy as well as phonon spectrums. The calculated band structures indicate the new phase is metallic. The total and partial density of states reveal that the Fe 3d and Al 3p orbitals mainly contribute to the overlap of the valence band and the conduction band around the Fermi level and their hybridization provides a feature of covalent bonding besides the jellium-like metallic bonding formed by delocalizing electrons as shown in the ELF patterns. Furthermore, it was found that the proposed phase has a larger Poisson’s ratio (0.24) and B/G value (1.60) than the reported Al13Fe3 and Al13Fe4 compounds thus should have best ductility among these three phases.
In summary, a disordered stoichiometric Al3Fe phase was discovered and a corresponding ideal ordered Al3Fe phase was proposed. The present work sheds light on the understanding of Al–Fe intermetallic phases and would stimulate more experimental and theoretical efforts focusing on the Al–Fe binary alloy system in the future.

Supplementary Materials

The following are available online at https://www.mdpi.com/2075-4701/9/12/1322/s1, Table S1: Crystallographic information of all Al3Fe related phases, Table S2: Average elastic properties of the proposed Al3Fe phase by Voigt-Reuss-Hill method, Table S3: Variations of the elastic moduli for the proposed Al3Fe phase, Table S4: Calculated total energy of Fe atom deduced from that of α-Fe, Figure S1: Projected measured diffraction patterns along a: <100>, b: <010> and c: <001> directions for the refined disordered stoichiometric Al3Fe phase and the simulated single crystal diffraction patterns along e: <100>, f: <010> and g: <001> directions for the proposed ordered stoichiometric Al3Fe phase., Figure S2: (a) 3D representation of Poisson’s ratio of the proposed Al3Fe; (b) 2D representation of Poisson’s ratio in the xy plane, (c) xz plane and (d) yz plane for the proposed Al3Fe. The blue solid line outside represents the maximum and green solid line inside represents the minimum, Figure S3: (a) 3D representation of shear modulus of the proposed Al3Fe; (b) 2D representation of shear modulus in the xy plane, (c) xz plane and (d) yz plane for the proposed Al3Fe. The blue solid line outside represents the maximum and green solid line inside represents the minimum, Figure S4: (a) 3D representation of Young’s modulus of the proposed Al3Fe; (b) 2D representation of Young’s modulus in the xy plane, (c) xz plane and (d) yz plane for the proposed Al3Fe, Figure S5: The formation enthalpy of the existing Al-Fe binary phases with that of the propose metastable ordered Al3Fe phase marked by green cross.

Author Contributions

Conceptualization, C.F.; investigation, Z.X. and C.F.; writing—original draft preparation Z.X.; writing—review and editing, C.F. and B.W.; project administration, C.F.; funding acquisition, C.F. and B.W.

Funding

This research was funded by Research Foundation of Education Bureau of Hebei Province (grant number ZD2018069) and The APC was funded by The National Natural Science Foundation of China (NSFC, grant number 51771165).

Conflicts of Interest

The authors declare no conflict of interest.

References

  1. Burkhardt, U.; Grin, Y.; Ellner, M.; Peters, K. Stucture Refinement of the Iron-Aluminium Phase with the Approximate Composition Fe2Al5. Acta Crystallogr. B 1994, 50, 313–316. [Google Scholar] [CrossRef]
  2. Han, K.; Ohnuma, I.; Kainuma, R. Experimental determination of phase equilibria of Al-rich portion in the Al-Fe binary system. J. Alloys Compd. 2016, 668, 97–106. [Google Scholar] [CrossRef]
  3. Li, X.; Scherf, A.; Heilmaier, M.; Stein, F. The Al-rich part of the Fe-Al phase diagram. J. Phase Equilib. Diff. 2016, 37, 162–173. [Google Scholar] [CrossRef] [Green Version]
  4. Denkena, B.; Stiffel, J.H.; Hasselberg, E.; Nespor, D. Chip formation and modeling of dynamic force behavior in machining polycrystalline iron–aluminum. Prod. Eng. Res. Devel. 2014, 8, 273–282. [Google Scholar] [CrossRef]
  5. Buršíková, V.; Homola, V.; Jirásková, Y.; Pizúrová, N.; Miháliková, I.; Friák, M.; Šob, M. Study of Local Mechanical Properties of Fe78Al22 Alloy. Key Eng. Mater. 2018, 784, 27–32. [Google Scholar] [CrossRef]
  6. Schuermann, E.; Kaiser, H.P. Melting Equilibria of Iron-Aluminium and Iron-Phosphorus Alloys. Arch. Eisenhuettenwes. 1980, 51, 325–327. [Google Scholar]
  7. Palm, M. Fe–Al materials for structural applications at high temperatures: Current research at MPIE. Int. J. Mater. Res. 2009, 100, 277–287. [Google Scholar] [CrossRef]
  8. Runge, J.M. The Metallurgy of Anodizing Aluminum, 1st ed.; Springer: Cham, Switzerland, 2018; pp. 1–64. [Google Scholar]
  9. McDonough, W.; Sun, S.S. The composition of the Earth. Chem. Geol. 1995, 120, 223–253. [Google Scholar] [CrossRef]
  10. Groth, P. Chemische Krystallographie, 1st ed.; Verlag von Wilhelm Engelmann: Leipzig, Deutschland, 1906; pp. 47–48. [Google Scholar]
  11. Osawa, A. On the equilibrium diagram of iron-aluminium system. Sci. Rep. Tohoku Univ. 1933, 22, 803–823. [Google Scholar]
  12. Bachmetew, E. Röntgenographische Bestimmung der FeAl3-Struktur. Z. Kristallogr. 1934, 89, 575–586. [Google Scholar]
  13. Bradley, A.J.; Taylor, A. An X-ray study of the iron-nickel-aluminium ternary equilibrium diagram. Proc. R. Soc. Lond. A 1938, 166, 353–375. [Google Scholar]
  14. Phragmen, G. On the phases occurring in alloys of aluminium with copper, magnesium, manganese, iron, and silicon. J. Inst. Metals 1950, 77, 489–551. [Google Scholar]
  15. Black, P.J. The structure of FeAl3.I. Acta Crystallogr. 1955, 8, 43–48. [Google Scholar] [CrossRef]
  16. Black, P.J. The structure of FeAl3. II. Acta Crystallogr. 1955, 8, 175–182. [Google Scholar] [CrossRef]
  17. Armbrüster, M.; Kovnir, K.; Friedrich, M.; Teschner, D.; Wowsnick, G.; Hahne, M.; Gille, P.; Szentmiklósi, L.; Feuerbacher, M.; Heggen, M.; et al. Al13Fe4 as a low-cost alternative for palladium in heterogeneous hydrogenation. Nat. Mater. 2012, 11, 690–693. [Google Scholar] [CrossRef] [Green Version]
  18. Sekhar, J.A.; Rajasekharan, T.; Rao, P.R.; Parthasarathy, G.; Ramkumar, S.; Gopal, E.S.R.; Lakshmi, C.S.; Mallya, R.M. Electron and x-ray diffraction studies on Al86Fe14, Al82Fe18 and Al75Fe25 quasicrystals. J. Phys. 1986, 27, 267–273. [Google Scholar] [CrossRef]
  19. Ma, C.; Lin, C.; Bindi, L.; Steinhardt, P.J. Hollisterite (Al3Fe), kryachkoite (Al,Cu)6 (Fe,Cu), and stolperite (AlCu): Three new minerals from the Khatyrka CV3 carbonaceous chondrite. Am. Mineral. 2017, 102, 690–693. [Google Scholar] [CrossRef]
  20. Xia, Z.; Liu, C.; Fan, C.Z. Al13Fe3. IUCrData 2018, 3, x180593. [Google Scholar] [CrossRef] [Green Version]
  21. Okamoto, N.L.; Okumura, J.; Higashi, M.; Inui, H. Crystal structure of ƞ′-Fe3Al8; low-temperature phase of ƞ-Fe2Al5 accompanied by an ordered arrangement of Al atoms of full occupancy in the c-axis chain sites. Acta Mater. 2017, 129, 290–299. [Google Scholar] [CrossRef]
  22. Becker, H.; Amirkhanyan, L.; Kortus, J.; Leineweber, A. Powder-X-ray diffraction analysis of the crystal structure of the ƞ′-Al8Fe3 (ƞ′-Al2.67Fe) phase. J. Alloys Compd. 2017, 721, 691–696. [Google Scholar] [CrossRef]
  23. Okamoto, N.L.; Higashi, M.; Inui, H. Crystal structure of η″-Fe3Al7+x determined by single-crystal synchrotron X-ray diffraction combined with scanning transmission electron microscopy. Sci. Technol. Adv. Mater. 2019, 20, 543–556. [Google Scholar] [CrossRef] [PubMed] [Green Version]
  24. Kresse, G.; Furthmuller, J. Efficient iterative schemes for ab initio total-energy calculations using a plane-wave basis set. Phys. Rev. B 1996, 54, 11169–11181. [Google Scholar] [CrossRef] [PubMed]
  25. Parr, R.G. Density functional theory. Ann. Rev. Phys. Chem. 1983, 34, 631–656. [Google Scholar] [CrossRef]
  26. Perdew, J.P.; Burke, K.; Ernzerhof, M. Generalized Gradient Approximation Made Simple. Phys. Rev. Lett. 1996, 77, 3865–3868. [Google Scholar] [CrossRef] [PubMed] [Green Version]
  27. Blochl, P.E. Projector augmented-wave method. Phys. Rev. B 1994, 50, 17953–17979. [Google Scholar] [CrossRef] [Green Version]
  28. Monkhorst, H.J.; Pack, J.D. Special points for Brillouin-zone integrations. Phys. Rev. B 1976, 13, 5188–5192. [Google Scholar] [CrossRef]
  29. Togo, A.; Oba, F.; Tanaka, I. First-principles calculations of the ferroelastic transition between rutile-type and CaCl2-type SiO2 at high pressures. Phys. Rev. B 2008, 78, 134106. [Google Scholar] [CrossRef] [Green Version]
  30. Togo, A.; Tanaka, I. First principles phonon calculations in materials science. Scripta Mater. 2015, 108, 1–5. [Google Scholar] [CrossRef] [Green Version]
  31. Van Alboom, A.; Lemmens, B.; Breitbach, B.; De Grave, E.; Cottenier, S.; Verbeken, K. Multi-method identification and characterization of the intermetallic surface layers of hot-dip Al-coated steel: FeAl3 or Fe4Al13 and Fe2Al5 or Fe2Al5+x. Surf. Coat. Technol. 2017, 324, 419–428. [Google Scholar] [CrossRef]
  32. APEX3, SAINT and SADABS; Software for Data Reduction, Absorption Correction and Structure Solution; Bruker AXS Inc.: Madison, WI, USA, 2015.
  33. Sheldrick, G.M. SHELXT-Integrated space-group and crystal-structure determination. Acta Crystallogr. A 2015, 71, 3–8. [Google Scholar] [CrossRef] [Green Version]
  34. Sheldrick, G.M. Crystal structure refinement with SHELXL. Acta Crystallogr. C 2015, 71, 3–8. [Google Scholar] [CrossRef] [PubMed]
  35. Brandenburg, K.; Putz, H. Diamond; Crystal Impact GbR: Bonn, Germany, 2017. [Google Scholar]
  36. Mouhat, F.; Coudert, F.X. Necessary and sufficient elastic stability conditions in various crystal systems. Phys. Rev. B 2014, 90, 224104. [Google Scholar] [CrossRef] [Green Version]
  37. Pang, M.J.; Zhan, Y.Z.; Wang, H.Z. Ab initio investigation into the structural, electronic and elastic properties of AlCu2TM (TM= Ti, Zr and Hf) ternary compounds. Curr. Appl. Phys. 2012, 12, 957–962. [Google Scholar] [CrossRef]
  38. Huang, Y.C.; Li, Y.; Xiao, Z.B. First-Principles Study of Structure, Elastic and Electronic Properties of Precipitates Al3Fe, Al6Mn and Mg2Si in Al-Mg Alloys; Szewczyk, R., Jiang, Z.Y., Huang, Y.J., Eds.; International Workshop on Materials Science and Engineering (IWMSE): GuangZhou, China, 2016; pp. 876–883. [Google Scholar]
  39. Chen, X.Q.; Niu, H.Y.; Franchini, C.; Li, D.Z.; Li, Y.Y. Hardness of T -carbon: Density functional theory calculations. Phys. Rev. B. 2011, 84, 121405. [Google Scholar] [CrossRef] [Green Version]
  40. Finzel, K. ELF and Its Relatives-A Detailed Study about the Robustness of the Atomic Shell Structure in Real Space. Int. J. Quantum Chem. 2014, 114, 1546–1558. [Google Scholar] [CrossRef]
  41. Ptashkina, E.A.; Kabanova, E.G.; Tursina, A.I.; Yatsenko, A.V.; Kuznetsov, V.N. Synthesis and crystal structure of a new Cu3Au-type. Acta Cryst. C 2018, 74, 295–299. [Google Scholar] [CrossRef] [PubMed]
  42. Balagurov, A.M.; Bobrikov, I.A.; Sumnikov, S.V.; Golovin, I.S. Neutron Diffraction study of coherent atomic ordering in Fe3Al-type alloys. Acta Mater. 2018, 153, 45–52. [Google Scholar] [CrossRef]
  43. Freiburg, C.; Grushko, B. An Al13Fe4 phase in the Al-Cu-Fe alloy system. J. Alloys Compd. 1994, 210, 149–152. [Google Scholar] [CrossRef]
  44. Mihalkovič, M.; Widom, M. Structure and stability of Al2Fe and Al5Fe2: First-principles total energy and phonon calculations. Phys. Rev. B 2012, 85, 014113. [Google Scholar] [CrossRef] [Green Version]
  45. Becker, H.; Leineweber, A. Atomic channel occupation in disordered η-Al5Fe2 and in two of its low-temperatures phases, η″ and η‴. Intermetallics 2018, 93, 251–262. [Google Scholar] [CrossRef]
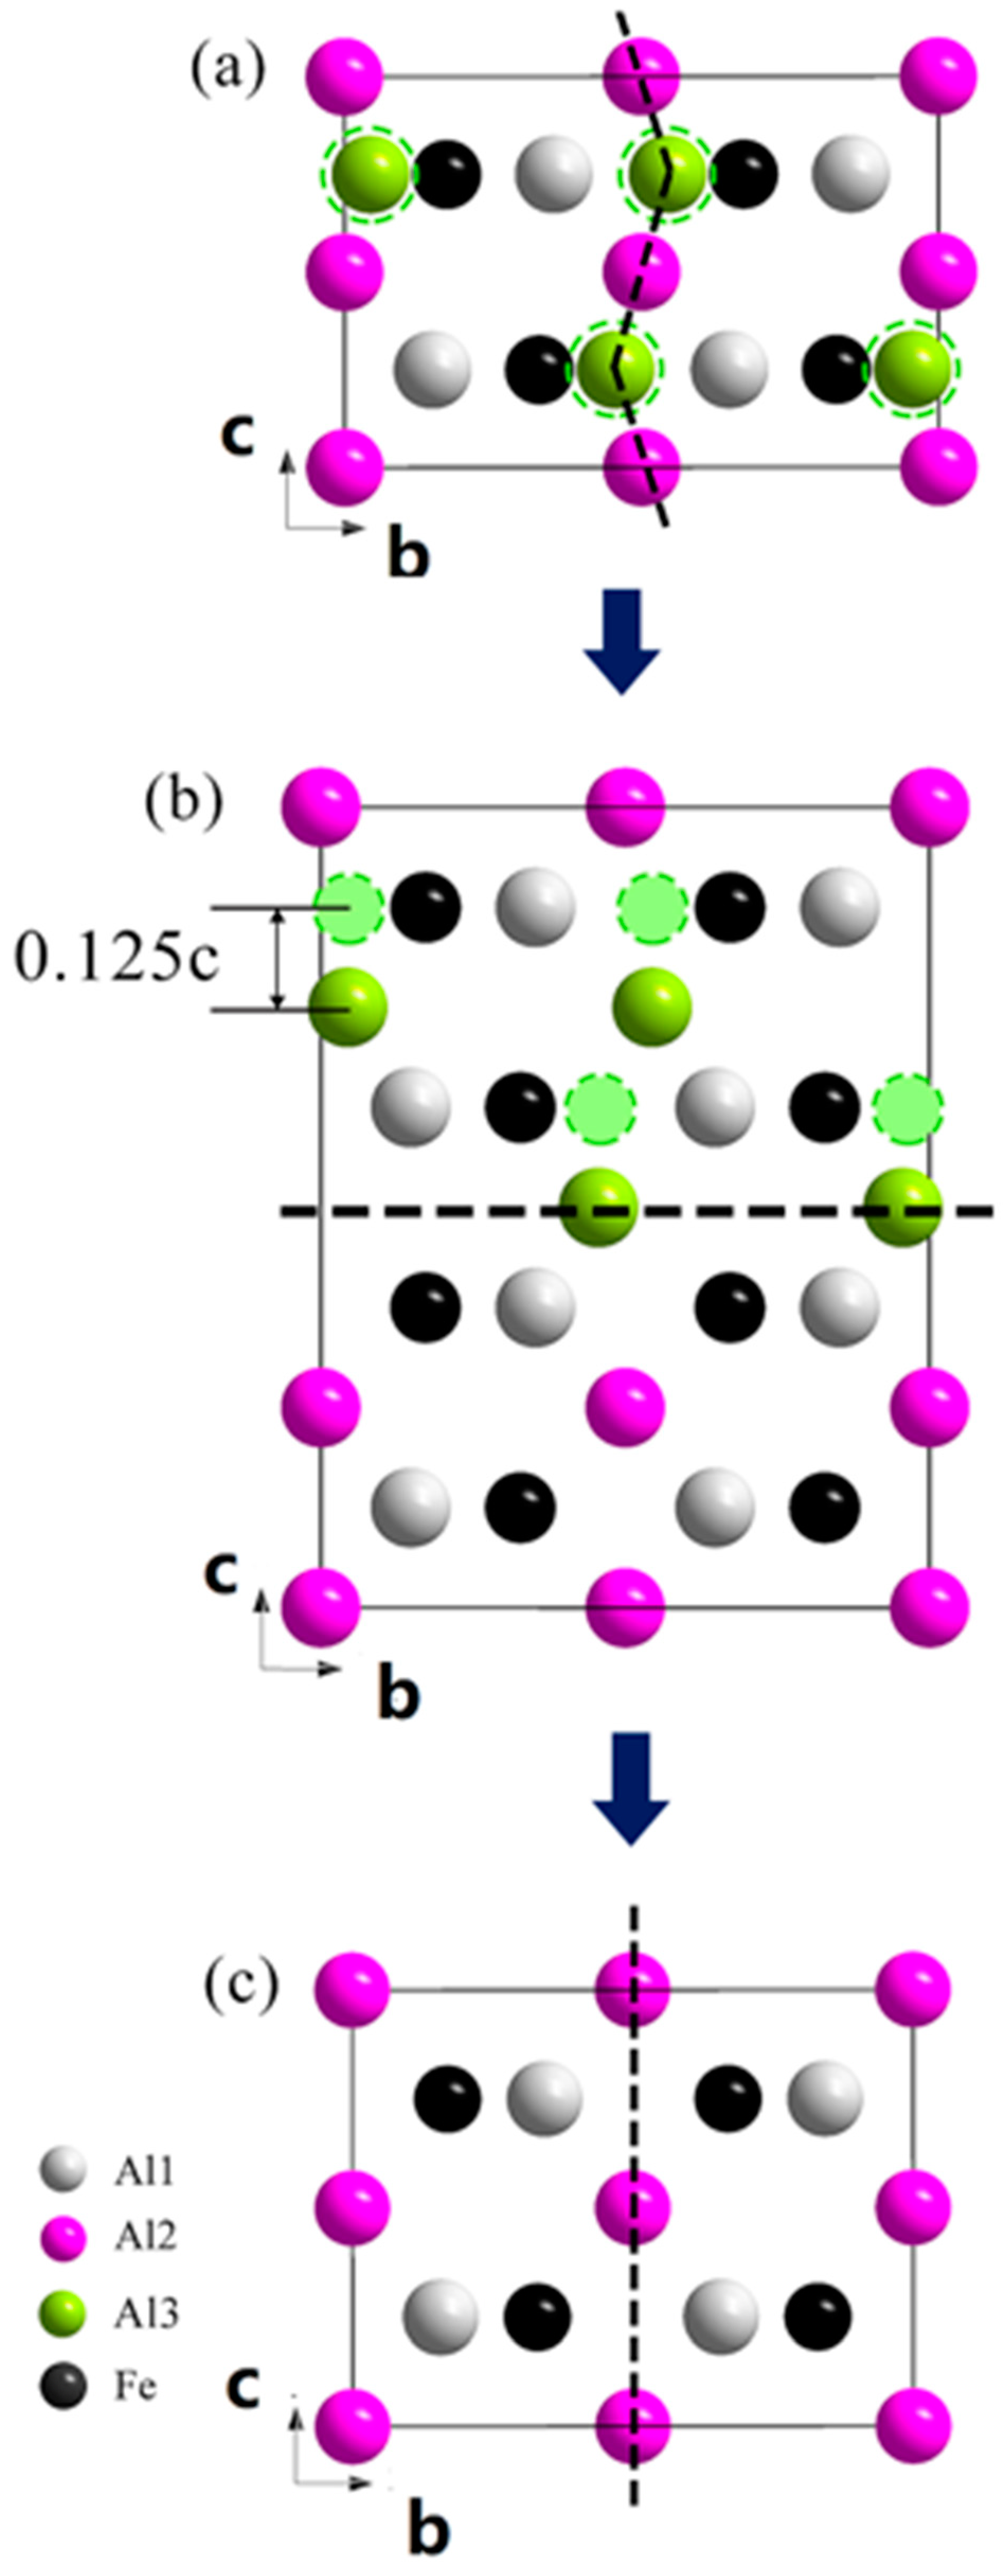
Figure 1. Scanning Electron Microscope (SEM) micrographs of the measured fragment of single crystal sample. EDS analysis were performed on different sites corresponding to those listed in Table 3.
Metals 09 01322 g001
Figure 2. (a) Projection of the Al3Fe phase along the [001] direction; (b) Projection of Al3Fe phase in the [100] direction: 1 × 1 × 4 supercell with the zigzag distributed Al2 and Al3 atoms; (c) The icosahedron chain with Al3 atoms centered at the 4a site. (Reproduced from [35], with permission from Crystal Impact GbR).
Metals 09 01322 g002
Figure 3. Construction of the Al3Fe ideal model projected in the [100] direction: (a) The unit cell of the disordered Al3Fe phase; (b) the 1 × 1 × 2 supercell of the disordered Al3Fe phase by removing the Al3 and Al2 atoms in the lower and upper part, respectively, and the vertical positions of Al3 atoms were slightly adjusted; (c) The final optimized unit cell of the ideal Al3Fe model by first-principles calculations.
Metals 09 01322 g003
Figure 4. Simulated powder diffraction patterns for the refined disorder Al3Fe phase and the proposed ordered stoichiometric Al3Fe phase.
Metals 09 01322 g004
Figure 5. (a) Phonon dispersion curves (b) Brillouin zone path in the reciprocal space of the primitive cell of the proposed Al3Fe phase.
Metals 09 01322 g005
Figure 6. (a) Band structures (b) Total and partial density of states (DOS) of the Al3Fe phase.
Metals 09 01322 g006
Figure 7. Selected electronic localization function (ELF) slices of the Al3Fe phase (a) (100) and (b) (001) along with the corresponding involved atoms: (c) Projected from the [100] direction of a supercell and (d) a perspective view of a unit cell.
Metals 09 01322 g007
Table 1. Detailed data collection, processing, and structural refinement parameters for Al3Fe.
Chemical FormulaAl6Fe2
Crystal system, space groupOrthorhombic, Cmcm
Temperature/K 293(2)
a, b, c/Å7.6474 (7), 6.4097 (6), 4.2114 (4)
α, β, γ/°90, 90, 90
V/Å3, 206.43 (3)
Z2
DiffractometerBruker D8 Venture Photon 100 COMS
Radiation typeMo-Kα, λ = 0.71073 (Å)
Scan modeφ and ω scan
Absorption correction Multi-scan
μ/mm−1
No. of measured, independent and
observed [I > 2σ(I)] reflections
8.09
2896, 186, 167
Rint
(sin θ/λ)max−1)
0.039
0.713
R[F2 > 2σ(F2)], wR(F2), S
No. of reflections
No. of parameters
Δρmax, Δρmin (e Å−3)
0.031, 0.090, 1.26
186
17
0.70, −1.63
Table 2. The atomic positions of the refined disordered stoichiometric Al3Fe phase.
LabelSitexyzOcc.Ueq,Uiso
Al18g0.6875(3)0.8524(3)3/41.0000.0132(6)
Al24c1/20.544(2)3/40.431(13)0.059(4)
Al34a1/21/21/20.569(13)0.059(4)
Fe44c1/20.17212(19)3/41.0000.0071(5)
Table 3. The chemical compositions of the measured fragment of single crystal sample analyzed by the EDS corresponding to sited marked in Figure 1.
RegionSpot1Spot2Spot3Area1Area2Area3
x(Al)/%70.52(±5.97)76.52(±5.45)71.42(±5.94)67.56(±6.21)69.34(±6.07)68.91(±6.10)
x(Fe)/%29.48(±2.25)23.48(±2.32)28.58(±2.35)32.44(±2.25)30.66(±2.26)31.09(±2.26)
Al:Fe2.393.262.502.082.262.22
Table 4. Calculated values of elastic constants Cij, Bulk modulus B, Shear modulus G, Young’s modulus E, hardness Hv (all in GPa) and Poisson’s Ratio σ, and B/G ratio for three Al–Fe phases.
Phases C11C22C33C44C55C66C12C13C23BGEσB/GHv
Al3Fe240249235935956775255121761880.241.6011.62
Al13Fe31501431396159548162559591330.121.0018.73
1 Al13Fe491671620.201.3513.36
1 From Reference [38].

