Article

Influence of the Chemical Composition of the Used Powder on the Fatigue Behavior of Additively Manufactured Materials †

1
Institute of Materials Science and Engineering, TU Kaiserslautern, 67663 Kaiserslautern, Germany
2
Institute for Mechanical and Automotive Design, TU Kaiserslautern, 67663 Kaiserslautern, Germany
3
Institute for Manufacturing Technology and Production Systems, TU Kaiserslautern, 67663 Kaiserslautern, Germany
*
Authors to whom correspondence should be addressed.
On the occasion of his 70th birthday, this work is dedicated to our mentor, colleague, and friend Prof. Dr.-Ing. habil. Dietmar Eifler.
Metals 2019, 9(12), 1285; https://doi.org/10.3390/met9121285
Submission received: 4 November 2019 / Revised: 27 November 2019 / Accepted: 27 November 2019 / Published: 29 November 2019
(This article belongs to the Special Issue Additive Manufacturing of Metals with Lasers)

Abstract

:
To exploit the whole potential of Additive Manufacturing (AM), a sound knowledge about the mechanical and especially cyclic properties of AM materials as well as their dependency on the process parameters is indispensable. In the presented work, the influence of chemical composition of the used powder on the fatigue behavior of Selectively Laser Melted (SLM) and Laser Deposition Welded (LDW) specimens made of austenitic stainless steel AISI 316L was investigated. Therefore, in each manufacturing process two variations of chemical composition of the used powder were utilized. For qualitative characterization of the materials cyclic deformation behavior, load increase tests (LITs) were performed and further used for the physically based lifetime calculation method (PhyBaLLIT), enabling an efficient determination of stress (S)–number of cycles to failure (Nf) curves (S–Nf), which show excellent correlation to additionally performed constant amplitude tests (CATs). Moreover, instrumented cyclic indentation tests (PhyBaLCHT) were utilized to characterize the materials’ defect tolerance in a comparably short time. All material variants exhibit a high influence of microstructural defects on the fatigue properties. Consequently, for the SLM process a higher fatigue lifetime at lower stress amplitudes could be observed for the batch with a higher defect tolerance, resulting from a more pronounced deformation induced austenite–α’-martensite transformation. In correspondence to that, the batch of LDW material with an increased defect tolerance exhibit a higher fatigue strength. However, the differences in defect tolerance between the LDW batches is only slightly influenced by phase transformation and seems to be mainly governed by differences in hardening potential of the austenitic microstructure. Furthermore, a significantly higher fatigue strength could be observed for SLM material in relation to LDW specimens, because of a refined microstructure and smaller microstructural defects of SLM specimens.

Graphical Abstract

1. Introduction

Considering new manufacturing technologies, Additive Manufacturing (AM) is one of the most promising and innovative processes. Because of the extremely high degree of freedom in design, AM enables very complex geometries, far beyond the possibilities of conventional manufacturing processes. Moreover, the possibility of a local modification of the materials’ properties is given by this manufacturing technology, due to the layer-by-layer deposition of material. These advantages offer a high potential in production of safety relevant and highly loaded structural components. However, to use AM technology for such applications, a sound knowledge about the microstructure and the resulting mechanical and especially cyclic properties of AM materials is indispensable. Furthermore, their dependency on the manufacturing parameters has to be thoroughly investigated.
In additive manufacturing of metallic materials, many different manufacturing processes exists, which are divided by the ISO/ASTM (American Society for Testing and Materials) standard 52900 [1] into Powder Bed Fusion (PBF) and Direct Energy Deposition (DED) processes. In DED processes, the material is delivered as wire or powder into the focus of the laser beam, while in PBF processes the already applied powder is locally exposed layerwise. The selection of the appropriate AM process depends on many factors (e.g. material, geometry, surface quality, etc.), which is discussed for PBF processes in [2].
In recent decades, the microstructures of AM materials have been widely studied. As shown by Casati et al. [3] on Selectively Laser Melted (SLM: PBF) and Yu et al. [4] on Laser Metal Deposited (LMD: DED) AISI 316L, Brandl et al. [5] on Laser Deposition Welded (LDW: DED) and Lewandowski et al. [6] on SLM Ti6Al4V as well as Takata et al. [7] on SLM AlSi10Mg, AM materials show a grain elongation along the building direction caused by the directed heat flux into the already solidified material. These results are confirmed by Mower et al. [8] on Direct Metal Laser Sintered (DMLS: PBF) 316L and SLM AlSi10Mg as well as Yasa et al. [9] on SLM 316L, who further reported a visibility of the layer boundaries in light optical micrographs as well as a grain growth beyond these boundaries, which is in accordance with [3,4,5,7].
This special and characteristic microstructure of AM materials leads to anisotropic mechanical properties, which depend on the building direction in the AM process and hence, the orientation of the layer planes to the loading direction. In the investigations of PBF processes of Yadollahi et al. [10] on 17-4-PH, Casati et al. [3] on 316L, Buchbinder et al. [11] on AlSi10Mg as well as Mower et al. [8] on all these materials, a higher strength of specimens with layer plane orientation parallel to the loading direction (horizontal building direction) than of specimens with a layer orientation perpendicular to the loading axis (vertical building direction) was reported. This correlates to the results of Yu et al. [4] on LMD 316L and Alcisto et al. [12] on Direct Metal Deposited (DMD: DED) Ti6Al4V and is confirmed by the overview works of Lewandowski et al. [6] and Shamsaei et al. [13] as well as consistent to our own results on 316L [14,15,16]. Moreover, the authors of [4,6,8,13,17,18] demonstrated comparable and even higher tensile and 0.2% yield strength of AM materials in relation to conventionally manufactured specimens.
Compared to the thorough investigation of the monotonic properties, the extent of investigations on the fatigue behavior of AM materials is rather limited. However, Yadollahi et al. [10] on SLM 17-4-PH, Brandl et al. [19] on SLM AlSi10Mg, Shamsaei et al. [13] on DMD Ti6Al4V, Mower et al. [8] on DMLS 316L and Rigon et al. [20] on SLM maraging steel 18Ni300 showed a higher fatigue strength of horizontally built specimens compared to a vertical building direction, which corresponds to the observations for monotonic loading. Note that Rigon et al. [20] additionally reported a higher fatigue strength of vertical building direction for another batch of used powder, indicating a significant influence of the used powder on the resulting mechanical properties. This corresponds to the work of Zhang et al. [21] who also showed a higher fatigue strength in vertical building direction for SLM 316L.
Besides the dependency on the building direction, the works of Günther et al. [22] on SLM Ti6Al4V as well as Xue et al. [23] on Laser Engineered Net Shaped (LENS: DED) 316L demonstrated a strong influence of microstructural defects on the fatigue behavior of AM materials, which correlates to the results given in [8,10,21], our own works on 316L [14,15,16] and the overview work of Fotovvati et al. [24] on SLM Ti6Al4V. Furthermore, a generally lower fatigue strength of AM materials in comparison to conventionally manufactured materials is reported in literature, which is mainly caused by microstructural defects and resulting notch effects [8,10,15,17,22]. These defects are pores [8,10,14,15,16,21] as well as nonmetallic inclusions [15,21].
The influence of these microstructural defects have been investigated on a general level for conventionally manufactured materials by Murakami et al. [25,26,27], who showed that such defects have a major impact on the fatigue lifetime. Their results demonstrate a significant influence of the size and location of the defect. Based on these results, the √area concept was established, which allows the determination of the materials fatigue strength σw by considering the critical defect. Furthermore, this concept enables the rating of the materials defect tolerance by using modified σa/σwNf curves as shown in [14,16,28].
The limited scope of fatigue investigations on AM materials is mainly caused by the high material and time effort of fatigue testing. This effort can be reduced by using the short-time procedures load increase test (LIT), PhyBaLLIT and PhyBaLCHT, as shown in [14,16,29,30,31,32]. The LIT enables a qualitative determination of the material’s cyclic deformation behavior as well as an estimation of the lower limit of the high cycle fatigue (HCF)-regime [14,15,16,32] in a comparably short time. Moreover, Jost et al. [30,31] were able to predict the temperature interval of dynamic strain aging effects as well as the influence of thermomechanical loadings on cyclic deformation behavior by modification of this method. As shown in [14,16,30,31,32], the information of one LIT and two additionally performed constant amplitude tests (CATs) can be used to calculate S–Nf curves by using the PhyBaLLIT approach. While LIT and PhyBaLLIT describes the cyclic deformation behavior, the PhyBaLCHT method, which is based on cyclic indentation tests, enables an efficient characterization of the material’s defect tolerance as shown in [14,15,16,28].
Fatigue investigations on conventionally manufactured AISI 316L were already performed by Polak et al. [33], who mainly observed cyclic softening in the HCF-regime due to formation of dislocation structures, which correlates to the results of Man et al. [34]. In contrast to that, in [15] a pronounced cyclic hardening in the HCF-regime could be observed for conventionally manufactured 316L, which is caused by pronounced austenite–α’-martensite transformation. These pronounced differences in cyclic deformation behavior of nominally equivalent materials can be explained with differences in chemical composition and hence, in austenite stability as shown in [15]. Furthermore, Hong et al. [35] reported that the SLM microstructure leads to a higher austenite stability due to higher density of low-angle grain boundaries. However, in this work also small amounts of phase transformation could be observed in SLM 316L after monotonic loading. Moreover, in our own investigations on additively manufactured 316L low amounts of phase transformation could be observed after cyclic loading [14,15,16]. As shown in the results reported in [14,15,16,36,37], plastic deformation induced austenite–α’-martensite transformation leads to a reduction of locally increased stresses and, due to a volume expansion, to local compressive residual stresses, resulting in a decelerated crack growth. Consequently, a phase transformation in additively manufactured materials can lead to an enhanced fatigue lifetime by reduction of the process induced microstructural notch effects, leading to an improved defect tolerance [14,15,16].
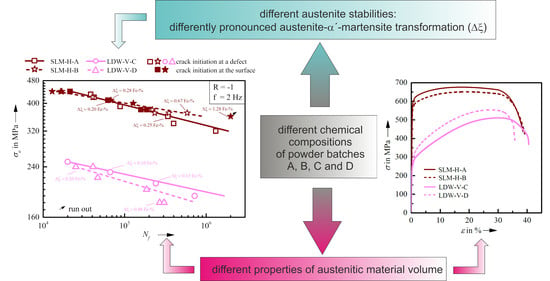
Because of the influence of austenite–α’-martensite transformation on the fatigue behavior of AISI 316L and due to the high density of microstructural notches in AM materials, the influence of different austenite stabilities on the cyclic deformation behavior and defect tolerance was investigated in the presented work. Therefore, LDW and SLM specimens were manufactured with different batches of powder, respectively. Note that the powders used in each of these manufacturing processes only differ in chemical composition, while the powder used in an SLM process is significantly finer compared to that used in the LDW process. In the SLM process, a horizontal building direction was used for both batches and in the LDW process the specimens were manufactured vertically. Consequently, the presented results are not one-to-one comparable between SLM and LDW, because of different building directions and powder grades. However, the presented work focuses the influence of chemical composition and not of the used manufacturing process, on the fatigue behavior. To determine the influence of the chemical composition on cyclic deformation behavior qualitatively, LITs were performed. Moreover, PhyBaLLIT was utilized to calculate the S–Nf curves of the different batches, which were validated by additional CATs. Furthermore, some CATs were conducted at elevated temperature for SLM specimens, to explicitly exclude the influence of phase transformation on the fatigue behavior. Thus, the influence of phase transformation on the defect tolerance can be analyzed. For characterization of the materials defect tolerance the short-time method PhyBaLCHT was used and compared to the results obtained in CATs with √area concept.

2. Materials and Methods

2.1. Material

For the investigation of the influence of variation in chemical composition of the used powder on the mechanical properties, selective laser melting (SLM) as well as laser deposition welding (LDW) specimens were investigated. The used manufacturing systems and parameters are given in Table 1. While in the SLM process a nitrogen inert gas atmosphere was used for oxidation prevention, a nitrogen inert gas flow was utilized in the LDW process. For each manufacturing process two batches of powder, which only differ in chemical composition, were used to investigate the influence of chemical composition on the fatigue behavior. Note that the powder used in the SLM process is significantly finer compared to the LDW process (see Table 1). Consequently, four different batches of powder were investigated in the presented study: SLM-H-A, SLM-H-B, LDW-V-C and LDW-V-D. To exclude the influence of anisotropy, the building direction was kept identical in each manufacturing process. In the SLM process, bars with a diameter of 14 mm were manufactured with an orientation of the longitudinal axis parallel to the built plate, leading to horizontally built specimens for tensile and fatigue tests. In the LDW process, bars with a diameter of 13 mm were manufactured perpendicular to the built plate, resulting in vertically built specimens.
As shown in [14,15,16,35] the investigated AISI 316L can be metastable at ambient temperature (AT), which is significantly influenced by the chemical composition of the material. Therefore, the chemical composition of the fatigue specimens was determined with spectrophotometry on the fatigue specimens’ clamping shaft. Based on this, the austenite stability was rated by Md30-temperatures (see Table 2), determined in accordance with Angel [38] (see Equation (1)). Note that Md30 represents the temperature, that leads to a transformation of 50% of initial austenite to α’-martensite at a plastic strain of 30%. Consequently, a higher Md30 represents a lower austenite stability.
Md30, Angel = 413 − 462 (C + N) − 9.2Si − 8.1Mn − 13.7Cr − 9.5Ni − 18.5Mo
The SLM specimens show only small differences in chemical composition, i.e. Chromium and Carbon content, leading to slightly lower austenite stability of batch B (SLM-H-B). The LDW batches show more pronounced differences in chemical composition and hence, austenite stability. Due to the lower Chromium and especially Nickel content, batch D (LDW-V-D) show 41.6 K higher Md30, Angel compared to batch C (LDW-V-C) and hence, noticeably lower austenite stability. However, the investigated materials show comparably high austenite stabilities and hence, only low amounts of phase transformation are expected (compare [15]).
Despite the variation of chemical composition, no significant differences in the grain structure can be identified between SLM-H-A and SLM-V-B (see Figure 1a–d) as well as between LDW-V-C and LDW-V-D (see Figure 1e–h). Note that the light optical micrographs (LOMs) and the electron backscatter diffraction (EBSD) orientation maps were taken for SLM specimens on cross sections and for LDW specimens on longitudinal sections of the fatigue specimens’ clamping shafts. Consequently, the vertical axes of the images are parallel to the building direction.
When comparing SLM and LDW specimens, a significantly bigger layer thickness can be observed for LDW material, resulting in lower cooling rates and consequently, larger grains. The microstructures of SLM and LDW material show in correlation to [3,4,8,9] a grain elongation along the building direction and a grain growth beyond the melt pool boundaries and thus, a characteristic AM microstructure.
Beside the unique microstructure, AM materials show microstructural defects like pores or nonmetallic inclusions [8,10,15,22,40]. Therefore, the porosities of the investigated materials were analyzed by LOMs and the results are given in Table 3, showing a low level of porosity, which is similar for all specimens.
While the SLM material shows only pores, the LDW specimens additionally exhibit, in accordance with [15], nonmetallic SiMn oxide inclusions (see Figure 2). These inclusions are significantly bigger compared to the observed pores and result out of a temporary incomplete coverage by protecting gas flow of the melt pool. Because of the extensively bigger size, a higher influence of the SiMn oxides on the fatigue behavior of LDW material is expected compared to microstructural porosity.
To rate the influence of these microstructural defects on the materials fatigue properties, the √area concept was utilized. Therefore, the macro hardness of the different specimens had to be determined, showing higher hardness of SLM material compared to LDW material, which correlates to the significantly higher cooling rates in the SLM process (see Table 3). However, the different batches show comparable macro hardness for each manufacturing process.
Because fatigue investigations were also performed for SLM specimens at elevated temperature T = 100 °C, the SLM specimens’ macro hardness was also determined at 100 °C for application of √area concept. As expected, the increased temperature leads to a significant decrease of materials’ hardness, which is more pronounced for SLM-H-B.

2.2. Experimental Methods

LOMs were carried out with a Leica DM 6000 M device (Leica, Mannheim, Germany) and used for determination of the porosity. Note that analyzing the porosity with LOMs might lead to deviation to actual values, because of a two-dimensional rating of a three-dimensional phenomenon. However, for comparison of the porosities of different specimens, it can be used adequately. For visualization of the grain structure a V2A etchant (ATM GmbH, Mammelzen, Germany) was applied for SLM samples and for LDW material an Adler (ATM GmbH, Mammelzen, Germany) etchant was used.
The scanning electron microscope (SEM) investigations, including the EBSD mappings as well as energy dispersive X-ray spectroscopy (EDS), were conducted with a FEI Quanta 600 device (FEI, Hillsboro, OR, USA). For focused ion beam (FIB) analyzes a dual beam FIB of type Tescan GAIA 3 (Tescan, Libušina, Czech Republic) was used.
To determine the material’s cyclic properties on a local level, the PhyBaLCHT method, which is explained in more detail in [14,15,29,41], was utilized. Therefore, instrumented cyclic micro-indentation tests were performed on a Fischerscope H100 C device (Helmut Fischer GmbH, Sindelfingen, Germany). In cyclic indentation tests, the material is cyclically loaded by a Vickers indenter with a frequency of f = 1/12 Hz for 10 cycles. Due to continuous detection of the indentation force F and indentation depth h, an F-h hysteresis loop can be observed from the 2nd cycle. In analogy to the stress–strain hysteresis in uniaxial fatigue tests, the half width of F-h hysteresis is defined as plastic indentation depth amplitude ha,p. With resulting ha,pN curves the materials deformation behavior in cyclic indentation tests can be described.
From the 5th cycle the ha,pN curves show a stabilized slope, indicating that significant macro plastic deformation becomes saturated and micro plastic deformation dominates the deformation behavior. Thus, the regime from the 5th cycle is used to determine the materials fatigue properties. Furthermore, the ha,pN curves in Figure 5 can be approximated from the 5th cycle by a straight line. Note that Figure 5 is shown in double logarithmic scale, and hence, this regime of ha,pN curve can be described mathematically by a power law function, which is called ha,p II (see Equation (2) [29]).
h a , p   I I =   a I I · N e I I
The steeper the slope of the ha,pN curve, the higher is the amount of hardening processes that occur during cyclic indentation tests. Thus, a steeper slope indicates a higher hardening potential and hence, a higher ability of the material to counteracting locally increased stresses, leading to an increased defect tolerance [14,16,28,29,41]. Because eII represents the slope of ha,pN curve from the 5th cycle (see Equation (2) and Figure 5), it is used to rate the materials’ defect tolerance [14,16,28,29,41]. Consequently, a higher |eII| represents a higher defect tolerance. In addition to the results obtained from ha,pN curves, the first cycle of cyclic indentation tests can be used to determine the materials micro hardness (Martens Hardness: HM).
The macro hardness was determined with a Zwick/Roell ZHU250 (Zwick Roell, Ulm, Germany) table top device by using a Vickers indenter. For hardness measurements at elevated temperature, the specimens were heated up to 100 °C and the temperature was held constant during the hardness measurement.
To further investigate the monotonic properties of the differently manufactured specimens, tensile tests were carried out at AT on a Zwick/Roell Z250 electromechanical testing device (Zwick Roell, Ulm, Germany) in accordance with DIN EN ISO 6892-1 [42]. The rotationally symmetric tensile specimens had a gauge length of 50 mm with a diameter of 8 mm. For SLM material a minimum number of 5 specimens for each batch were investigated, whereas for LDW only 2 specimens of each batch were tested.
To characterize the materials cyclic deformation behavior at uniaxial loading condition, load increase tests (LITs) as well as constant amplitude tests (CATs) were performed in stress control with a stress ratio R = −1 and a frequency of f = 2 Hz. The LITs of LDW specimens were started at a stress amplitude of σa,start = 100 MPa, which was stepwise increased by Δσa = 10 MPa after an interval of ΔN = 4500 cycles. Because of the higher strength of SLM specimens, their LITs were performed with σa,start = 100 MP, Δσa = 20 MPa and ΔN = 9000. During the fatigue tests, the stress–strain hysteresis loops were measured by means of a strain gage based extensometer, enabling the determination of plastic strain amplitude εa,p, resulting in cyclic deformation curves.
By using the cyclic deformation curves of one LIT and two CATs the S–Nf curves could be determined efficiently with PhyBaLLIT. This approach is mainly based on the works of Morrow [43] and Basquin [44] and is described shortly in the following and in more detail in [14,16]:
As shown by Basquin, the S–Nf curve (see Equation (3) [44]) and by Morrow, the cyclic σaεa,p curve (see Equation (4) [43]) can be described by a power law function, respectively. Furthermore, the works of Morrow demonstrate that the slope of cyclic σaεa,p curve, represented by the cyclic hardening exponent n’, is related to the slope of S–Nf curve in the HCF-regime, which is represented by the fatigue strength exponent b (see Equation (5) [43]).
σ a = σ ´ f ( 2 N f ) b
σ a = K f · ε a , p n
  b = n 5 n + 1
In PhyBaLLIT the cyclic σaεa,p curve of one LIT is determined and transferred into constant amplitude loading, because Equation (5) is only valid for constant amplitude loading conditions. Therefore, two additionally CATs were performed in the HCF-regime and the characteristic εa,p values were defined at 0.5xNf, respectively. To determine the cyclic σaεa,p curve for constant amplitude loading, the cyclic σaεa,p curve of the LIT was transferred via linear interpolation, based on characteristic εa,p values of both CATs. Afterwards, the slope of S–Nf curve can be determined by using Equation (5) and hence, the fatigue strength exponent σf can be calculated by using and the values of σa and Nf of one CAT. For this, the CAT at higher σa is utilized, to minimize the influence of lifetime scatter, which increases with decreasing σa [14,16].
As shown by Man et al. [34], elevated temperatures lead to a reduction of deformation induced austenite–α’-martensite transformation. Therefore, the relatively low frequency of f = 2 Hz was used to avoid excessive self-heating of the fatigue specimens in order of plastic deformation, leading to maximum temperatures below 50 °C in all fatigue tests conducted in the presented work. However, to exclude the influence of phase transformation on the cyclic deformation behavior, CATs were additionally performed at T = 100 °C for SLM specimens. For heating, a resistance furnace was used with a closed loop control of temperature based on a type K ribbon thermocouple placed in the middle of the gauge length.
For manufacturing of the fatigue specimens, the additively manufactured bars were turned to final specimen geometry (see Figure 3), which is in accordance to the standard DIN 50100 [45]. Additionally, the specimens’ gauge length was polished to explicitly exclude the influence of AM surface conditions and thus, the mechanical properties of the material’s volume were investigated.
For quantification of the amount of phase transformation, the magnetic fraction ξ in the specimens’ gauge length was measured before and after the tensile and fatigue tests with a FERITSCOPE™ MP 30E (Helmut Fischer GmbH, Sindelfingen, Germany) device. An increase of magnetic fraction Δξ correlates to a transformation from paramagnetic fcc austenite to ferromagnetic bcc α’-martensite.

3. Results and Discussion

3.1. Monotonic Properties

The results of tensile tests exhibit a rather weak influence of the chemical composition on the monotonic properties (see Figure 4 and Table 4). For SLM specimens batch B exhibit a slightly lower tensile strength Rm and 0.2% yield strength Rp0.2 than batch A, whereas the elongation at fracture A, reduction of area Z as well as Young’s modulus E are similar for both batches.
With regard to the results of LDW specimens, higher Rm and Rp0.2 can be observed for batch D, compared to LDW-V-C. Furthermore, batch D shows a significantly lower elongation at fracture as well as Z and hence, lower ductility. Note that for LDW specimens the measured stress–strain curves as well as the low number of specimens disable a valid determination of Young’s modulus and consequently Rp0.2. However, the transition from elastic to plastic deformation shown in Figure 4b, indicates a slightly higher resistance against plastic deformation of batch D, which corresponds to the results given in Table 4.
Because of the differences in austenite stability, it could be concluded that the differences in monotonic properties result out of phase transformation effects. However, the measurements of Δξ show no austenite–α’-martensite transformation (see Table 4). Furthermore, the phase distributions in the gauge length of tested tensile specimens, which have been determined by EBSD measurements, show no ε-martensite for all specimens. Consequently, phase transformation does not influence the monotonic properties.
Because of the different building directions, the results of the two different manufacturing processes are not one-on-one comparable [3,4,6,8,10,11,12]. However, the SLM specimens show significantly higher Rm and Rp0.2, indicating that SLM process lead to higher monotonic strength (see Figure 4 and Table 4), which correlates to [15] and is caused by the significantly higher cooling rates in the SLM process, resulting in a smaller grain size. Moreover, the different sizes of powder particles used in the SLM and LDW processes, respectively, have to be considered, because of the results of Spierings et al. [46] on SLM AISI 316L, who showed decreasing Rp0.2 and Rm with increasing average particle diameter from 50 µm to 90µm.

3.2. Cyclic Indentation Tests (PhyBaLCHT)

In cyclic indentation tests, nearly identical results can be observed for the different batches of SLM material. Both batches show similar ha,pN curves as well as eII values (see Figure 5 and Table 5). However, the level of ha,p values of SLM-H-B is insignificantly higher compared to SLM-H-A, indicating slightly more pronounced plastic deformation. In contrast to the results obtained in macro hardness measurements, the HM values show slight differences, i.e. higher values for SLM-H-A, which correlates to tensile tests (compare Table 4 and Table 5). The more pronounced difference in HM compared to HV is caused by the higher resolution of the local mechanical properties of micro hardness measurements.
In contrast, the LDW specimens show significant differences in cyclic and monotonic properties. LDW-V-D exhibit a substantially higher level of plastic deformation than LDW-V-C, represented by higher ha,p. Furthermore, lower |eII| and hence, hardening potential can be observed for batch D (see Figure 5 and Table 5). Similar to SLM, the HM values of the LDW material show more pronounced differences compared to HV, resulting from higher resolution of local mechanical properties. HM of batch D is decreased compared to LDW-V-C, which is contrary to the Rp0.2 obtained in tensile testing (compare Table 4 and Table 5).
Because of the lower austenite stabilities, a higher hardening potential of batch B and D, respectively, could be assumed [14,15,16,29,36,37]. However, for SLM-H-B no difference and for LDW-V-D lower |eII| were observed (see Table 5). This leads to the assumption, that austenite stability has no influence on the results of cyclic indentation tests for the investigated materials. Therefore, the phase distribution beneath the indent has been determined by FIB investigations, showing no α’-martensite (see Figure 6). For this investigation, SLM-H-B was used, because it showed highest amount of phase transformation in fatigue tests (see Section 3.4) and has comparable Md30, Angel to LDW-V-D.
Because of the relatively high austenite stability of all investigated materials, the number of cycles applied during the cyclic indentation tests seems to be insufficient to induce phase transformation. Thus, the results of cyclic hardening exponentCHT eII are not influenced by austenite–α’-martensite transformation, which has to be considered for comparison of eII of differently manufactured specimens. Consequently, PhyBaLCHT enables a determination of the materials hardening potential and hence, defect tolerance without the influence of phase transformation effects.
In summary, the eII values indicate no differences in defect tolerance of the SLM batches, while for LDW material a higher defect tolerance can be expected for batch C (see Table 5).
The significantly higher hardening potential of the LDW compared to SLM material is mainly caused by differences in cooling rates. However, the difference in powder grade [46] as well as building direction of the specimens [14,16] can also influence the properties of the materials volume and hence, have to be considered.

3.3. Load Increase Tests (LITs)

In the LITs of the SLM specimens quite similar cyclic deformation curves can be observed for both investigated batches (see Figure 7a). However, batch A shows a higher stress amplitude at fracture and slightly lower level of plastic strain amplitude εa,p. Thus, a higher fatigue lifetime could be expected for batch A, especially at higher stress amplitudes.
Despite an increased level of plastic deformation at lower σa, a higher stress amplitude at fracture of batch C was observed for LDW material (see Figure 7b). Consequently, a higher fatigue lifetime at higher σa is indicated for LDW-V-C compared to LDW-V-D.
By comparison of the different manufacturing processes, significantly higher stress amplitudes at fracture were achieved for SLM specimens. Moreover, at lower σa (200 MPa < σa < 280 MPa) a nearly elastic deformation behavior is observed for SLM specimens, while the LDW material exhibit a substantial level of plastic deformation and consequently, a decreased fatigue strength is expected for LDW specimens. Furthermore, the difference in cyclic deformation curves between LDW-V-C and LDW-V-D is more pronounced compared to the differences of SLM-H-A and SLM-H-B.
Analogous to Section 3.1 and Section 3.2, these differences between the considered manufacturing processes can be explained by different, process-related cooling rates. Moreover, it is expected, that the difference in powder grade [46] as well as building direction [3,4,6,8,10,11,12,14,15,16] have an impact on the cyclic deformation behavior and, consequently, have to be taken into account.
As a summary, the LITs demonstrate only slight dependencies on the chemical composition and a lower fatigue performance of the batches with lower austenite stability. Furthermore, substantially higher fatigue performance could be expected for SLM specimens compared to LDW material. Note that in LITs, no increase of magnetic fraction could be observed, because of the relatively high austenite stability of SLM and LDW material. Consequently, an impact of phase transformation on LITs can be excluded and the difference in cyclic deformation curves are only influenced by the properties of the materials volume.

3.4. Cyclic Deformation Behavior and Calculated S–Nf Curve in the HCF-Regime

In Figure 8 the S–Nf curves, determined by PhyBalLIT, as well as the results of additionally performed CATs are shown for the differently manufactured specimens. The calculated S–Nf curves show an excellent correlation of the CATs and hence, represent the materials fatigue behavior in the HCF-regime, which is underlined by the relatively high correlation coefficients R²Morrow for calculated cyclic σaεa,p curves (see Table 6). Note that each data point in Figure 8 represents only one CAT.
For SLM specimens, the S–Nf curves as well as the CATs show a higher endurance for batch A at higher σa and a lower fatigue lifetime at lower σa compared to batch SLM-H-B, resulting in a steeper slope for SLM-H-A (compare Figure 8 and Table 6).
With regard to results obtained at LDW specimens, higher Nf can be observed for batch C in the whole HCF-regime. This trend becomes increasingly pronounced at lower stress amplitudes, leading to steeper slope in S–Nf curve of LDW-V-D compared to LDW-V-C (compare Figure 8 and Table 6).
Moreover, in the CATs a deformation induced phase transformation could be observed, indicated by an increase of magnetic fraction Δξ (see Figure 8). Hence, in contrast to the tensile tests, phase transformation occurs in fatigue testing, which also influences the fatigue properties and has to be considered.
The cyclic deformation curves obtained in CATs at SLM specimens exhibit a slightly higher amount of plastic deformation for SLM-H-B than SLM-H-A, which also correlates to the LIT results (compare Figure 7 and Figure 9). Furthermore, a more pronounced plastic deformation of LDW-V-C compared to LDW-V-D can be observed in CATs, which also corresponds to the LITs.
Despite the detected austenite–α’-martensite transformation, only cyclic softening can be observed in CATs. As shown in previous work on heat treated, vertically built SLM specimens from batch A (see Figure 10 and [16]), this is caused by a locally restricted phase transformation at crack initiation sites, which cannot be detected by integral stress–strain measurements. This locally restricted phase transformation does further lead to an inhibition of crack initiation as well as propagation and hence, to an increased fatigue lifetime, which correlates to [14,15,36,37], i.e. the phase transformation leads to an increased defect tolerance of the material.
The investigation of the fracture surfaces of the additively manufactured specimens, obtained in CATs, demonstrate a strong influence of microstructural defects on the fatigue properties (see Figure 8 and Figure 11). However, the SLM specimens also show crack initiation without any influence of microstructural defects, which is caused by the relatively low defect density in this material (see [14,16], Figure 8 and Table 3). Furthermore, the results in Figure 8 indicate an increasing influence of microstructural defects at lower σa for SLM material.
Contrary to the SLM specimens, the LDW material shows only crack initiation at microstructural defects, mainly oxide inclusions (see Figure 11c,d) but also lack of fusion.
The different slopes of S–Nf curves of different batches can be explained with the influence of microstructural defects. As shown in [14,16] a higher defect tolerance leads to a flatter slope of the S–Nf curve, because of an increasing influence of microstructural notches with decreasing stress amplitude. Note that this is valid for materials with comparable defect size, which also has an impact on the slope of S–Nf curve.
For the SLM material a similar defect tolerance could be expected for both batches, because of identical eII values (see Table 5). However, batch B shows a flatter slope in the S–Nf curve, indicating a higher defect tolerance. This is caused by the lower austenite stability of batch B (see Table 2), leading to a higher amount of austenite–α’-martensite transformation, which is more pronounced at lower stress amplitudes (see results of Δξ in Figure 8). Note that for the presented materials the influence of phase transformation cannot be determined with PhyBaLCHT and hence, cyclic hardening exponentCHT eII do not show any difference between SLM-H-A and SLM-H-B (compare to Section 3.2.).
The LDW specimens exhibit a more pronounced phase transformation at lower σa for batch D (see Figure 8), which has a lower austenite stability (see Table 2). Despite the more pronounced phase transformation, batch D shows a steeper slope in its S–Nf curve, due to the higher defect tolerance of batch C, demonstrated by greater |eII| (see Table 5). The higher defect tolerance of the materials volume of batch C seems to have a higher impact on the fatigue lifetime in relation to the more pronounced phase transformation of batch D, leading to a flatter slope of LDW-V-C.
By comparison of the different manufacturing processes, the SLM material show a significantly higher fatigue strength than the LDW specimens. This is caused by: i) the lower strength of the materials volume of LDW material (see LITs and tensile tests), resulting from different cooling rates and layer thickness, as well as ii) its significantly higher number and size of process induced defects. Note that the difference between SLM and LDW specimens should also be influenced by the different building directions [3,4,6,8,10,11,12,14,15,16] as well as powder particle sizes [46]. Nevertheless, with regard to the results obtained in [14,15] the influence of building direction is marginal compared to the difference observed between SLM and LDW in the presented paper.
Considering phase transformation, SLM-H-A shows in correlation to the lower austenite stability a bigger amount of phase transformation compared to LDW-V-C (compare Table 2 and Figure 8). However, despite the lowest austenite stability of LDW-V-D, SLM-H-B shows highest Δξ. This is presumably caused by the differences in defect size, which lead to locally different strains, despite the similar level of global plastic deformation of SLM compared to LDW specimens (see Figure 9b,d).
Finally, the influence of powder variation on the fatigue behavior is more pronounced for the LDW material, due to the higher difference in chemical composition, which is also obvious in LITs (compare Figure 7 and Figure 8).
In relation to already published results [15], the presented LDW specimens show comparable fatigue lifetime, which correlates to similar crack initiating defect types and sizes as well as amount of phase transformation. In contrast to that, the SLM specimens shown in [15] revealed decreased fatigue lifetime in the whole HCF-regime, which is caused by the significantly higher number and size of process-induced pores in [15]. Note that the chemical composition in [15] is different compared to the presented specimens, which leads to a more pronounced phase transformation compared to [15] and hence, beneficial effect on fatigue lifetime.
The works of Xue et al. [23], who performed total strain controlled fatigue tests with a strain Ratio Rε = −1 on polished 316L specimens manufactured by LENS, indicate a fatigue limit that is higher compared to LDW-V-D as well as LDW-V-C, which can be explained with significantly smaller crack initiating defects. By comparing the results of SLM specimens to [8] a higher fatigue strength can be obtained for the presented results. This is can be mainly explained by the lower surface roughness in the presented work compared to [8] because of polishing process.

3.5. Influence of Microstructural Defects and Austenite Stability on the Fatigue Behavior

To get a deeper insight into the influence of microstructural defects on the fatigue behavior of the differently manufactured specimens, the crack initiating defects were analyzed by using the √area approach according to [14,16,25,26,27]. Therefore, the size as well as the location of the defect is taken into account. Murakami distinguishes between three kinds of defects: i) internal defects (int.), ii) surface defects (sur.) and iii) subsurface defects (sub-s), where the latter show surface contact, but are mainly located in the volume of the material [25,26,27]. In the √area concept it is assumed, that the microstructural defects are equivalent to a fatigue crack, where √area represents the effective crack length. Thus, the stress amplitude, that do not lead to a propagation of this crack, can be defined as the fatigue strength σw, which can be determined for surface defects using Equation (6), for subsurface using Equation (7) and for internal defects using Equation (8) and is based on the threshold value for fatigue crack propagation of the material [25]. Consequently, for the following considerations, only defects, which lead to a stress intensity KI, max (determined according to [25]) higher than Kth, max reported by Riemer et al. [18] for SLM 316L, were taken into account. Moreover, only specimens, which underwent at least 5 × 10⁴ cycles to failure were used for the √area analyzes, to exclude the influence of massive plastic deformation.
On this baseline, the estimated fatigue strength σw is used to create a modified S–Nf curve by relating the applied σa to σw. These σa/σwNf curves allow a qualitative comparison of the defect tolerance of different material conditions. Note that higher σa/σw represents higher local stress intensities and consequently, larger σa/σw at similar Nf indicate a higher defect tolerance. The results, determined by means of √area approach are given in Table 7.
σ w , s u r . =   1.43 ( H V + 120 ) ( a r e a s s ) 1 6
σ w , s u b s =   1.41 ( H V + 120 ) ( a r e a s s ) 1 6
σ w , i n t . =   1.56   ( H V + 120 ) ( a r e a s i ) 1 6
The modified σa/σwNf curves in Figure 12 show for SLM-H-B significantly higher σa/σw values and consequently, a substantially increased defect tolerance compared to SLM-H-A, which confirms the assumptions made in Section 3.4. By analyzing the defect tolerance, two effects have to be considered: (i) the hardening potential of the austenitic materials volume and (ii) the local phase transformation. While PhyBaLCHT can only be used to describe the hardening potential of the materials volume, the √area concept enables the determination of the superimposition of hardening potential and phase transformation. Considering that, and the identical eII values of both batches, it is concluded, that the increase of defect tolerance of SLM-H-B is completely related to more pronounced austenite–α’-martensite transformation.
To determine the influence of phase transformation on the defect tolerance of SLM specimens, CATs were performed at 100 °C with a stress amplitude of 340 MPa, leading to an elimination of plastic deformation induced phase transformation. The results given in Table 8 demonstrate a comparable fatigue lifetime of SLM-H-A and SLM-H-B at elevated temperatures.
Moreover, the influence of the defects was analyzed by √area concept (see Table 8). Note that with increasing temperature, a decrease of the materials Kth, max is expected [47,48] and consequently, also defects with slightly smaller KI, max than the reported values of [18] were considered. For batch A only one and for SLM-H-B two specimens showed crack initiation at sufficiently extended microstructural defects. However, these specimens show significantly smaller differences in σa/σw values compared to results obtained at AT (compare Table 7 and Table 8). Thus, the increased fatigue lifetime of SLM-H-B at AT can be assigned mainly to enhanced phase transformation. This confirms, that PhyBaLCHT can be used for the presented materials to determine the defect tolerance without influences of phase transformation.
The LDW specimens show more complex relations of the σa/σwNf curves: At higher σa/σw batch D shows higher endurance, while at lower σaw a higher fatigue lifetime can be observed for LDW-V-C. Consequently, for LDW-V-D a higher defect tolerance at higher stress amplitudes and a lower defect tolerance at lower σa is indicated. While in PhyBaLCHT only the cyclic hardening potential of the austenitic phase was characterized, the modified σa/σwNf curves additionally contains the influence of phase transformation. This superimposition of hardening potential, which is higher for batch C, and phase transformation, which is more pronounced for batch D, results in an increased defect tolerance of LDW-V-D at higher σa and of LDW-V-C at lower stress amplitudes. This leads to a flatter slope of the S–Nf curve of batch C, because of an increasing influence of defects at lower stress levels.
With regard to the correlation coefficients of modified σa/σwNf curves (R²Mura.) and conventional S–Nf curves (R²conv.), a higher correlation is demonstrated for the modified variants for both, SLM as well as LDW specimens. Consequently, a pronounced influence of microstructural defects on the fatigue behavior of additively manufactured specimens exists in accordance with [8,10,22,23].
In contrast to the PhyBalCHT results, the SLM material shows higher defect tolerance in modified σa/σwNf curves compared to LDW material, which is presumably influenced by the different amounts of phase transformation (see Figure 8). However, only a qualitative comparison of the defect tolerance of LDW and SLM specimens is possible, because of essential differences in defect size, type, and morphology as well as macro hardness values between the different manufacturing processes.

4. Summary and Conclusions

In the presented paper, the influence of a variation of the chemical composition of the used powder in the Selective Laser Melting (SLM) and Laser Deposition Welding (LDW) processes on mechanical and especially cyclic properties is presented and discussed. Therefore, specimens were manufactured with SLM and LDW, by using two different powder batches for each manufacturing process. Note that the batches of each manufacturing process only differ in chemical composition, respectively, whereas the SLM powder is finer compared to LDW. Furthermore, the SLM specimens were manufactured in horizontal and LDW specimens in vertical building direction and consequently, the results of SLM and LDW are not one-to-one comparable.
For fatigue investigation the short-time procedures load increase tests (LITs) [14,15,16,29,30,31], PhyBaLCHT [14,15,16,28,29,41] as well as physically based lifetime calculation PhyBaLLIT [14,16,29,30,31,32] were used to significantly reduce the experimental effort.
The differences in chemical composition lead to differences in austenite stability, but similar grain structures. Moreover, in the LDW process a significantly higher layer thickness was used compared to the SLM process, resulting in lower cooling rates and bigger grains.
For both manufacturing processes, only a slight influence of variation in chemical composition on monotonic properties can be observed, which is more pronounced for LDW specimens. In tensile tests, no phase transformation was detected and, consequently, austenite stability has no impact on the difference in monotonic properties.
Besides the difference in monotonic properties, also slight differences in cyclic properties were observed for SLM material. In fatigue tests, a higher endurance at higher stress amplitudes is demonstrated for batch A, while at lower σa an increased fatigue lifetime is shown for batch B. The lower austenite stability of batch B leads to a more pronounced phase transformation at smaller stress amplitudes, resulting in a higher defect tolerance, determined by the √area concept. Because at lower σa the influence of microstructural defects, i.e. pores, increases, a higher fatigue lifetime can be observed for SLM-H-B at lower stress levels. The beneficial influence of phase transformation on fatigue lifetime could be confirmed with additionally performed constant amplitude tests (CATs) at 100 °C, showing similar fatigue life and defect tolerance of batch A and B, because no phase transformation occurred at this temperature. These slight differences in fatigue behavior can be characterized qualitatively with LITs and quantitatively with S–Nf curves calculated by PhyBaLLIT, which correlate excellently with CATs. By using PhyBaLCHT, the influence of differently pronounced phase transformation could not be determined, because no phase transformation occurred during cyclic indentation tests. However, PhyBaLCHT enabled the determination of the materials hardening potential as well as defect tolerance without influence of phase transformation and hence, a deeper understanding of the fatigue mechanisms.
For LDW material, a stronger influence of variation of the utilized powder batch on cyclic properties was shown, resulting from a more pronounced variation in the powder’s chemical composition. The fracture surface analyzes demonstrate a high influence of microstructural defects, i.e. mainly oxide inclusions and secondarily lack of fusions, on the fatigue properties of both batches. Moreover, a higher fatigue lifetime can be observed for batch C in the whole HCF-regime, despite the lower amount of austenite–α’-martensite transformation. The increasing improvement of fatigue lifetime at decreasing σa for batch C compared to LDW-V-D can be explained with a higher defect tolerance of batch C at smaller σa. Similar to the SLM material these differences can be characterized very well and efficiently with LITs and PhyBaLLIT, yielding results in good accordance to conventional CATs. Additionally, the differences in the materials cyclic hardening potential, excluding the influence of phase transformation, could be characterized reliably with PhyBaLCHT.
By comparing the results of the different manufacturing processes, higher monotonic and fatigue strength are evident for SLM material, which result from the higher cooling rates and hence, refined microstructure. Furthermore, the higher fatigue lifetime of SLM specimens compared to LDW material can be explained with lower number and smaller size of microstructural defects. However, by comparing these two manufacturing processes, the differences in building direction of investigated specimens as well as powder particle size have to be kept in mind.
Finally, the presented results demonstrate that the chemical composition of the used powder as well as the austenite stability have a significant impact on the fatigue behavior of additively manufactured AISI 316L. Furthermore, the utilized short-time procedures proved to be powerful means to thoroughly investigate the cyclic properties of additively manufactured material and to determine slight differences in manufacturing setup, i.e. chemical composition of the powder.

Author Contributions

B.B. and T.B. planned the experimental design, interpreted the given results, and wrote the majority of the presented paper; F.K. was responsible for conduction an interpretation of the FIB investigation; M.S. was substantially involved in interpretation of the influence of austenite stability; M.L., C.G., R.T., and J.C.A. acquired and manufactured the investigated materials and were substantially involved in the discussion of the given results.

Funding

This research received no external funding.

Acknowledgments

The research described in this paper was funded by European Union’s European Regional Development Fund (ERDF) and the Commercial Vehicle Cluster (CVC) Südwest. Moreover, the support of this work by the Bundeswehr Research Institute for Materials, Fuels, and Lubricants (WIWeB) is gratefully acknowledged.

Conflicts of Interest

The authors declare no conflicts of interest.

References

  1. ISO/ASTM. 52900. Additive manufacturing—General principles—Terminology; ASTM: West Conshohocken, PA, USA, 2015. [Google Scholar]
  2. Gokuldoss, P.K.; Kolla, S.; Eckert, J. Additive manufacturing processes: Selective laser melting, electron beam melting and binder jetting—Selection guidelines. Materials 2017, 10, 672. [Google Scholar] [CrossRef] [PubMed]
  3. Casati, R.; Lemke, J.; Vedani, M. Microstructure and fracture behavior of 316L austenitic stainless steel produced by selective laser melting. J. Mater. Sci. Technol. 2016, 32, 738–744. [Google Scholar] [CrossRef]
  4. Yu, J.; Rombouts, M.; Maes, G. Cracking behavior and mechanical properties of austenitic stainless steel parts produced by laser metal deposition. Mater. Des. 2013, 45, 228–235. [Google Scholar] [CrossRef]
  5. Brandl, E.; Schoberth, A.; Leyens, C. Morphology, microstructure, and hardness of titanium (Ti-6Al-4V) blocks deposited by wire-feed additive layer manufacturing (ALM). Mater. Sci. Eng. A 2012, 532, 295–307. [Google Scholar] [CrossRef]
  6. Lewandowski, J.J.; Seifi, M. Metal additive manufacturing: A review of mechanical properties. Annu. Rev. Mater. Res. 2016, 46, 151–186. [Google Scholar] [CrossRef]
  7. Takata, N.; Kodaira, H.; Sekizawa, K.; Suzuki, A.; Kobashi, M. Change in microstructure of selectively laser melted AlSi10Mg alloy with heat treatments. Mater. Sci. Eng. A 2017, 704, 218–228. [Google Scholar] [CrossRef]
  8. Mower, T.M.; Long, M.J. Mechanical behavior of additive manufactured, powder-bed laser-fused materials. Mater. Sci. Eng. A 2016, 651, 198–213. [Google Scholar] [CrossRef]
  9. Yasa, E.; Kruth, J.-P. Microstructural investigation of selective laser melting 316L stainless steel parts exposed to laser re-melting. Procedia Eng. 2011, 19, 389–395. [Google Scholar] [CrossRef]
  10. Yadollahi, A.; Shamsaei, N.; Thompson, S.M.; Elwany, A.; Bian, L. Effects of building orientation and heat treatment on fatigue behavior of selective laser melted 17-4 PH stainless steel. Int. J. Fatigue 2017, 94, 218–235. [Google Scholar] [CrossRef]
  11. Buchbinder, D.; Schleifenbaum, H.; Heidrich, S.; Meiners, W.; Bültmann, J. High power selective laser melting (HP SLM) of aluminum parts. Phys. Procedia 2011, 12, 271–278. [Google Scholar] [CrossRef]
  12. Alcisto, J.; Enriquez, A.; Garcia, H.; Hinkson, S.; Steelman, T.; Silverman, E.; Valdovino, P.; Gigerenzer, H.; Foyos, J.; Ogren, J.; et al. Tensile Properties and Microstructures of Laser-Formed Ti-6Al-4V. J. Mater. Eng. Perform. 2011, 20, 203–211. [Google Scholar] [CrossRef]
  13. Shamsaeia, N.; Yadollahi, A.; Bian, L.; Thompson, S.M. An overview of direct laser deposition for additive manufacturing; Part II: Mechanical behavior, process parameter optimization and control. Addit. Manuf. 2015, 8, 12–35. [Google Scholar] [CrossRef]
  14. Blinn, B.; Ley, M.; Buschhorn, N.; Teutsch, R.; Beck, T. Investigation of the anisotropic fatigue behavior of additively manufactured structures made of AISI 316L with short-time procedures PhyBaLLIT and PhyBaLCHT. Int. J. Fatigue 2019, 124, 389–399. [Google Scholar] [CrossRef]
  15. Blinn, B.; Klein, M.; Gläßner, C.; Smaga, M.; Aurich, J.C.; Beck, T. An investigation of the microstructure and fatigue behavior of additively manufactured AISI 316L stainless steel with regard to the influence of heat treatment. Metals 2018, 8, 220. [Google Scholar] [CrossRef]
  16. Blinn, B.; Ley, M.; Buschhorn, N.; Teutsch, R.; Beck, T. Determination of the influence of a stress-relief heat treatment and additively manufactured surface on the fatigue behavior of selectively laser melted AISI 316L by using efficient short-time procedures. Int. J. Fatigue 2019, 131, 105301. [Google Scholar] [CrossRef]
  17. Spierings, A.B.; Starr, T.L.; Wegener, K. Fatigue performance of additive manufactured metallic parts. Rapid Prototyping J. 2013, 19, 88–94. [Google Scholar] [CrossRef]
  18. Riemer, A.; Leuders, S.; Thöne, M.; Richard, H.A.; Tröster, T.; Niendorf, T. On the fatigue crack growth behavior in 316L stainless steel manufactured by selective laser melting. Eng. Fract. Mech. 2014, 120, 15–25. [Google Scholar] [CrossRef]
  19. Brandl, E.; Heckenberger, U.; Holzinger, V.; Buchbinder, D. Additive manufactured AlSi10Mg samples using Selective Laser Melting (SLM): Microstructure, high cycle fatigue, and fracture behavior. Mater. Des. 2012, 34, 159–169. [Google Scholar] [CrossRef]
  20. Rigon, D.; Meneghetti, G.; Görtler, M.; Cozzi, D.; Waldhauser, W.; Dabalà, M. Influence of defects on axial fatigue strength of maraging steel specimens produced by additive manufacturing. MATEC Web Conf. 2018, 165, 02005. [Google Scholar] [CrossRef]
  21. Zhang, M.; Sun, C.-N.; Zhang, X.; Wei, J.; Hardacre, D.; Li, H. High cycle fatigue and ratcheting interaction of laser powder bed fusion stainless steel 316L: Fracture behaviour and stress-based modelling. Int. J. Fatigue 2018, 121, 252–264. [Google Scholar] [CrossRef]
  22. Günther, J.; Krewerth, D.; Lippmann, T.; Leuders, S.; Tröster, T.; Weidner, A.; Biermann, H.; Niendorf, T. Fatigue life of additively manufactured Ti-6Al-4V in the very high cycle fatigue regime. Int. J. Fatigue 2017, 94, 236–245. [Google Scholar] [CrossRef]
  23. Xue, Y.; Pascu, A.; Horstemeyer, M.F.; Wang, L.; Wang, P.T. Microporosity effects on cyclic plasticity and fatigue of LENS-processed steel. Acta Mater. 2010, 58, 4029–4038. [Google Scholar] [CrossRef]
  24. Fotovvati, B.; Navid Namdari, N.; Dehghanghadikolaei, A. Fatigue performance of selective laser melted Ti6Al4V components: State of the art. Mater. Res. Express. 2019, 6, 012002. [Google Scholar] [CrossRef]
  25. Murakami, Y. Metall Fatigue: Effects of Small Defects and Nonmetallic Inclusions; Elsevier: Kyushu, Japan, 2002. [Google Scholar]
  26. Murakami, Y.; Endo, M. Effects of defects, inclusions and inhomogeneities on fatigue strength. Int. J. Fatigue 1994, 16, 163–182. [Google Scholar] [CrossRef]
  27. Murakami, Y. Effects of small defects and nonmetallic inclusions on the fatigue strength of metals. Int. J. Mech. Mater. Eng. 1989, 32, 167–180. [Google Scholar] [CrossRef]
  28. Bambach, M.D.; Bleck, W.; Kramer, H.S.; Klein, M.; Eifler, D.; Beck, T.; Zoch, H.-W.; Hoffmann, F.; Radulescu, A. Tailoring the Hardening Behavior of 18CrNiMo7-6 via Cu Alloying. Steel Res. Int. 2016, 87, 550–561. [Google Scholar] [CrossRef]
  29. Kramer, H.S.; Starke, P.; Klein, M.; Eifler, D. Cyclic hardness test PHYBALCHT—Short-time procedure to evaluate fatigue properties of metallic materials. Int. J. Fatigue 2014, 63, 78–84. [Google Scholar] [CrossRef]
  30. Jost, B.; Klein, M.; Beck, T.; Eifler, D. Temperature dependent cyclic deformation and fatigue life of EN-GJS-600 (ASTM 80-55-06) ductile cast iron. Int. J. Fatigue 2017, 96, 102–113. [Google Scholar] [CrossRef]
  31. Jost, B.; Klein, M.; Beck, T.; Eifler, D. Out of Phase TMF lifetime calculation of EN-GJS-600 (ASTM 80-55-06) ductile cast iron based on strain increase tests and evaluation of cyclic deformation behavior in isothermal measuring intervals. Int. J. Fatigue 2018, 117, 274–282. [Google Scholar] [CrossRef]
  32. Starke, P.; Walther, F.; Eifler, D. "PhyBaL" a short-time procedure for a reliable fatigue life calculation. Adv. Eng. Mater. 2010, 12, 276–282. [Google Scholar] [CrossRef]
  33. Polak, J.; Obrtlik, K.; Hajek, M. Cyclic plasticity in type 316L austenitic stainless steel. Fatigue Fract. Eng. M. 1994, 17, 773–782. [Google Scholar] [CrossRef]
  34. Man, J.; Obrtlík, K.; Petrenec, M.; Beran, P.; Smaga, M.; Weidner, A.; Dluhoš, J.; Kruml, T.; Biermann, H.; Eifler, D.; et al. Stability of austenitic 316L steel against martensite formation during cyclic straining. Procedia Eng. 2011, 10, 1279–1284. [Google Scholar] [CrossRef] [Green Version]
  35. Hong, Y.; Zhou, C.; Zheng, Y.; Zhang, L.; Zheng, J.; Chen, X.; An, B. Formation of strain-induced martensite in selective laser melting austenitic stainless steel. Mater. Sci. Eng. A 2019, 740–741, 420–426. [Google Scholar] [CrossRef]
  36. Grigorescu, A.C.; Hilgendorff, P.-M.; Zimmermann, M.; Fritzen, C.-P.; Christ, H.-J. Cyclic deformation behavior of austenitic Cr–Ni-steels in the VHCF regime: Part I – Experimental study. Int. J. Fatigue 2016, 93, 250–260. [Google Scholar] [CrossRef]
  37. Grigorescu, A.C.; Hilgendorff, P.-M.; Zimmermann, M.; Fritzen, C.-P.; Christ, H.-J. Effect of geometry and distribution of inclusions on the VHCF properties of a metastable austenitic stainless steel. Adv. Mater. Res. 2014, 891–892, 440–445. [Google Scholar] [CrossRef]
  38. Angel, T. Formation of martensite in austenitic stainless steel—Effects of deformation, temperature and composition. J. Iron Steel Inst. 1954, 177, 165–174. [Google Scholar]
  39. ASTM. A 240/A 240Ma Standard Specification for Chromium and Chromium-Nickel Stainless Steel Plate, Sheet, and Strip for Pressure Vessels and for General Applications; ASTM: West Conshohocken, PA, USA, 2016. [Google Scholar]
  40. Ganesh, P.; Kaul, R.; Sasikala, G.; Kumar, H.; Venugopal, S.; Tiwari, P.; Rai, S.; Prasad, R.C.; Kukreja, L.M. Fatigue crack propagation and fracture toughness of laser rapid manufactured structures of AISI 316L stainless steel. Metallogr. Microstruct. Anal. 2014, 3, 36–45. [Google Scholar] [CrossRef]
  41. Blinn, B.; Görzen, D.; Klein, M.; Eifler, D.; Beck, T. PhyBaLCHT—Influence of indentation force on the results of cyclic hardness tests and investigations of comparability to uniaxial fatigue loading. Int. J. Fatigue 2019, 119, 78–88. [Google Scholar] [CrossRef]
  42. DIN EN ISO. 6892-1 Metallic materials—Tensile testing—Part 1: Method of test at room temperature (ISO 6892-1:2016), German version EN ISO 6892-1:2016; ISO: Berlin, Germany, 2017. [Google Scholar]
  43. Morrow, J. Cyclic plastic strain energy and fatigue of metals. ASTM Int. 1964, STP378, 45–87. [Google Scholar]
  44. Basquin, O.H. The exponential law on endurance tests. ASTM Proc. 1910, 10, 625–630. [Google Scholar]
  45. DIN 50100. Load Controlled Fatigue Testing—Execution and Evaluation of Cyclic Tests at Constant Load Amplitudes on Metallic Specimens and Components (DIN 50100); German Standard: Berlin, Germany, 2016. [Google Scholar]
  46. Spierings, A.B.; Herres, N.; Levy, G. Influence of the particle size distribution on surface quality and mechanical properties in AM steel parts. Rapid Prototyping J. 2011, 17, 195–202. [Google Scholar] [CrossRef] [Green Version]
  47. James, L.A.; Schwenk, E.B. Fatigue-Crack Propagation Behavior of Type 304 Stainless Steel at Elevated Temperatures. Metall. Trans. 1971, 2, 491–496. [Google Scholar] [CrossRef]
  48. Shahinian, P.; Smith, H.; Watson, H. Fatigue Crack Growth Characteristics of Several Austenitic Stainless Steels at High Temperature. In Fatigue at Elevated Temperatures; Carden, A., McEvily, A., Wells, C., Eds.; American Society for Testing and Materials: Philadelphia, PA, USA, 1972; pp. 387–400. [Google Scholar]
Figure 1. Light optical micrographs (LOMs) of (a) Selectively Laser Melted (SLM)-H-A, (c) SLM-H-B, (e) LDW-V-C and (g) Laser Deposition Welded (LDW)-V-D specimens as well as electron backscatter diffraction (EBSD-) maps of (b) SLM-H-A, (d) SLM-H-B, (f) LDW-V-C, and (h) LDW-V-D specimens.
Metals 09 01285 g001
Figure 2. Scanning electron microscope image as well as the energy dispersive X-ray spectroscopy (EDS) analyzes of a SiMn oxide of LDW material.
Metals 09 01285 g002
Figure 3. Geometry of the fatigue specimens for load increase (LITs) and constant amplitude tests (CATs).
Metals 09 01285 g003
Figure 4. (a) Stress-strain curves of differently manufactured specimens obtained in tensile tests with (b) a higher resolution of the transition area from elastic to plastic deformation.
Metals 09 01285 g004
Figure 5. ha,pN curves of differently manufactured specimens obtained in cyclic indentation tests.
Metals 09 01285 g005
Figure 6. Phase distribution beneath the indent of a cyclic indentation test at SLM-H-B specimen obtained by focused ion beam (FIB) investigations.
Metals 09 01285 g006
Figure 7. Cyclic deformation curves of (a) SLM specimens and (b) LDW specimens from different batches obtained in load increase tests.
Metals 09 01285 g007
Figure 8. S–Nf curves determined with PhyBaLLIT as well as the results of CATs including information about the crack initiation sites and the increase of magnetic fraction Δξ in the gauge length of the differently manufactured specimens.
Metals 09 01285 g008
Figure 9. Cyclic deformation curves of (a) SLM-H-A, (b) LDW-V-C, (c) SLM-H-B, and d) LDW-V-D specimens obtained in CATs.
Metals 09 01285 g009
Figure 10. Microstructural investigation of the phase transformation at a vertically built and stress-relief heat treated (650 °C, 2 h) SLM specimen (σa = 390 MPa; Nf = 185 939) including (ac) FIB preparation as well as (d,e) EBSD mappings and (f,g) phase distributions at (d,f) the crack initiation site, and (e,g) in the materials volume [16].
Metals 09 01285 g010
Figure 11. Fracture surfaces obtained in CATs for (a) SLM-H-A (σa = 420 MPa, Nf = 42131), (b) SLM-H-B (σa = 370 MPa, Nf = 234,259), (c) LDW-V-C (σa = 250 MPa, Nf = 19,954), and (d) LDW-V-D specimens (σa = 200 MPa, Nf = 185,858).
Metals 09 01285 g011
Figure 12. σa/σwNf curves of the differently manufactured specimens determined by √area concept in accordance with [14,16,25,26,27].
Metals 09 01285 g012
Table 1. Parameters of the additive manufacturing processes.
Manufacturing ParameterSelective Laser MeltingLaser Deposition Welding
Powder particle size (µm)26–5245–105
Laser power (W)2501400
Scan velocity (mm/s)90017
Layer thickness (µm)30900
Powder feed rate (g/min)-12
Manufacturing system3D Systems ProX DMP 320 (3D Systems, Leuven, Belgium)DMG MORI LASERTEC 65 3D hybrid (DMG Mori AG, Bielefeld, Germany)
Table 2. Chemical composition and Md30, Angel—temperatures [38] of the investigated materials as well as the limits of the ASTM standard [39].
Element in wt. %CNSiMnCrNiMoFeMd30, Angel in °C
SLM-H-A0.020.060.400.3617.7112.972.4765.89−41.7
SLM-H-B0.010.050.430.3617.5313.002.4666.02−30.0
LDW-V-C0.020.090.540.9918.3512.562.2065.11−62.8
LDW-V-D0.020.090.471.1316.9710.652.0868.42−21.2
ASTM A 182min----16.0010.002.0060.8061.8
max0.030.101.002.0018.0015.003.0072.00−117.1
Table 3. Macro hardness values measured at AT and 100 °C as well as porosity.
SpecimenSLM-H-ASLM-H-BLDW-V-CLDW-V-D
Macro hardness in HV30 at AT227 ± 4224 ± 4164 ± 4160 ± 4
Macro hardness in HV30 at 100 °C203 ± 1190 ± 2--
Porosity in area-%0.06 ± 0.040.06 ± 0.030.04 ± 0.040.02 ± 0.01
Table 4. Tensile strength Rm, 0.2% yield strength Rp0.2, Young’s modulus E, elongation at fracture A, reduction of area Z and increase of magnetic fraction Δξ obtained in tensile tests.
SpecimenSLM-H-ASLM-H-BLDW-V-CLDW-V-D
Rm in MPa678 ± 1651 ± 1515 ± 4552 ± 2
Rp0.2 in MPa580 ± 8561 ± 2243 ± 1259 ± 1
E in GPa183 ± 13184 ± 6156 ± 3136 ± 9
A in %38.7 ± 0.338.8 ± 0.242.0 ± 2.132.7 ± 2.7
Z in %72.3 ± 0.972.1 ± 0.759.7 ± 2.449.0 ± 1.6
Δξ in Fe-%0.00 ± 0.000.00 ± 0.000.00 ± 0.000.00 ± 0.00
Table 5. Micro (Martens) hardness (HM) and cyclic hardening exponentCHT eII obtained in cyclic indentation tests.
SpecimenSLM-H-ASLM-H-BLDW-V-CLDW-V-D
HM 1/6/0.1 in MPa2 441 ± 252344 ± 271823 ± 211 789 ± 23
|eII|0.40 ± 0.0170.40 ± 0.0100.53 ± 0.0160.47 ± 0.010
Table 6. Cyclic hardening exponent n′, correlation coefficient R²Morrow of calculated cyclic σaεa,p curve, fatigue strength exponent b and fatigue strength coefficient σf calculated with PhyBaLLIT approach for differently manufactured specimens.
Type of SpecimenR2Morrownσf in MPab
SLM-H-A0.980.1121093−0.072
SLM-H-B0.990.064808−0.049
LDW-V-C0.990.090483−0.062
LDW-V-D0.990.147600−0.085
Table 7. Analyses of crack-initiating defects in CATs at AT with information of the position as well as the resulting fatigue strength σw calculated by the √area concept [25,26,27].
Type of Specimenσa in MPaNf√area in µmPosition of the Defectσw in MPaσawR2Mura.R2conv.
SLM-H-A39088 05329.8sub-s2781.400.980.95
360339 49823.0sub-s2901.24
340399 73832.6sub-s2741.24
3201,314,06129.9sub-s2781.15
SLM-H-B380218,61371.2sur.2251.590.960.32
370234,25979.9sub-s2341.58
370350,56046.7sub-s2561.45
370585,92435.1sub-s2681.30
LDW-V-C23066,473298.1int.1711.340.950.99
210241,532205.1sur.1671.26
190723,634164.6sub-s1711.11
LDW-V-D22046,711774.8sub-s1301.690.990.91
200185,858320.2sub-s1511.33
180268,682291.2sub-s1531.19
180305 410306.7sub-s1521.18
Table 8. Analyses of the crack-initiating defects for CATs at 100 °C with information of the position as well as the resulting values of fatigue strength σw calculated by the √area concept [25,26,27].
Type of Specimenσa in MPaNf√area in µmPositionσw in MPaσa/σwMean Value of Nf
SLM-H-A340161,77729.1sub-s2601.31172,609
340173,570----
340182,480----
SLM-H-B340171,34614.2sub-s 2811.21191,589
340211,83118.5int.2971.18

