Article

Micromechanical Modeling of Fatigue Crack Nucleation around Non-Metallic Inclusions in Martensitic High-Strength Steels

by
Benjamin Josef Schäfer
1,2,*,
Petra Sonnweber-Ribic
1,
Hamad ul Hassan
2 and
Alexander Hartmaier
2
1
Robert Bosch GmbH—Corporate Sector Research and Advance Engineering, 71272 Renningen, Germany
2
Interdisciplinary Centre for Advanced Materials Simulation, Ruhr-Universität Bochum, 44801 Bochum, Germany
*
Author to whom correspondence should be addressed.
Metals 2019, 9(12), 1258; https://doi.org/10.3390/met9121258
Submission received: 31 October 2019 / Revised: 20 November 2019 / Accepted: 20 November 2019 / Published: 25 November 2019
(This article belongs to the Special Issue Fatigue Design and Defects in Metals and Alloys)

Abstract

:
Martensitic high-strength steels are prone to exhibit premature fatigue failure due to fatigue crack nucleation at non-metallic inclusions and other microstructural defects. This study investigates the fatigue crack nucleation behavior of the martensitic steel SAE 4150 at different microstructural defects by means of micromechanical simulations. Inclusion statistics based on experimental data serve as a reference for the identification of failure-relevant inclusions and defects for the material of interest. A comprehensive numerical design of experiment was performed to systematically assess the influencing parameters of the microstructural defects with respect to their fatigue crack nucleation potential. In particular, the effects of defect type, inclusion–matrix interface configuration, defect size, defect shape and defect alignment to loading axis on fatigue damage behavior were studied and discussed in detail. To account for the evolution of residual stresses around inclusions due to previous heat treatments of the material, an elasto-plastic extension of the micromechanical model is proposed. The non-local Fatemi–Socie parameter was used in this study to quantify the fatigue crack nucleation potential. The numerical results of the study exhibit a loading level-dependent damage potential of the different inclusion–matrix configurations and a fundamental influence of the alignment of specific defect types to the loading axis. These results illustrate that the micromechanical model can quantitatively evaluate the different defects, which can make a valuable contribution to the comparison of different material grades in the future.

1. Introduction

Martensitic high- and ultra-high-strength steels are characterized by excellent strength and toughness levels. Thus, these steels are suitable for a variety of applications where the focus is on both weight reduction and sustainable component designs with constant or even increased safety standards at the same time [1]. Within this class of materials, the quenched and tempered martensitic steel SAE 4150 exhibits excellent strength and toughness values and therefore obtains special attention. However, due to the high strength of these steels, they are prone to fail at non-metallic inclusions (NMI) [2]. This is because the critical defect size causing fatigue failure declines significantly with increasing strength [3,4].
NMI cannot be entirely eliminated in the steel production, but high efforts are made to minimize the number and sizes of inclusions in high- and ultra-high-strength steels [2,3,5]. The most common NMI in aluminum-killed steels are aluminum oxides (Al 2 O 3 ), manganese sulfides (MnS) and different types of spinels [2]. These NMI can be distinguished with respect to their origin into endogenous and exogenous inclusions. Reactions of the liquid melt with deoxidizers may form endogenous inclusions whereby exogenous inclusions derive from external sources such as particles of refractory fragments [6]. The latter ones are usually larger and may cause premature fatigue failures [7].
According to Tanaka and Mura [8], the motion of dislocations is obstructed by inclusions. Therefore, cyclic loadings may cause damage accumulation in the vicinity of defects and NMI. Depending on defect type, defect size, local microstructural attributes and the applied loading level, irreversible damage accumulation becomes critical and may results in fatigue crack nucleation (FCN) and subsequent fatigue stages such as microstructural short crack growth (MSC), physically short crack growth and the long crack regime up to the failure of the material. In the past, a large number of experimental investigations have been performed to study fatigue failure at NMI in high- and ultra-high-strength steels. Therefore, the results from Murakami and co-workers [3] are of significant importance.
In this context, Sinz [9] investigated the fatigue behavior of SAE 4150 with rare exogenous NMI. Therefore, artificial defects were introduced into the experimental test specimens to study the influence of defect size and defect shape on fatigue strength systematically. Sinz observed a fundamental influence of defect shape and size on the fatigue properties. On the comparable steel grade SAE 4140, Cyril et al. [10] conducted fatigue experiments to investigate the effect of sulfur content and anisotropy of sulfide inclusions on fatigue properties. They concluded that MnS inclusions can have considerable adverse effects on fatigue properties in case the MnS inclusions are aligned perpendicular to the loading axis. In addition, they observed several fracture origins in the bulk material where aluminum oxides with different sizes where located. Similar results were obtained by Temmel et al. [11] investigating a SAE 4140 with 45 HRC and high sulfur content with respect to fatigue anisotropy by MnS inclusions. They found a reduction of the fatigue strength by a factor of two in case the specimens contain transversal MnS inclusions instead of longitudinal MnS inclusions. From a microscopic perspective, Hosseini et al. [12] investigated the fatigue crack nucleation behavior around the MnS inclusions at the identical material as Temmel et al. [11] by in situ tensile testing inside a scanning electron microscope. The tests revealed a weak bonding between the MnS and the martensitic matrix resulting in a delamination for transversal loading of the MnS inclusion. This characteristic debonding behavior of MnS inclusions was independently confirmed by Maciejewski [13]. Åman et al. [14] investigated the effects of interacting microstructural defects on the fatigue limit for a medium carbon steel. The investigations showed the fundamental influence of the underlying microstructure on the fatigue crack nucleation and short crack behavior. Furthermore, they concluded that the largest microstructural defect determines the fatigue limit. Based on the experimental works [9,10,11,12,13,14], it is possible to extract the following key points: (a) the investigated martensitic steels SAE 4150 and SAE 4140 show fatigue crack nucleation on free surfaces as well as at oxidic and sulfidic inclusions with varying sizes, shapes and orientations to loading axis, (b) the MnS inclusions reveal a complex delamination behavior in case of transversal loading and (c) the lower bound of fatigue properties is controlled by the maximum size of non-metallic inclusions within the high stressed volumes [15,16,17].
In recent years, micromechanical modeling techniques have achieved a tremendous importance due to their ability to systematically investigate complex phenomena as for example fatigue crack nucleation. Pioneering works in the field of micromechanical fatigue modeling were done by Manonukul and Dunne [18] as well as by McDowell and Dunne [19]. This modeling technique requires an appropriate selection of both a constitutive model to describe the cyclic elasto-plastic deformation on the crystal scale and a suited representation of the underlying microstructure to be analyzed. Here, crystal plasticity finite element methods (CPFEM) provide a powerful solution scheme for the constitutive formulation for plastic flow and hardening at the crystal scale [20]. The stochastic nature of metallic microstructures can be adequately modeled in the context of micromechanical fatigue simulations by multiple instantiations of statistical volume elements (SVE) [19,21]. In this context, mesoscopic fatigue indicator parameters (FIP) are used to correlate the local microstructural dependent mechanical response with the fatigue phenomena. These metrics, which are either strain, stress–strain or energy-based, represent driving forces for fatigue crack nucleation and limited microstructural short crack growth [18,19,22,23]. In the past, different types of materials have been the focus of micromechanical investigations on fatigue crack initiation in the absence of NMI. Selected works are for example: On polycrystalline ferritic and ferritic-pearlitic steels [24,25,26], on martensitic steels [27,28,29], on aluminum alloys [30], on nickel-base alloys [18,23,31,32] and finally on ideal brittle materials [33,34]. The listed works are exemplary and there is no claim to completeness.
Polycrystalline microstructures containing defects have also been subject of multiple investigations. Ye, Fan and Gall and their colleagues investigated both the cyclic plasticity and the FCN behavior of different aluminum alloys in the presence of pores and inclusions [35,36,37]. Furthermore, voids and pores in brass were investigated by Carroll et al. [38] and Battaile et al. [39] focusing on the microstructural variations around the defects as well as the role of the relative grain size to the defect size. On a ferritic-pearlitic steel, Gillner et al. [40] investigated schematically the effects of different defect parameters such as the inclusion size, shape and surface roughness with respect to the high cycle fatigue behavior. The main findings of this study were that the inclusion size has the dominant effect on fatigue life and voids can be used as a conservative assessment of materials defect density. Fundamental works on the inclusion modeling in martensitic steels and in Ni-based superalloys were done by Prasannavenkatesan et al. [41] and Salajegheh [42]. They investigated in a comprehensive way different inclusion–matrix interfaces, pore configurations and the effects of shoot peening on the fatigue properties. The partly debonded inclusions showed in their studies the most severe inclusion–matrix configuration with respect to fatigue crack initiation potential. However, residual stresses due to previous heat treatments were not taken into account at the martensitic gear steel. Recently, Prithivirajan et al. [43] and Bandyopadhyay et al. [44] investigated nickel-base superalloys with respect to the critical pore size and the competing failure mechanisms in inclusion–matrix configurations, respectively. Therefore, Bandyopadhyay et al. [44] investigated the effect of micromechanically induced residual stresses due the mismatch of the coefficients of thermal expansion (CTE) between the matrix and the inclusion during a previous heat treatment cycle. They found that the residual stresses from heat treatments increase the damage potential of inclusions under subsequent fatigue loading. Similar results were reported by Gu et al. [45] at a high-carbon chromium bearing steel. In this investigation, residual stresses of a previous heat treatment were modeled around perfectly bonded inclusions via an isotropic elastic material model. However, in this investigation, the martensitic structure was not modeled around the inclusions in detail. There have been numerous further investigations on modeling the FCN around defects and non-metallic inclusions (e.g., [21,46,47,48]). However, a systematic comparison of all relevant parameters comprising inclusion sizes, different inclusion–matrix interface conditions and residual stresses for a martensitic high-strength steel is still missing.
The purpose of the present study is the prediction of the fatigue crack nucleation life of the martensitic high-strength steel SAE 4150 for different inclusion types, inclusion–matrix configurations, defect sizes and shapes and residual stresses under fully reversed loading conditions. For this purpose, a comprehensive five-level hierarchical numerical design of experiment of different inclusion–matrix configurations is presented in the current investigation.
The publication is structured as follows: first, in Section 2 the martensitic high-strength steel SAE 4150 is characterized with respect to microstructural properties and failure-relevant non-metallic inclusions. Then, the modeling methodology including the modeling of statistical volume elements, the crystal plasticity model, the fatigue indicator parameters and the strategy of the numerical design of experiment are presented in Section 3. In the subsequent Section 4, the micromechanical numerical result are presented and discussed in detail. Finally, the main conclusions are summarized in Section 5.

2. Material and Experimental Investigations

The material in this study is the quenched and tempered medium carbon alloyed steel SAE 4150 (German designation: 50CrMo4) exhibiting a hardness of 39 HRC. This section focuses on the material’s microstructural properties as well as to failure-relevant inclusions for fatigue loading. The mean values of the main alloying elements of the steel are given in Table 1.
In the context of previous research on micromechanical modeling of lath martensitic microstructures, presented in [28,49], substantial experimental investigations were performed with respect to microstructural properties, cyclic effective deformation behavior and fatigue crack nucleation characteristics. The readers are referred to previous investigations [28,49], where the corresponding results are reported and discussed in detail.

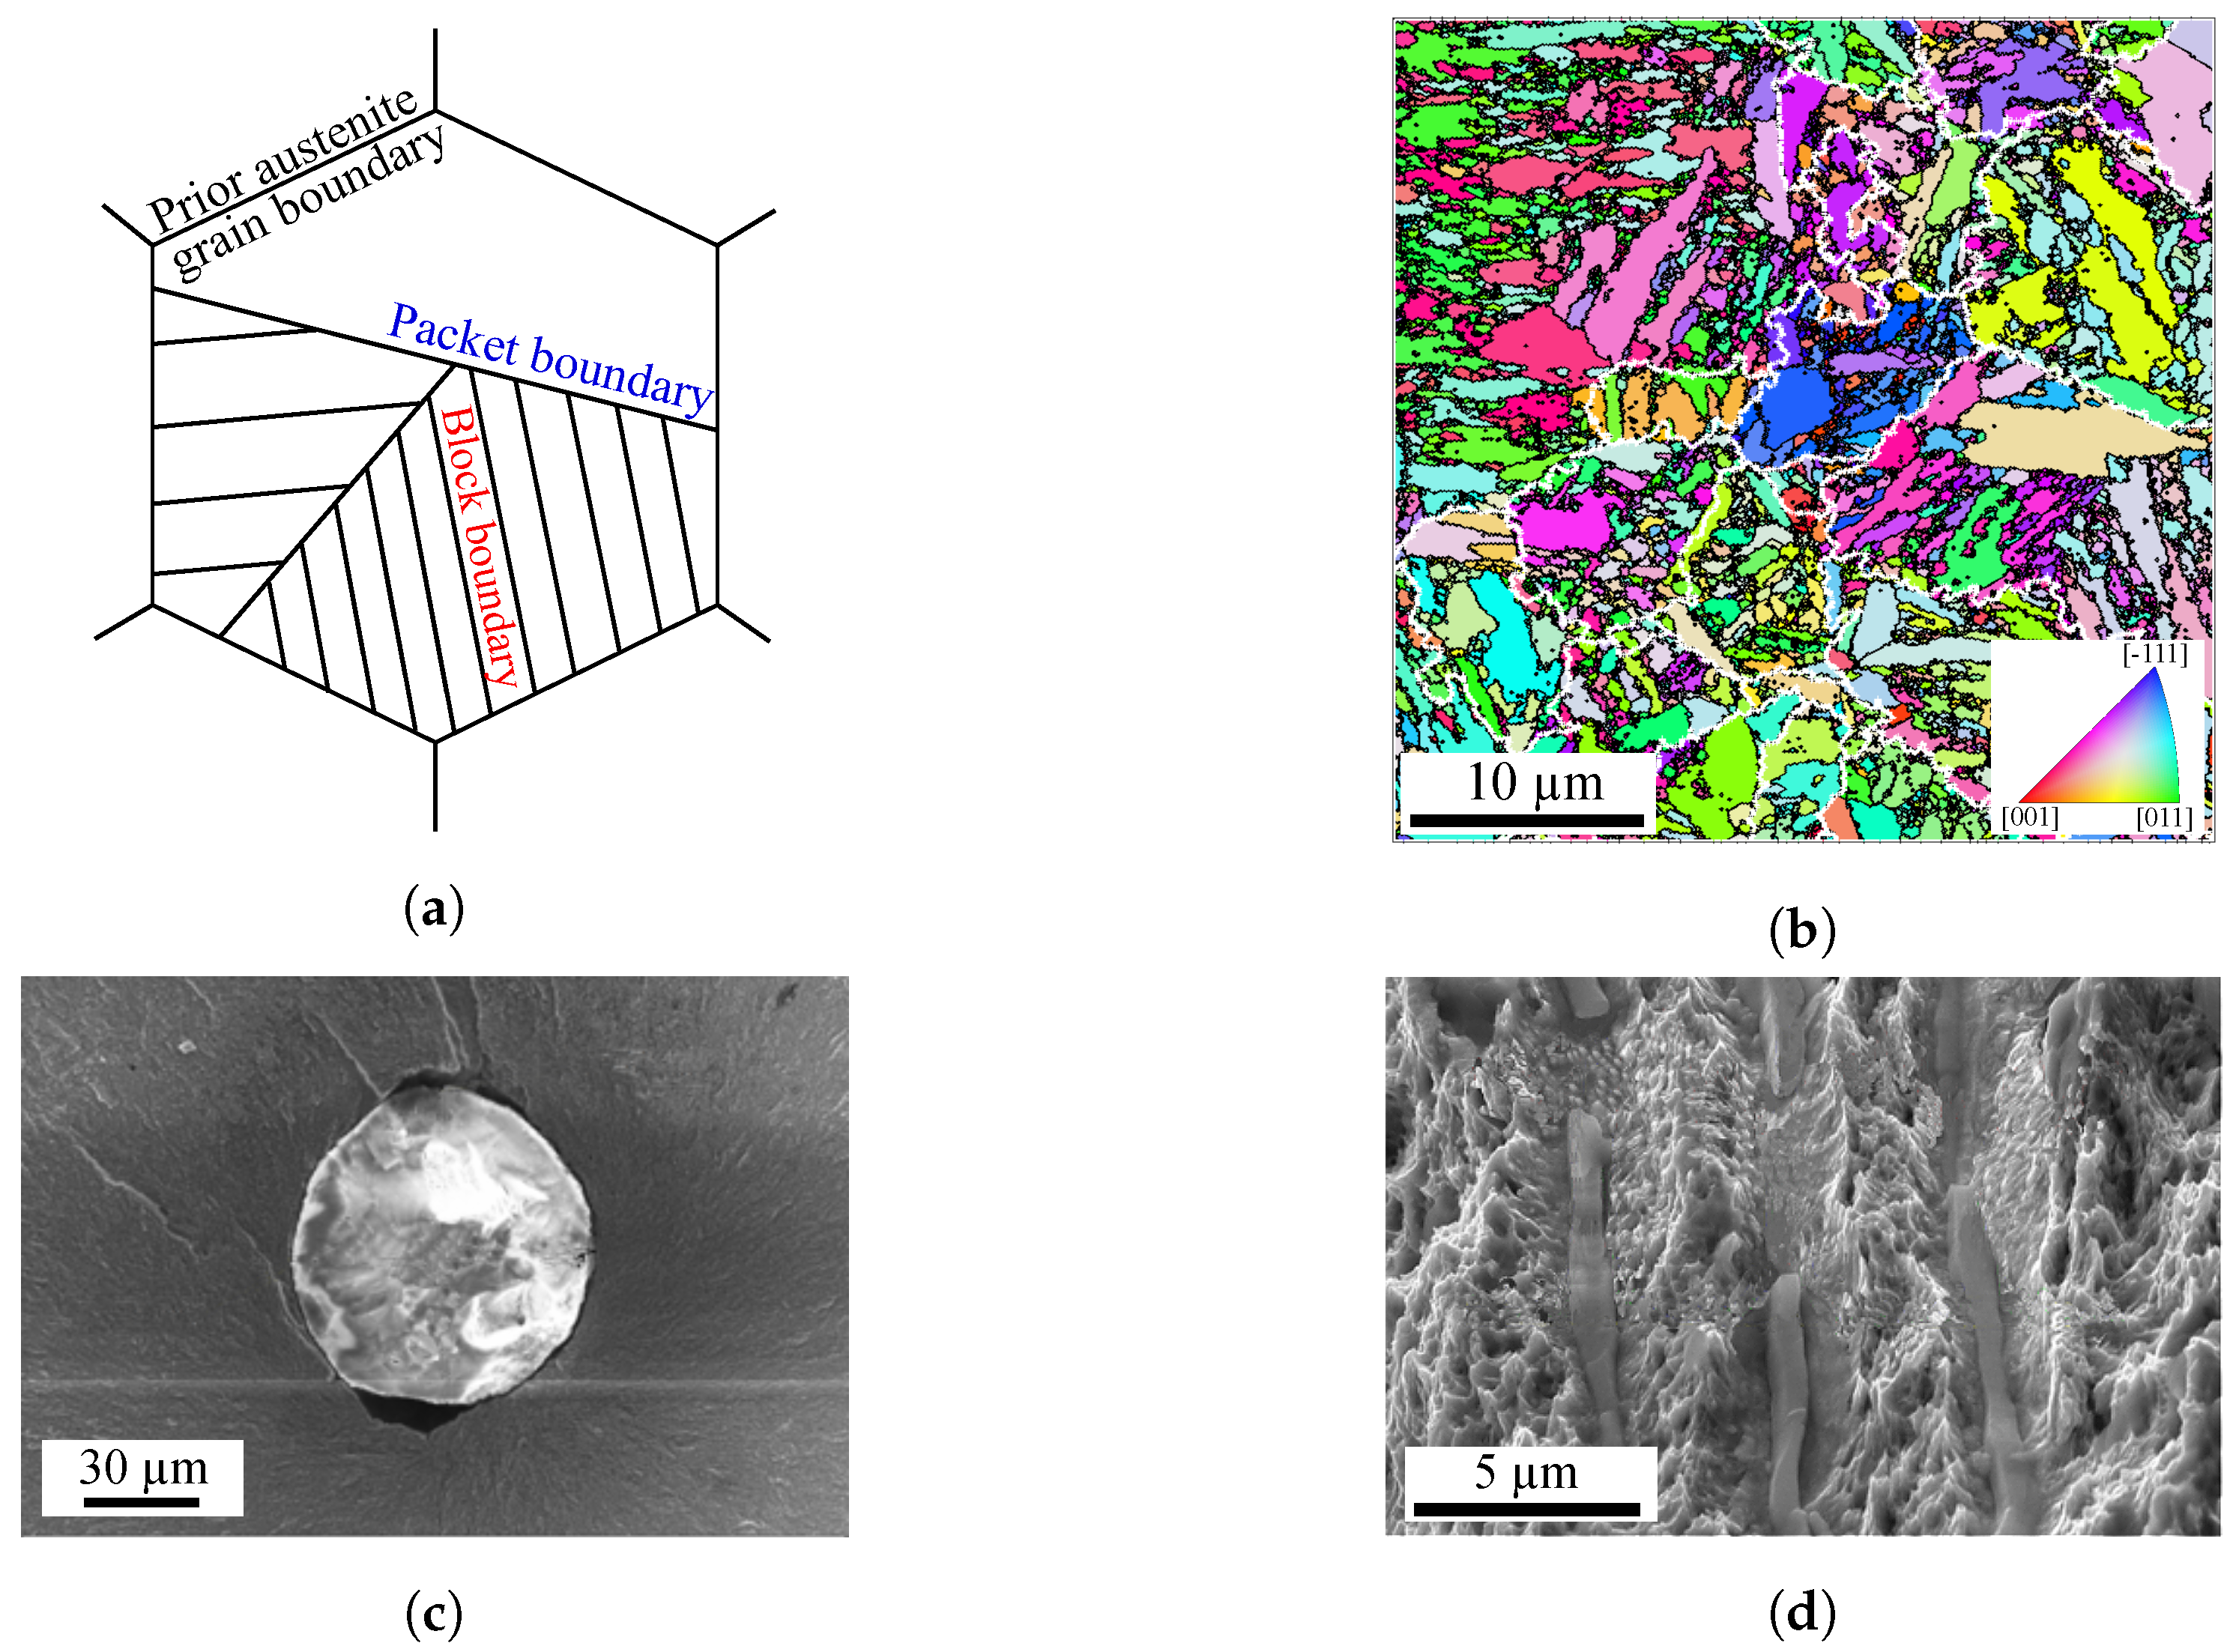
2.1. Martensitic Microstructure

Martensitic microstructures exhibit a three-level hierarchy in their morphology. Figure 1a shows schematically the three different instances and the corresponding structure: martensite lath, block and packet. Further profound information about the specific instances are given e.g., in Kitahara et al. [50] or in Morito et al. [51]. Electron backscatter diffraction (EBSD) analyses were performed on the investigated material by means of scanning electron microscopy (SEM, Zeiss Merlin) to reveal the underlying martensitic morphology. Figure 1b shows the corresponding inverse pole figure (z-direction).
The inverse pole figure in Figure 1b reveals the typical lath martensitic structure being an assembly of many small laths and blocks resulting in a high number of grain boundaries. Reconstructed prior austenite grains are shown by solid white lines. The investigated lath martensite represents a fine-grained structure, whereby the observed blocks, laths and prior austenite grains show qualitatively heterogeneous size distributions. The prior austenite grains were reconstructed in a previous study [49] by the software package ARPGE [52] and the Nishiyama-Wassermann [53] orientation relationship.

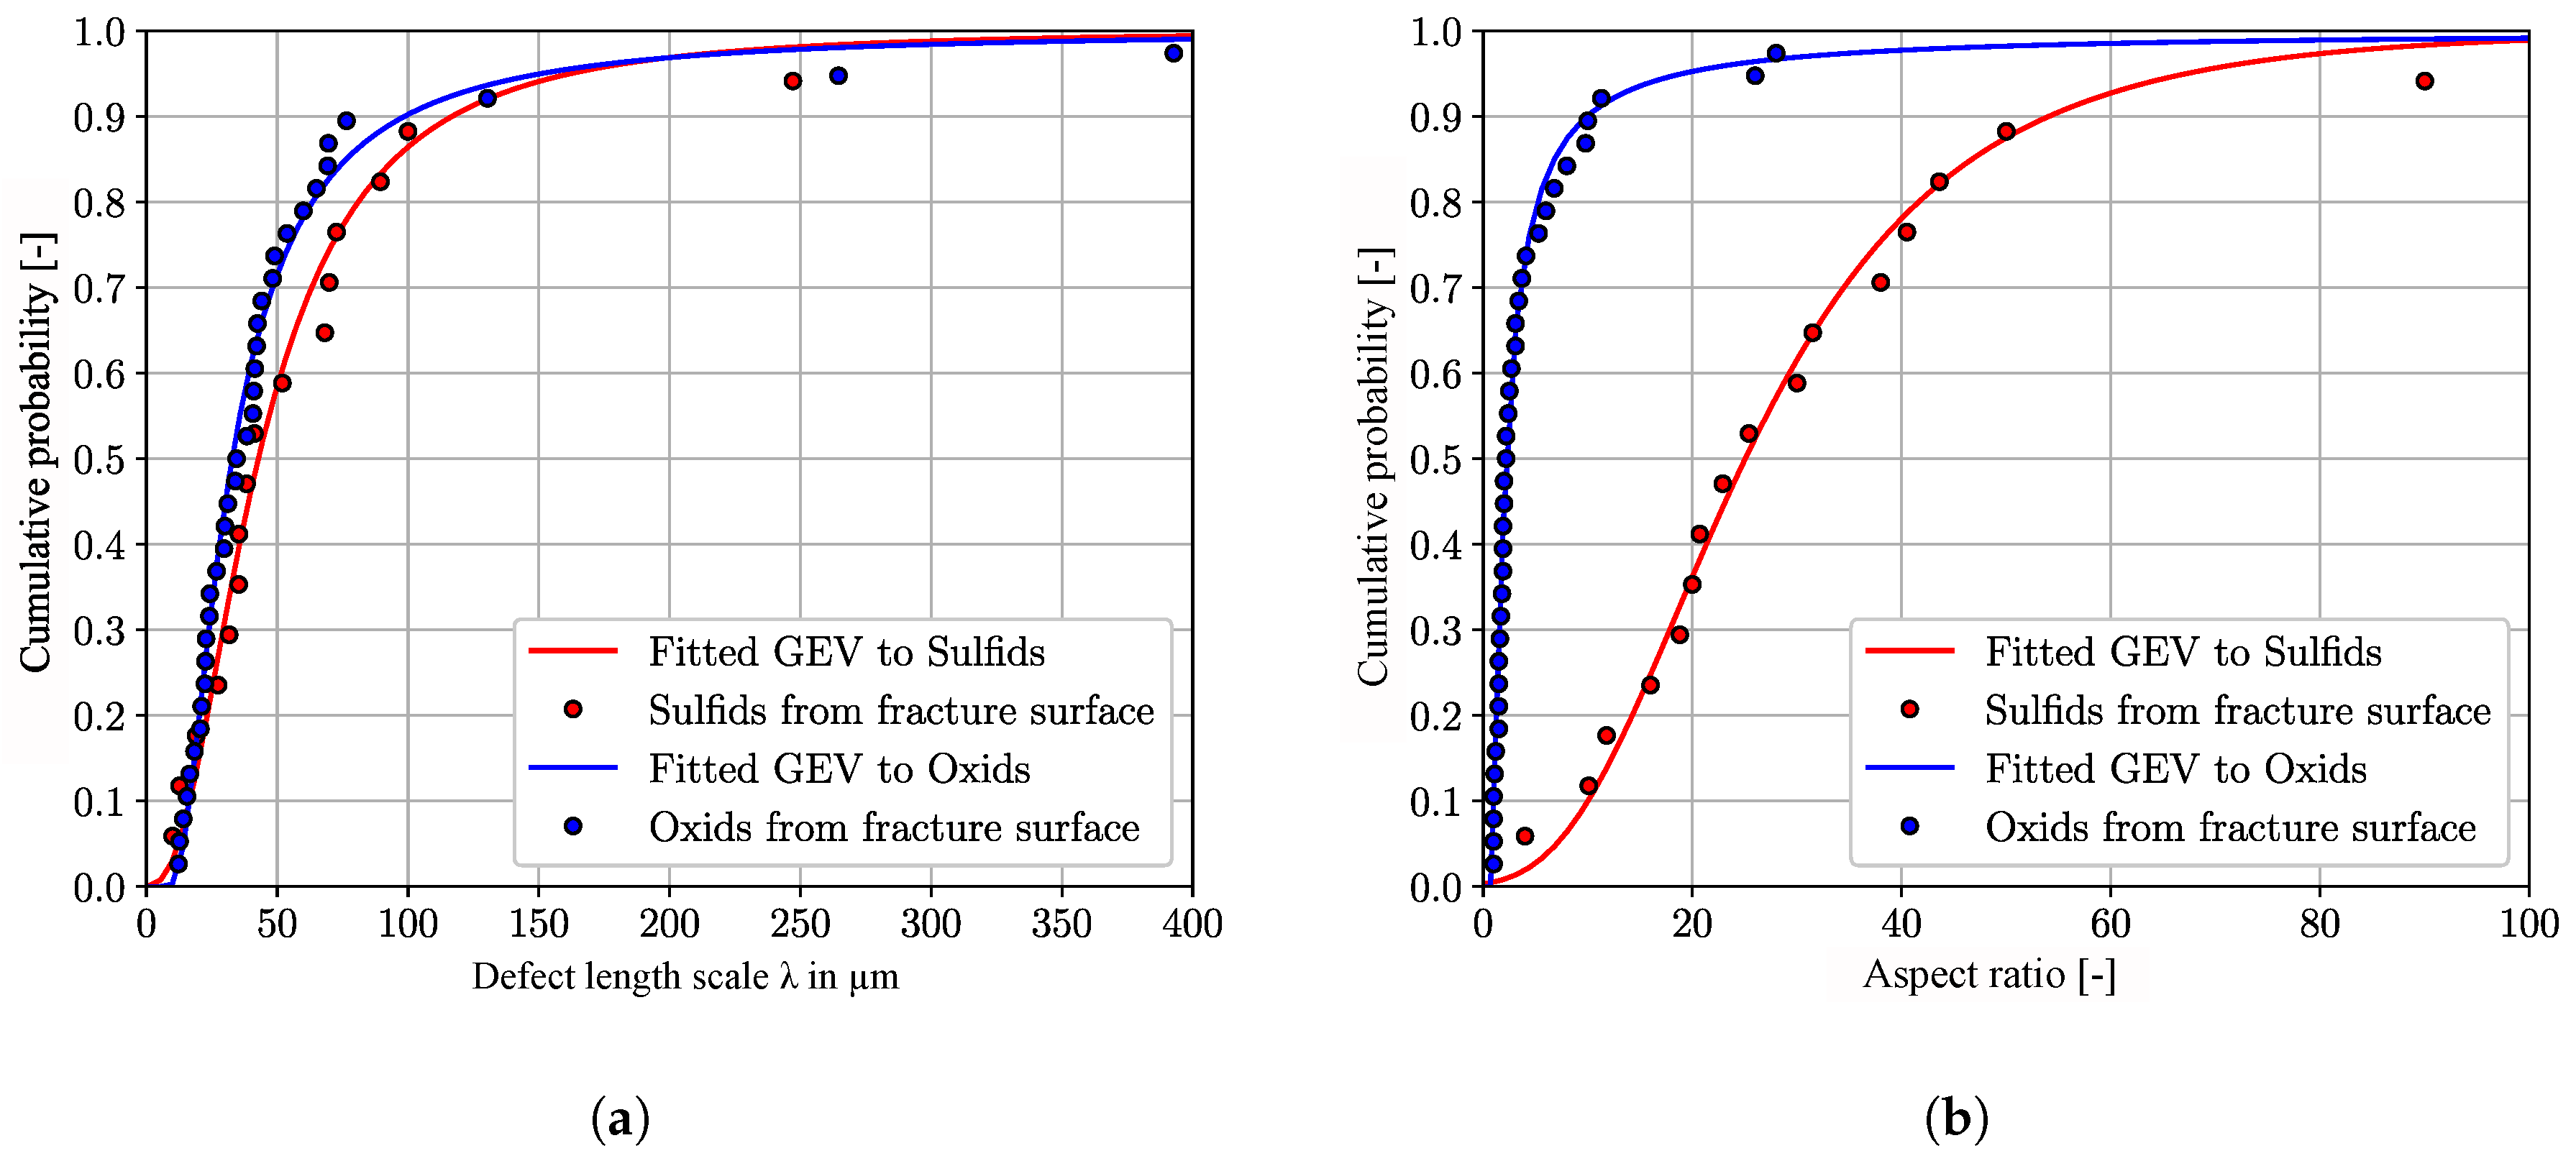
2.2. Failure-Relevant Non-Metallic Inclusions

To identify failure-relevant inclusion types, inclusion sizes and inclusion geometries for the investigated material, 53 fractured structural components of a high-pressure injection system were analyzed with respect to the crack initiation site. All the fractures were initiated by non-metallic inclusions. In total, 37 oxidic and 16 sulfidic NMI were identified on the fracture surfaces. Figure 1c,d reveal the typical morphology of the oxidic and sulfidic inclusions from the corresponding fracture surfaces, respectively. The shown oxidic inclusion is spherical tracing back to the inclusion formation process from the liquid phase. Therefore, the oxidic inclusions and voids are expressed via diameters in the present study. On the other hand, the manganese sulfides are elongated with high aspect ratios (AR = length/width). Consequently, MnS are described by aspect ratios in this investigation.
The determination of the maximum inclusion (or defect) size in a component represents in general a difficult challenge due to their low probability of occurrence [54,55]. However, methods based on the statistics of extreme values enable the estimation of maximum inclusion sizes as well as the quantitative description of the inclusion size distributions [54,56]. Therefore, all failure-relevant inclusions of the present study were quantitatively analyzed with respect to a r e a (square root of the projected inclusion area) and the corresponding aspect ratio, according to the inclusion rating methodology proposed by Murakami [54]. In the following, the defect length scale λ is introduced which is related to the square root of the projected inclusion area by λ = a r e a . Figure 2a,b show the cumulative probability plots of the oxidic and sulfidic inclusions for both the descriptors namely the defect length scale λ and the aspect ratio.
Figure 2a,b show on the one hand the experimentally observed discrete inclusion attributes such as the defect length scale λ and the aspect ratio in an ascending order and on the other hand the corresponding fitted cumulative generalized extreme value (GEV) distributions for the oxidic and sulfidic non-metallic inclusions. In the present study, the GEV-distribution fitted by the maximum likelihood method enables the precise description of the experimentally observed defect length scale λ and aspect ratio characteristics of the investigated fracture surfaces. The λ -characteristics of the oxides and sulfides in Figure 2a differ only slightly between the 40th- and 90th-percentile. However, the aspect ratio characteristics of the oxidic and sulfidic inclusions differ significantly, Figure 2b. Therefore, the sulfidic characteristic reveals higher aspect ratios than the oxidic distribution. This observation can be explained by the fact that manganese sulfides become pancake shaped during hot working and rolling [10,12].
In the subsequent micromechanical simulations, NMI and voids of the 10th, 50th and 90th percentile for the defect length scale λ and aspect ratio characteristics are modeled and evaluated with respect to fatigue crack initiation properties. Table 2 shows the inclusion properties of the corresponding percentiles.

3. Modeling Methodology and Constitutive Model

Scope of the present study is to assess the influence of different types of NMI and voids on the fatigue crack nucleation behavior of the considered martensitic steel. In this context, multiple SVEs containing different types and dimensions of defects are analyzed by means of a micromechanical model. This section deals with the description of the individual contributors to the micromechanical model, including (1) generation of statistical volume elements; (2) constitutive model; (3) development of residual stresses during quenching; (4) fatigue indicator parameters and the crack nucleation model and (5) the strategy of the numerical design of experiment for the different defect simulations.

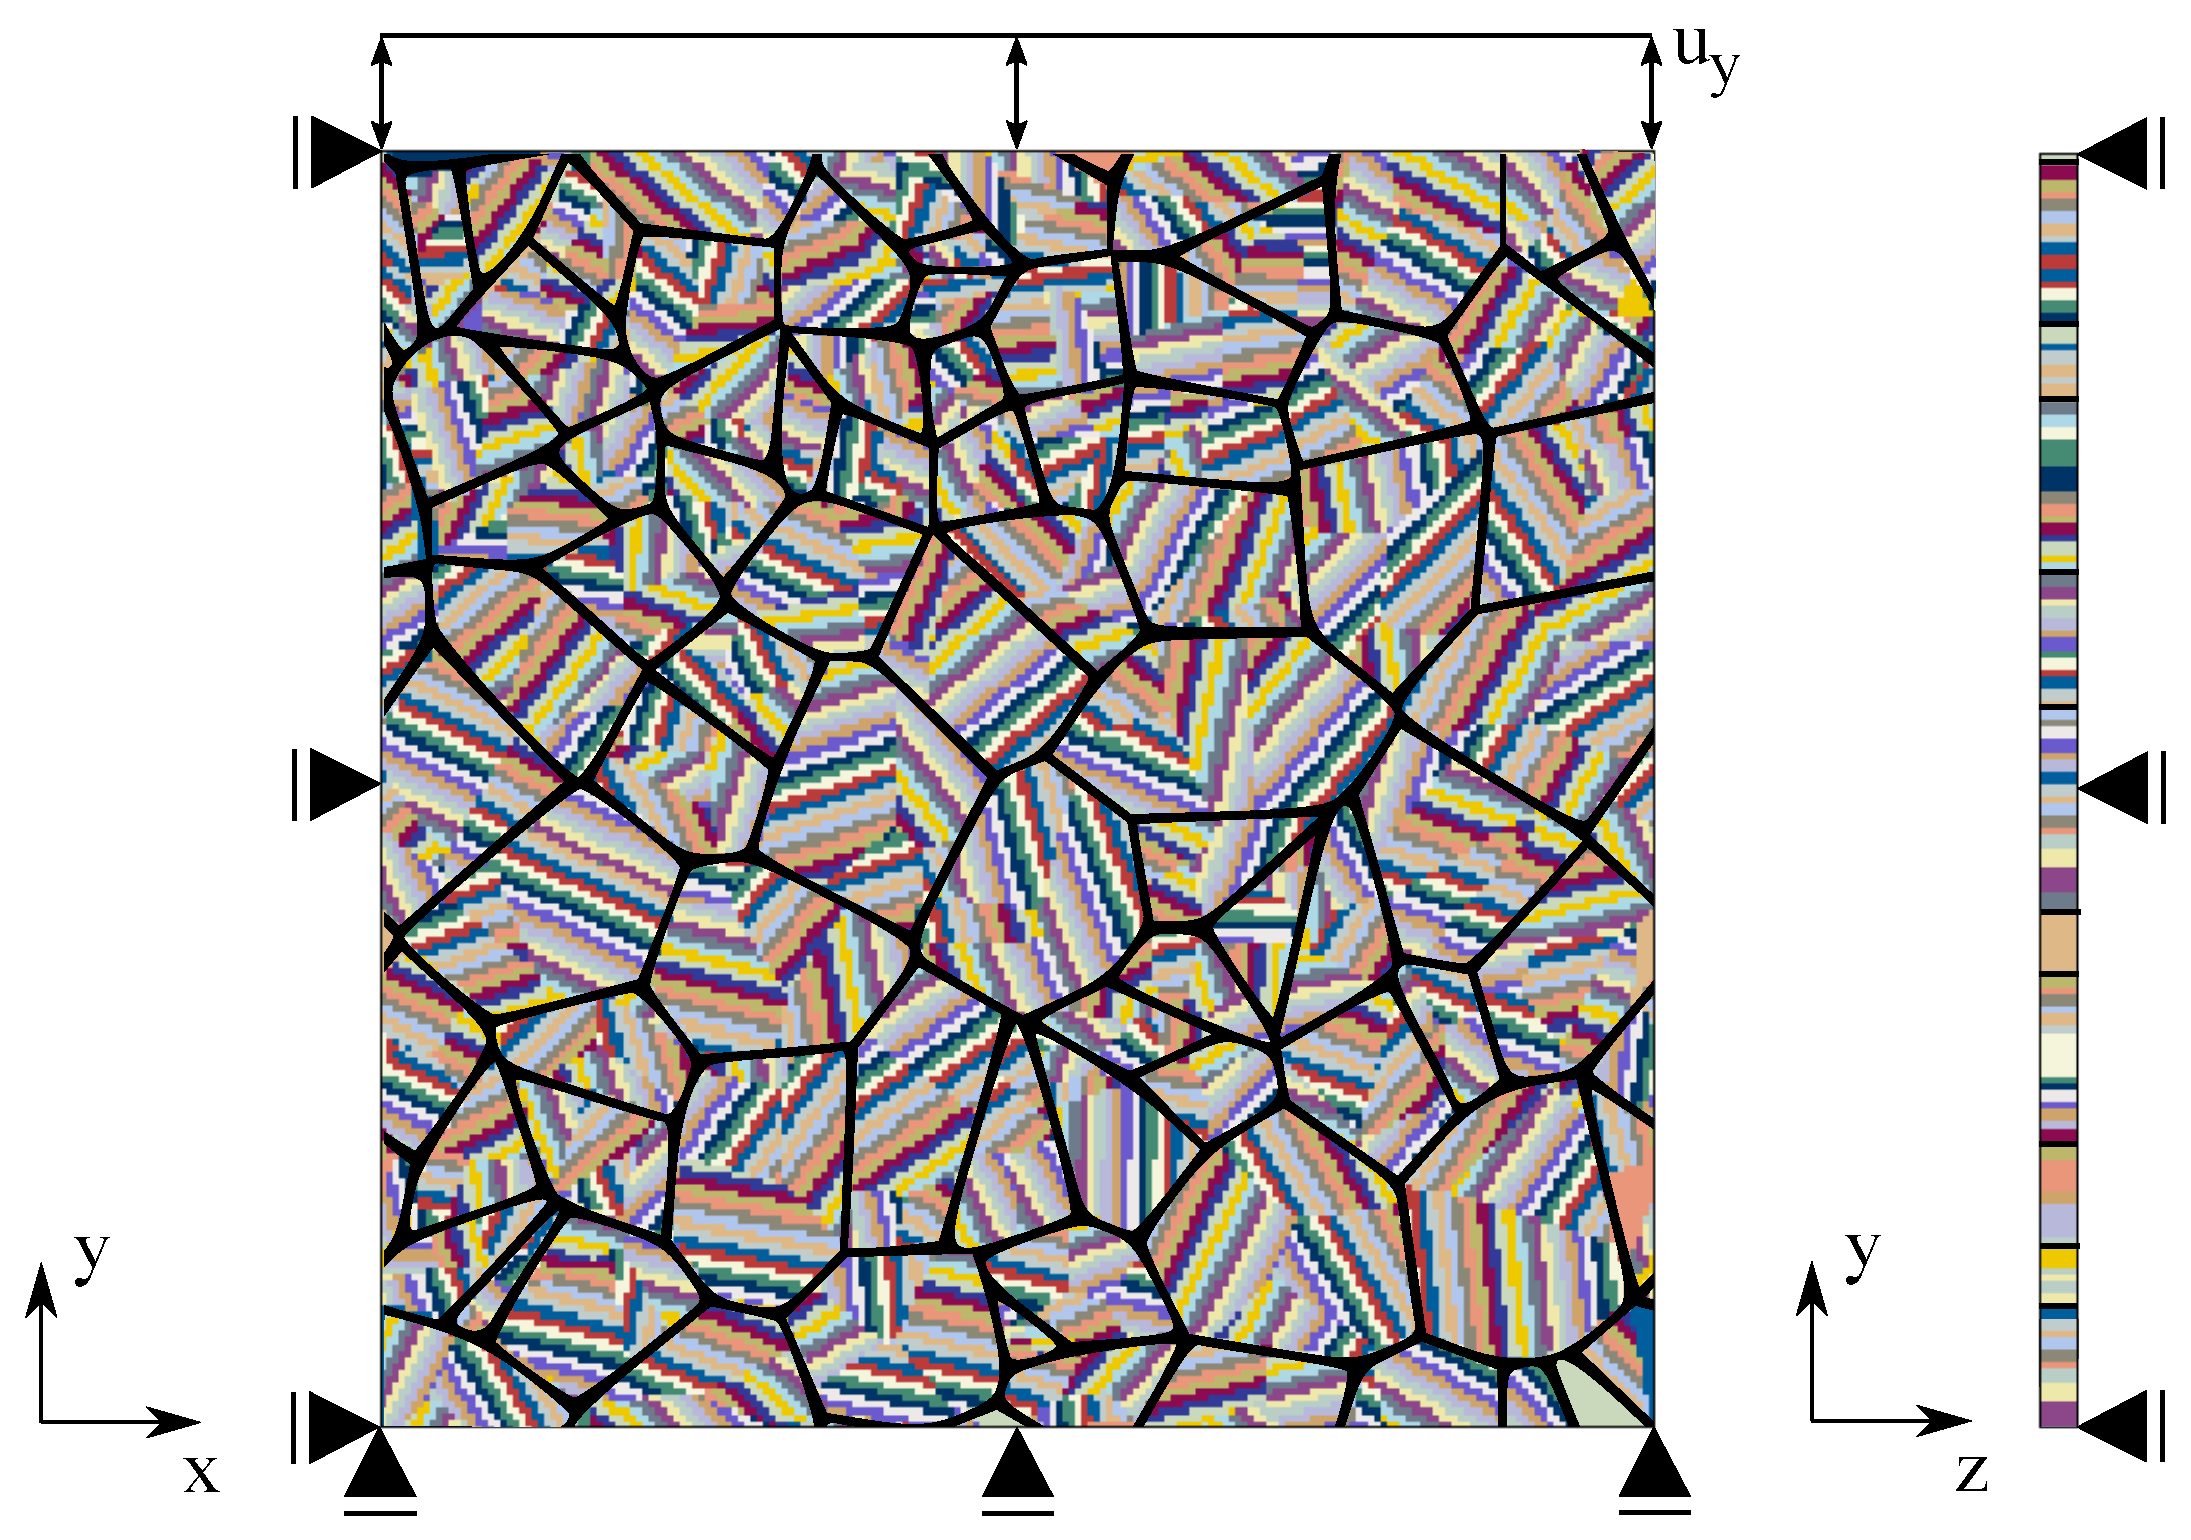
3.1. Modeling Statistical Volume Elements

To model the statistical variations of polycrystalline microstructures in a computational feasible way, it is recommended to work with SVEs [21]. In a first step, martensitic SVEs without imperfections are generated serving as reference configurations in subsequent analyses. In a second step, inclusions with different inclusion–matrix interfaces, sizes and shapes are inserted within the microstructure.

3.1.1. Modeling Martensitic Statistical Volume Elements without Defects

Martensitic SVEs without defects were generated by multiscale Voronoi tessellations within a framework of the C++ software library voro++ (Version: 0.4.6) and python (Version: 2.7). This martensitic microstructure generator has been developed in a previous study by the authors and more details about the generation process are given in [49].
For the present work, three virtual SVEs were generated to represent a portion of the stochastic nature of metallic microstructures and the corresponding variability in fatigue crack initiation. For the accurate crystallographic representation of the lath martensitic structure of the investigated material, the different SVEs incorporate the Nishiyama-Wassermann orientation relationship [49]. The three different SVEs are build up on different numbers of prior austenite grains, crystallographic packets and blocks. Figure 3 shows exemplary front and side views of a selected SVE, illustrating the domain with the boundary conditions and the enforced uniaxial strain-controlled loading conditions. The choice of the applied boundary conditions agree well with comparable numerical investigations from Prithivirajan and Sangid [43].
For simplicity, this study focuses exclusively on the in-plane interactions between the martensitic constituents and the non-metallic inclusions. Hence, the martensitic blocks are represented as columnar grains in the out-of-plane direction (4 elements thickness). The defect-free representations were meshed with 200 × 200 × 4 = 160,000 eight-node hexahedral linear brick elements with reduced integration (C3D8R in Abaqus).

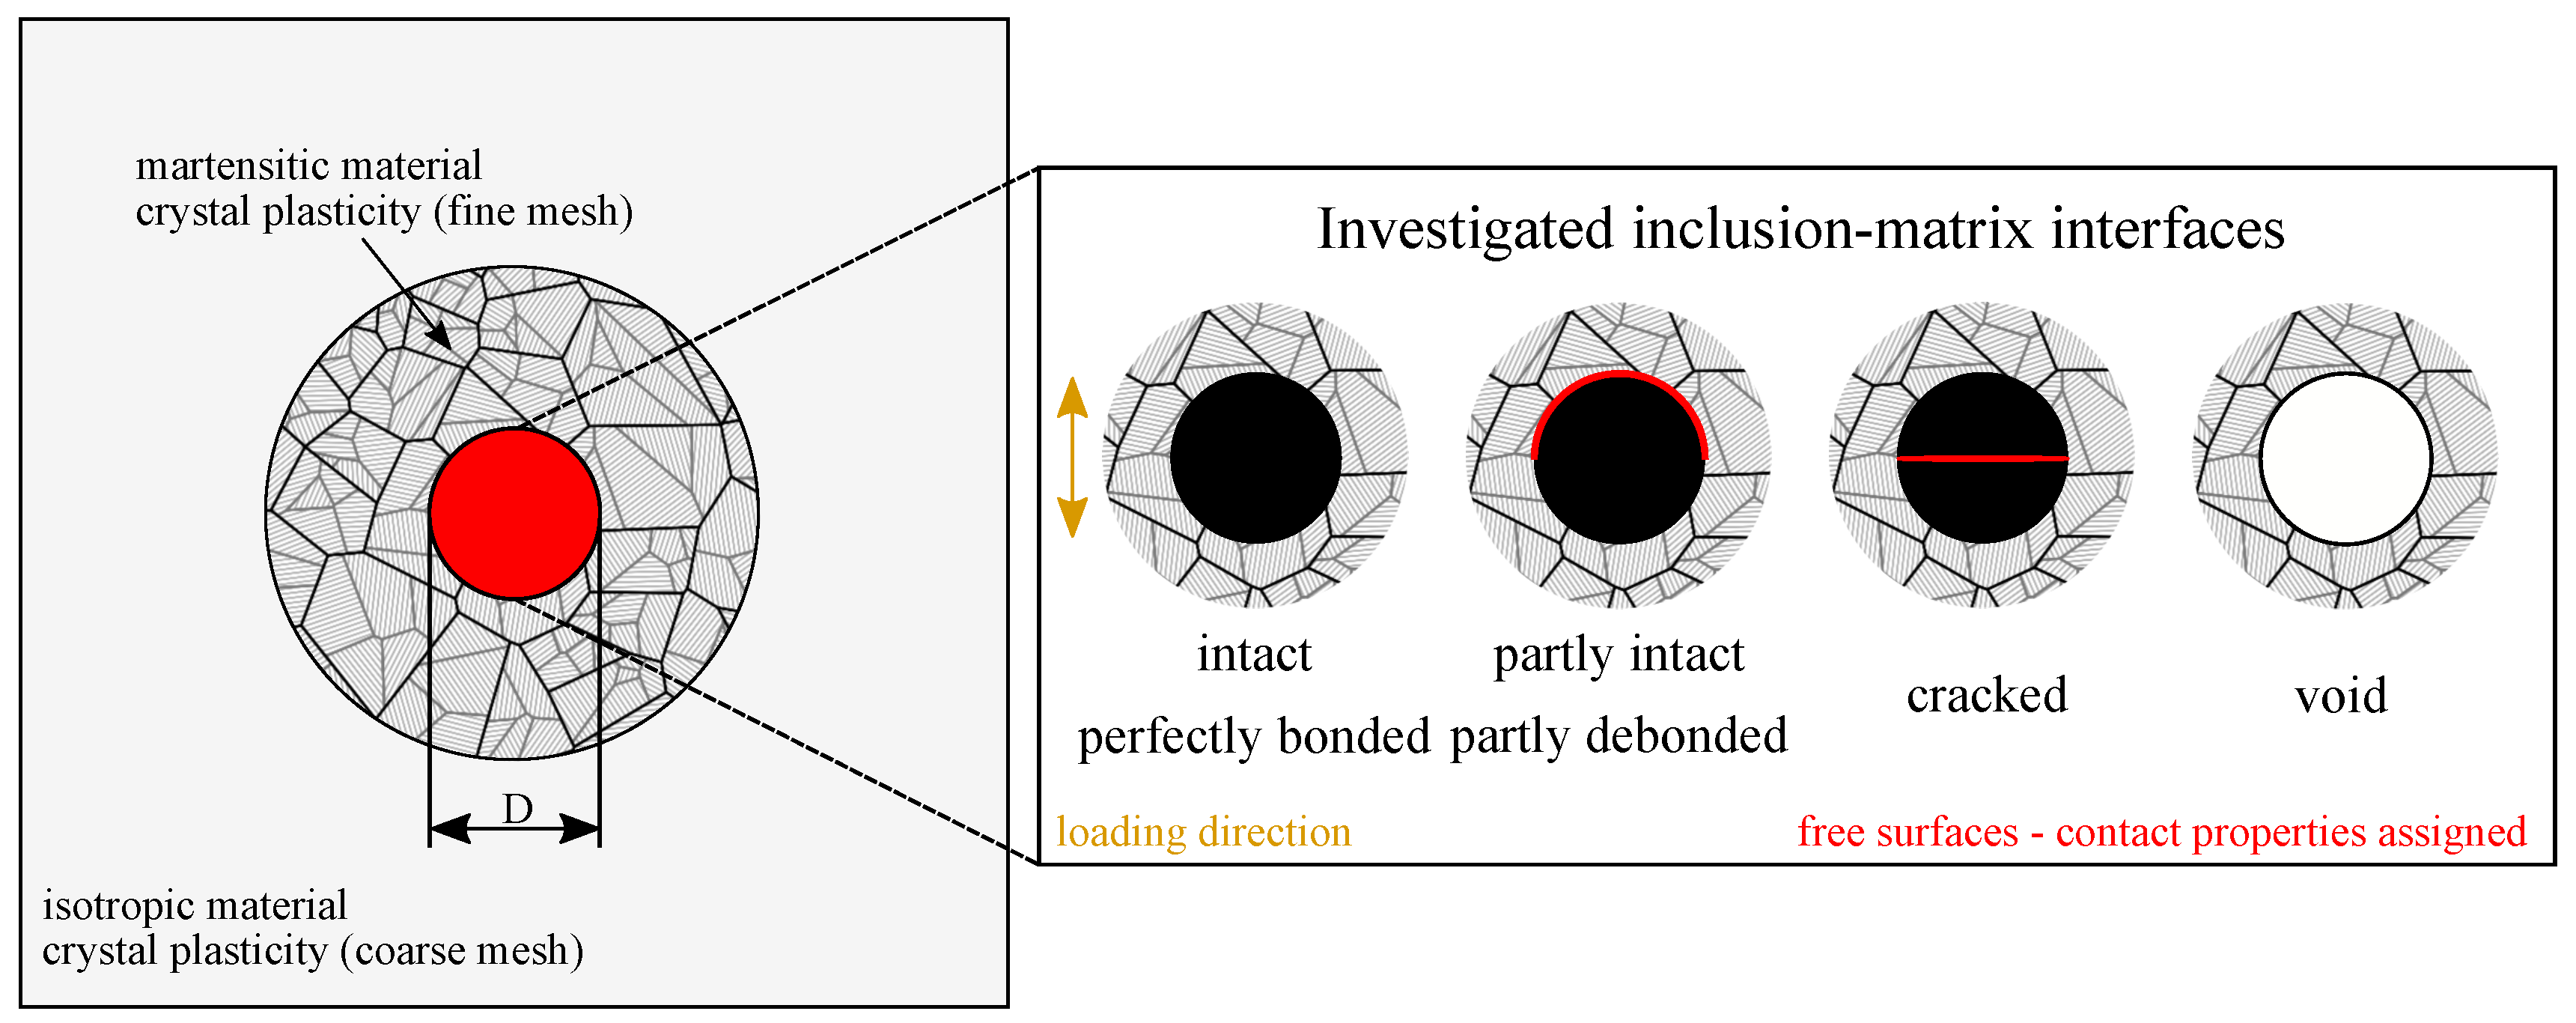
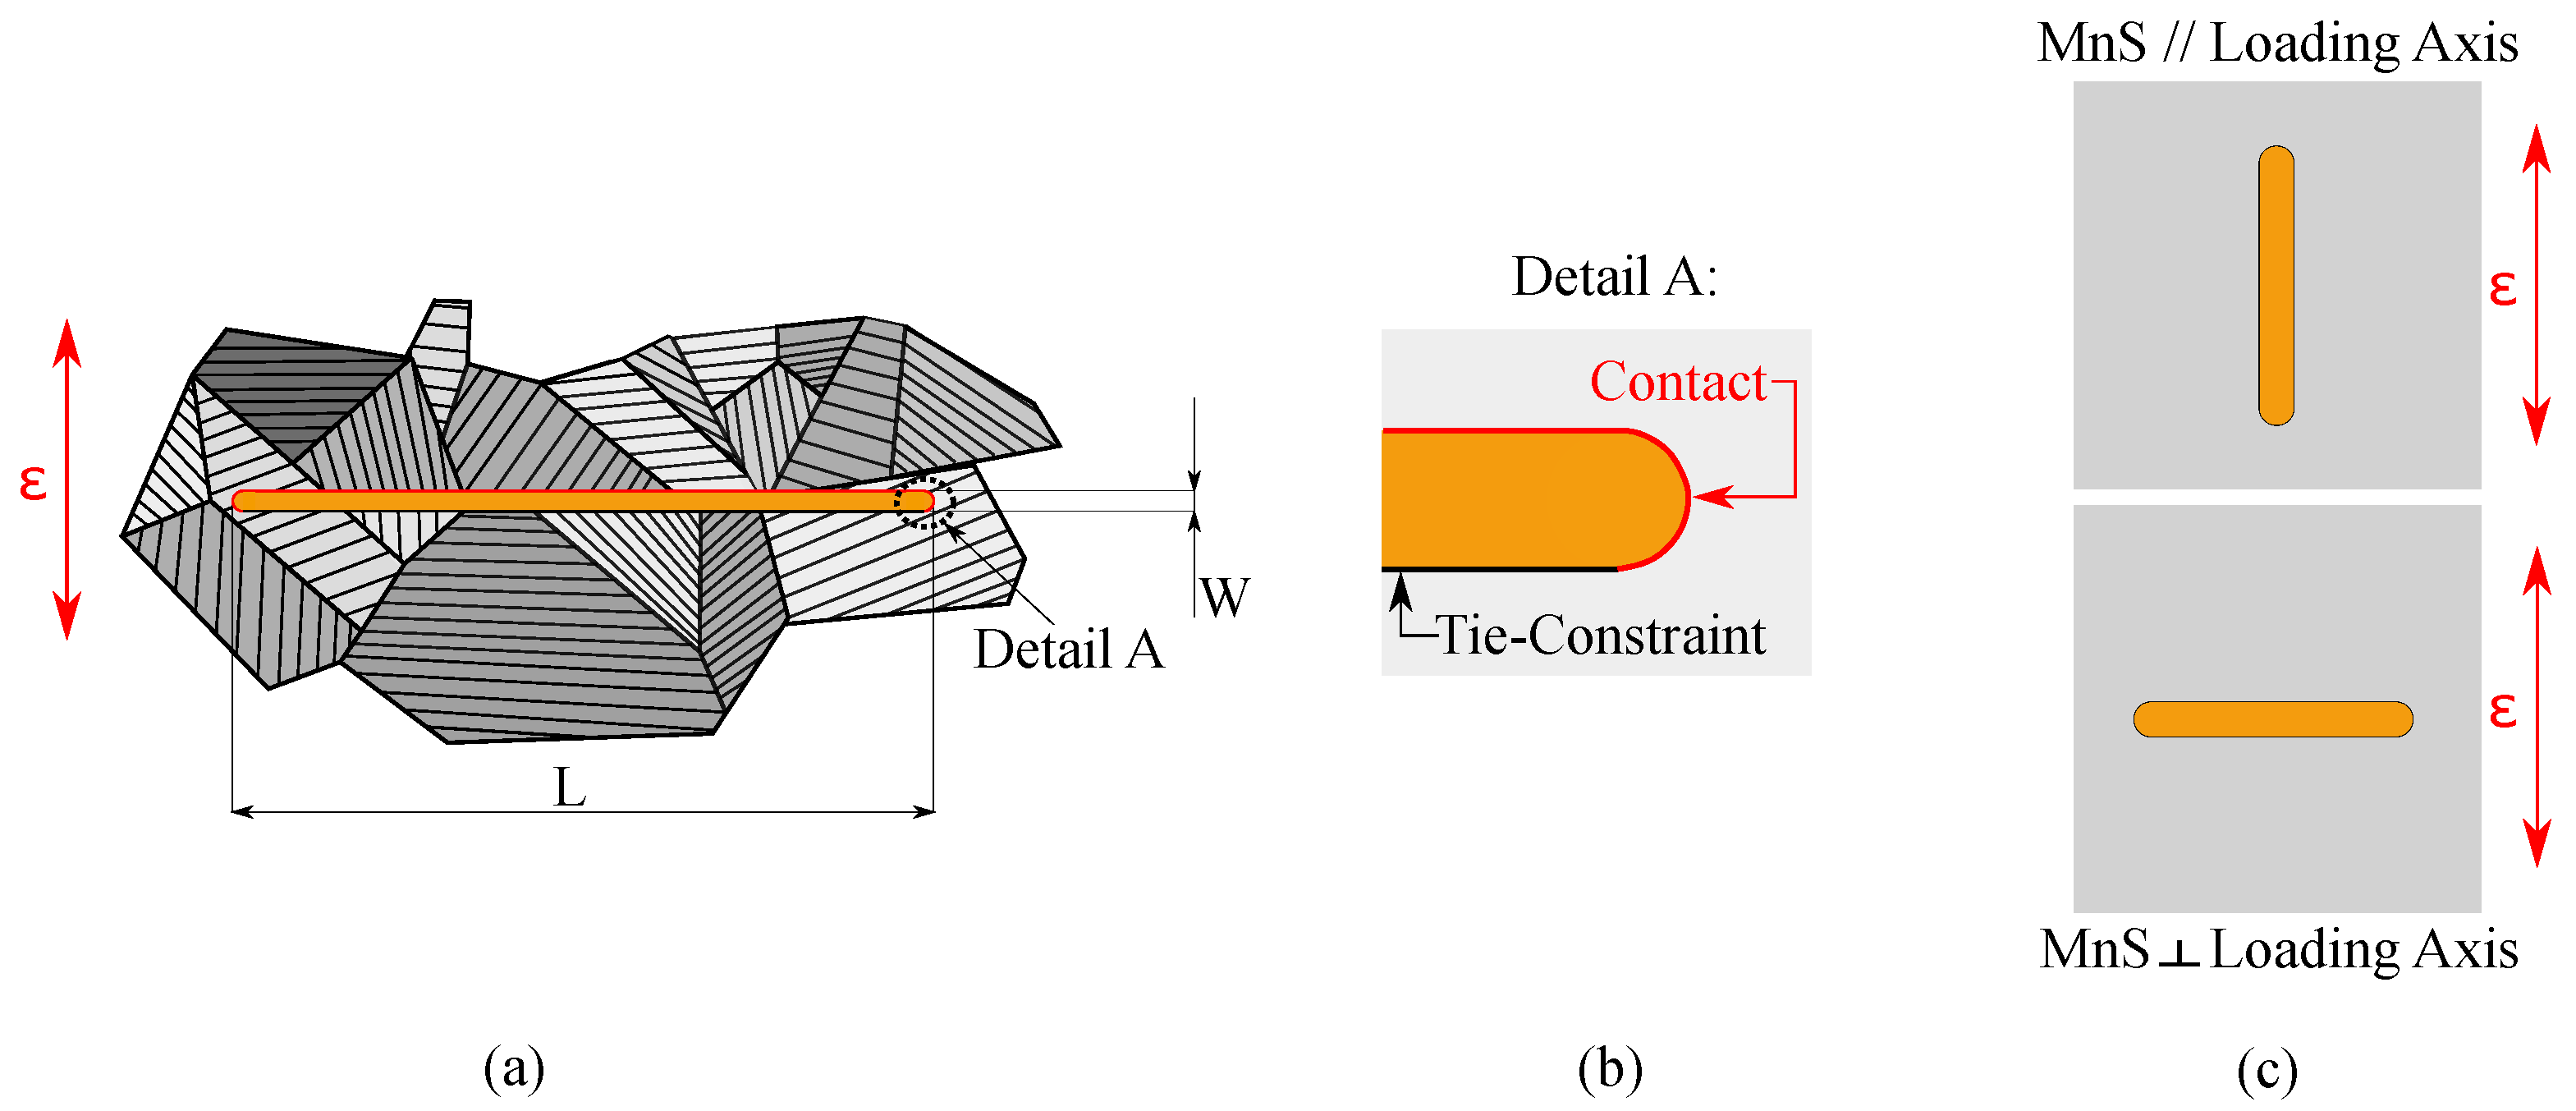
3.1.2. Modeling Martensitic Statistical Volume Elements with Defects

Oxidic (Al 2 O 3 ) and sulfidic (MnS) non-metallic inclusions represent critical life-limiting inclusion types for the investigated steel, based on the results from Section 2.2. In the subsequent micromechanical simulations, for simplicity, inclusions are modeled as homogeneous parts with isotropic linear elastic properties which are specified in Table 3. The surrounding martensitic matrix is simulated by means of the crystal plasticity model.
Experimental investigations of fracture surfaces of martensitic steels have shown different inclusion–matrix interface conditions for oxidic and sulfidic inclusions [12,57]. Thus, three different natures of inclusion–matrix interfaces are investigated for the oxidic inclusion types, in the present study: intact interface (perfectly bonded), partially debonded interface and an intact interface with a cracked inclusion. In addition to the three different oxidic inclusion–matrix configurations, voids are also considered to be potential microstructural defects which may cause fatigue crack initiation. Figure 4 visualizes the different interface conditions in a schematic way.
Corresponding contact definitions between the martensitic matrix and the inclusion enable proper realizations of the different inclusion–matrix configurations, as shown schematically in Figure 4. Perfectly bonded inclusions are modeled via tie-constraints enabling the representation of an intact interface between matrix and inclusion. The partly debonded inclusions are modeled in the lower half with a contact without separation and in the upper half with a hard frictionless contact with the possibility of separation. Finally, the cracked inclusions are tied at the martensitic matrix interface and a crack seam in combination with a hard frictionless contact represent the crack through the inclusion.
Inspired by Figure 1d and fundamental experimental works revealing managanese sulfides on fracture surfaces of related steels, e.g., Hosseini et al. [12], Maciejewski [13] and Cyril et al. [10], manganese sulfides were modeled as elongated stringers with a high aspect ratio, in the current study. Based on the experimentally observed fracture behavior of MnS inclusions perpendicular to the loading axis by Hosseini et al. [12], MnS inclusions were modeled also as partially debonded inclusions. Thus, a schematic visualization of the geometric modeling and the different contact regions of the manganese sulfides within the martensitic microstructure is shown in Figure 5.
According to Figure 5a, the manganese sulfides were modeled with finite lengths and widths. Therefore, different aspect ratios can be realized. In the present study three different aspect ratios were modeled, AR = 10, 25 and 54. However, the width of the manganese sulfides were kept constant of approximately 4.0 μ m which is in order of the martensitic block width corresponding to experimental observations. The spatial contact properties between the martensitic matrix and the MnS are visualized in Figure 5b representing a detailed view of Figure 5a. The lower part of the MnS is permanently connected with the martensitic matrix via a tie constraint (black line). On the other hand, the radii on the upper part of the MnS (red curve) reveal hard contact definitions with frictionless properties in tangential directions. Therefore, the experimentally observed fracture behavior of MnS perpendicular to the loading axis may be reproduced. A further degree of freedom in modeling is the spatial alignment of the MnS with respect to the loading axis. Figure 5c shows both the parallel and perpendicular orientation of the MnS to the loading axis. In case of mechanical loading parallel to the long axis of the MnS inclusion, the interface conditions between the MnS and the martensitic matrix are considered to be being perfectly bonded by a tie constraint. Both loading variants are modeled in the present investigation to investigate the effect of anisotropic FCN characteristics.
The investigated oxidic and sulfidic inclusions with the dimensions out of Table 2 were positioned in the center of gravity in the SVE. In analogy to the geometric representation of the martensitic blocks, the inclusions were also modeled as columnar geometries in the out-of-plane direction. After generating the geometric properties of the martensitic SVE without defect, a mesh of the corresponding SVE with the intended inclusion was created. Therefore, each inclusion parameter (size and aspect ratio) can be modified and investigated in a separate way. By using a python code, a martensitic orientation based on its spatial position in the geometric SVE was assigned to each mesh element. According to Figure 4, two different material and mesh zones were realized within the SVE with defect for computational efficiency. In the vicinity of the inclusions and voids a fine mesh with resolved martensitic microstructure is employed coarsening out away from the defects. In the far-field zone, which is at least more than an inclusion diameter away from the inclusion–matrix a coarse mesh is adopted to the martensitic microstructure. In order to improve the convergence behavior of the geometric non-linear problem, an automatic stabilization technique in form of volume-proportional damping was used [58].

3.2. Local Crystal Plasticity Model

The mechanical anisotropic elastic-plastic deformation behavior of single crystals is due to the anisotropy of the elastic tensor and the crystal orientation. Crystal plasticity finite element models represent powerful techniques to solve such complex mechanical problems to perform micromechanical fatigue crack initiation predictions around defects and voids, for example [20]. This computational method enables the simulation of the local cyclic mechanical response of the lath martensitic material. In addition, the methodology enables the micromechanical computation of residual stresses around inclusions during thermal heat treatments. For this reason, the incorporation of a quasi-thermal expansion approach into the aforementioned mechanical crystal plasticity model is proposed in the present study.

3.2.1. Constitutive Equations

In the present study a local phenomenologic crystal plasticity model is used which was developed recently [25,49]. The micromechanical model predicts adequately the Bauschinger effect, the mean stress relaxation behavior and the fatigue crack initiation characteristic of the considered material for different strain ranges and strain ratios. The implementation, the model description and the calibration procedure to experimental fatigue data can be found in detail in [49]; however, the key equations are outlined here for the purpose of completeness.
The local CPFEM model was incorporated into a large deformation framework. In this study, the deformation gradient from [49] is expanded by a thermal part. The total deformation gradient F can be multiplicatively decomposed into a thermal deformation part F θ and a mechanical deformation part F m , as proposed by Lu and Pister [59]. Therefore, the mechanical deformation part can be subdivided into an elastic stretching F e and plastic deformation F p part, as suggested by Lee [60]:
F = F θ F m = F θ F e F p .
In the first step, the mechanical part of the crystal plasticity model is explained to calculate the slip system dependent plasticity behavior under the applied fatigue loading. According to Sherby et al. [61], martensitic quenched Fe-C steels up to 0.6 mass% C reveal a body-centered cubic (BCC) lattice. The resulting plastic deformations in this BCC martensitic structure may include in-lath- and out-of-lath-plane slip systems, the {110}<111> and {112}<111>, respectively. According to Michiuchi et al. [62], the {110} in-lath-plane slip systems are preferentially activated. Thus, only the 12 {110}<111> slip systems are incorporated into the CPFEM model in the present study. Assuming that dislocation slip is the main mechanism for plastic deformation, the plastic velocity gradient L p can be expressed as the superposition of the shear rates of the different slip systems α by
L p = F ˙ p F p 1 = α = 1 12 γ ˙ α m α n α
where γ ˙ α , m α and n α are the shear rate, the unit vector in slip direction and the unit vector normal to the slip plane of the slip system α , respectively [63]. The slip system dependent shear rate γ ˙ α is formulated via a phenomenological visco-plastic flow rule as a function of the resolved shear stress τ α and the critical resolved shear stress τ c , 0 α . This traditional formulation was initially proposed by Rice, Hutchinson and Pierce et al. [63,64,65]:
γ ˙ α = γ 0 ˙ τ α χ b α τ c , 0 α m s i g n ( τ α χ b α )
where γ 0 ˙ , τ α , τ c , 0 α and χ b α are the reference shear rate, the resolved shear stress, the critical resolved shear stress and the back stress of the slip system α , respectively. The exponent of the power law is represented by m. Cyclic material modeling requires the consideration of kinematic hardening. Therefore, a back stress variable χ b α is incorporated into the flow rule formulation. In the present study, a modified version of the Ohno Wang [66] kinematic hardening model is used. Thus, the evolution of the back stress χ ˙ b α on the crystal level is given by
χ ˙ b α = A γ ˙ α B | χ b α | A B M χ b α | γ ˙ α |
where A, B and M are material specific constants [23].
In a second step, the thermal part of the crystal plasticity model is now introduced to account for the residual stress evolution in the matrix around inclusions. The thermal deformation gradient F θ is assumed to be purely isotropic because the investigated martensite exhibits a cubic crystal symmetry [61]. Following Lubarda [67] and Vujosevic and Lubarda [68], the thermal part of the deformation gradient can consequently be expressed by
F θ = ϑ ( θ ) I = J θ 3 I , J θ = d e t ( F θ )
where ϑ ( θ ) and I represent the thermal stretch ratio in any material direction and the second order identity tensor, respectively. The resulting deformation induced by the temperature change can be defined as follows
J θ = e 3 α T [ T T 0 ]
where T, T 0 and α T stand for the absolute temperature, the reference temperature and the linear CTE, respectively [68]. The aforementioned crystal plasticity model was implemented in Abaqus/Standard 2016 as a user material subroutine (UMAT).

3.2.2. Calibration of the Crystal Plasticity Model

The material parameters of the crystal plasticity model were identified in a previous study of the authors [49]. There, the model was calibrated to three different fully reversed stabilized hysteresis loops and the corresponding mean stress relaxation behavior of total strain-controlled fatigue experiments. The complete model calibration procedure is described in detail in Schäfer et al. [49]. The crystal plasticity model parameters to simulate the cyclic material behavior of the investigated SAE 4150 are presented in Table 4.

3.3. Simulation Methodology for Residual Stress Development

The simulations of the residual stresses around the non-metallic inclusions were based on the SVEs with inclusions from Section 3.1. In general, the residual stress evolution was performed in the first simulation step with a purely temperature gradient of Δ T = 820 K (temperature range from the austenitizing temperature of 840 °C to room temperature of 20 °C). The tempering process was neglected due to the relatively minor effects on residual stress redistribution [45]. After the quenching step (temperature cycle), the temperature was kept constant and solely mechanical cyclic fatigue loading was applied for five loading cycles to the SVEs with defects.
According to Table 3, the mechanical properties of the inclusions are assumed to be isotropic and elastic [40,45]. In contrast, the martensitic matrix around the inclusions is modeled with the aforementioned CPFEM model. The interface conditions between the matrix and the inclusions during the cooling process are perfectly bonded.
MnS show higher CTEs than the surrounding steel matrix (see Table 3). Thus, MnS introduce either compressive residual stresses or contract away from the matrix and create cavities [3,11]. According to Murakami [3], the majority of fracture surfaces show debonded MnS inclusions within the matrix indicating a weak interface strength between matrix and MnS inclusions. Consequently, the residual stresses formation around MnS and pores are neglected in the present study. Therefore, the tessellated stresses are solely taken into account at the oxidic inclusion configurations, in the present investigation.

3.4. Fatigue Indicator Parameters and Fatigue Crack Nucleation Model

A well-established technique to provide information about the location and the relative severity of fatigue hotspots in cyclically loaded SVEs is represented by the FIP concept. These mesoscopic parameters facilitate the combination of tensor quantities such as stresses and plastic strains over single fatigue loading cycles into scalar measures which can be directly linked to fatigue damage [19]. In the past, a variety of different FIPs have been introduced for different fatigue crack nucleation mechanisms, as for example the accumulated plastic slip [25], the Fatemi–Socie metric [41,46] and the dissipated plastic energy [69].
Based on the results from a previous study by the authors [28], the Fatemi–Socie (FS) [70] metric was selected as an adequate parameter to predict fatigue crack nucleation under complex loading conditions in the BCC martensitic matrix. The two-parametric FS approach represents a critical plane approach because it accounts for severe fatigue damage at planes with high cyclic plastic slip ranges. The dimensionless scalar FS metric is defined by
FIP FS = m a x Δ γ p α 2 1 + k σ n α τ c , 0 α = 1 12
where Δ γ p α is the local plastic shear strain range of the cycle at each slip system, σ n α is the corresponding maximum normal stress to the plane of Δ γ p α , τ c , 0 is the initial critical resolved shear stress and k represents a weighting coefficient which controls the influence of the normal stress. In the present study, the weighting coefficient k was set to 1.0 [46].
To account for a material specific damage zone and to avoid mesh sensitivities of the results, the FS metric must be homogenized over a region representative of the material specific crack incubation zone [19]. In Schäfer et al. [28], a non-local homogenization procedure for lath martensitic microstructures was introduced, which was applied in the present study. The diameter of the finite homogenization sphere was set to the average martensitic block width of approximately 3.0 μ m.
The fatigue crack nucleation model which enables the determination of the fatigue crack nucleation lifetime ( N c r i t ) can be expressed by:
N c r i t = FIP crit FIP FS
where FIP crit and FIP FS represent the material specific critical FIP and the saturated non-local Fatemi–Socie FIP. Further information about the fatigue crack nucleation model is given in Schäfer et al. [28].

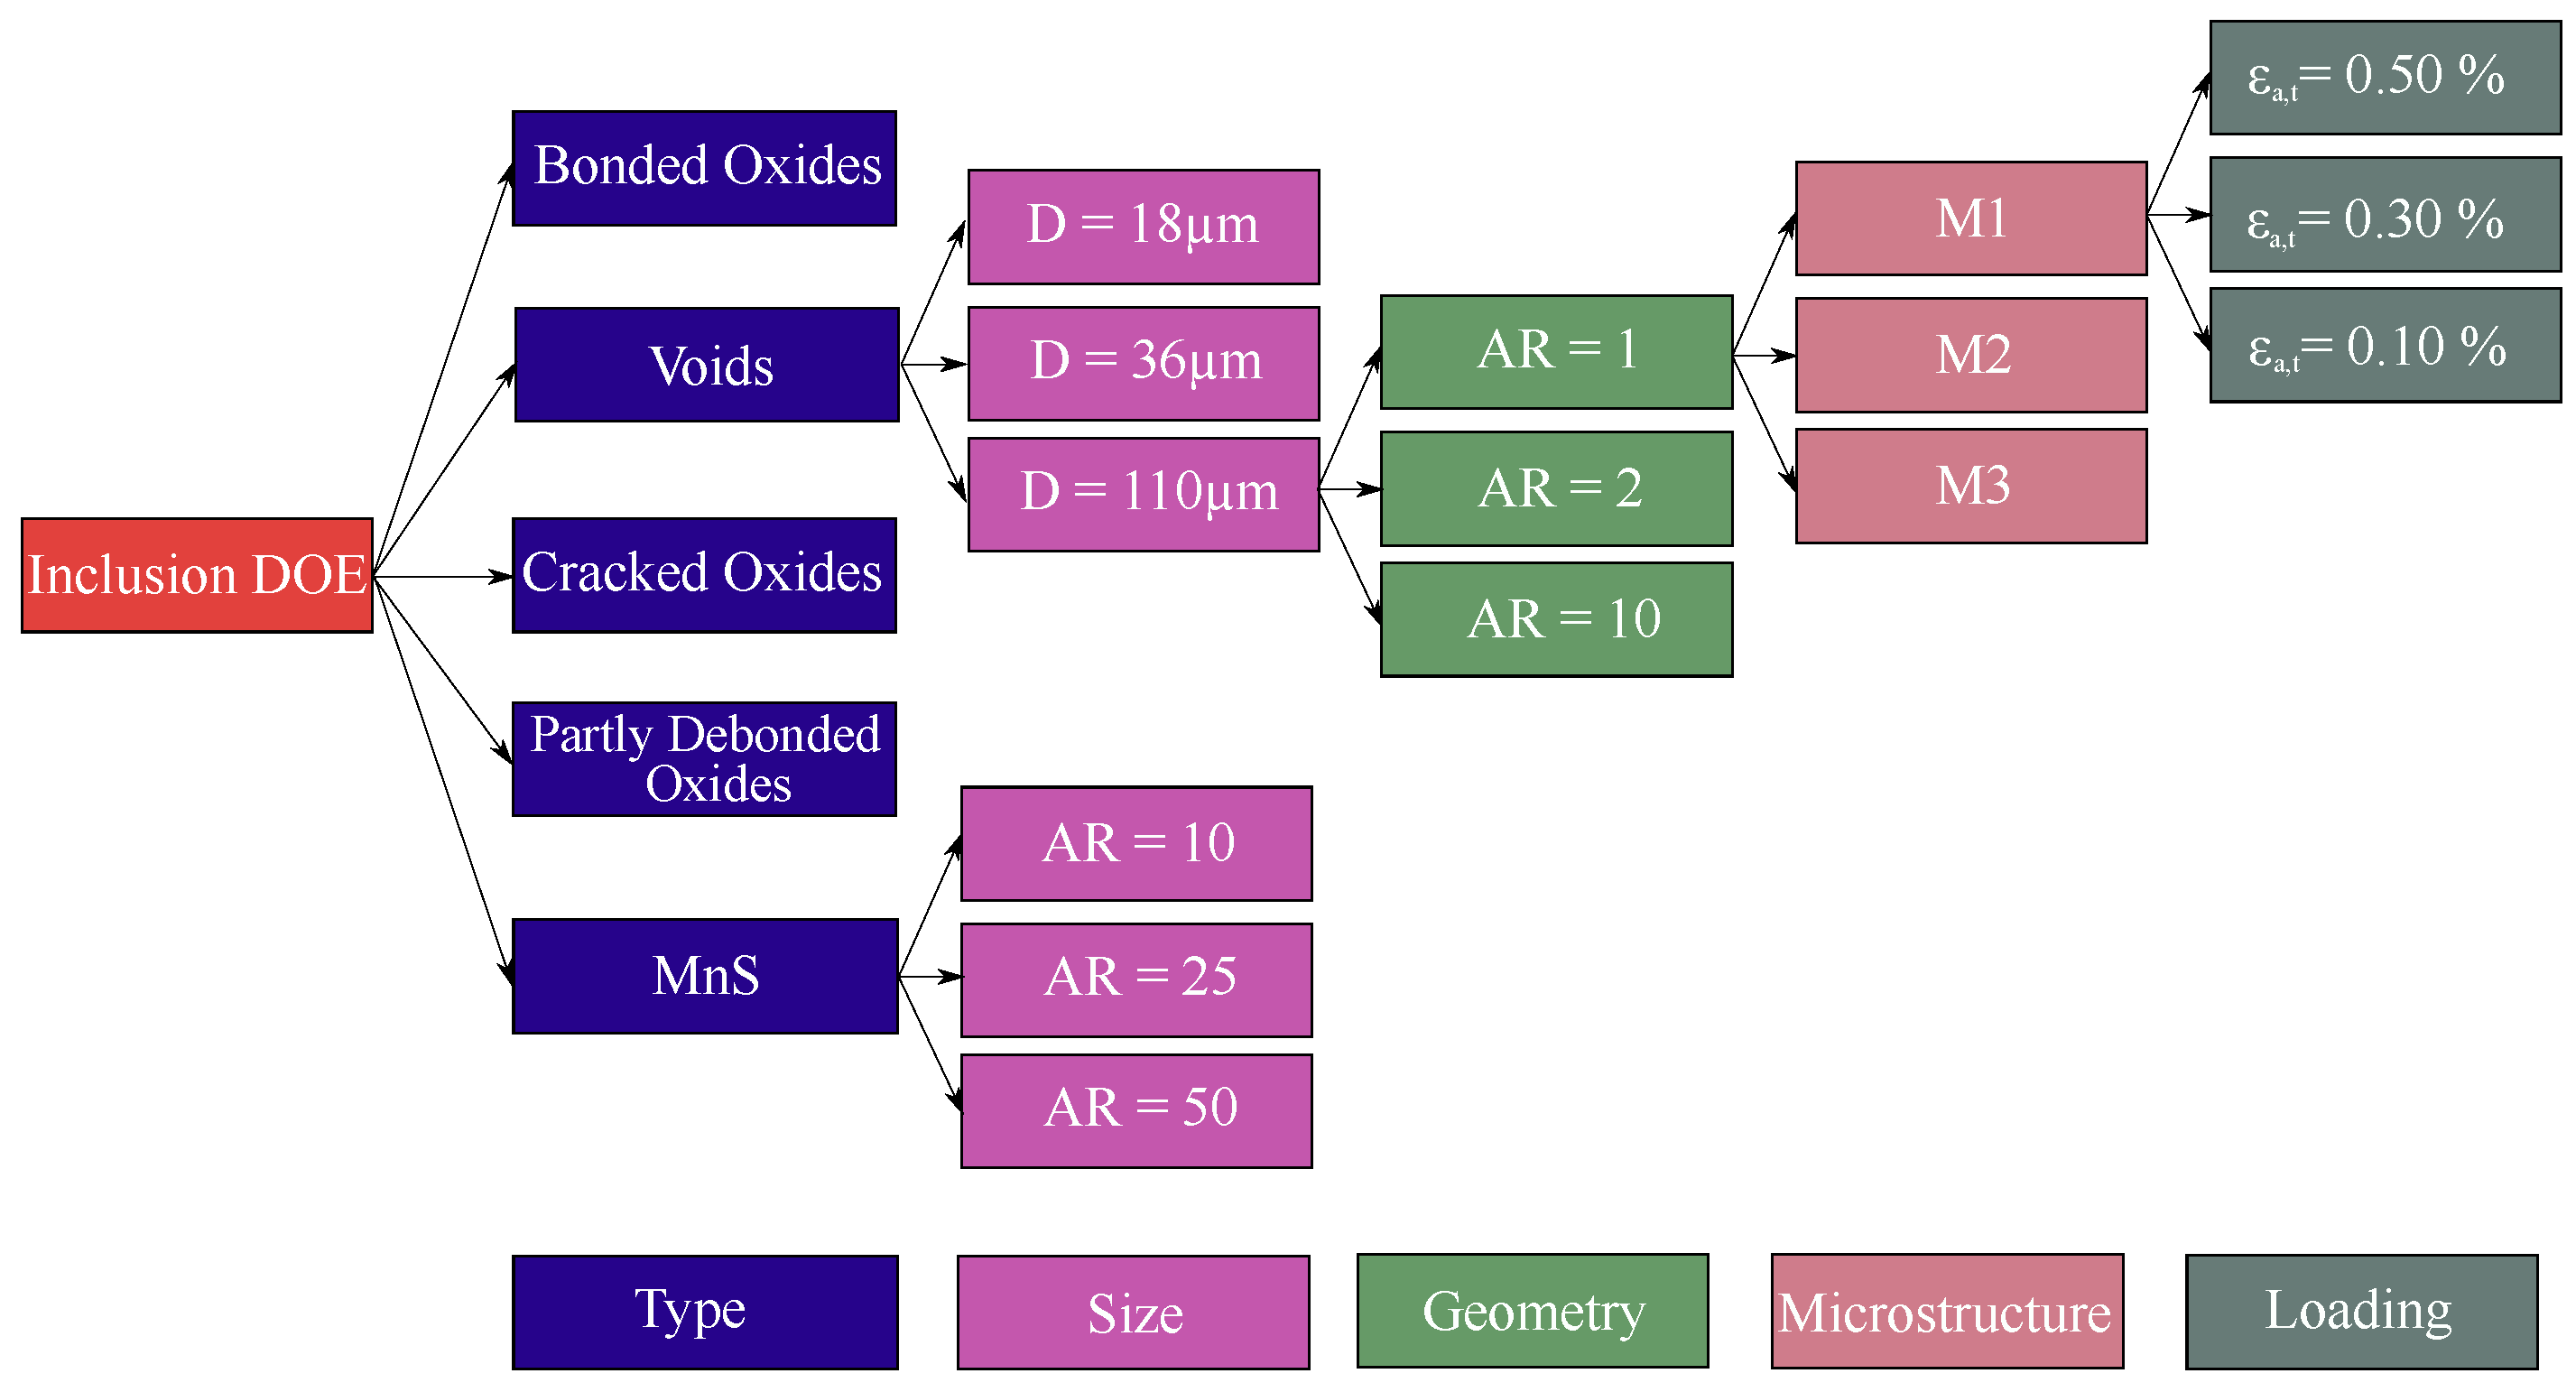
3.5. Strategy of the Numerical Design of Experiment

The failure-relevant inclusions and the presented modeling methodology reveal a certain number of degrees of freedom, e.g., type of defect, inclusion size and geometry and interface configuration. Therefore, a systematic investigation is required to understand the influence of the individual inclusion parameters on the fatigue crack initiation behavior. The corresponding derived numerical design of experiment with its five-level hierarchy is schematically shown in Figure 6.
According to Figure 6, five different defect types are considered in the present study: Bonded oxides, cracked oxides, partly debonded oxides, voids and manganese sulfides. All types of oxidic inclusions and voids were simulated with three different diameters: D = 18 μ m, D = 36 μ m and D = 110 μ m. For the sake of simplicity, oxidic inclusions were simulated solely with an aspect ratio of AR = 1, whereby voids have also been modeled for aspect ratios of AR = 1, AR = 2 and AR = 10. The manganese sulfides were modeled for three different aspect ratios of AR = 10, AR = 25 and AR = 54 with a constant width of 4 μ m. Furthermore, the manganese sulfides with AR = 54 were modeled both perpendicular and parallel to the loading direction. In total 147 micromechanical simulations were performed using three different microstructural realizations and three different total strain amplitudes at R ε = 1 for each of the inclusion and defect configuration. Therefore, the total strain ratio R ε = ε t , m i n / ε t , m a x is defined as the ratio of the minimum ε t , m i n and maximum ε t , m a x applied total strain during a cycle.

4. Results and Discussion

Fundamental parameters which may influence fatigue crack initiation at non-metallic inclusions and other defects were reported in Section 1 and in Figure 6. In this section, the influence of each parameter is investigated in an isolated way by keeping the others constant. First, the influence of different microstructural realizations on the local fatigue response is studied at voids. Next, the effect of residual stresses at oxidic inclusions on fatigue crack initiation behavior is analyzed. Furthermore, the effect of different inclusion–matrix interfaces, inclusion and void sizes and aspect ratios are investigated regarding their fatigue damage potential. Finally, the different numerical examples are shown in a lifetime diagram in comparison to microstructures without defects and inhomogeneities.
According to Bandyopadhyay and Sangid [44], Gillner et al. [40] and Gall et al. [37], five to six computational cycles are sufficient to stabilize fatigue response in microstructures containing inclusions and voids under fatigue loading. Thus, the subsequent micromechanical fatigue simulations were performed for five unidirectional loading cycles at total strain amplitudes of ε a , t = 0.10 % , 0.30 % and 0.50% at R ε = 1 . Evaluations of the fatigue response saturation behavior showed saturated Fatemi–Socie parameters after the fourth loading cycle at the latest. In the subsequent results and discussion part, Fatemi–Socie values are reported at the end of the fifth mechanical loading cycle. The preliminary study will not take into account different strain ratios and variable amplitude loading.

4.1. Influence of Microstructural Variability

The influence of the microstructural variability on fatigue crack nucleation behavior of microstructures with defect is shown in the following section using the example of the voids. This defect type was selected due to both the absence of residual stresses and stress singularities at inclusion–matrix interfaces. The general influence of different microstructures around the other defect configurations is also considered in the present study and the results are shown in Section 4.4 and below.
Three different microstructural realizations were simulated for each of the void types with an aspect ratio of AR = 1.0 and D = 18 μ m, D = 36 μ m and D = 110 μ m for three total strain amplitudes of ε a , t = 0.10 % , 0.30 % and 0.50 % at R ε = 1 . Figure 7a–c show the non-local Fatemi–Socie parameters along radial paths through the hot spot of each microstructural realization for the voids with D = 18 μ m, D = 36 μ m and D = 110 μ m at ε a , t = 0.50 % , respectively. The fatigue crack nucleation locations at the considered voids are located close to the equator at the defect root.
Figure 7a reveals clearly the effect of local grain anisotropy on the non-local Fatemi–Socie response for the voids with D = 18 μ m. The ratio of the maximum (red curve) to the minimum (black curve) fatigue response accounts to 2.02. In contrast, the largest voids in Figure 7c with D = 110 μ m show a reduced factor of 1.52. Following Carroll et al. [38], a ratio between the void size and the underlying grain size (here block size) can be defined which characterize the level of anisotropic fatigue response. Ratios close to unity may cause highly heterogeneous local responses due to local grain anisotropy effects [38]. Here, assuming constant martensitic block widths of 4.0 μ m, the voids exhibit void-to-block-ratios of 4.5, 9.0 and 27.5 for D = 18 μ m, D = 36 μ m and D = 110 μ m, respectively.
Considering the fatigue responses of three void sizes at the three applied strain levels in the context of the void-to-block-ratio, it can be confirmed that the level of response heterogeneity increase with decreasing void-to-block ratio, in particular for the lowest loading level, shown in Table 5. These investigation results correlate well with the findings from Correll et al. [38] and Battaile et al. [39]. A potential explanation for the large reduction factor at the lowest loading level for D = 18 μ m could be the superposition of the following two phenomena. First, the considered small defects show in general small fatigue responses due to the low applied loading amplitude and the limited resulting plasticity and stress levels. Second, microstructural variability of the SVEs may cause block orientations close to the critical locations which exhibit low mechanical response at the applied loading level. The combination of both circumstances may cause the large reduction factor of 1.98 × 10 5 for the three considered SVEs.
A second finding to be elucidated is shown in Figure 7c. The hot spot of Microstructure 1 is located radially shifted in the matrix and not directly at the boundary of the void as expected from continuum predictions. Prasannavenkatesan et al. [41] explain these phenomena with the small martensitic block size in comparison to the defect stress and strain fields. Thus, not only martensitic blocks in the direct vicinity of the void boundary represent potential sites for FCI, also the neighboring blocks more far away may also be potential sites for FCI depending on their orientation and neighboring blocks.

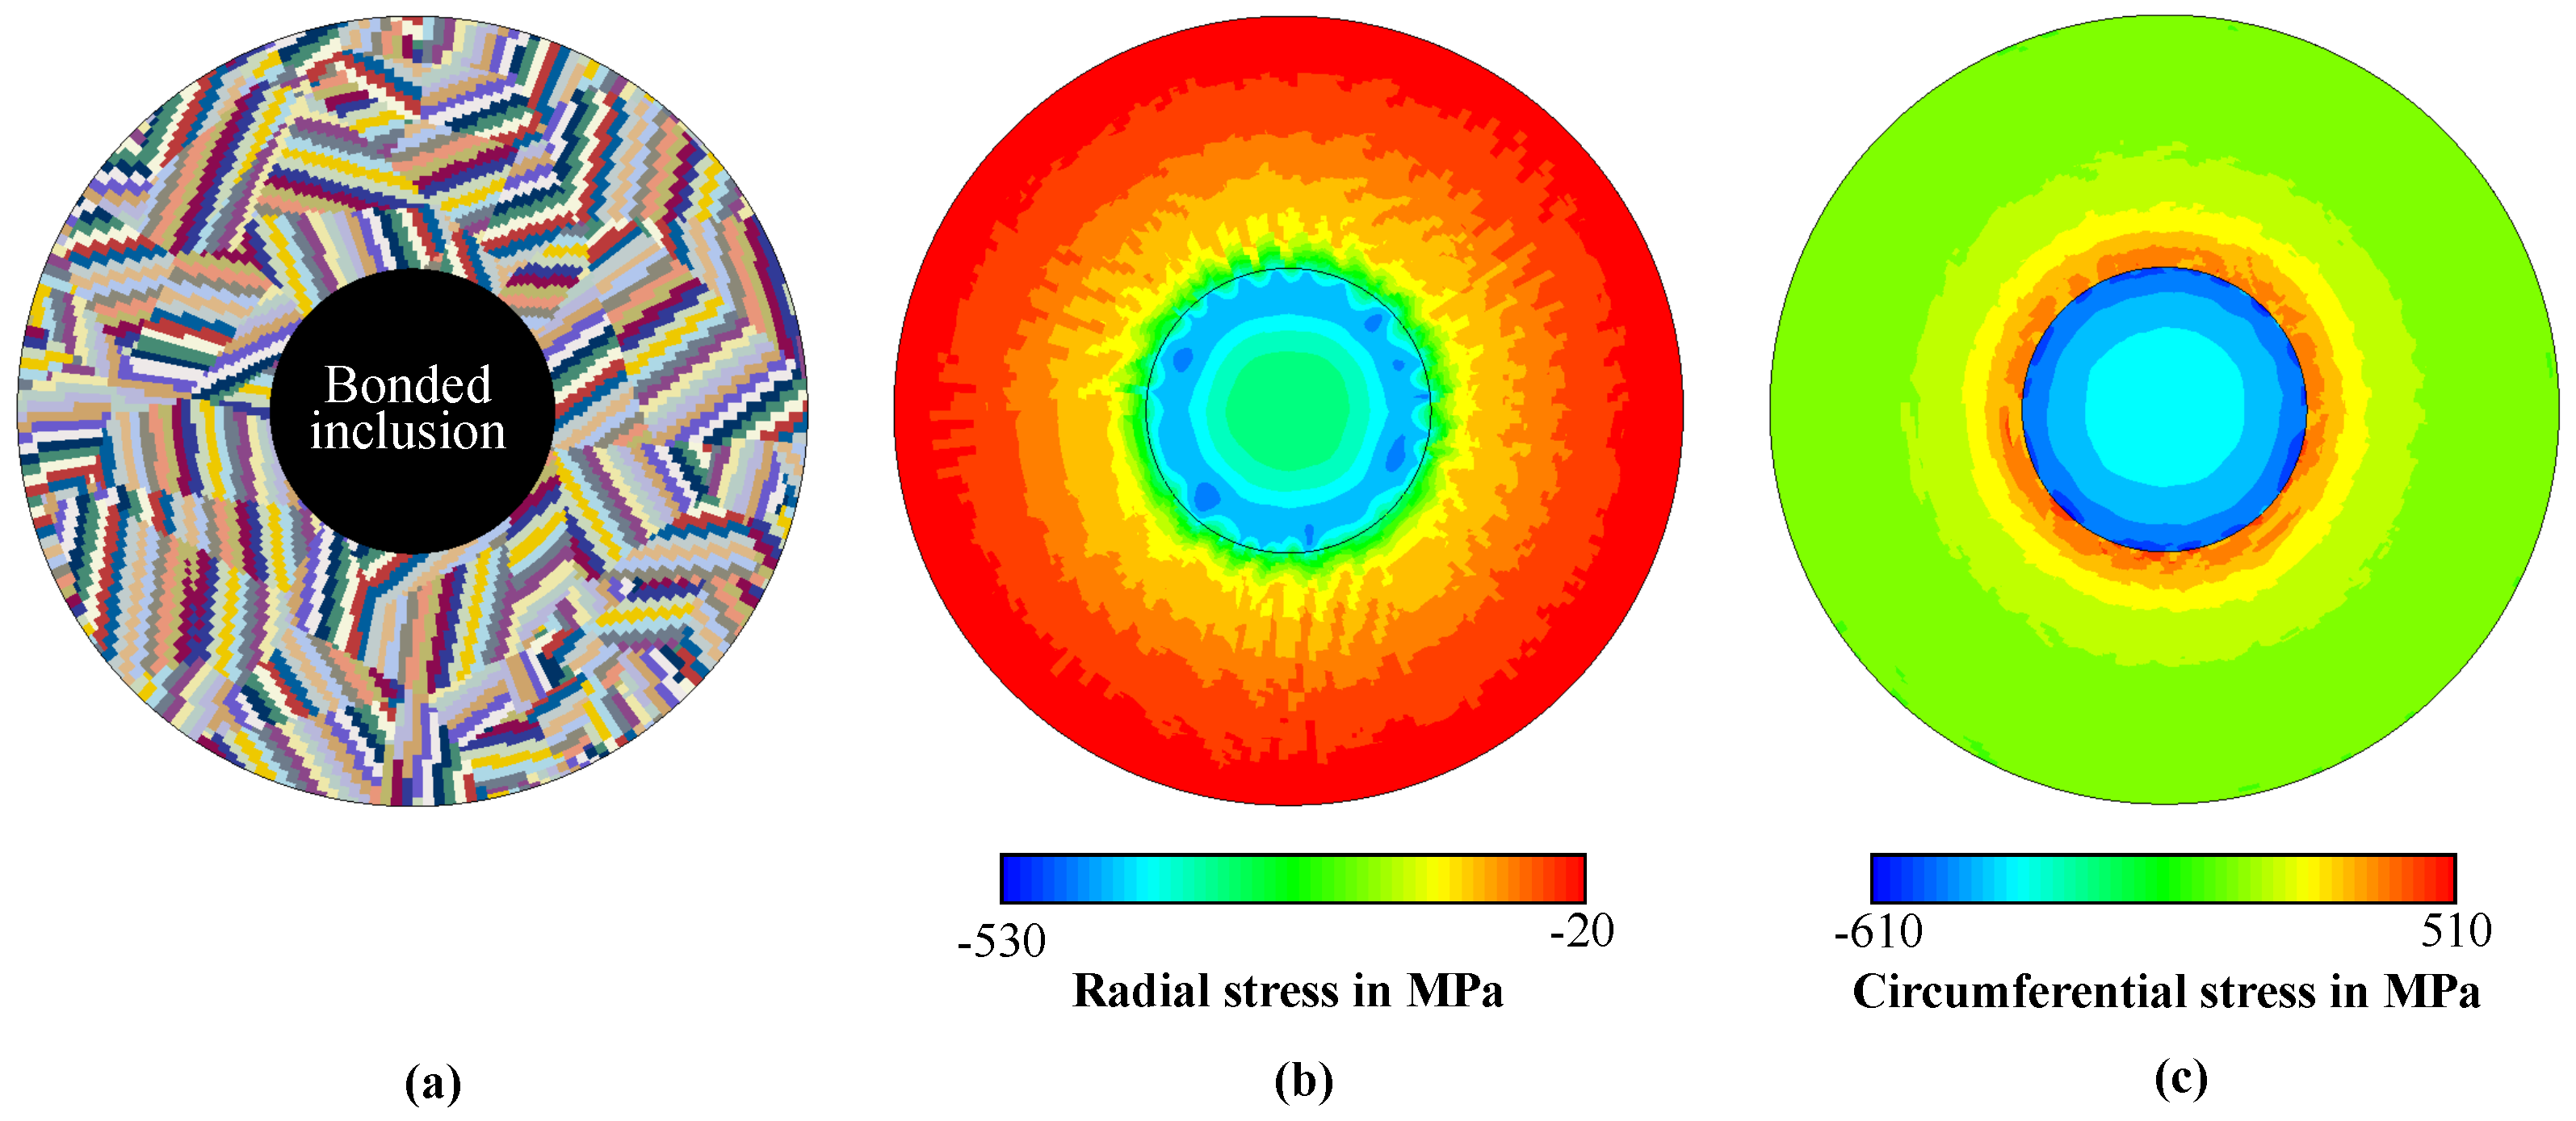
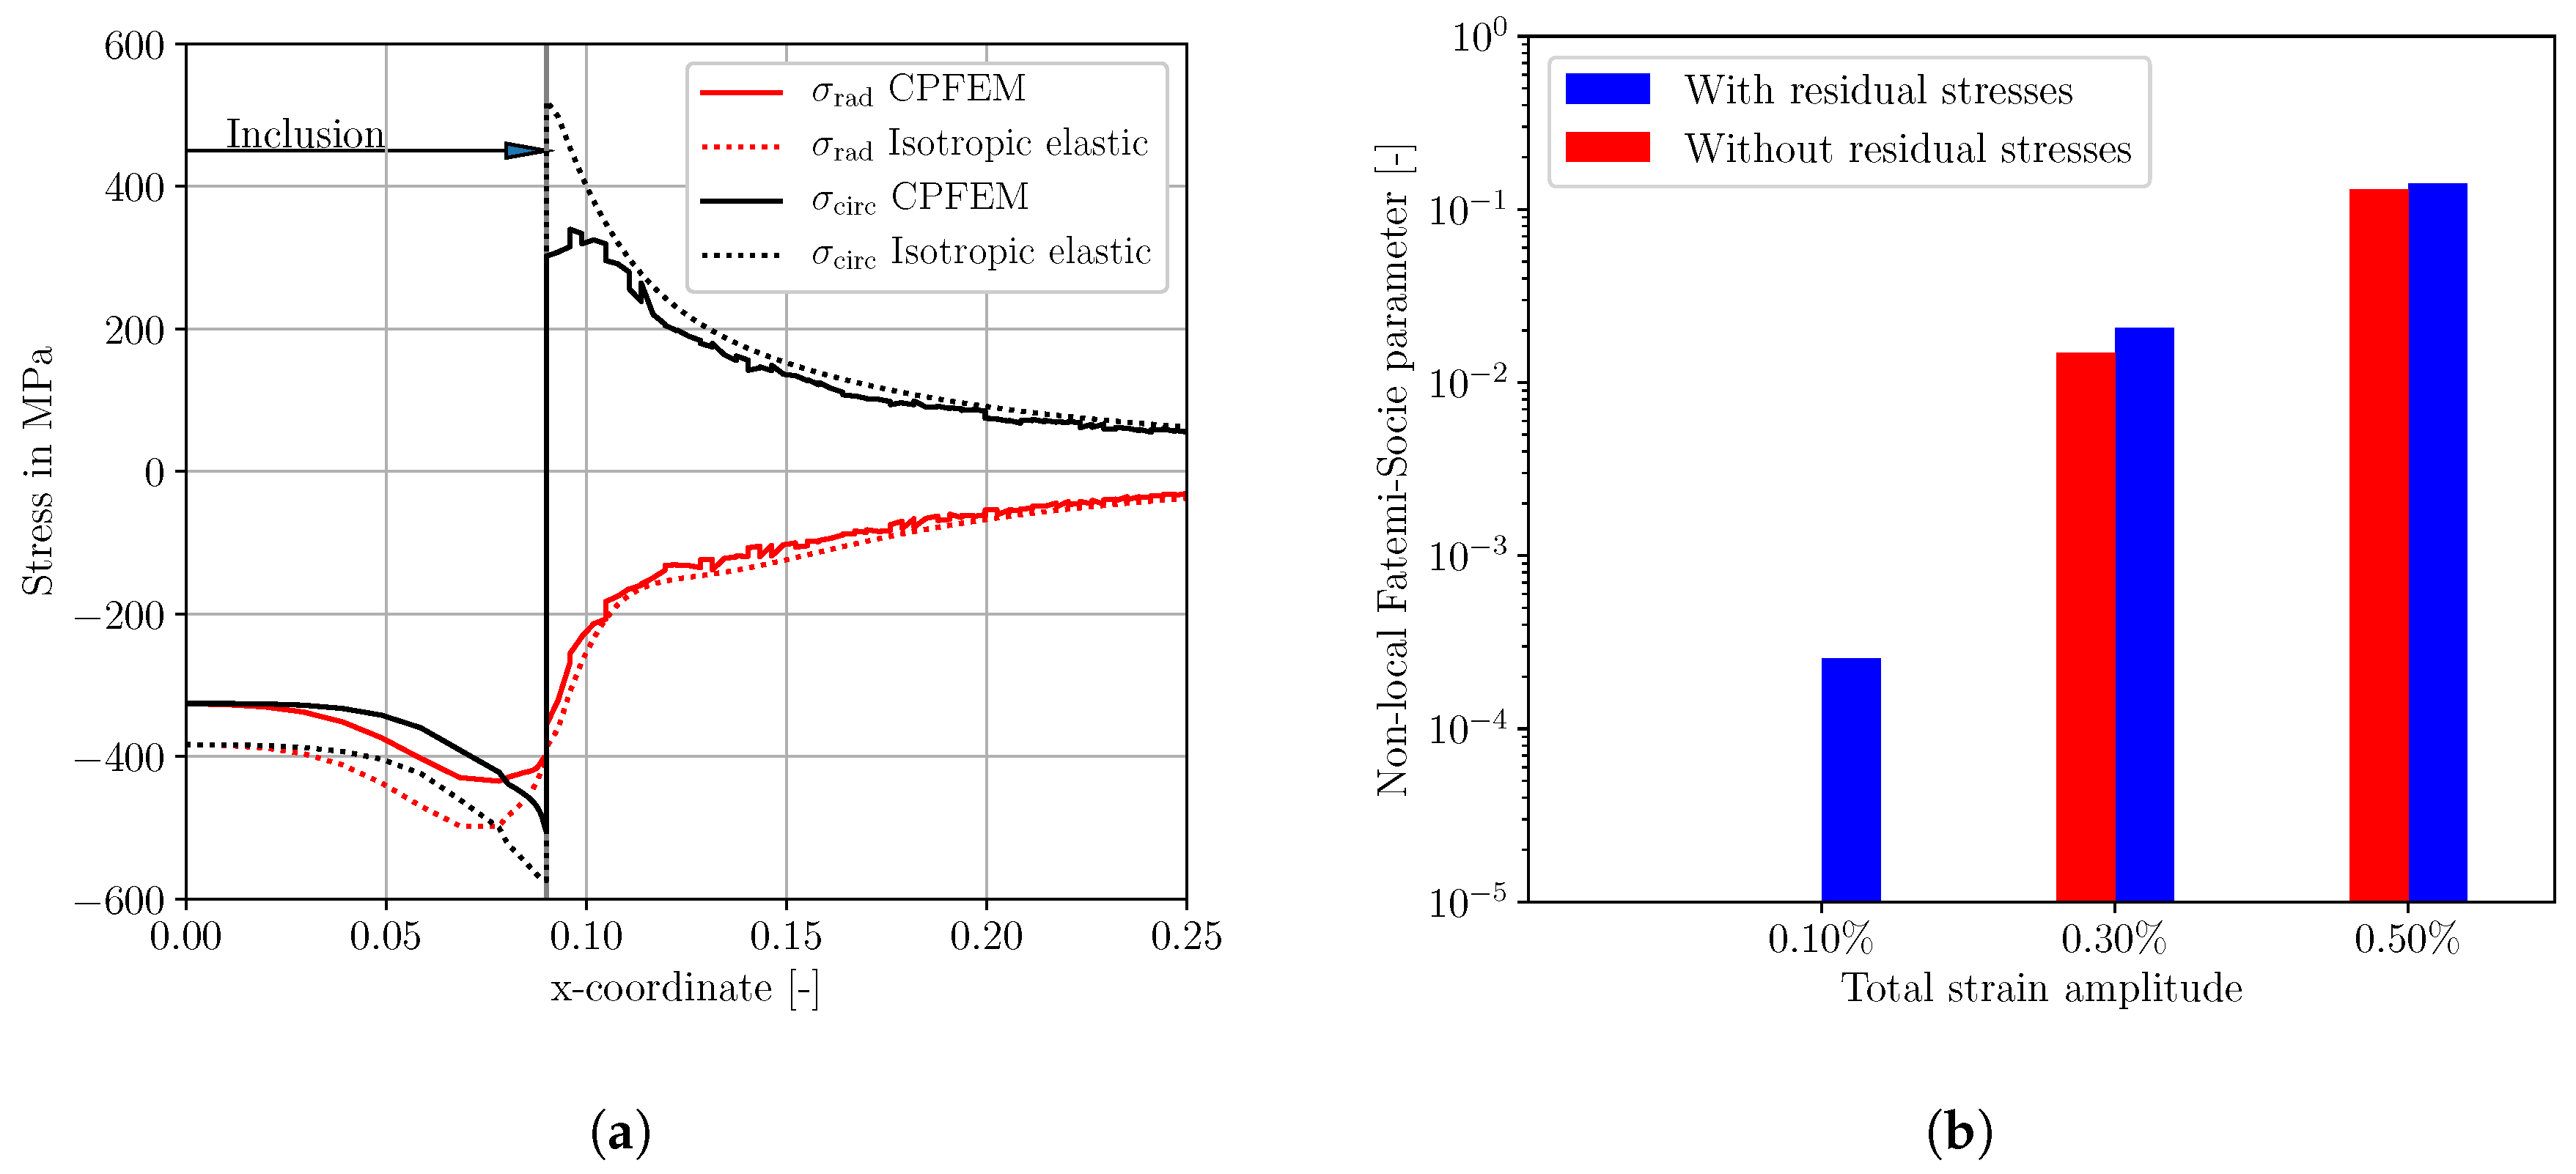
4.2. Effect of Residual Stresses

According to Section 3.3, the residual stress evolutions are solely considered for oxidic inclusion in the present study. This section emphasizes the simulation results of the residual stresses around oxidic NMI. Differences of the CTE between the inclusion and the surrounding matrix cause the development of residual stresses in the matrix during thermal heat treatments as quenching [3,71]. The local properties and fatigue resistance of the matrix can be significantly altered by these stresses. Thus, within the scope of the present study, the evolution of these stresses in the microstructure around the elastic inclusions during the quenching process is simulated for subsequent fatigue crack initiation analyses. The residual stress simulation was performed by specifying the CTEs of matrix and inclusion according to Table 3 and applying a static linear thermal cooling process of Δ T = 820 K. Figure 8a–c show the perfectly bonded oxidic inclusion (D = 110 μ m) embedded into the martensitic matrix, the qualitative simulation results of the radial and circumferential residual stress distributions, respectively.
The contour plots of the radial and circumferential stresses in Figure 8b,c reveal heterogeneous stress fields. These heterogeneities are caused both by the block-architecture of the martensitic microstructure and the elastic anisotropy of the underlying blocks with its different orientations. At the inclusion–matrix interface, there are compressive residual stresses in radial direction and tensile residual stresses in circumferential direction. Within the inclusion, only compressive residual stresses arise, whereby these are only of minor importance since the inclusion is modeled as isotropic elastic material and is not subject of the fatigue assessment. These qualitative simulation results correlate well with the calculated residual stresses around aluminum oxides in SAE 4150 from Sinz [9].
To validate the residual stress simulation setup, the residual stresses obtained from micromechanical simulations are compared to residual stress profiles which were generated with isotropic elastic material properties of the inclusion and matrix. Figure 9a shows the different residual stress components along a horizontal path beginning at the equator of the inclusion.
According to Figure 9a, there is a qualitative good agreement of the residual stress profiles in the matrix between the isotropic elastic material response and the micromechanical material response. However, differences close to the inclusion–matrix interface arise at the circumferential stress components ( σ circ ) where the stresses obtained by micromechanical simulation are below the isotropic elastic material response. These deviations can be traced back to the elastic-plastic material behavior of the CPFEM model and the anisotropy effects of the block orientations close to the interface. Inside the inclusion, the predicted micromechanical residual stresses reveal the correct trend but with an offset to the residual stresses obtained by isotropic elastic material behavior. This offset may be caused by reduced circumferential stresses in the matrix and consequently a reduced contraction to the inclusion in comparison to the completely isotropic elastic material model.
The effect of residual stresses on the fatigue crack nucleation behavior at different loading levels is shown in Figure 9b. In particular at the lowest loading level, there is a significant influence of the residual stresses on the fatigue crack nucleation potential. No fatigue damage accumulation occurs if residual stresses are neglected. In contrast, if residual stresses are taken into account, the material exhibits a certain amount of fatigue damage and fatigue crack nucleation occurs at the inclusion–matrix interfaces. These deviations in fatigue crack driving force decline by increasing total strain amplitudes to 38.7% and 8.2% for ε a , t = 0.30 % and ε a , t = 0.50 %, respectively. These simulation results reveal the necessity of the consideration of residual stresses around oxidic inclusions for micromechanical fatigue crack nucleation investigations and correlate well with results about the effects of residual stresses on fatigue damage from Pineau and Forest [71] and Bandyopadhyay and Sangid [44].

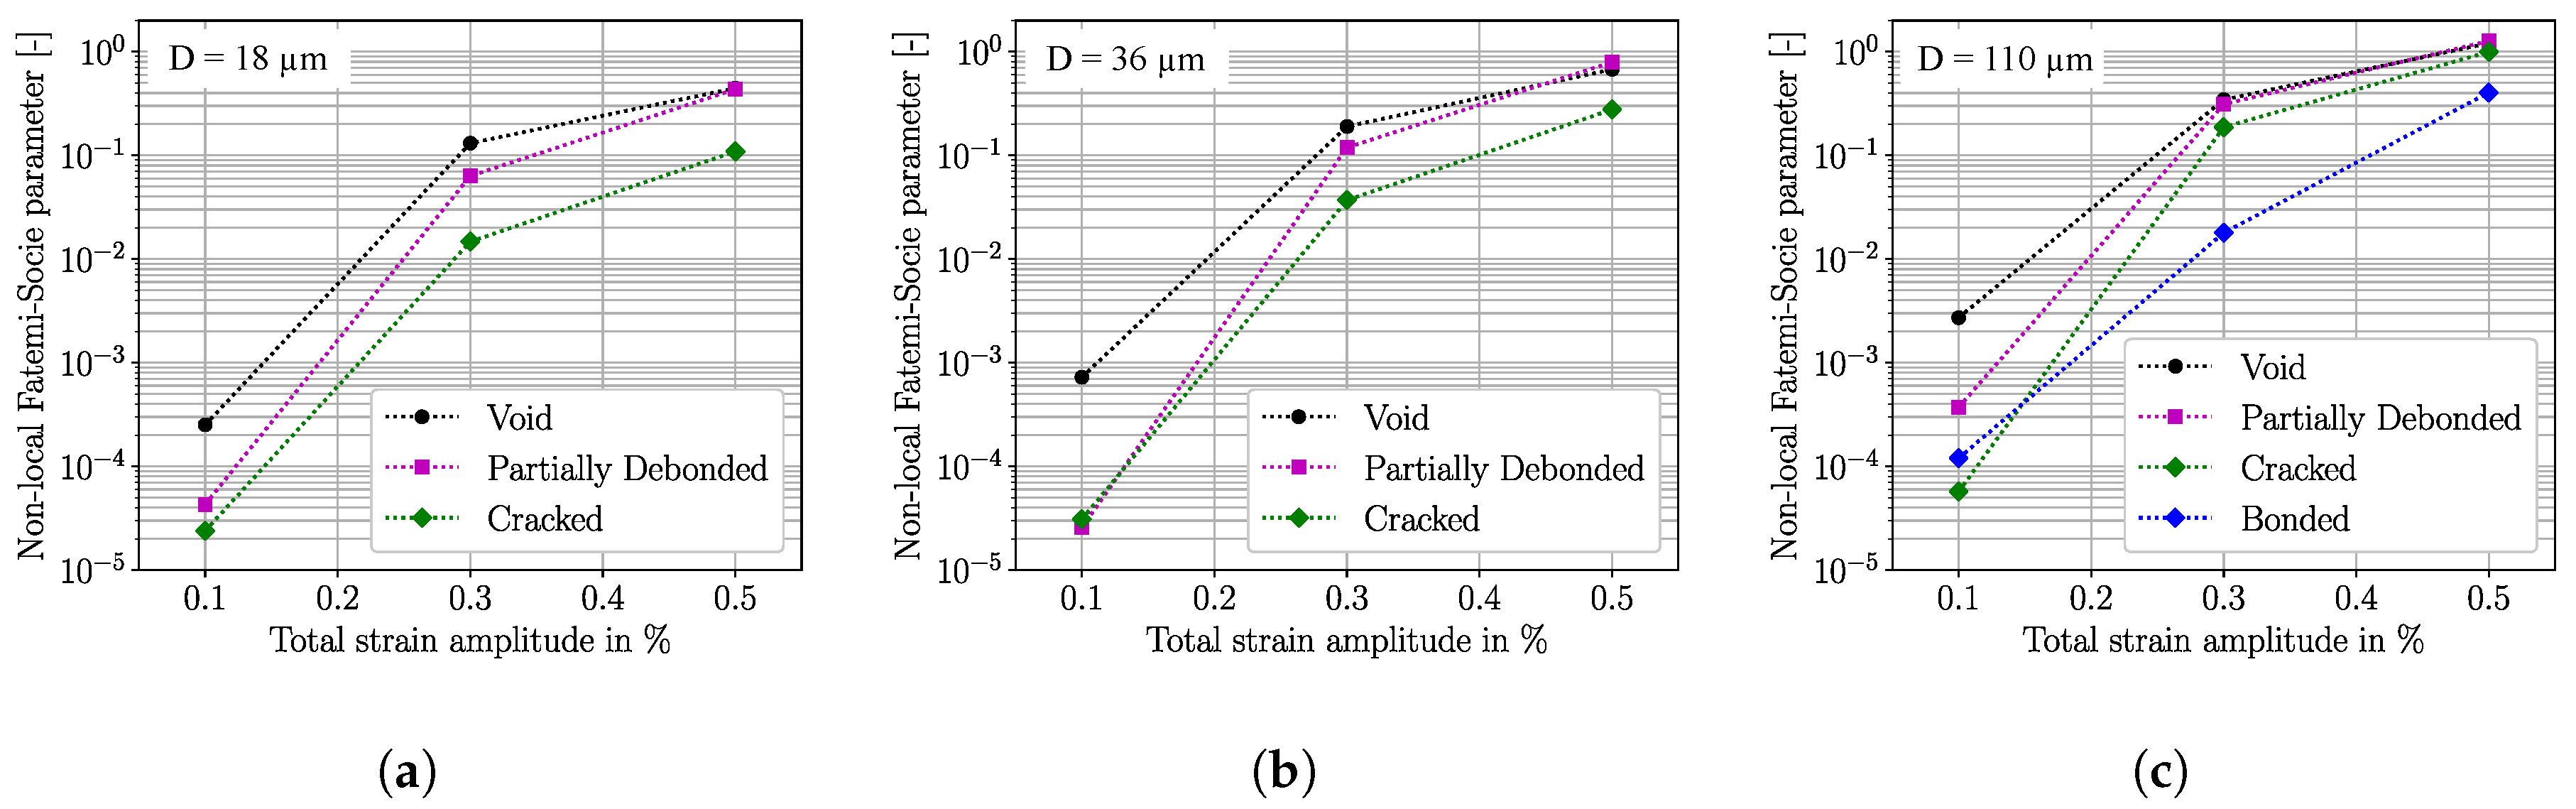
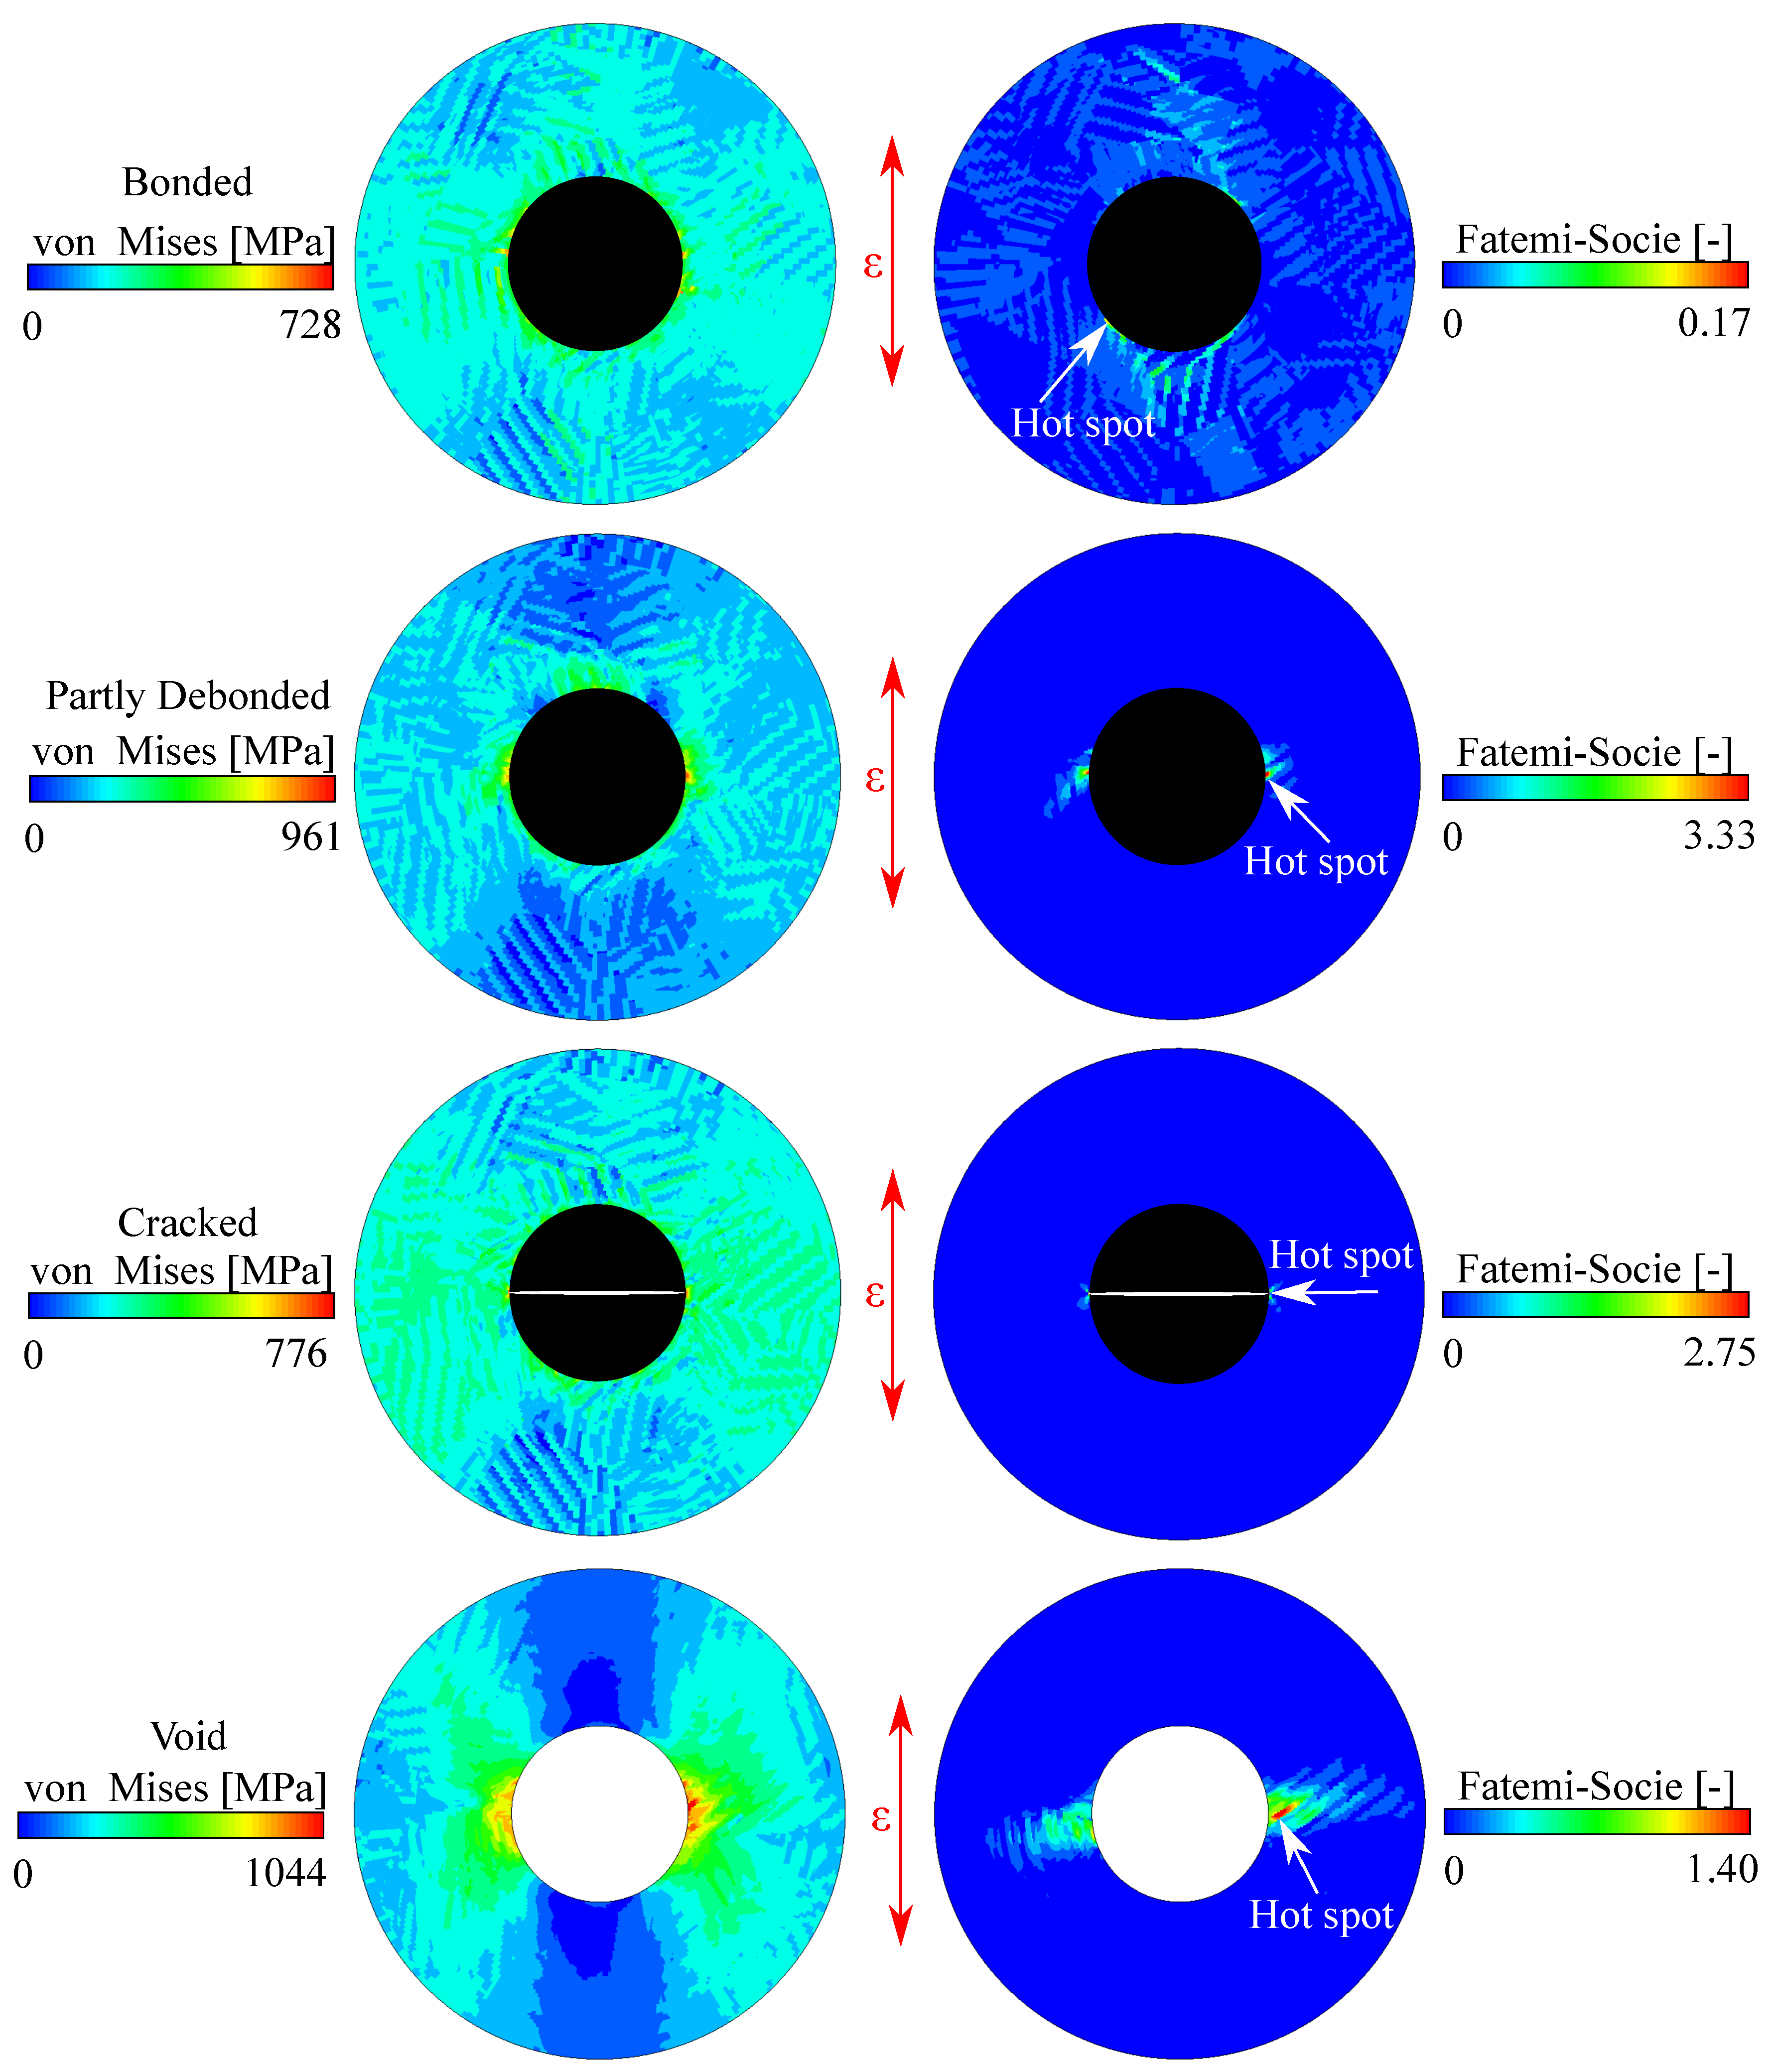
4.3. Influence of Interface Properties on Fatigue Response

This section accounts for the influence of different inclusion–matrix interface configurations on the non-local fatigue response as a function of inclusion diameters and different loading levels. For the sake of simplicity, solely circular defects with an aspect ratio of AR = 1.0 are taken into account. Figure 10 presents contour plots of the von Mises stresses and the Fatemi–Socie parameters at the end of the fifth fatigue loading cycle with ε a , t = 0.50 % at R ε = 1 .
According to Figure 10, the bonded inclusion distinguishes itself from the three other considered interface conditions due to the spatial position of the highest residual stresses indicated by the von Mises stresses (zero loading condition) and the position of the maximum Fatemi–Socie metric. The hot spot locations of the bonded inclusions are at the top or bottom poles of the inclusion due to the high misfit of the elasticities. In tension and compression, the stresses inside the hard-bonded inclusion are very high, but they do not introduce a significant stress concentration into the surrounding matrix. The Fatemi–Socie contour plot of the bonded inclusion shows on the one hand the localization of fatigue damage at the lower left inclusion–matrix interface; however, on the other hand, regions of the matrix far away from the interface also show a considerable amount of fatigue damage accumulation. These findings correlate well with the investigation results from Gu et al. [45].
The partly debonded inclusion, the cracked inclusion and the void reveal the potential fatigue crack initiation location in the matrix at the left and/or right pole of the inhomogeneity. These initiation positions are directly linked to the stress intensification at the debonding seam and the stresses induced by the crack tip of the cracked inclusion. According to Prasannavenkatesan et al. [41], the spatially limited contact definition and the debonding seam acting as a crack-like defect cause high stress intensifications at the left and right poles and results in localized but severe fatigue damage positions. It is worth noting that the cracked inclusion solely activates few slip systems and thereby the fatigue damage process zone is limited in its spatial extension [42]. The residual stresses and the fatigue damage zone of the void extends over more extensive domains than the previously considered interface-matrix configurations. This damage behavior can be explained by the unconstrained deformation of the void in the compression part of the loading cycle. There is no elastic constraint by an inclusion in the compressive loading and thereby the reverse plasticity near the void become substantial. In contrast, the level of reverse plasticity of a debonded inclusion is of minor importance and the major part of the fatigue damage is caused by the tension part of the loading cycle [37].
To provide more quantitative information about the damage potential of the different inclusion–matrix interface configurations, Figure 11 shows the non-local Fatemi–Socie metric as a function of the inclusion diameter, loading level and interface configuration.
Figure 11a–c show the high fatigue damage potential of voids and partly debonded inclusions. At ε a , t = 0.50 % , the partly debonded inclusion shows the highest damage potential regardless of the inclusion size. In contrast, voids represent the most harmful defects for ε a , t = 0.30 % and 0.10%, also regardless of the inclusion size. In general, the cracked inclusions show a lower fatigue damage potential than the already presented configurations. This can potentially be traced back to the modeling of the crack within the inclusion. The crack is limited to the inclusion domain and there is no crack tip within the matrix microstructure. Finally, the bonded inclusion with D = 110 μ m shows in general the smallest fatigue damage potential; however at ε a , t = 0.10 % the damage potential of the bonded inclusion is higher than of a cracked inclusion. Both inclusion types reveal the same residual stresses after the heat treatment cycles, but the crack tip induces high residual stresses in the first loading cycles which alter the local stress or strain ratio to compressive mean stresses being less detrimental regarding fatigue crack initiation [41].

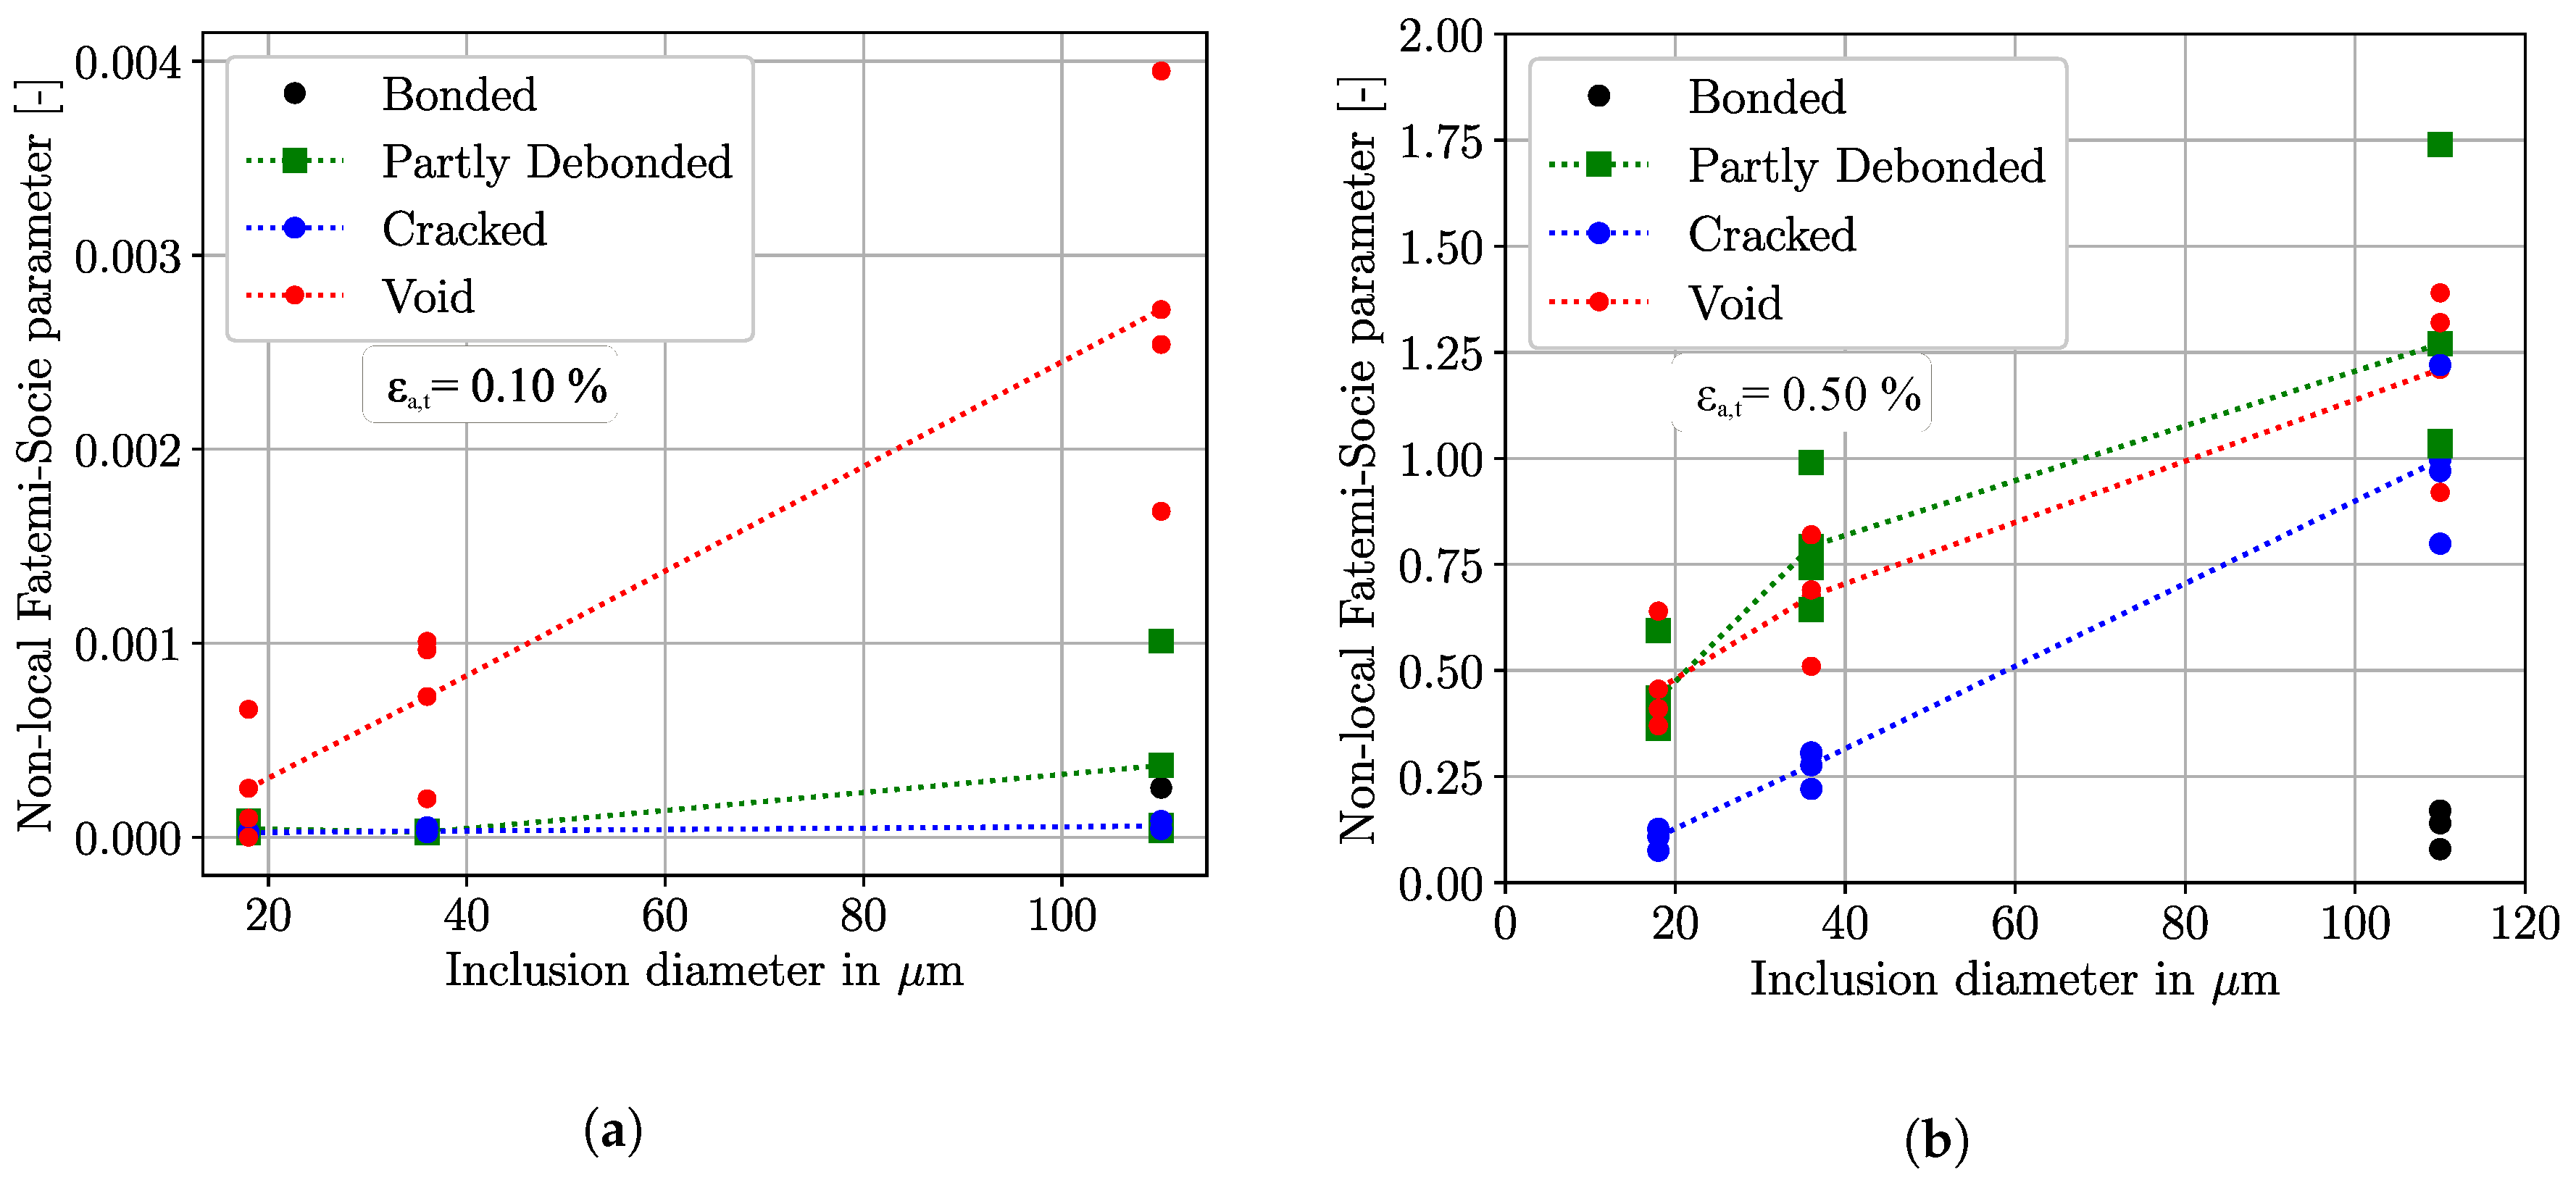
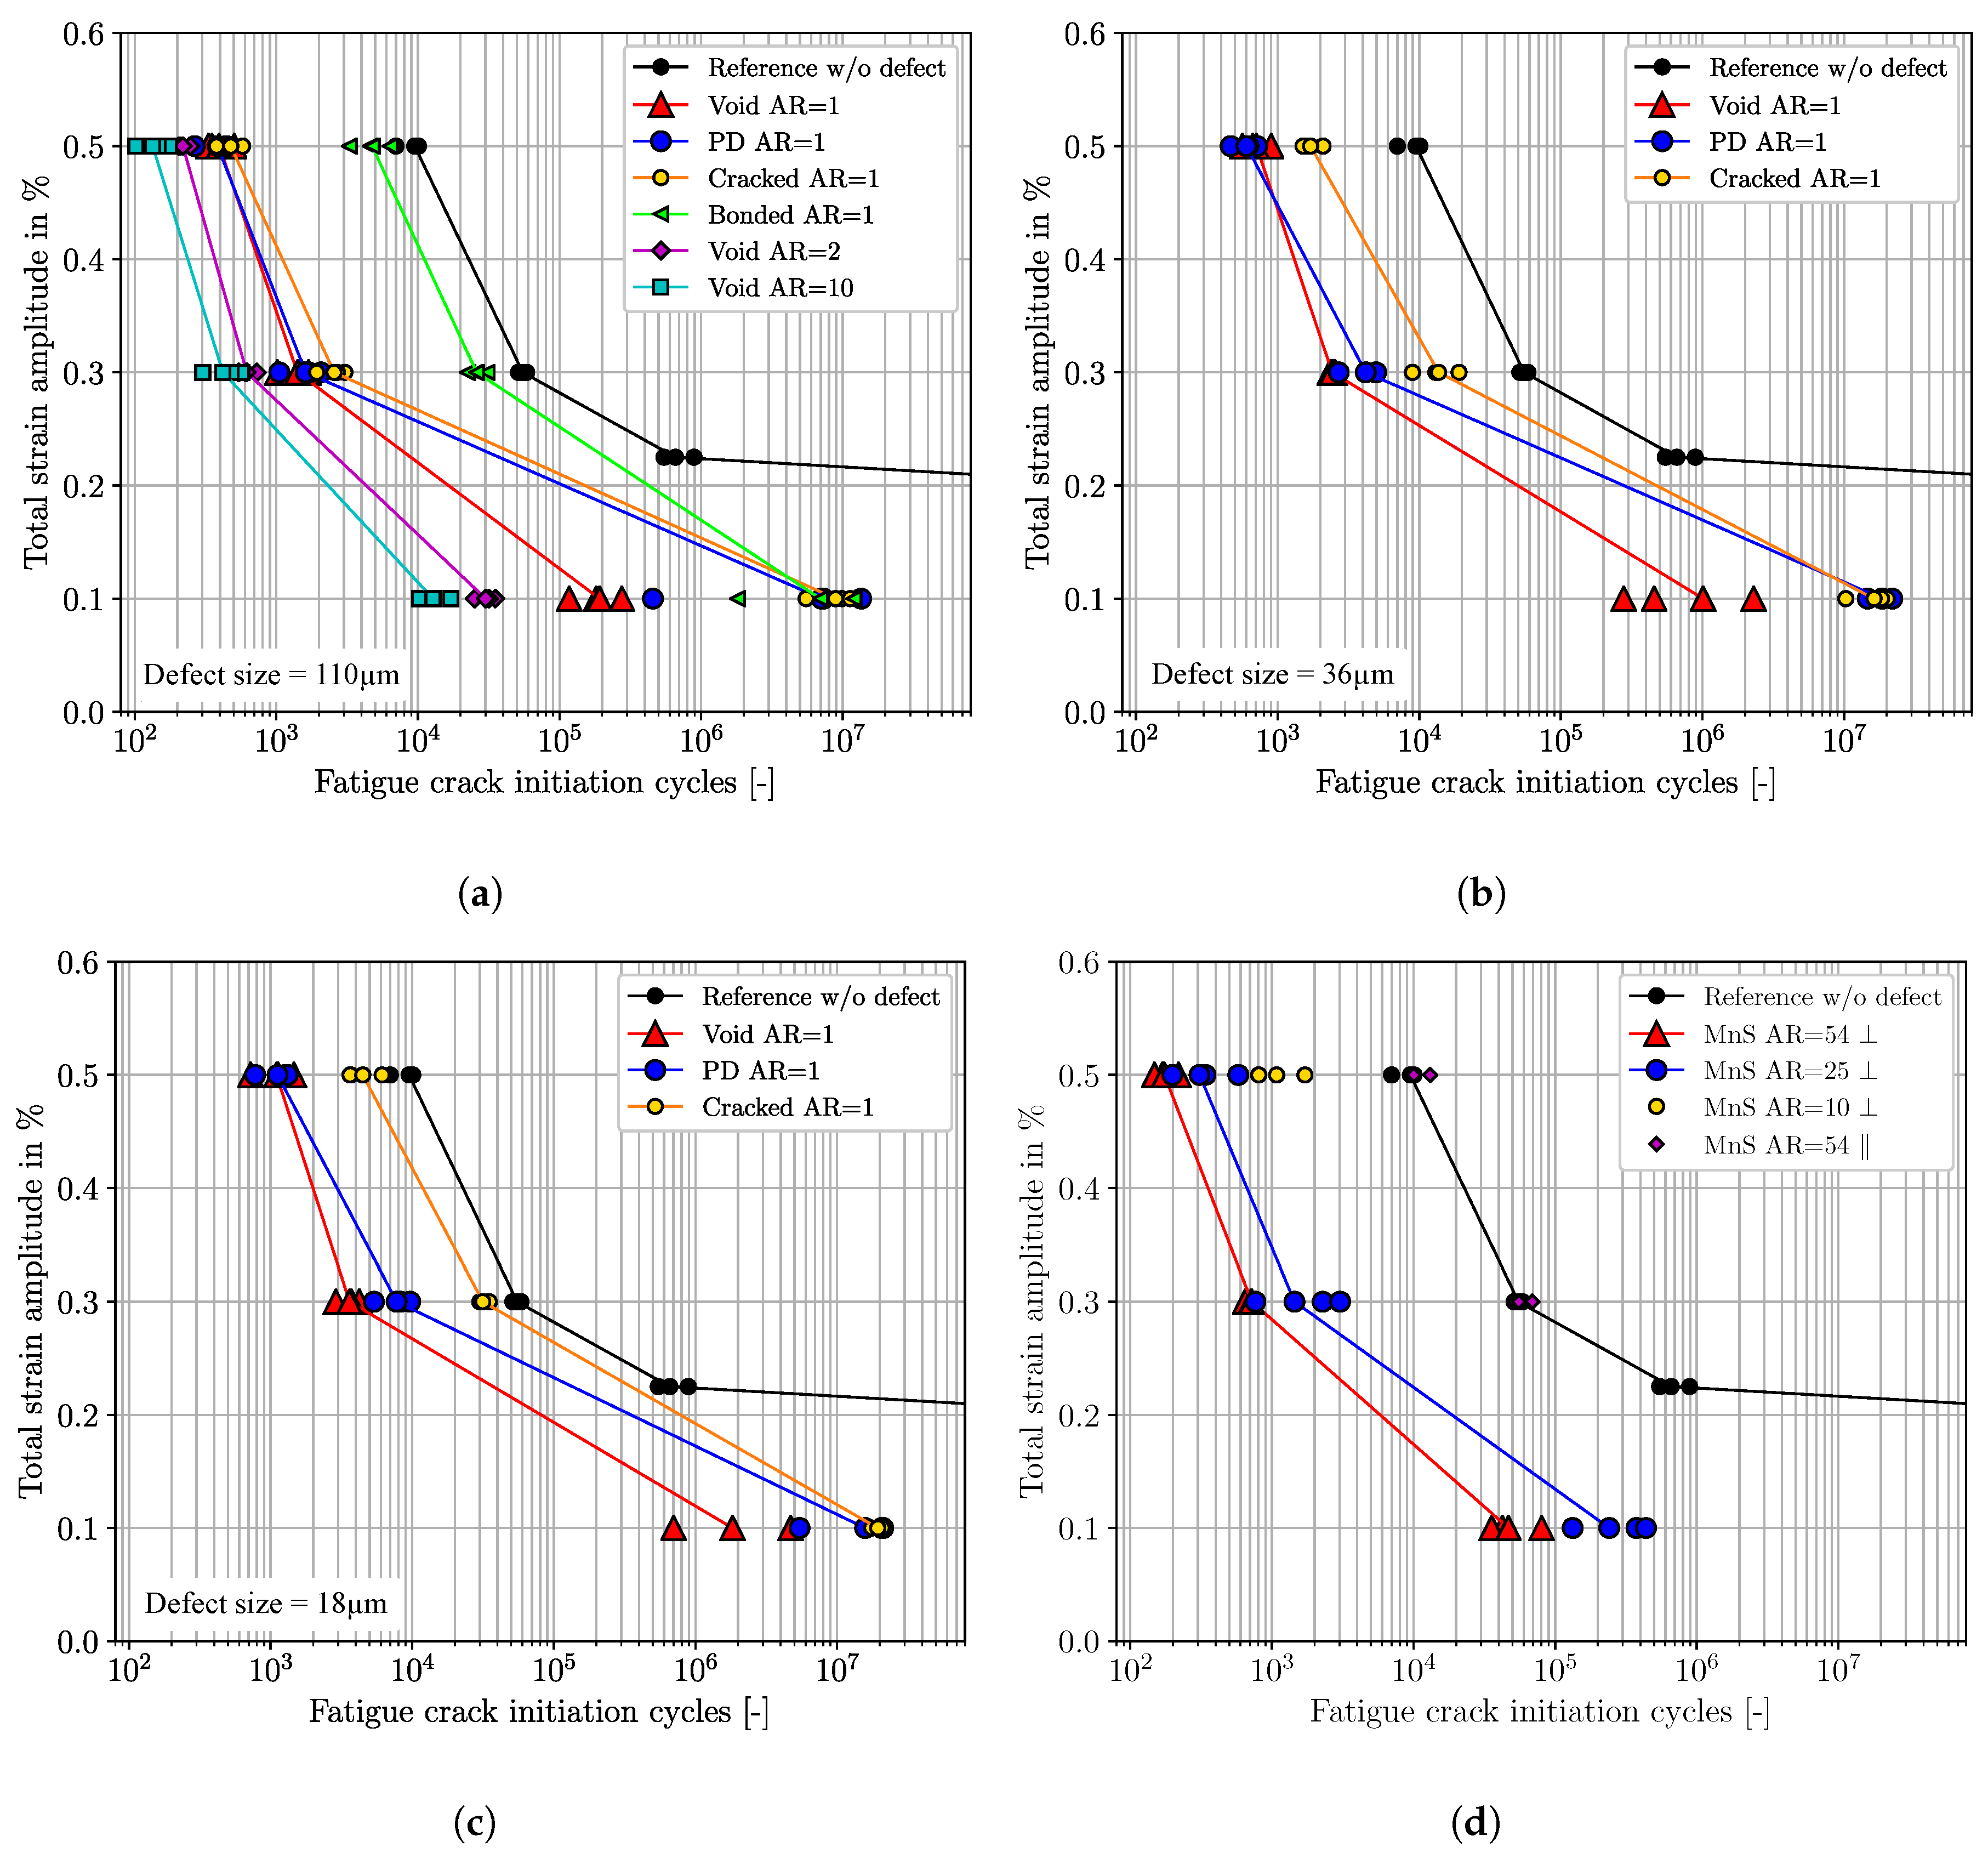
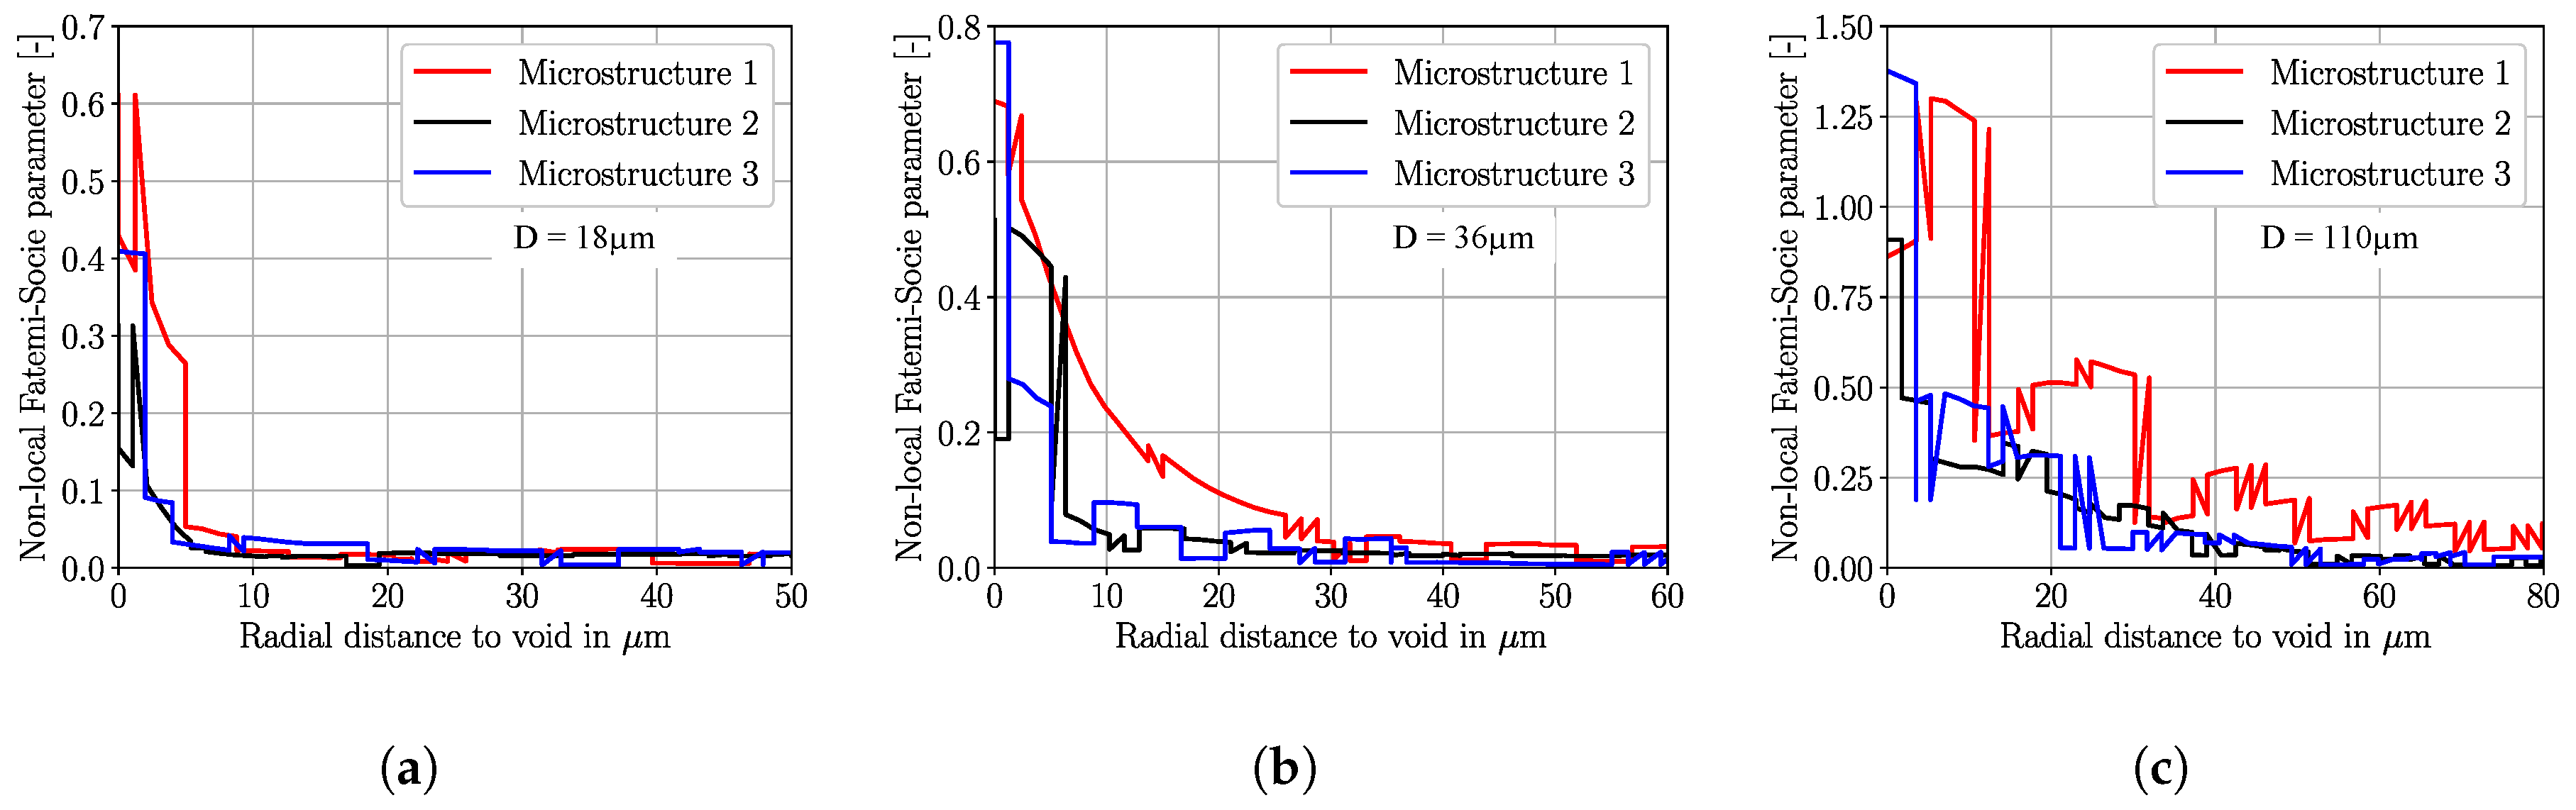
4.4. Influence of Defect Size

In this part of the parametric inclusion study the focus is on determining the influence of the defect sizes of the different interface configurations on the fatigue crack initiation behavior. Therefore, the different fully reversed simulation results from the previous sections are rearranged in the following way. Figure 12a,b show the non-local Fatemi–Socie parameter for the different defect types as a function of the defect size for ε a , t = 0.10 % and ε a , t = 0.50 % , respectively. In Figure 12, the individual simulation results are indicated by colored markers and the colored dashed lines represent the arithmetical average of the three microstructural representatives of each defect type.
According to Figure 12a, the void represents the most severe defects at the lowest loading level ( ε a , t = 0.10 % ). These results show an unambiguous influence of the void size on the non-local Fatemi–Socie parameter and consequently on the fatigue crack initiation behavior. In a more quantitative way, the fatigue crack driving force increases by a factor of 10.8 from the smallest to the largest void. However, the partly debonded and crack inclusion types also show an increase of fatigue crack driving force with increasing inclusion size but with a lower order of magnitude. A potential explanation, therefore, may be the influence and superposition of compressive residual stresses and overload stresses at the critical positions of the debonded and crack inclusions leading to a reduced local fatigue response in contrast to voids without residual stresses. It is worth noting that at low strain and stress amplitude, the phenomena of non-propagating fatigue crack emanating from defects becomes very important [3]. Therefore, the incorporation of microstructural short crack growth reveals a fundamental aspect in assessing total fatigue lifetimes for microstructures containing defects. This extension of the modeling framework will be implemented in future investigations.
Considering the simulation results at ε a , t = 0.50 % in Figure 12b, the three defect types show an almost comparable increase in fatigue crack driving force with increasing defect size. The partly debonded inclusions accumulate most fatigue damage, especially for the two largest inclusion diameters. The reason for this is the discontinuity of the inclusion–matrix interface at the equator of the inclusion causing high stress and strain localizations. The quantitative evaluation of the increase in fatigue crack driving force from the smallest to the largest partly debonded inclusion shows a declined factor of 2.9 in comparison to the factor of 10.8 for voids at the lowest loading level. The sensitivity of the fatigue crack driving force to the defect size is much more significant at the lowest macroscopic elastic than at the highest applied strain amplitude. This observation shows a good agreement with comparable results of Fan et al. [36] and Gillner et al. [40].

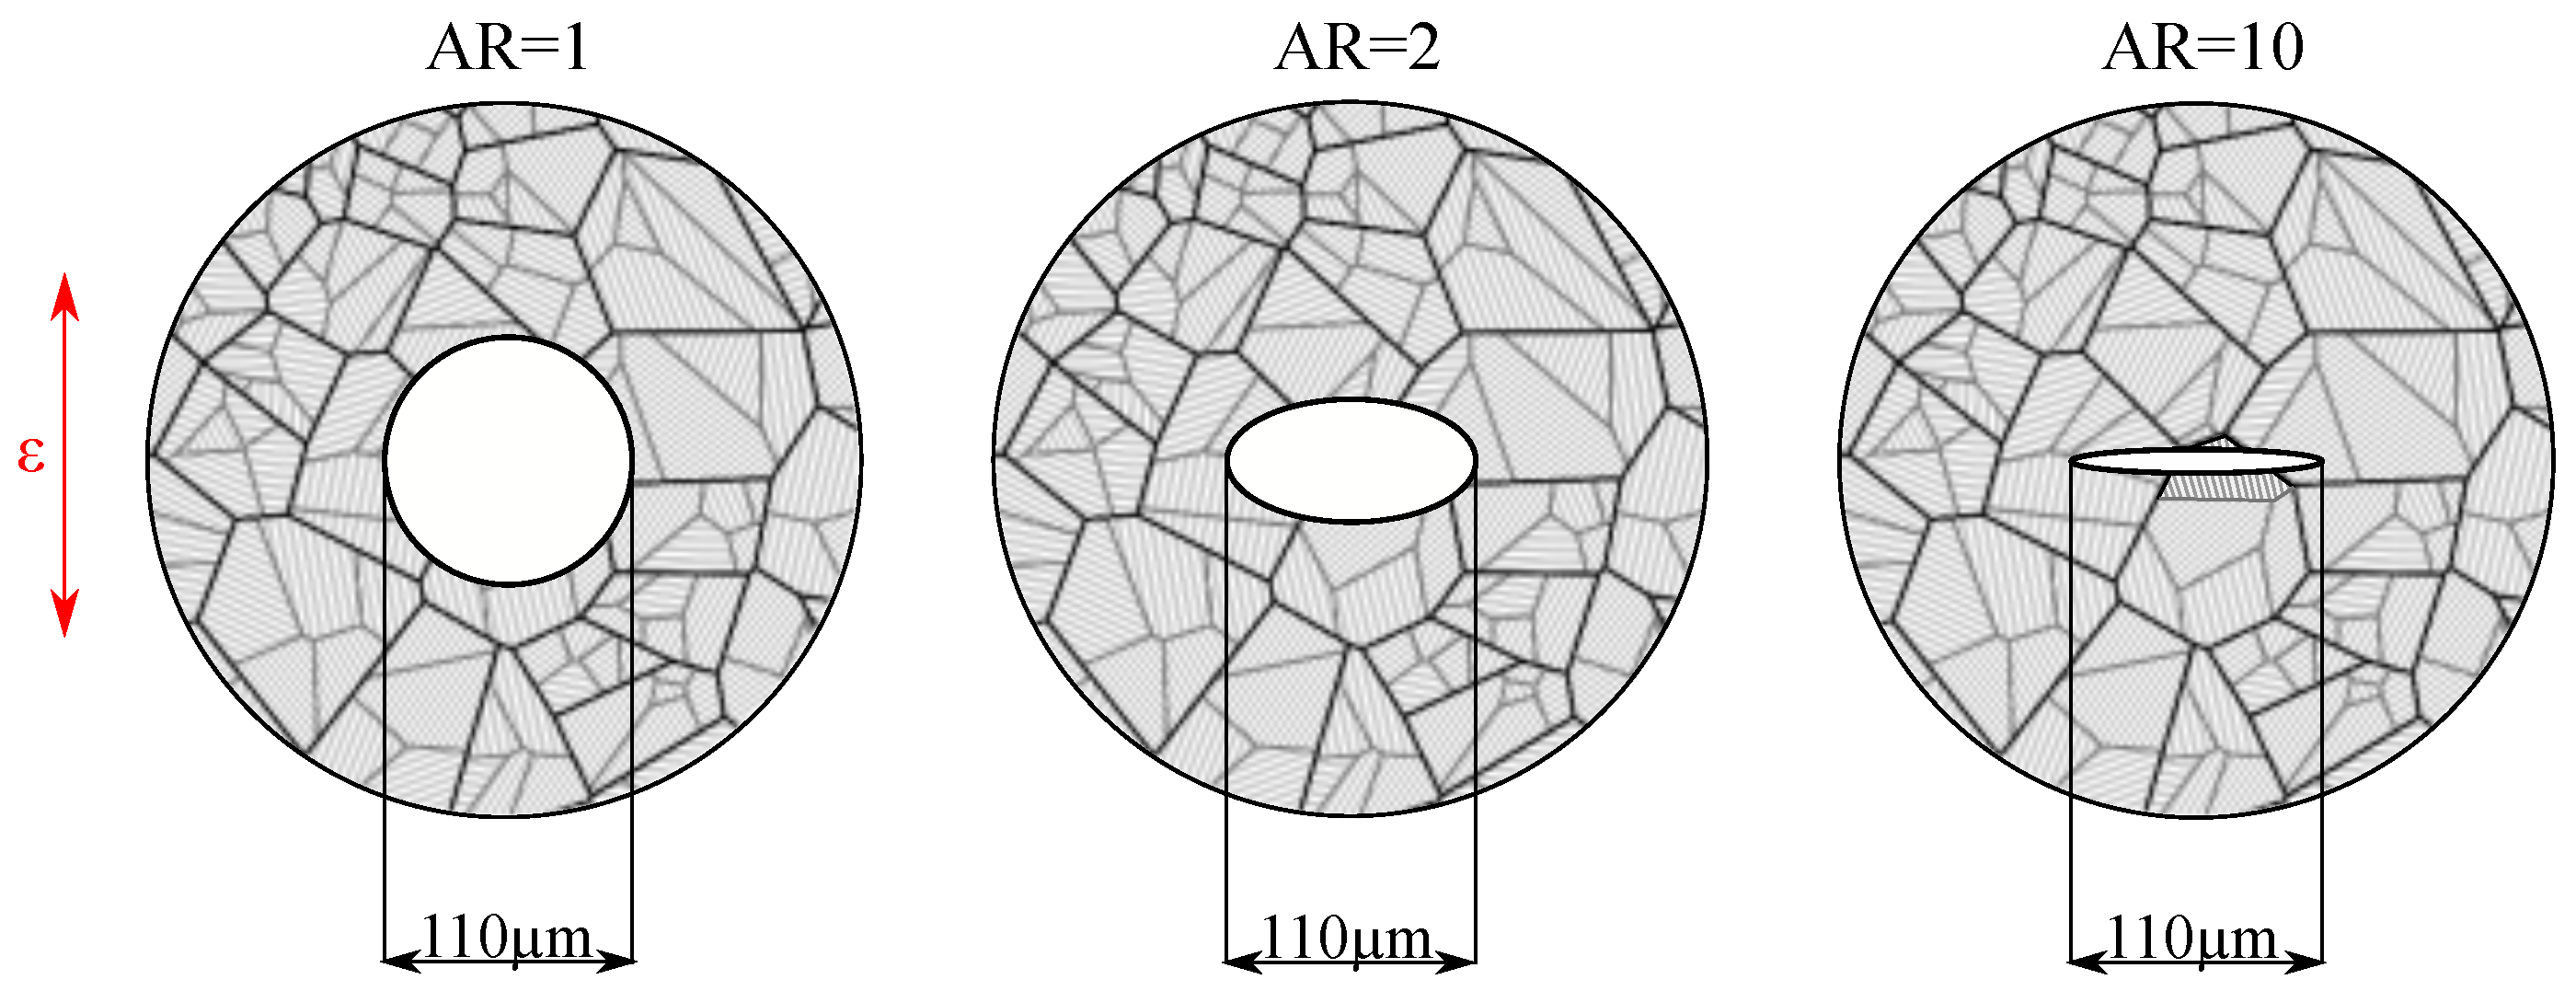
4.5. Influence of Aspect Ratio of Voids

For the sake of simplicity, voids were selected to investigate the effects of different defect shapes on the fatigue crack initiation behavior. Therefore, voids with three different aspect ratios of AR = 1.0, 2.0 and 10.0 were analyzed with respect to their local fatigue crack initiation properties. However, the considered voids reveal an identical projected area perpendicular to the load axis. In this study, no particular emphasis is put on the phase fraction constancy. Rather, the focus is on the influence of the defect geometry on the local fatigue crack initiation behavior. Figure 13 shows the geometrical representation of the three different defects within the martensitic matrix.
Fully reversed micromechanical simulations were performed for the three defined defect types each with three different microstructures and for three different total strain amplitudes ( ε a , t = 0.10 % , 0.30 % and 0.50 % ). Figure 14a,b show the distributions of the non-local Fatemi–Socie parameters of each microstructural instance for the two selected loading levels ε a , t = 0.10 % and ε a , t = 0.50 % , respectively. Each color shows three different curves representing the three different microstructural results, for each loading level.
According to Figure 14a,b, a clear influence of the inclusion shapes on the non-local fatigue crack initiation driving forces can be observed. Thus, increasing aspect ratios lead to higher driving forces for fatigue damage, based on the present results. This is in good agreement with the reported simulation results from Gillner et al. [40] arguing that increasing aspect ratios lead to higher stress localizations and consequently to higher driving forces for fatigue crack initiation.
For the lowest loading level in Figure 14a, the non-local Fatemi–Socie values of the defect with AR = 2 and AR = 10 increase averagely by the factors of 5.7 and 13.3 in contrast the circular defect with AR = 1, respectively. In analogy, the increase in fatigue crack driving force for the highest loading level in Figure 14b are 1.75 and 2.84, respectively. As a consequence, the effect of inclusion shape on the fatigue crack initiation behavior is more pronounced at lower loading levels close to macroscopic elastic material response. This agrees well with the findings from Fan et al. [36] and Gillner et al. [40].
In Section 4.1, the void-to-block-ratio was defined to correlate scatter of local fatigue response with crystallographic anisotropy. Considering Figure 13 it becomes apparent that the void-to-block-ratio declines drastically by increasing the aspect ratio. The increased scatter of the fatigue responses of AR = 2 and AR = 10 in Figure 14a and Figure 14a can be explained by the declined void-to-block-ratio which causes highly anisotropy fatigue responses due to the highly localized hot spots in individual martensitic blocks.
According to Murakami [3], the shape of inclusions is not as crucial as its projected area factor for predicting the specimens fatigue limit. However, in the finite life regime, defect shapes play a fundamental role and may affect fatigue life significantly also for defects with equal projected area due to the difference in stress concentration factors. Here, the three considered defect types exhibit identical projected area factors but reveal different stress concentration factors resulting in significant different fatigue crack initiation driving forces. A point which is not addressed in the present study, is the microstructural short crack growth being of fundamental importance for non-propagating cracks. However, these non-propagating cracks are of pivotal importance for the determination of the fatigue limit. Therefore, future investigations about inclusions and defects should incorporate the microstructural short crack growths to compare the fundamental findings from Murakami and co-workers [3].

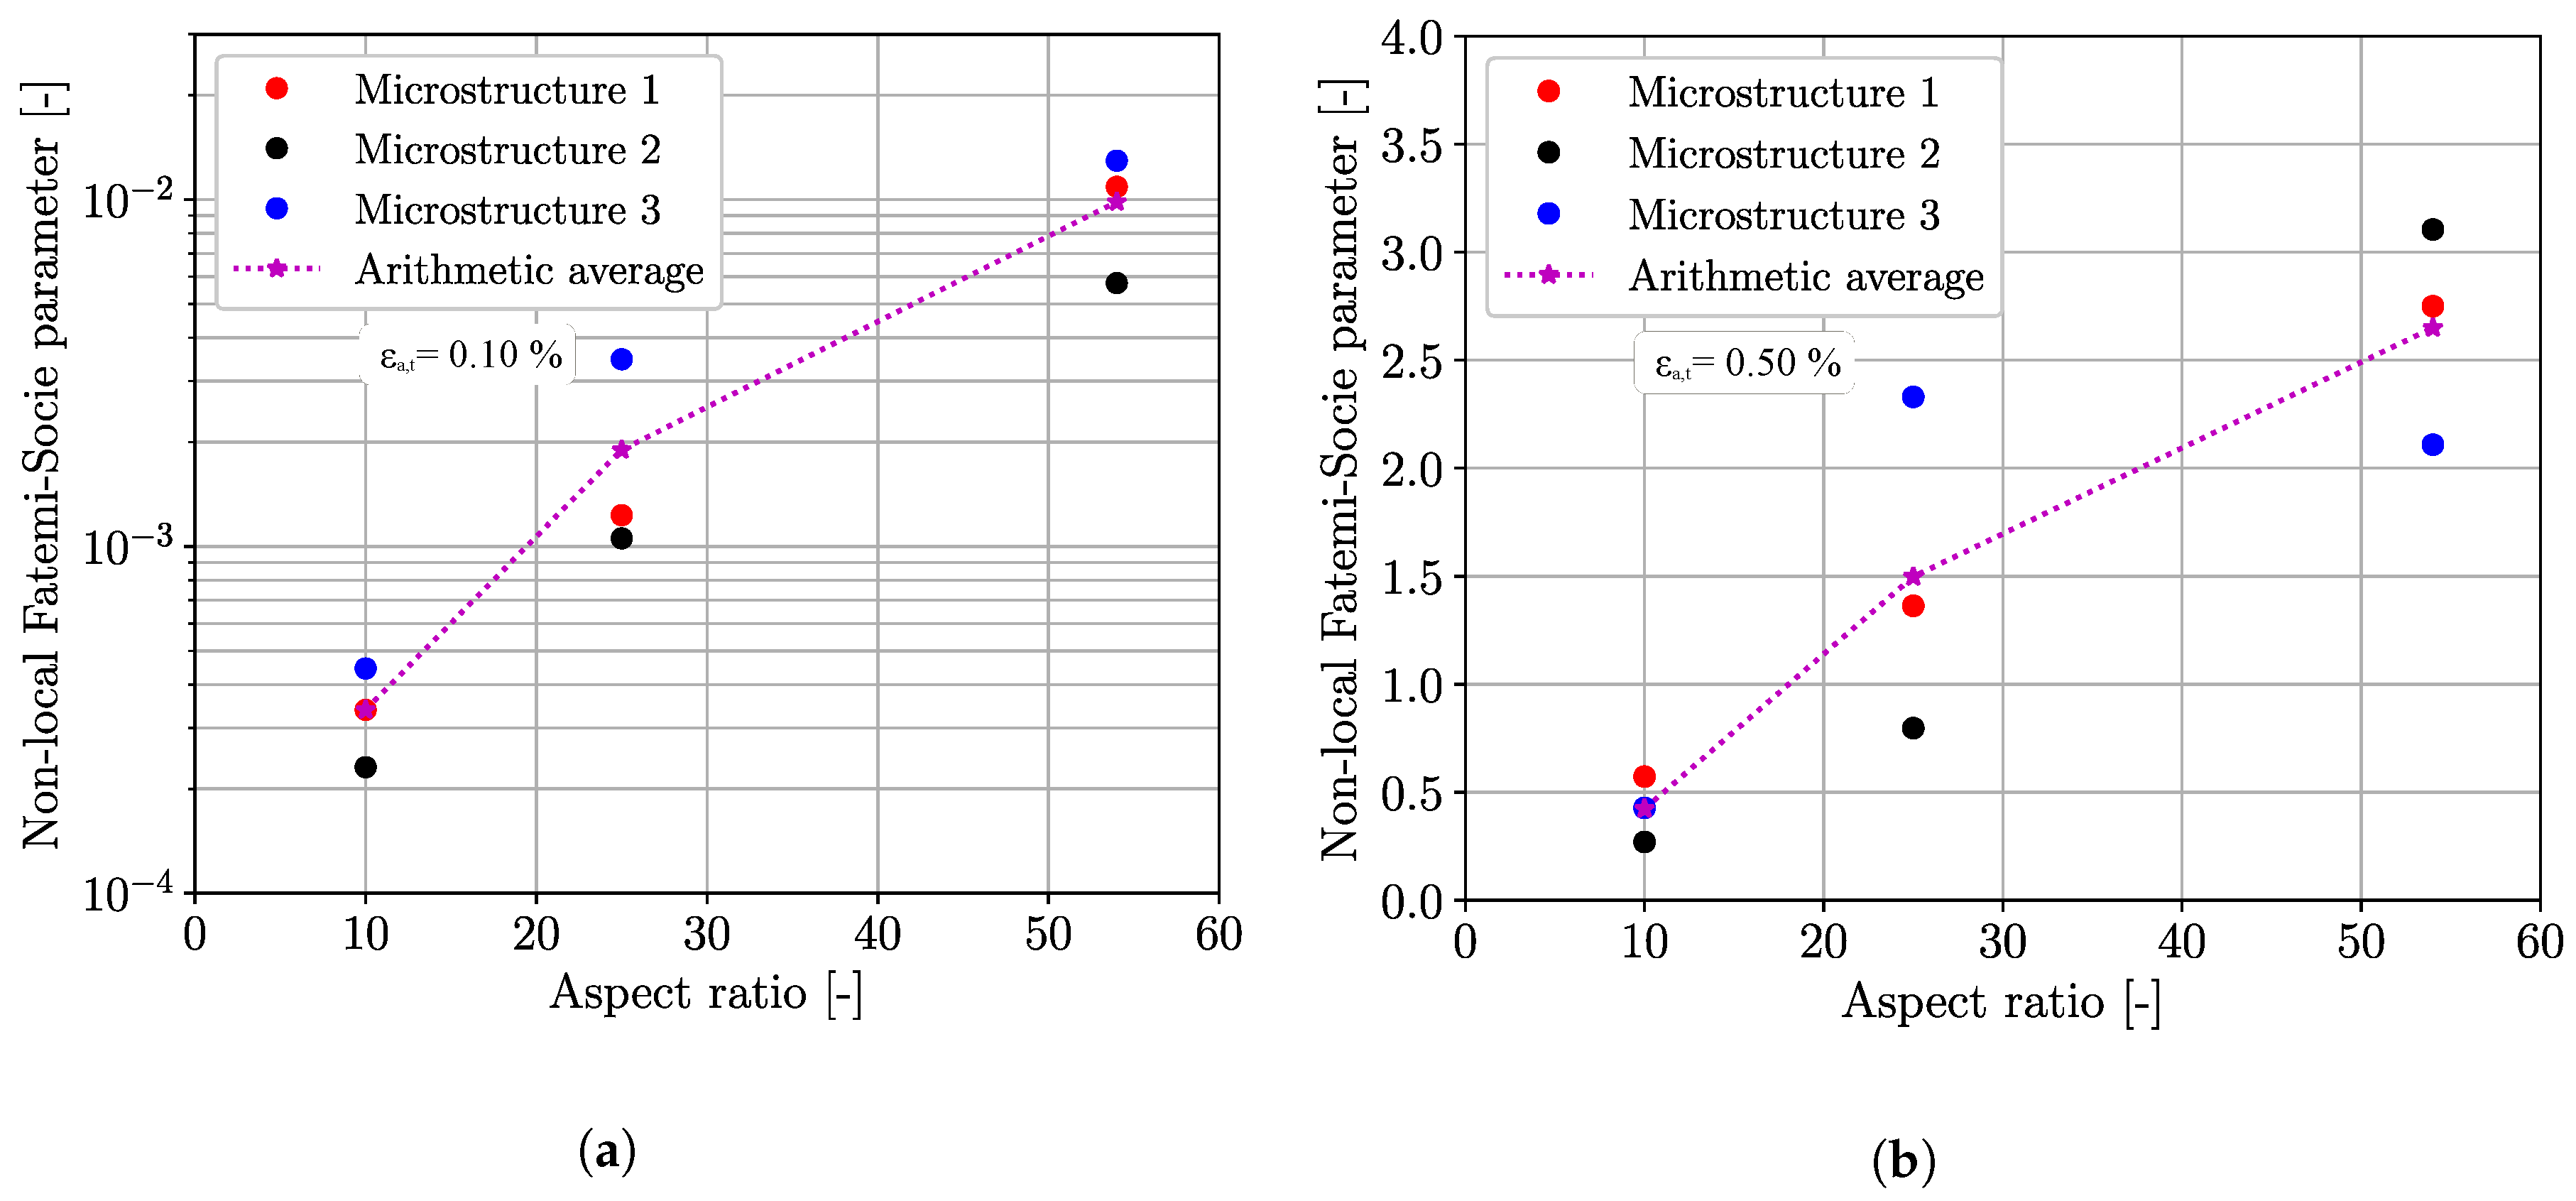
4.6. Influence of Manganese Sulfide Aspect Ratio and Orientation

To investigate the effect of different MnS aspect ratios on the fatigue crack nucleation behavior of the investigated material, the three relevant aspect ratios of Table 2 (AR = 10, 25 and 54) are modeled in this section. In a first step, the MnS were simulated perpendicular to the loading axis, according to Figure 5. This is because the MnS aligned perpendicular to the loading axis represent the most severe configuration [12]. Figure 15a,b show the non-local Fatemi–Socie parameter as a function of the aspect ratio for the total strain amplitudes of ε a , t = 0.10 % and ε a , t = 0.50 % for fully reversed loadings, respectively.
According to Figure 15a,b, there is clear influence of the MnS aspect ratio on the fatigue crack nucleation behavior. An enlargement of the aspect ratio causes inevitably an increase in the non-local fatigue crack nucleation driving force. Similar to the results of the previous Section 4.5, there are also significant differences in the local fatigue response between the different microstructural realizations. Of particular interest is furthermore the load level-dependent influence of the aspect ratio. For the lowest loading level at ε a , t = 0.10 % , there is a ratio of the average non-local Fatemi–Socie parameter for AR = 54 and AR = 10 of 34.7. In other words, the FCN potential of an MnS with AR = 54 is 34.7 times higher than of a MnS with AR = 10, based on the present results. In contrast, at elastic-plastic loading at ε a , t = 0.50 % , the damage potential of the MnS with AR = 54 declines to 6.3 times the FCN potential of the MnS with AR = 10. This observation unambiguously reveals the severity of perpendicular to the loading axis aligned MnS in the macroscopic elastic high cycle fatigue regime.
Further investigations on the alignment of the MnS with respect to the loading axis were conducted with the MnS inclusion with an aspect ratio of AR = 54. In addition to the perpendicular alignment of the MnS inclusion, a parallel orientation of the MnS with respect to the loading axis was also modeled. Figure 5c shows in schematic way the different alignment variants. The MnS inclusions aligned parallel to the loading axis reveal significant reduced driving forces for fatigue crack nucleation. The average of the three considered microstructural realizations reveals that the parallel aligned MnS shows 72, 101 and 110 times higher fatigue crack nucleation lives than the corresponding perpendicular aligned MnS inclusions at the loading levels of ε a , t = 0.50 %, 0.30% and 0.10%, respectively. These observations clearly indicate an anisotropic fatigue crack nucleation behavior of the material with embedded MnS inclusions correlating qualitatively well with results from Hosseini et al. [12], Temmel et al. [11] and Cyril et al. [10].

4.7. Fatigue Crack Initiation Lifetime Results

In the previous sections, the fatigue damage around defects was consistently considered in the context of the non-local Fatemi–Socie parameter. In this Section 4.7, the fatigue crack initiation lifetimes of the different defects are shown in traditional ε -N-plots. Figure 16a–d show the cycles for fatigue crack initiation for the defects with sizes of D = 110 μ m, D = 36 μ m, D = 18 μ m and for the MnS inclusions with varying aspect ratios, respectively. In addition, the fatigue crack nucleation cycles for the defect-free martensitic matrix are also shown as black solid circles. The loading level-dependent arithmetic average lifetime values are connected by different colored linear lifetime curves up to 8.0 × 10 6 + 06 cycles, for each defect type.
According to Figure 16a, voids with an aspect ratio of AR = 10 represent the most severe defects being even more detrimental than MnS inclusions of comparable defect sizes shown in Figure 16d. The vast nucleation potential of these void types may be explained by the accumulation of fatigue damage in both tension and compression part of the loading cycle. In contrast, MnS inclusions reveal a decelerated accumulation of fatigue damage in the compressive loading cycle. This observation is only valid for fully reversed loading conditions. Therefore, future investigations should also put emphasize on loading conditions with superimposed mean stresses/strains, to assess the damage behavior of the different inclusion and defect types. A further fundamental observation emerges in Figure 16a, at the lowest loading level. There, the fatigue crack nucleation lives varies over three decades of fatigue crack initiation cycles depending solely on either the inclusion–matrix interface or the void aspect ratio, at constant projected defect sizes. This perception underlines the importance of the present investigation.
The strong fatigue crack nucleation anisotropy of MnS inclusions is shown in Figure 16d. Therefore, MnS inclusions aligned perpendicular to the loading axis shorten significantly fatigue crack nucleation life whereby the parallel to the loading axis oriented MnS inclusions exhibit crack initiation cycles comparable to the defect-free matrix. The reason for this is that the parallel aligned MnS inclusions do not represent crack-like defects in tension and compression than in contrast to the perpendicular aligned MnS inclusions.
Finally, in Figure 16b,c the reduced damage potential of cracked inclusion can be observed. At the two highest loading levels, the cracked defects with diameters of D = 36 μ m and 18 μ m reveal reduced fatigue crack nucleation potential than partially debonded inclusions and voids. In the literature (e.g., Murakami [3]), cracked inclusions represent at higher loading levels most harmful inclusion configurations. This can be potentially traced back to the fact that in the present study, the crack seam solely affects the NMI and not the matrix. Future investigations may also consider extended cracks from the NMI towards the matrix with respect to the severity of the damage potential of cracked NMI.
It is worth noting at this point that only relevant and realistic inclusion types will be used for lifetime predictions of corresponding components, in future. By doing so, highly conservative component designs will be avoided, and the materials potential will be exploited in a sustainable way. This investigation highlights the feasibility of inclusion modeling.
Future work must incorporate the microstructural short crack growth, to model the phenomena of crack stop. Thus, the predictions of defect size dependent fatigue limits would be possible and consequently the derivation of a numerical predicted Kitagawa-Takahashi-diagram [72].

5. Conclusions

In this publication, the influence of non-metallic inclusions and voids on the early stage of fatigue crack initiation behavior of a martensitic high-strength steel was investigated under fully reversed cyclic loading conditions by means of micromechanical simulations. To understand the different damage mechanisms around the oxidic and sulfidic defects as well as around voids, the following influencing parameters were studied in a systemic way with respect to their corresponding fatigue crack nucleation potential:
  • Residual stresses around oxidic inclusions
  • Microstructural variability around defects
  • Varying interface properties between non-metallic inclusions and the surrounding matrix
  • Defect size
  • Defect shape
  • Alignment of manganese sulfides to loading axis
An advanced local crystal plasticity model including kinematic hardening by an Ohno Wang type model was adopted to model the cyclic elasto-plastic material response. Therefore, an extension of the crystal plasticity model to incorporate residual stresses around non-metallic inclusions is proposed. The fatigue crack nucleation potential of the investigated defect configurations was assessed by the non-local Fatemi–Socie fatigue indicator parameter. The key perceptions of the comprehensive numerical design of experiment, where all the influencing parameters were varied, are the follows:
  • The consideration of the residual stresses around oxidic inclusions due to previous heat treatments result in an increased fatigue crack nucleation potential, in particular for fatigue loading levels close to the elastic regime.
  • The local fatigue crack nucleation responses around defects and inclusions depend strongly on the defect size, defect shape, martensitic block size and the crystallographic properties at the hot spot. Therefore, multiple martensitic microstructural realizations were considered in the numerical study to create a certain kind of statistical basis.
  • In the present study, voids with increasing aspect ratios represent the most severe defects under fully reversed strain-controlled loading conditions. In particular, for loading levels within the elastic regime, the different inclusion–matrix interface conditions influence the fatigue crack nucleation lives substantially.
  • The micromechanical investigations of the manganese sulfide fatigue crack nucleation behavior exhibit an influence of the aspect ratio (size of manganese sulfide) as well as a significant influence of the alignment of the manganese sulfide to the loading axis. These results correlate qualitatively well with the corresponding experimentally observed fracture behavior.

Author Contributions

Conceptualization, A.H., H.u.H., B.J.S. and P.S.-R.; methodology, B.J.S., A.H. and H.u.H.; investigation, B.J.S.; writing—original draft preparation, B.J.S.; visualization, B.J.S.; supervision, A.H. and P.S.-R.

Funding

This research received no external funding.

Conflicts of Interest

The authors declare no conflict of interest.

References

  1. Lewis, A.M.; Kelly, J.C.; Keoleian, G.A. Vehicle lightweighting vs. electrification: Life cycle energy and GHG emissions results for diverse powertrain vehicles. Appl. Energy 2014, 126, 13–20. [Google Scholar] [CrossRef]
  2. Tervo, H.; Kaijalainen, A.; Pikkarainen, T.; Mehtonen, S.; Porter, D. Effect of impurity level and inclusions on the ductility and toughness of an ultra-high-strength steel. Mater. Sci. Eng. A 2017, 697, 184–193. [Google Scholar] [CrossRef]
  3. Murakami, Y. Metal Fatigue: Effects of Small Defects and Nonmetallic Inclusions, 1st ed.; Elsevier: Oxford, UK, 2002. [Google Scholar]
  4. Yang, Z.; Zhang, J.; Li, S.; Li, G.; Wang, Q.; Hui, W.; Weng, Y. On the critical inclusion size of high strength steels under ultra-high cycle fatigue. Mater. Sci. Eng. A 2006, 427, 167–174. [Google Scholar] [CrossRef]
  5. Klösch, G.; Huemer, K.; Frank, G. Nichtmetallische Einschlüsse in Langprodukten: Entstehung, Bestimmung, Auswirkungen—Ein Überblick. BHM Berg-Und Hüttenmännische Monatshefte 2009, 154, 27–32. [Google Scholar] [CrossRef]
  6. Krewerth, D.; Lippmann, T.; Weidner, A.; Biermann, H. Influence of non-metallic inclusions on fatigue life in the very high cycle fatigue regime. Int. J. Fatigue 2016, 84, 40–52. [Google Scholar] [CrossRef]
  7. Juvonen, P. Effects of Non-Metallic Inclusions on Fatigue Properties of Calcium Treated Steels. Ph.D. Thesis, Helsinki University of Technology, Espoo, Finland, 2004. [Google Scholar]
  8. Tanaka, K.; Mura, T. A theory of fatigue crack initiation at inclusions. Metall. Trans. A 1982, 13, 117–123. [Google Scholar] [CrossRef]
  9. Sinz, U. Schwingfestigkeit von Common-Rail Komponenten unter Berücksichtigung von seltenen nichtmetallischen Einschlüssen. Ph.D. Thesis, Technische Universität Kaiserslautern, Kaiserslautern, Germany, 2017. [Google Scholar]
  10. Cyril, N.; Fatemi, A.; Cryderman, B. Effects of Sulfur Level and Anisotropy of Sulfide Inclusions on Tensile, Impact, and Fatigue Properties of SAE 4140 Steel. SAE Int. J. Mater. Manuf. 2009, 1, 218–227. [Google Scholar] [CrossRef]
  11. Temmel, C.; Ingesten, N.G.; Karlsson, B. Fatigue anisotropy in cross-rolled, hardened medium carbon steel resulting from MnS inclusions. Metall. Mater. Trans. A 2006, 37, 2995–3007. [Google Scholar] [CrossRef]
  12. Hosseini, S.B.; Temmel, C.; Karlsson, B.; Ingesten, N.G. An In-Situ Scanning Electron Microscopy Study of the Bonding between MnS Inclusions and the Matrix during Tensile Deformation of Hot-Rolled Steels. Metall. Mater. Trans. A 2007, 38, 982–989. [Google Scholar] [CrossRef]
  13. Maciejewski, J. The Effects of Sulfide Inclusions on Mechanical Properties and Failures of Steel Components. J. Fail. Anal. Prev. 2015, 15, 169–178. [Google Scholar] [CrossRef]
  14. Åman, M.; Okazaki, S.; Matsunaga, H.; Marquis, G.B.; Remes, H. Interaction effect of adjacent small defects on the fatigue limit of a medium carbon steel. Fatigue Fract. Eng. Mater. Struct. 2017, 40, 130–144. [Google Scholar] [CrossRef]
  15. Murakami, Y. Effects of Small Defects and Nonmetallic Inclusions on the Fatigue Strength of Metals. JSME Int. J. Ser. 1 Solid Mech. Strength Mater. 1989, 32, 167–180. [Google Scholar] [CrossRef]
  16. Murakami, Y.; Kodama, S.; Konuma, S. Quantitative evaluation of effects of non-metallic inclusions on fatigue strength of high strength steels. I: Basic fatigue mechanism and evaluation of correlation between the fatigue fracture stress and the size and location of non-metallic inclusions. Int. J. Fatigue 1989, 11, 291–298. [Google Scholar] [CrossRef]
  17. Zhou, S.; Murakami, Y.; Beretta, S.; Fukushima, Y. Experimental investigation on statistics of extremes for three-dimensional distribution of non-metallic inclusions. Mater. Sci. Technol. 2002, 18, 1535–1543. [Google Scholar] [CrossRef]
  18. Manonukul, A.; Dunne, F.P.E. High- and low-cycle fatigue crack initiation using polycrystal plasticity. Proc. R. Soc. London. Ser. A Math. Phys. Eng. Sci. 2004, 460, 1881–1903. [Google Scholar] [CrossRef]
  19. McDowell, D.; Dunne, F. Microstructure-sensitive computational modeling of fatigue crack formation. Int. J. Fatigue 2010, 32, 1521–1542. [Google Scholar] [CrossRef]
  20. Roters, F.; Eisenlohr, P.; Hantcherli, L.; Tjahjanto, D.; Bieler, T.; Raabe, D. Overview of constitutive laws, kinematics, homogenization and multiscale methods in crystal plasticity finite-element modeling: Theory, experiments, applications. Acta Mater. 2010, 58, 1152–1211. [Google Scholar] [CrossRef]
  21. Przybyla, C.; Prasannavenkatesan, R.; Salajegheh, N.; McDowell, D.L. Microstructure-sensitive modeling of high cycle fatigue. Int. J. Fatigue 2010, 32, 512–525. [Google Scholar] [CrossRef]
  22. Shenoy, M.; Zhang, J.; McDowell, D. Estimating fatigue sensitivity to polycrystalline Ni-base superalloy microstructures using a computational approach. Fatigue Fract. Eng. Mater. Struct. 2007, 30, 889–904. [Google Scholar] [CrossRef]
  23. Cruzado, A.; LLorca, J.; Segurado, J. Modeling cyclic deformation of inconel 718 superalloy by means of crystal plasticity and computational homogenization. Int. J. Solids Struct. 2017, 122–123, 148–161. [Google Scholar] [CrossRef]
  24. Briffod, F.; Shiraiwa, T.; Enoki, M. Microstructure modeling and crystal plasticity simulations for the evaluation of fatigue crack initiation in alpha-iron specimen including an elliptic defect. Mater. Sci. Eng. A 2017, 695, 165–177. [Google Scholar] [CrossRef]
  25. Boeff, M.; ul Hassan, H.; Hartmaier, A. Micromechanical modeling of fatigue crack initiation in polycrystals. J. Mater. Res. 2017, 32, 4375–4386. [Google Scholar] [CrossRef]
  26. Gillner, K.; Münstermann, S. Numerically predicted high cycle fatigue properties through representative volume elements of the microstructure. Int. J. Fatigue 2017, 105, 219–234. [Google Scholar] [CrossRef]
  27. Briffod, F.; Shiraiwa, T.; Enoki, M. Modeling and Crystal Plasticity Simulations of Lath Martensitic Steel under Fatigue Loading. Mater. Trans. 2018, 60. [Google Scholar] [CrossRef]
  28. Schäfer, B.J.; Sonnweber-Ribic, P.; ul Hassan, H.; Hartmaier, A. Micromechanical Modelling of the Influence of Strain Ratio on Fatigue Crack Initiation in a Martensitic Steel-A Comparison of Different Fatigue Indicator Parameters. Materials 2019, 12, 2852. [Google Scholar] [CrossRef] [PubMed]
  29. Brückner-Foit, A.; Huang, X. Numerical simulation of micro-crack initiation of martensitic steel under fatigue loading. Int. J. Fatigue 2006, 28, 963–971. [Google Scholar] [CrossRef]
  30. Hallberg, H.; Ås, S.K.; Skallerud, B. Crystal plasticity modeling of microstructure influence on fatigue crack initiation in extruded Al6082-T6 with surface irregularities. Int. J. Fatigue 2018, 111, 16–32. [Google Scholar] [CrossRef]
  31. Castelluccio, G.M.; McDowell, D.L. A mesoscale approach for growth of 3D microstructurally small fatigue cracks in polycrystals. Int. J. Damage Mech. 2014, 23, 791–818. [Google Scholar] [CrossRef]
  32. Musinski, W.D.; McDowell, D.L. On the eigenstrain application of shot-peened residual stresses within a crystal plasticity framework: Application to Ni-base superalloy specimens. Int. J. Mech. Sci. 2015, 100, 195–208. [Google Scholar] [CrossRef]
  33. Gallo, P. On the Crack-Tip Region Stress Field in Molecular Systems: The Case of Ideal Brittle Fracture. Adv. Theory Simul. 2019, 2. [Google Scholar] [CrossRef]
  34. Gallo, P.; Hagiwara, Y.; Shimada, T.; Kitamura, T. Strain energy density approach for brittle fracture from nano to macroscale and breakdown of continuum theory. Theor. Appl. Fract. Mech. 2019, 103. [Google Scholar] [CrossRef] [Green Version]
  35. Ye, W.; Efthymiadis, P.; Pinna, C.; Ma, A.; Shollock, B.; Dashwood, R. Experimental and modelling study of fatigue crack initiation in an aluminium beam with a hole under 4-point bending. Int. J. Solids Struct. 2018, 138, 87–96. [Google Scholar] [CrossRef]
  36. Fan, J.; McDowell, D.L.; Horstemeyer, M.F.; Gall, K. Cyclic plasticity at pores and inclusions in cast Al–Si alloys. Eng. Fract. Mech. 2003, 70, 1281–1302. [Google Scholar] [CrossRef]
  37. Gall, K.; Horstemeyer, M.F.; Degner, B.W.; McDowell, D.L.; Fan, J. On the driving force for fatigue crack formation from inclusions and voids in a cast A356 aluminum alloy. Int. J. Fract. 2001, 108, 207–233. [Google Scholar] [CrossRef]
  38. Carroll, J.; Brewer, L.; Battaile, C.; Boyce, B.; Emery, J. The effect of grain size on local deformation near a void-like stress concentration. Int. J. Plast. 2012, 39, 46–60. [Google Scholar] [CrossRef]
  39. Battaile, C.C.; Emery, J.M.; Brewer, L.N.; Boyce, B.L. Crystal plasticity simulations of microstructure-induced uncertainty in strain concentration near voids in brass. Philos. Mag. 2015, 95, 1069–1079. [Google Scholar] [CrossRef]
  40. Gillner, K.; Henrich, M.; Münstermann, S. Numerical study of inclusion parameters and their influence on fatigue lifetime. Int. J. Fatigue 2018, 111, 70–80. [Google Scholar] [CrossRef]
  41. Prasannavenkatesan, R.; Przybyla, C.P.; Salajegheh, N.; McDowell, D. Simulated extreme value fatigue sensitivity to inclusions and pores in martensitic gear steels. Eng. Fract. Mech. 2011, 78, 1140–1155. [Google Scholar] [CrossRef]
  42. Salajegheh, N. Microstructure-Sensitive Weighted Probability Approach for Modeling Surface to Bulk Transition of High Cycle Fatigue Failures Dominated by Primary Inclusions. Ph.D. Thesis, Georgia Institute of Technology, Atlanta, Georgia, 2011. [Google Scholar]
  43. Prithivirajan, V.; Sangid, M.D. The role of defects and critical pore size analysis in the fatigue response of additively manufactured IN718 via crystal plasticity. Mater. Des. 2018, 150, 139–153. [Google Scholar] [CrossRef]
  44. Bandyopadhyay, R.; Sangid, M.D. Crystal plasticity assessment of inclusion- and matrix-driven competing failure modes in a nickel-base superalloy. Acta Mater. 2019, 177, 20–34. [Google Scholar] [CrossRef]
  45. Gu, C.; Lian, J.; Bao, Y.; Münstermann, S. Microstructure-based fatigue modelling with residual stresses: Prediction of the microcrack initiation around inclusions. Mater. Sci. Eng. A 2019, 751, 133–141. [Google Scholar] [CrossRef]
  46. Clark, B.; Castelluccio, G.; Reiterer, M.; McDowell, D.; Neu, R. Microstructure-sensitive fatigue modelling of medical-grade fine wire. Fatigue Fract. Eng. Mater. Struct. 2019, 42, 152–165. [Google Scholar] [CrossRef]
  47. Zhang, T.; Jiang, J.; Britton, B.; Shollock, B.; Dunne, F. Crack nucleation using combined crystal plasticity modelling, high-resolution digital image correlation and high-resolution electron backscatter diffraction in a superalloy containing non-metallic inclusions under fatigue. Proc. R. Soc. A Math. Phys. Eng. Sci. 2016, 472, 20150792. [Google Scholar] [CrossRef] [PubMed]
  48. Naragani, D.; Sangid, M.D.; Shade, P.A.; Schuren, J.C.; Sharma, H.; Park, J.S.; Kenesei, P.; Bernier, J.V.; Turner, T.J.; Parr, I. Investigation of fatigue crack initiation from a non-metallic inclusion via high energy x-ray diffraction microscopy. Acta Mater. 2017, 137, 71–84. [Google Scholar] [CrossRef]
  49. Schäfer, B.J.; Song, X.; Sonnweber-Ribic, P.; ul Hassan, H.; Hartmaier, A. Micromechanical Modelling of the Cyclic Deformation Behavior of Martensitic SAE 4150—A Comparison of Different Kinematic Hardening Models. Metals 2019, 9, 368. [Google Scholar] [CrossRef] [Green Version]
  50. Kitahara, H.; Ueji, R.; Tsuji, N.; Minamino, Y. Crystallographic features of lath martensite in low-carbon steel. Acta Mater. 2006, 54, 1279–1288. [Google Scholar] [CrossRef]
  51. Morito, S.; Tanaka, H.; Konishi, R.; Furuhara, T.; Maki, T. The morphology and crystallography of lath martensite in Fe-C alloys. Acta Mater. 2003, 51, 1789–1799. [Google Scholar] [CrossRef]
  52. Cayron, C. ARPGE: A computer program to automatically reconstruct the parent grains from electron backscatter diffraction data. J. Appl. Crystallogr. 2007, 40, 1183–1188. [Google Scholar] [CrossRef] [Green Version]
  53. Kitahara, H.; Ueji, R.; Ueda, M.; Tsuji, N.; Minamino, Y. Crystallographic analysis of plate martensite in Fe—28.5 at. % Ni by FE-SEM/EBSD. Mater. Charact. 2005, 54, 378–386. [Google Scholar] [CrossRef]
  54. Murakami, Y. Inclusion Rating by Statistics of Extreme Values and Its Application to Fatigue Strength Prediction and Quality Control of Materials. J. Res. Natl. Inst. Stand. Technol. 1994, 99, 345–351. [Google Scholar] [CrossRef]
  55. Sandström, R.; Karlsson, L. Transfer of two dimensional inclusion size distribution to three dimensions. In Proceedings of the Swedish Symposium on Non-Metallic Inclusions in Steel, Uddeholm, Sweden, 27–29 April 1981; pp. 242–268. [Google Scholar]
  56. Anderson, C.; Shi, G.; Atkinson, H.; Sellars, C. The precision of methods using the statistics of extremes for the estimation of the maximum size of inclusions in clean steels. Acta Mater. 2000, 48, 4235–4246. [Google Scholar] [CrossRef]
  57. Spriestersbach, D.; Grad, P.; Kerscher, E. Influence of different non-metallic inclusion types on the crack initiation in high-strength steels in the VHCF regime. Int. J. Fatigue 2014, 64, 114–120. [Google Scholar] [CrossRef]
  58. Dassault Systèmes. Abaqus Documentation; MIT Press: Cambridge, MA, USA, 2018. [Google Scholar]
  59. Lu, S.; Pister, K. Decomposition of deformation and representation of the free energy function for isotropic thermoelastic solids. Int. J. Solids Struct. 1975, 11, 927–934. [Google Scholar] [CrossRef]
  60. Lee, E.H. Elastic-plastic deformation at finite strains. J. Appl. Mech. 1969, 36, 1–6. [Google Scholar] [CrossRef]
  61. Sherby, O.D.; Wadsworth, J.; Lesuer, D.R.; Syn, C.K. Revisiting the Structure of Martensite in Iron-Carbon Steels. Mater. Trans. 2008, 49, 2016–2027. [Google Scholar] [CrossRef] [Green Version]
  62. Michiuchi, M.; Nambu, S.; Ishimoto, Y.; Inoue, J.; Koseki, T. Relationship between local deformation behavior and crystallographic features of as-quenched lath martensite during uniaxial tensile deformation. Acta Mater. 2009, 57, 5283–5291. [Google Scholar] [CrossRef]
  63. Rice, J. Inelastic constitutive relations for solids: An internal-variable theory and its application to metal plasticity. J. Mech. Phys. Solids 1971, 19, 433–455. [Google Scholar] [CrossRef]
  64. Hutchinson, J.W. Bounds and self-consistent estimates for creep of polycrystalline materials. Proc. R. Soc. Lond. A Math. Phys. Eng. Sci. 1976, 348, 101–127. [Google Scholar] [CrossRef]
  65. Peirce, D.; Asaro, R.; Needleman, A. Material rate dependence and localized deformation in crystalline solids. Acta Metall. 1983, 31, 1951–1976. [Google Scholar] [CrossRef]
  66. Ohno, N.; Wang, J.D. Kinematic hardening rules with critical state of dynamic recovery, part I: Formulation and basic features for ratchetting behavior. Int. J. Plast. 1993, 9, 375–390. [Google Scholar] [CrossRef]
  67. Lubarda, V.A. Constitutive theories based on the multiplicative decomposition of deformation gradient: Thermoelasticity, elastoplasticity, and biomechanics. Const. Theor. Based Mult. Decompos. Deform. Gradient Thermoelast. Elastoplast. Biomech. 2004, 57, 95–108. [Google Scholar] [CrossRef]
  68. Vujosevic, L.; Lubarda, V.A. Finite-strain thermo elasticity based on multiplicative decomposition of deformation gradient. Theor. Appl. Mech. 2002, 28–29, 379–399. [Google Scholar] [CrossRef]
  69. Sweeney, C.; Dunne, F.; McHugh, P.; Leen, S. Micro-scale testing and micromechanical modelling for high cycle fatigue of CoCr stent material. J. Mech. Behav. Biomed. Mater. 2015, 46, 244–260. [Google Scholar] [CrossRef] [PubMed] [Green Version]
  70. Fatemi, A.; Socie, D.F. A critical plane approach to multiaxial fatigue damage including ou-of-phase loading. Fatigue Fract. Eng. Mater. Struct. 1988, 11, 149165. [Google Scholar] [CrossRef]
  71. Pineau, A.; Forest, S. Effects of inclusions on the very high cycle fatigue behaviour of steels. Fatigue Fract. Eng. Mater. Struct. 2017, 40, 1694–1707. [Google Scholar] [CrossRef]
  72. Kitagawa, H.; Takahashi, S. Applicability of fracture mechanics to very small cracks or cracks in the early stage. In Proceedings of the second international conference on mechanical behavior of materials, Boston, MA, USA, 16–20 August 1976; pp. 627–631. [Google Scholar]
Figure 1. Martensitic microstructure and corresponding non-metallic inclusions: (a) Schematic visualization of the hierarchical martensitic microstructure, following Kitahara et al. [50]. (b) Inverse pole figure color map with reconstructed prior austenite grain boundaries indicated by white solid lines. (c) Spherical aluminum oxide. (d) Elongated manganese sulfides. The colors in (b) correspond to orientations perpendicular to the observed plane.
Metals 09 01258 g001
Figure 2. Statistical evaluation of failure-relevant non-metallic inclusions in SAE 4150: (a) Experimental inclusion data and generalized extreme value distributions for oxidic and sulfidic inclusions with respect to the defect length scale λ. (b) Experimental inclusion data and generalized extreme value distributions for oxidic and sulfidic inclusions with respect to aspect ratio.
Metals 09 01258 g002
Figure 3. Finite element model and applied boundary conditions of the reference configuration without defect. Prior austenite grain boundaries are indicated by black solid lines.
Metals 09 01258 g003
Figure 4. Schematic visualization of a statistical volume element containing a defect with diameter D exhibiting different possible inclusion–matrix interface configurations. In addition, the two different mesh regions within the SVE are indicated correspondingly.
Metals 09 01258 g004
Figure 5. Schematic visualization of the modeling methodology of the manganese sulfides within the martensitic microstructure: (a) Schematic visualization of the martensitic microstructure with the manganese sulfide (Manganese sulfide shown as orange inclusion). (b) Detail of the spatial distribution of tie constraint and contact modeling schemes and (c) detail of the spatial position of the manganese sulfide with respect to loading axis.
Metals 09 01258 g005
Figure 6. Schematic representation of the inclusion and defect variants of the micromechanical design of experiment (DOE). Five-level hierarchical structure of the DOE: (1) Inclusion types and interfaces. (2) Inclusion and defect sizes represented by diameters (D) and aspect ratios (AR). (3) Defect geometries expressed by aspect ratios. (4) Microstructural variations ranging from M1–M3 and finally (5) the different applied total strain amplitudes.
Metals 09 01258 g006
Figure 7. Effect of local crystallographic variations around voids (AR = 1.0) on fatigue crack initiation behavior for εa,t = 0.50%. Radial path plots through the individual hot spot of each SVE. (a) Path plot for void D = 18 μm. (b) Path plot for void D = 36 μm and (c) Path plot for void D = 110 μm. One of the fatigue crack nucleation hot spots of the investigated voids is exemplarily depicted in Figure 10.
Metals 09 01258 g007
Figure 8. Residual stress distribution around a perfectly bonded Al2O3-inclusions with an aspect ratio of AR = 1. (a) Martensitic microstructure with an embedded inclusion. (b) Radial residual stress distribution. (c) Circumferential residual stress distribution.
Metals 09 01258 g008
Figure 9. Residual stresses around oxidic inclusions. (a) Comparison of predicted radial (σrad) and circumferential (σcirc) residual stresses around an inclusion by micromechanical modeling and isotropic material modeling. (b) Effect of superimposed residual stresses on fatigue crack nucleation behavior at different loading levels. The location of one fatigue crack nucleation hot spot of the investigated perfectly bonded inclusions is exemplarily depicted in Figure 10.
Metals 09 01258 g009
Figure 10. Contour plots of the von Mises stress in MPa and the dimensionless Fatemi–Socie parameter around the defects with D = 110 μm are shown at the end of fifths fatigue loading cycles in the first and second column, respectively. The bonded inclusion, partly debonded inclusion, cracked inclusion and the void are shown in the first, second, third and fourth row, respectively. The individual fatigue crack nucleation hotspots are indicated with a white arrow in the Fatemi–Socie plot. The contour plot values correspond to the local integration points in the center of each finite element.
Metals 09 01258 g010
Figure 11. Comparison of the non-local Fatemi–Socie parameter distribution as a function of the far-field applied total strain amplitude for the different inclusion–matrix interface configurations. (a) Inhomogeneity with diameter D = 18 μm. (b) Inhomogeneity with diameter D = 36 μm. (c) Inhomogeneity with diameter D = 110 μm.
Metals 09 01258 g011
Figure 12. Non-local Fatemi–Socie responses of the different inclusion–matrix configurations as a function of the different defect sizes with an aspect ratio of AR = 1.0, for: (a) 0.10% applied total strain amplitude at Rε = −1 and (b) 0.50% applied total strain amplitude at Rε = −1. The different colored dashed lines represent the arithmetical average of the three microstructural representatives of each defect type.
Metals 09 01258 g012
Figure 13. Schematic visualization of the models to investigate the influence of aspect ratio on fatigue crack initiation. Therefore, voids within the martensitic microstructure are used. These defects exhibit different aspect ratios increasing from left to right from AR = 1.0, 2.0 up to 10.0.
Metals 09 01258 g013
Figure 14. Non-local Fatemi–Socie fatigue crack initiation simulation results of voids with a major axis of 110 μm and three different aspect ratios. The aspect ratio is represented as the ratio of the major and minor defect axes. (a) Loading level of εa,t = 0.10% and (b) loading level of εa,t = 0.50%.
Metals 09 01258 g014
Figure 15. Non-local Fatemi–Socie parameter as a function of the manganese sulfide aspect ratio. The colored markers of each aspect ratio represent the different microstructural realizations. The fully reversed strain-controlled loading was perpendicular to the manganese sulfide with: (a) A total strain amplitude of εa,t = 0.10% and (b) with a total strain amplitude of εa,t = 0.50%.
Metals 09 01258 g015
Figure 16. Fatigue crack initiation lifetime results for the martensitic steel with / without varying defects under fully reversed strain-controlled loading. By means of the Fatemi–Socie metric, micromechanical simulations were performed for: (a) Defects with diameters of D = 110 μm. (b) Defects with diameters of D = 36 μm. (c) Defects with diameters of D = 18 μm and (d) for manganese sulfides with varying aspect ratios and orientations to loading axis. Arithmetic average linear fatigue lifetime curves are shown for each defect type in the corresponding color. The abbreviation PD stands for partially debonded and AR for aspect ratio.
Metals 09 01258 g016
Table 1. Chemical composition of the SAE 4150 in wt.%.
MaterialCSiMnPSCrMo
SAE 41500.520.260.740.0140.0081.310.18
Table 2. Derived inclusion properties of oxidic and sulfidic non-metallic inclusions in SAE 4150. Extracted defect length scale λ , corresponding diameter and aspect ratio values belonging to the 10th, 50th and 90th percentile of the underlying generalized extreme value distributions.
Cumulative ProbabilityOxidic Non-Metallic InclusionsSulfidic Non-Metallic Inclusions
P = 10%P = 50%P = 90%P = 10%P = 50%P = 90%
Defect length scale λ in μm1632971643116
Diameter in μm1836.2110---
Aspect ratio [-]1.22.210102554
Table 3. Mechanical properties of the considered inclusion types and the steel matrix [3].
Chemical CompositionYoung’s Modulus EPoisson’s Ratio νCoefficient of Thermal Expansion α T
Al2O3389 GPa0.258.0 × 10 6 1/K
MnS69 GPa0.3018.1 × 10 6 1/K
Steel Matrix--12.5 × 10 6 1/K
Table 4. Set of crystal plasticity parameters for SAE 4150 (39 HRC) at room temperature [49].
Elastic ConstantsFlow Rule ParametersKinematic Hardening Parameters
C 11 253.1 GPa γ ˙ 0 0.001 s 1 A65.506 GPa
C 22 132.4 GPa τ c , 0 α 209 MPaB499
C 44 75.8 GPam100M8
Table 5. Ratio of the maximum to the minimum non-local Fatemi–Socie response of three considered microstructural realizations.
Strain AmplitudeD = 110 μ mD = 36 μ mD = 18 μ m
0.10%2.355.101.98 × 10 5
0.30%1.661.081.46
0.50%1.521.602.02

