Article

Microstructure and Mechanical Properties of Rapidly Solidified β-Type Ti–Fe–Sn–Mo Alloys with High Specific Strength and Low Elastic Modulus

1
School of Materials Science and Engineering, Shaanxi University of Technology, Hanzhong 723001, China
2
School of Materials Science and Engineering, Shanghai University, Shanghai 200444, China
*
Author to whom correspondence should be addressed.
Metals 2019, 9(11), 1135; https://doi.org/10.3390/met9111135
Submission received: 12 September 2019 / Revised: 15 October 2019 / Accepted: 18 October 2019 / Published: 23 October 2019

Abstract

:
The microstructure and mechanical properties of rapidly solidified β-type Ti–Fe–Sn–Mo alloys with high specific strength and low elastic modulus were investigated. The results show that the phases of Ti–Fe–Sn–Mo alloys are composed of the β-Ti, α-Ti, and TiFe phases; the volume fraction of TiFe phase decreases with the increase of Mo content. The high Fe content results in the deposition of TiFe phase along the grain boundary of the Ti phase. The Ti75Fe19Sn5Mo1 alloy exhibits the high yield strength, maximum compressive strength, large plastic deformation, high specific strength, high Vickers hardness, and large toughness value, which is a superior new engineering material. The elastic modulus (42.1 GPa) of Ti75Fe15Sn5Mo5 alloy is very close to the elastic modulus of human bone (10–30 GPa), which indicating that the alloy can be used as a good biomedical alloy. In addition, the large H/Er and H3/Er2 values of Ti75Fe19Sn5Mo1 alloy indicate the good wear resistance and long service life as biomedical materials.

1. Introduction

Ti alloys have been widely used in engineering structural materials and biomedical materials [1,2,3,4,5]. As engineering structural materials, Ti alloys have low density, high strength, and good corrosion resistance, and they are widely used in automotive, aerospace and other fields [1,4,5]. As biomedical materials, Ti alloys have good biocompatibility, low modulus of elasticity, and high ductility, and they are widely used in medical devices, hard tissue, and soft tissue implants [2,3,5,6,7,8,9,10]. Among Ti-based alloys, Ti–Fe-based alloys are favored by researchers of engineering materials, functional materials and biomedical alloys, based on high strength, low density, high specific strength, and low elastic modulus [11,12,13,14,15]. In early studies, Ti–Fe based alloys were generally selected in hypereutectic regions, such as the binary Ti65Fe35 hypereutectic alloy, which has high fracture strength and yield strength, and the plastic deformation can reach 6.7%; the microstructures of Ti65Fe35 alloy are composed of β-Ti and a large number of TiFe phases [16]. When Sn is added to binary Ti65Fe35 alloy, the strength and ductility of alloys can be improved; the reason is that the addition of Sn controls the growth of dendrites and it reduces the length-scale of lamellar spacing [17]. For hypereutectic Ti–Fe alloys, the high content of brittle TiFe phase leads to the low ductility of the alloys. It is necessary to reduce the content of Fe to control the content of TiFe phase. Therefore, some researchers choose the Ti70.5Fe29.5 eutectic component as base alloy [15,16,17,18]. When the minor Sn and Nb elements are added into eutectic Ti70.5Fe29.5 alloy, the grain size is refined and the content of TiFe phase is further reduced, which can improve the strength and ductility of the Ti–Fe-based alloys [15,16,17,18,19]. For example, the (Ti0.705Fe0.295)96.15Sn3.85 alloy exhibits high yield strength of 1794 MPa and large plastic deformation of 9.6% [15]; the ductility of the (Ti0.705Fe0.295)93.15Sn3.85Nb3 alloy can be further improved [19].
The microstructures of the eutectic Ti–Fe-based alloys are composed of β-Ti and TiFe phase [15,16,17,18,19]. Although the content of TiFe phase for the eutectic Ti–Fe-based alloys is lower than that of TiFe phase for the hypereutectic Ti–Fe-based alloys, the content of TiFe phase for the former is still high, which affects the strength and ductility of the Ti–Fe-based alloy. Ternary Ti–Fe–Cu, Ti–Fe–Ta, and Ti–Fe–Co and quaternary Ti–Fe–Sn–Nb hypoeutectic alloys have been reported to further reduce the content of TiFe phase [13,20,21,22,23]. The Ti94Fe3Cu3 alloy exhibits the high tensile strength (1200 MPa) and large percentage elongation of 9%, which is attributed to the formation of micro/nano-structured α- and β-Ti phases by the dual-axial forging method [20]. The Ti80Fe14Sn3Nb3 alloy exhibits the high yield strength of 1.88 GPa, ultimate compressive stress of 2400 MPa, plastic strain of 32.4%; the good mechanical properties are attributed to supersaturated β-Ti phase and the high density of lattice defects that restrict the dislocation motion [12].
The microstructures of hypoeutectic Ti–Fe-based alloys are generally composed of β-Ti and α-Ti phases; the strength of the alloys is low and the ductility is high when the alloys are mainly composed of β-Ti phases. When the alloy is eutectic, the alloy is composed of a large number of β-Ti and TiFe phases. The plasticity of the alloy is low because of the high content of brittle TiFe phases. While the alloy is hypereutectic, the alloy is composed of a small number of β-Ti phases and a large number of TiFe phases, and the plasticity of the alloy is low. We have previously reported that Ti80Fe20 is a base alloy, the phase of which is composed of a combined β-Ti phase and a small amount of TiFe phases, and its strength is low. A small amount of Sn element is used to replace part of Ti element to improve the precipitation of TiFe phase. Among the reported rapidly solidified Ti79Fe20Sn1, Ti77Fe20Sn3, and Ti75Fe20Sn5 alloys, the Ti75Fe20Sn5 alloy has the lowest elastic modulus, the highest yield strength, and plastic deformation [11]. In fact, rapid solidification is a faster cooling method than natural cooling rate. The alloy that was prepared by rapid solidification had the small particle size. According to Hall-petch expression, when the alloy has smaller particle size, the strength of the alloy is larger [11,12,14]. It is necessary to reduce the content of brittle TiFe phase and prepare alloys by rapid solidification to further improve the strength and plasticity of Ti75Fe20Sn5 alloy. In this paper, the effect of Mo addition on the microstructure and mechanical properties of rapidly solidified Ti–Fe–Sn–Mo quaternary alloys was studied by replacing the Fe element with minor Mo element. The experimental data obtained can be used as reference for engineering application and biomaterial application.

2. Experimental Procedure

Various combinations of pure Ti, Fe, Sn, and Mo (purity of 99.9% or higher) were used to prepare the ingots of three Ti–Fe–Sn–Mo alloys with nominal compositions of Ti75Fe19Sn5Mo1, Ti75Fe17Sn5Mo3, and Ti75Fe15Sn5Mo5 (at.%) under a high vacuum (3 × 10⁻³ Pa) while using a magnetically controlled tungsten arc-melting furnace (Shenyang Scientific Instruments Co., Ltd., Chinese Academy of Sciences, Shenyang, China) in high purity argon atmosphere. The raw materials Ti, Fe, and Sn are bulk, and the range of sizes was from 5 × 5 × 5 mm3 to 20 × 20 × 20 mm3. These raw materials were obtained from Beijing Xingrongyuan Technology Co., Ltd. (Beijing, China). As the high melting point of Mo, the number of melting times of ingots is more than five times in arc melting to ensure the chemical homogeneity of the components. As the low melting point of Sn, in the first melting process, Sn blocks were placed at the bottom of the melting crucible. The other three alloys were covered with Sn blocks to reduce the volatilization of molten Sn elements. Subsequently, the melted alloy ingot was melted again in the suction crucible and then filled with copper mould to make the cylindrical bar with diameter of 3 mm and length of 50 mm. Slow–speed metal saw was used to cut the samples needed for the test of microstructure and mechanical properties from 3 mm rod-like samples. The microstructure of samples with the diameter of 3 mm was characterized while using a Rigaku D\max-2550 X-ray diffractometer (XRD, Rigaku Company, Tokyo, Japan) with Cu Ka radiation, using the operating voltage is 30 KV. Standard metallographic techniques, consisting of grinding up to 2000 grit with a SiC paper and polishing with a colloidal silica suspension, were used on the surface of 3 mm specimens to observe the microstructure of the samples. The surfaces of polished samples need to be etched for observing the microstructure. This was accomplished with a mixed solution of HF, HNO3, and H2O, and the corresponding volume ratio is 1:4:5. The microstructure of prepared samples was observed by optics microscope (OM, Shanghai Changfang Optical Instrument Co., LTD, Shanghai, China).
The Ti–Fe–Sn–Mo samples with a diameter of 3.0 mm and height of ~5.0 mm were prepared by subjecting to quasi-static uniaxial compression testing at room temperature, while using a CMT5105 electronic testing machine (Metis Industrial Systems (China) Co., Ltd., Shanghai, China). The strain rate is 2.5 × 10⁻⁴ s−1. The two ends of the sample need to be parallel and smooth to reduce the friction between the cross section of the sample and the pressure head of the instrument. The fracture morphology of the compressed samples was observed by scanning electron microscopy (SEM, JSM-6390LV, JEOL, Peabody, MA, USA) with an energy dispersive spectrometer (EDS). The two ends of the sample need to be parallel and the testing end needs to be smooth to accurately test the Vickers hardness of the sample. Therefore, the Vickers hardness of polished samples was tested while using an HVS-10Z/LCD hardness testing machine (Shanghai Gaozhi Precision Instrument Co., Ltd., Shanghai, China). During the test, the loading force is 200 N and the holding time is 10 s. The densities of samples (ρ) were measured by Archimedes method while using ZMD electrinic density meter.
The microstructures of the samples were observed by transmission electron microscope (TEM) and the samples with thickness of 300–500 µm were cut from as-cast samples. Subsequently, the 800, 1000, 1200, and 2000 grits with the SiC papers were used to manually grind the sample to approximately 50 µm. The disks were then electropolished using a twin-jet method in an electrolyte solution of 25% HNO3 and 75% methanol by volume around 238 K. TEM measurements were carried out using a JEM–2100F microscope with an accelerating voltage of 200 kV.
The elastic modulus and hardness of Ti–Fe–Sn–Mo alloys were measured by the nano-indentation technique. The nano-indentation tests were performed by a Hystron-Tl900 TriboIndentor system (Beijing Obel Scientific Instruments Co., Ltd. Beijing, China) that was equipped with a Berkovich indenter (Bruker, Germany). During the nono-indentation test, the loading force is 8000 µN, the loading and unloading rates are 1.6 mN⋅s−1, and the loading time, holding time, and unloading time are 5 s. Nanoindentation tests are measured at least 10 times and the reported data are the average of 10 times to reduce the test error. The reduced elastic modulus (Er) and hardness (H) values were automatically calculated using the TriboScanTm software (Boston University, Massachusetts, USA). To ensure the correctness of the measured results, the surface of each sample was polished to mirror-finish. Based on a Berkovich indenter, the calculated Er values were used [24]:
E r = π 2 A ( h c ) S
where S is the stiffness and A(hc) represents the contact area. In addition, the relationship between the Er and standard elastic modulus (Es) is as follows [25],
1 E r = 1 v s 2 E s + 1 v i 2 E i
where vs and vi are the Poisson’s ratio of the sample and indenter, respectively. For the Ti-based biomedical alloys, the average value of vs is equal to 0.36 [26].

3. Results and Discussion

3.1. Microstructure of Ti–Fe–Sn–Mo Alloys

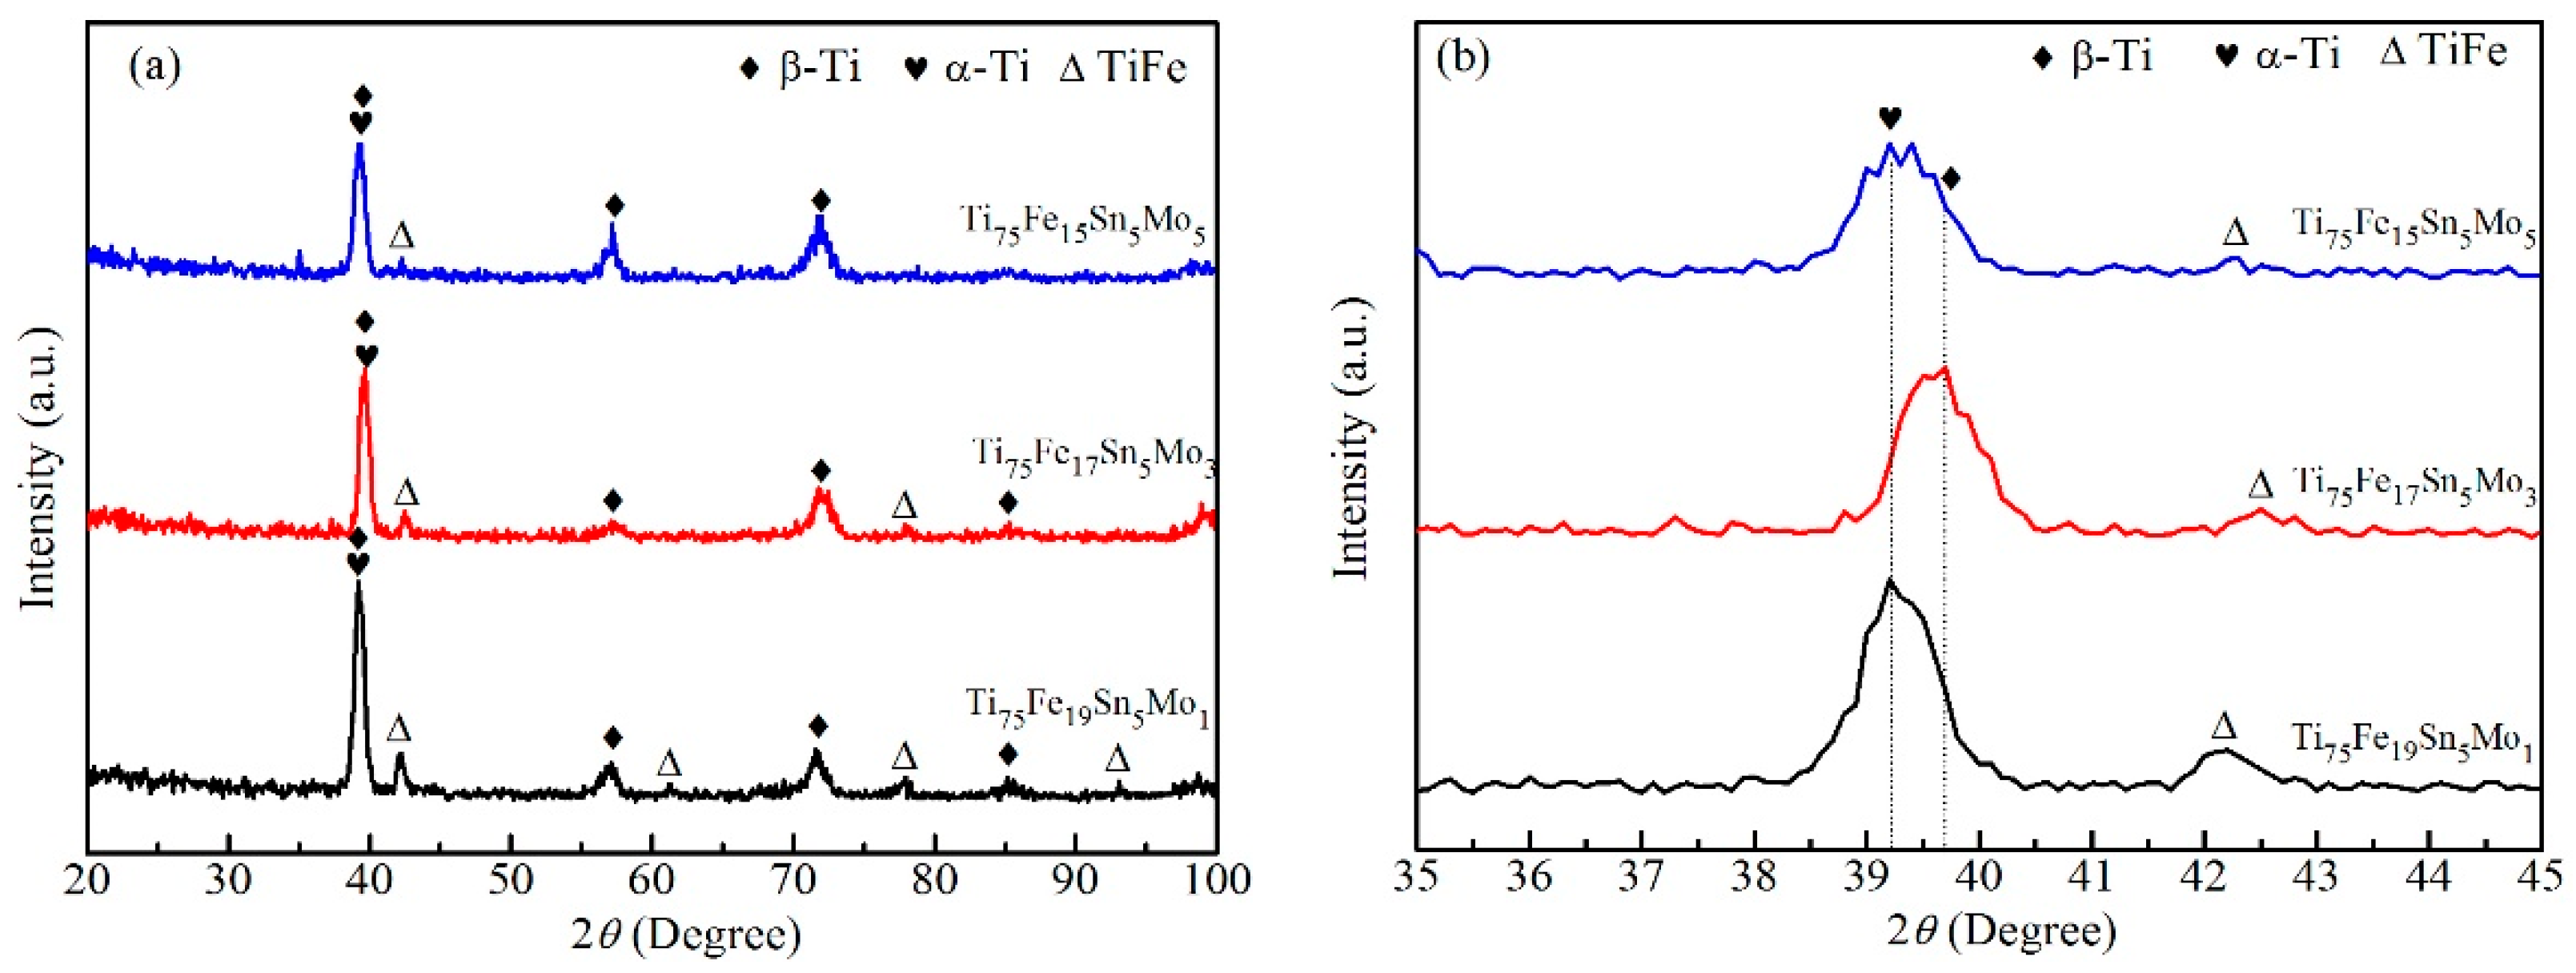
Figure 1 shows the XRD patterns of the Ti–Fe–Sn–Mo alloys. The results show that the phases of the Ti75Fe19Sn5Mo1, Ti75Fe17Sn5Mo3, and Ti75Fe15Sn5Mo5 alloys are composed of β-Ti, α-Ti, and TiFe phases, which indicates that the addition of Mo does not change the types of phases of the alloys. At the same test conditions in XRD patterns, the relative diffraction intensity of a phase can approximately reflect the volume fraction of the corresponding phase [2]. The relative diffraction intensity of TiFe phase decreases with the increase of Mo content in Figure 1a, indicating that the volume fraction of TiFe phase decreases with the increase of Mo content. As the differences of diffraction angle for the strongest diffraction peak between the β-Ti and α-Ti phases are small, Figure 1b is a local magnification diagram of Figure 1a, to distinguish the diffraction peaks of the two phases. In Figure 1b, the strongest diffraction peak of the Ti75Fe19Sn5Mo1 alloy is the α-Ti phase, while the intensity of the β-Ti phase is lower than that of the α-Ti phase, which indicates that the matrix phase of the alloy is α-Ti phase, and the second phases are the β-Ti and TiFe phases. In fact, this result is consistent with the type of matrix phase and the second phase of Ti75Fe20Sn5 alloy [11], which suggests that the addition of minor Mo does not change the type of phase. For the Ti75Fe17Sn5Mo3 alloy, the strongest diffraction peak is β-Ti phase, while the diffractive strength of α-Ti phase is smaller than that of α-Ti phase for the Ti75Fe19Sn5Mo1 alloy, indicating that the matrix phase of the Ti75Fe17Sn5Mo3 alloy is the β-Ti phase and the second phase is the α-Ti and TiFe phases. Accordingly, that the addition of Mo changes the matrix phase and the second phase of Ti75Fe20Sn5 alloy. In addition, for the Ti75Fe15Sn5Mo5 alloy, the strongest diffraction peak is the α-Ti phase, while the intensity of diffraction peak of the β-Ti phase is lower than that of the α-phase, which indicates that the matrix phase of the alloy is the α-Ti phase and the second phase is the β-Ti phase and TiFe phase. Thus, the matrix phase of the Ti75Fe19Sn5Mo1 and Ti75Fe15Sn5Mo5 alloys is the α-Ti phase, the second phases are the β-Ti and TiFe phases, while the matrix phase of Ti75Fe17Sn5Mo5 alloy is the β-Ti phase, and the second phases are the α-Ti and TiFe phases.
In fact, in the XRD patterns, the approximate volume fraction of the corresponding phase can be calculated based on the relative diffraction intensity of the phase [2,11]. When the strong diffraction intensity of phase is normalized to 100%, and the strong diffraction intensities of the other phases are normalized, the normalized value can approximately represent the relative volume fraction (Vri) of each phase [11]. The relationship between the Vri values and the approximate volume fraction (V1) of phase with strong diffraction intensity can be written by [11],
i = 1 n V 1 V r i = 100 %   ( i   =   1 ,   2 ,   3 ,   ,   n )
and
Vi = V1Vri (i = 1, 2, 3, …, n)
Vi is the approximate volume fraction of the i phase. Table 1 lists the approximate volume fractions of β-Ti phase, α-Ti phase, and TiFe phase calculated from Figure 1. For the Ti75Fe19Sn5Mo1 alloy, the Vβ value of β-Ti phase is 42.3%, that of α-Ti phase is 47.3%, and the difference of volume fraction between the two phases is small. For the Ti75Fe17Sn5Mo3 alloy, the volume fractions of the β-Ti and α-Ti phases are 56.8% and 33.4%, respectively, indicating that the difference of volume fraction between the two phases is large. For the Ti75Fe15Sn5Mo5 alloy, the Vα of the α-Ti phase is as high as 60%, which is the largest of the three alloys, while the Vβ value of the β-Ti phase is 37.8%, which is the smallest of the three alloys, and the volume difference between the two phases is quite different. In addition, the volume fraction of TiFe phase decreases from 10.4% of Ti75Fe19Sn5Mo1 alloy to 2.2% of the Ti75Fe15Sn5Mo5 alloy, which indicates that the volume fraction of TiFe phase decreases with the increase of Mo content. In fact, the volume fraction of TiFe phase in the Ti75Fe19Sn5Mo1 alloy is less than that of TiFe phase in Ti75Fe20Sn5 alloy (11.31%) [11], which indicates the increase of Mo content and the decrease of Fe content resulting in less volume fraction of TiFe phase. The Rietveld method was used to calculate the volume fractions (VR) of three phases to show the accuracy of phase volume fraction calculated in Ref. [11]. For the Ti75Fe19Sn5Mo1 alloy, the VR values of β-Ti, α-Ti and TiFe phases are 43.92%, 47.66%, and 8.42%, respectively; for the Ti75Fe17Sn5Mo3 alloy, the corresponding VR values of three phases are 59.67%, 33.42%, and 7.91%, respectively; for the Ti75Fe15Sn5Mo5 alloy, the VR values of three phases are 39.30%, 57.56%, and 3.14%, respectively. Therefore, the volume fractions of the three phases calculated by Equations (3) and (4) are close to the VR values that were calculated by the Rietveld method.
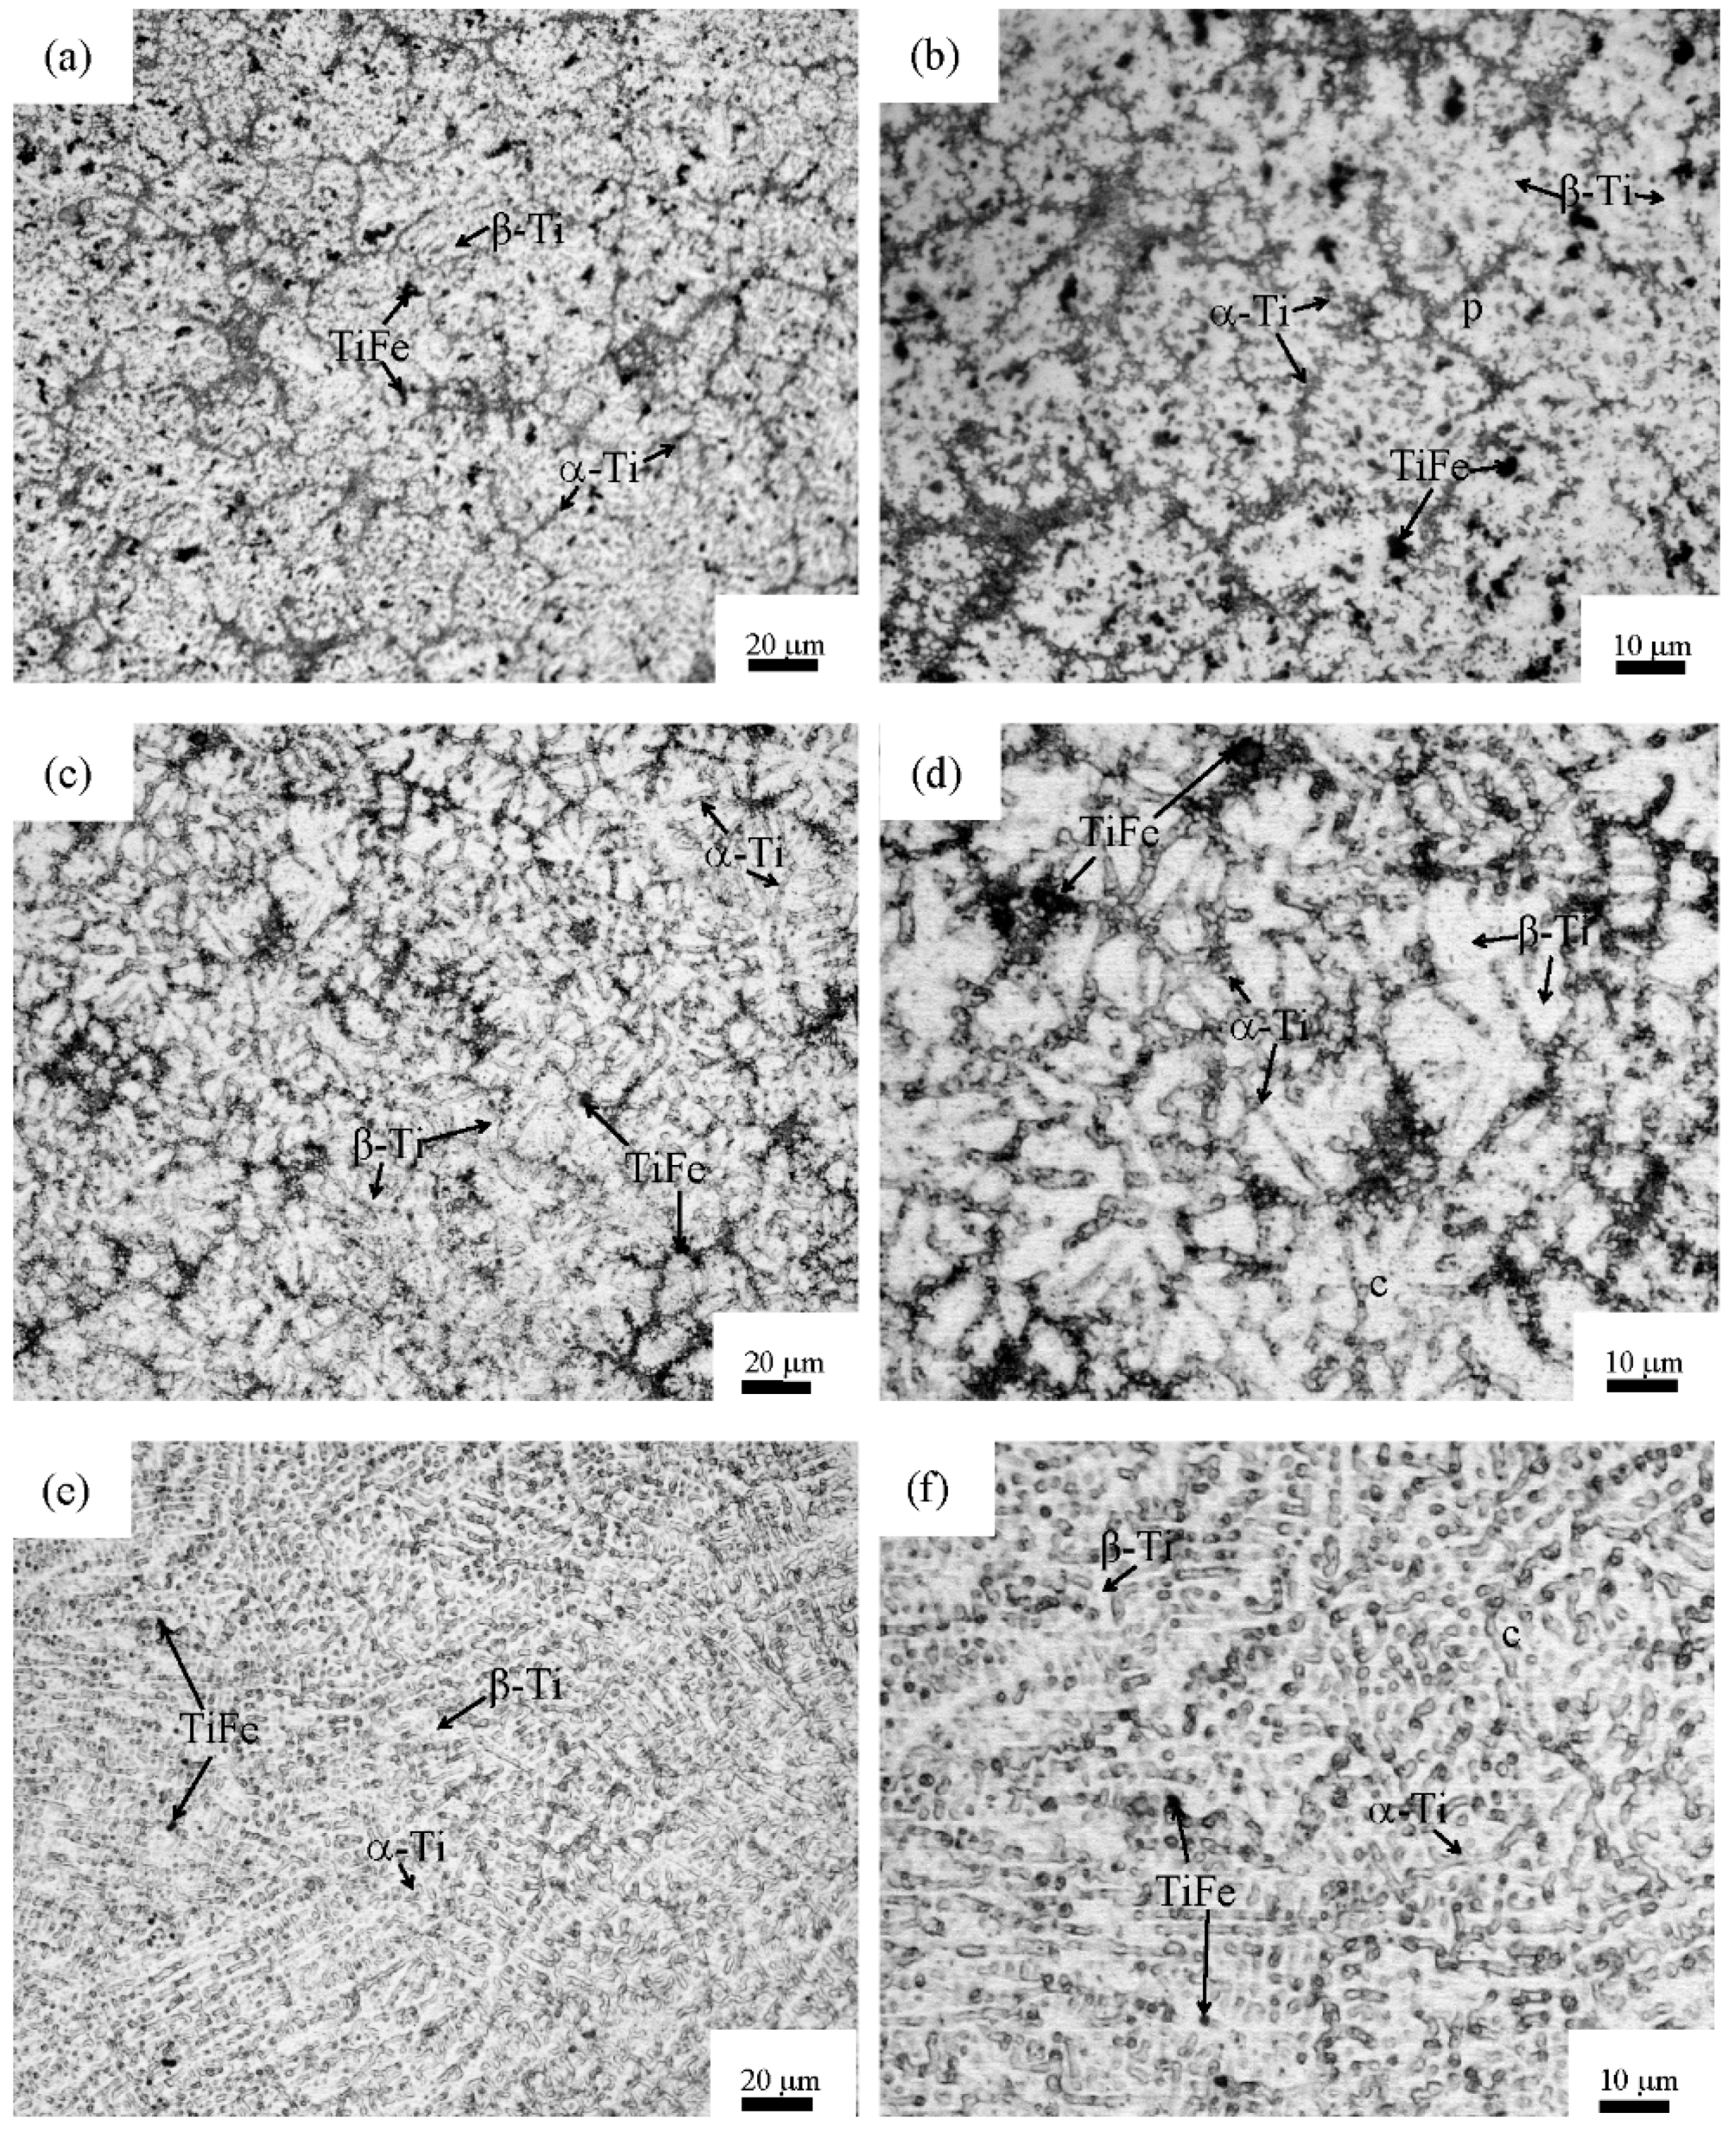
Figure 2 shows the microstructure of the Ti–Fe–Sn–Mo alloys. In Figure 2a,b, for the Ti75Fe19Sn5Mo1 alloy, a large number of α-Ti phases and a small amount of TiFe phases are deposited along the grain boundary, and the part of the α-Ti phase is formed inside the β-Ti phase particles. In Figure 2a,b, the contents of α-Ti phase and β-Ti phase have little difference, which is in good agreement with the volume fraction that was calculated by XRD. For the Ti75Fe17Sn5Mo3 alloy, the content of β-Ti phase is obviously higher than that of α-Ti phase, as shown in Figure 2c,d, which is in good agreement with the volume difference of the two phases that were calculated by XRD in Table 1; in addition, a large number of α-Ti phases are mainly deposited along grain boundary. In fact, the contents of α-Ti phase deposited inside the β-Ti phase particles in Figure 2d are obviously lower than those of α-Ti phase deposited inside β-Ti phase particles in Figure 2b. The particle sizes of a small amount of TiFe phases for the Ti75Fe17Sn5Mo3 alloy are obviously larger than those of the TiFe phases for the Ti75Fe19Sn5Mo1 alloy, as shown in Figure 2b,d, but the numbers of particles of the TiFe phases in the former are significantly less than those of the TiFe phases in the latter. As a result, the difference of content of TiFe phase between the two alloys is small, which is consistent with the small difference of volume fraction calculated by XRD in Table 1. With a further increase in Mo content and a further decrease in Fe content, for the Ti75Fe15Sn5Mo5 alloy, only two particles of TiFe phase labeled with the black arrow in Figure 2e,f can be observed. Its content is obviously smaller than that of TiFe phase in Figure 2b,e, which is also consistent with the small volume fraction of the TiFe phase that was calculated by XRD in Table 1. The content of β-Ti phase in Ti75Fe15Sn5Mo5 alloy is obviously lower than those in Ti75Fe19Sn5Mo1 and Ti75Fe17Sn5Mo3 alloys, and the content of α-Ti phase in Ti75Fe15Sn5Mo5 alloy is higher than that in Ti75Fe19Sn5Mo1 and Ti75Fe17Sn5Mo3 alloys, as shown in Figure 2b,d,f. Accordingly, these results are consistent with the calculated data in Table 1.
At the grain boundary, the α-Ti phases of the Ti75Fe19Sn5Mo1 alloy in Figure 2b form the structure of continuous layers; however, in addition to the continuous layer, the discontinuous layers in Ti75Fe17Sn5Mo3 alloy are also found in Figure 2d, which indicated that the continuity of the α-Ti phase are weakened when comparing with the continuous layers in Ti75Fe19Sn5Mo1 alloy. The continuity of the α-Ti phase for the Ti75Fe15Sn5Mo5 alloy almost disappears in Figure 2f. A large number of discontinuous independent grains of the α-Ti phase can be observed in Figure 2f. The phenomenon can be explained by using the grain boundary wetting [27,28]. In the reported Ti–Fe, Ti–Co, Ti–Fe–Sn alloys, the continuous and discontinuous layers that are composed of the α-Ti phases are the complete and non-complete wetting of the grain boundary [11,27,28], respectively. In Figure 2b, the continuous layer that is formed by a large number of α-Ti phases at the boundary is the complete wetting of the gain boundary, as shown in the letter P in Figure 2b. In Figure 2d, the continuous and discontinuous layers observed are the phenomenon of the complete and incomplete wetting of grain boundary. A large number of discontinuous layer of α-Ti phases show a structural of incomplete wetting, as shown in the letter C in Figure 2f. Accordingly, adding tge Mo element can change the complete and incomplete wetting of grain boundary.
The content of TiFe phase can be qualitatively discussed by heat of mixing (ΔHx) between mail elements. Table 2 lists the ΔHx values among the four elements. As the large negative heat of mixing between atom pairs indicates that the interaction force of atom pairs is larger, it can promote the formation of stable intermetallic compound. However, the small negative heat of mixing or large positive heat of mixing indicates that the interaction force of atom pair is weak. The melt that is composed of two elements is easy to form solid solution during cooling. The ΔHx values of Ti–Fe (−17 kJ mol−1 [29]) and Ti–Sn (−21 kJ mol−1 [29]) atom pairs are larger than those of the Ti–Mo (−4 kJ mol−1 [29]) and Fe–Mo (−2 kJ mol−1 [29]) atomic pairs, which indicates that the interaction forces of Ti–Fe and Ti–Sn atom pairs are larger than those of the Ti–Mo and Fe–Mo atomic pairs. The melt containing Ti–Mo and Fe–Mo clusters can form solid solution during cooling. In addition, the interaction forces of Fe–Sn and Mo–Sn atom pairs are weak, and the solid solution is easy to form in the alloy solution during the cooling due to the positive heat of mixing of Fe–Sn and Sn–Mo atom pairs (see Table 1). Therefore, when a small amount of Mo element replaces Fe element, no intermetallic compound containing Mo element can form. The addition of Mo changes the concentration of clusters containing Fe in alloy solution, which results the content of TiFe intermetallics decreasing. In addition, the more the Mo content is, the less the TiFe phase intermetallic compounds precipitate. This is consistent with the volume fraction that was calculated by XRD.
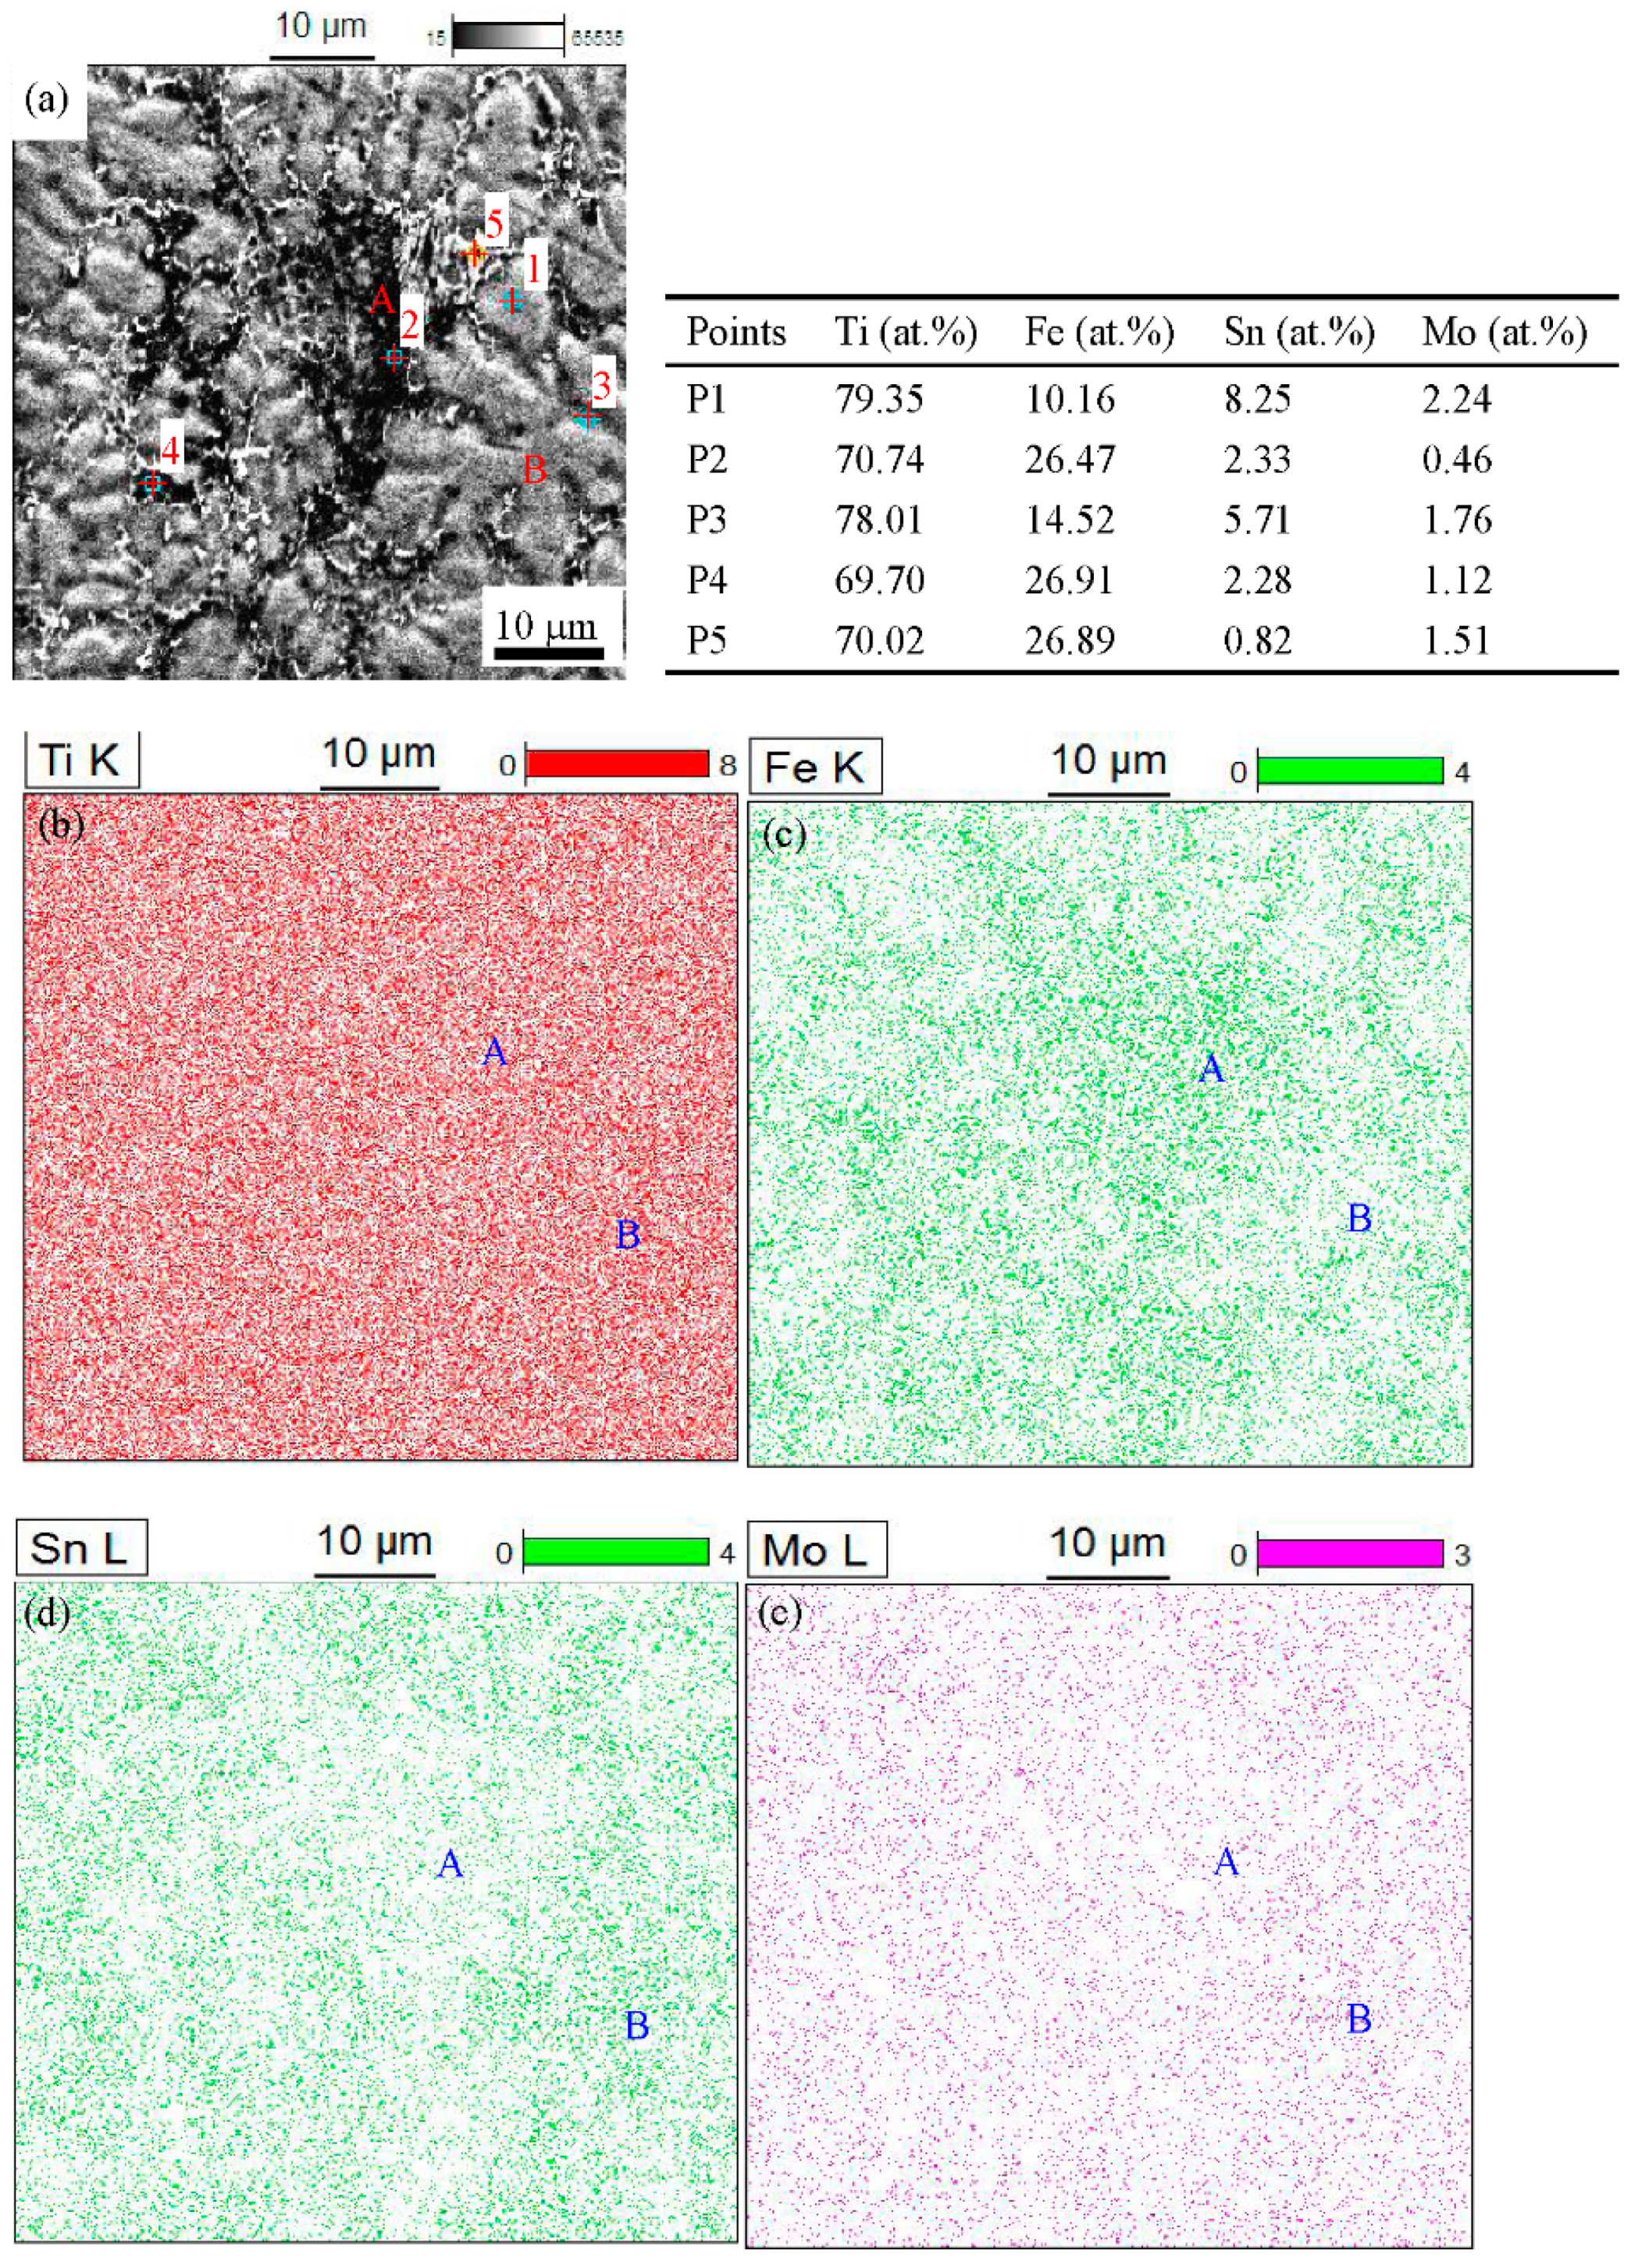
Figure 3 shows the SEM picture, element content at each point scanning, and surface distribution of elements at surface scanning in Ti75Fe19Sn5Mo1 alloy. In Figure 3a, five dot scanned images are marked as P1, P2, P3, P4, and P5, respectively. The percentages of four elements of five spots are shown in the right border of Figure 3a. The region that is labeled P1 is the middle part of a complete grain. The composition of the grain is Ti79.35Fe10.16Sn8.25Mo2.24. In fact, the grain in the region labeled P1 is a particle mainly containing the β-Ti phase in Figure 2a,b; for the particle containing Ti phase, according to EDS analysis, the contents of Ti, Sn, and Mo elements are larger than those of Ti, Sn, and Mo elements in Ti75Fe19Sn5Mo1 nominal component. When point scanning was carried out at the boundary of β-Ti particles (P3), it is found that the Ti (78.01 at.%), Sn (5.71 at.%), and Mo (1.76 at.%) contents in the region labeled P3 are lower than the corresponding contents in region labeled P1, but the Fe content (P3) is larger than that (P1). The results show that the content of Fe in the grain is less, while the content of Fe increases near the grain boundary, and the contents of Sn and Mo correspondingly decrease at the grain boundary. When point scanning was carried out at grain boundary (P2), the contents of Ti, Fe, Sn and Mo elements are 70.74 at.%, 26.47 at.%, 2.33 at.%, and 0.46 at.%, respectively. It is found that the contents of Ti, Sn, and Mo at the P2 region were significantly smaller than those at the P1 and P3 regions, while the contents of Fe at the P2 region are significantly larger than those at the P1 and P3 regions. According to Figure 2a,b, the larger black particles at the boundary are TiFe phase, and TiFe phase deposits along the grain boundary. In fact, it is impossible for the quantitative analysis of elements in the region labeled P2 point to achieve or close to one-to-one atomic ratio of Ti and Fe for the TiFe phase, as the accuracy of quantitative analysis for the elements by point scanning of EDS is low. The point scanning of the regions labeled P4 and P5 at grain boundaries was carried out to better determine the enrichment of Fe elements at grain boundaries. The Ti and Fe contents at regions labeled P4 and P5 slightly differ. At the region labeled P5, Sn content is significantly lower than that at regions of grain boundary labeled P2, and also lower that that at the region of grain interior labeled P1. When the Sn-rich region appears at region labeled P1, the Sn-poor region will inevitably appear around it to reach the equilibrium state of Sn content for the whole alloy. Five-point scanning shows that the Sn content is low when the Fe content is high. This is because the heat of mixing of Fe and Sn is positive. In the process of melt cooling, the repulsion force of Fe and Sn atoms is larger than the attraction force, which results in the diffusion of Fe and Sn atoms in the opposite direction.
Figure 3a is scanned in a plane to observe the difference between Fe- and Sn-rich regions more directly. The distribution of four elements is shown in Figure 3b–e. As the alloy is Ti-rich alloy, there is no obvious difference in the distribution of Ti element in the whole region, while the other three elements show the Fe-, Sn-, and Mo-rich regions, and Fe, Sn, and Mo-poor regions. In Figure 3a, the regions labeled A and B are selected. The large particle containing TiFe phase locates in A region, and the large particle containing Ti phase locates in B region. In Figure 3c, the Fe content in A region is significantly larger than that in B region. In Figure 3d, the Sn content in A region is significantly lower than that in the B region. Therefore, most Sn and Mo elements are in Ti-containing particles, respectively. The attraction between Ti and Sn atomic pairs is larger than the repulsion, as the heat of mixing of Ti and Sn is −21 kJ mol−1 [29], so the cluster containing the Ti–Sn atomic pair is easy to form. The mutual repulsion force between Fe and Sn is larger than the mutual attraction because of the positive heat of mixing of Sn and Fe, which leads to the decrease of Fe content in the Sn-rich region. Because the heat of mixing of Ti and Fe atomic pair is −17 kJ mol−1 [29], the binding force of Ti and Fe atoms is larger than the repulsion force of Ti–Fe atom pair, which leads to the formation of clusters containing Ti–Fe atomic pair; in this region, the content of Sn is less. Therefore, TiFe phases in Fe-rich regions and Ti phases in Sn-rich regions are formed in different regions. Although Ti content higher, the Sn content is less, so the Ti3Sn phase is difficult to form. The atomic ratio of Ti to Fe is located in hypoeutectic region, and the high Fe content results in the deposition of TiFe phase along the grain boundary of Ti phase.
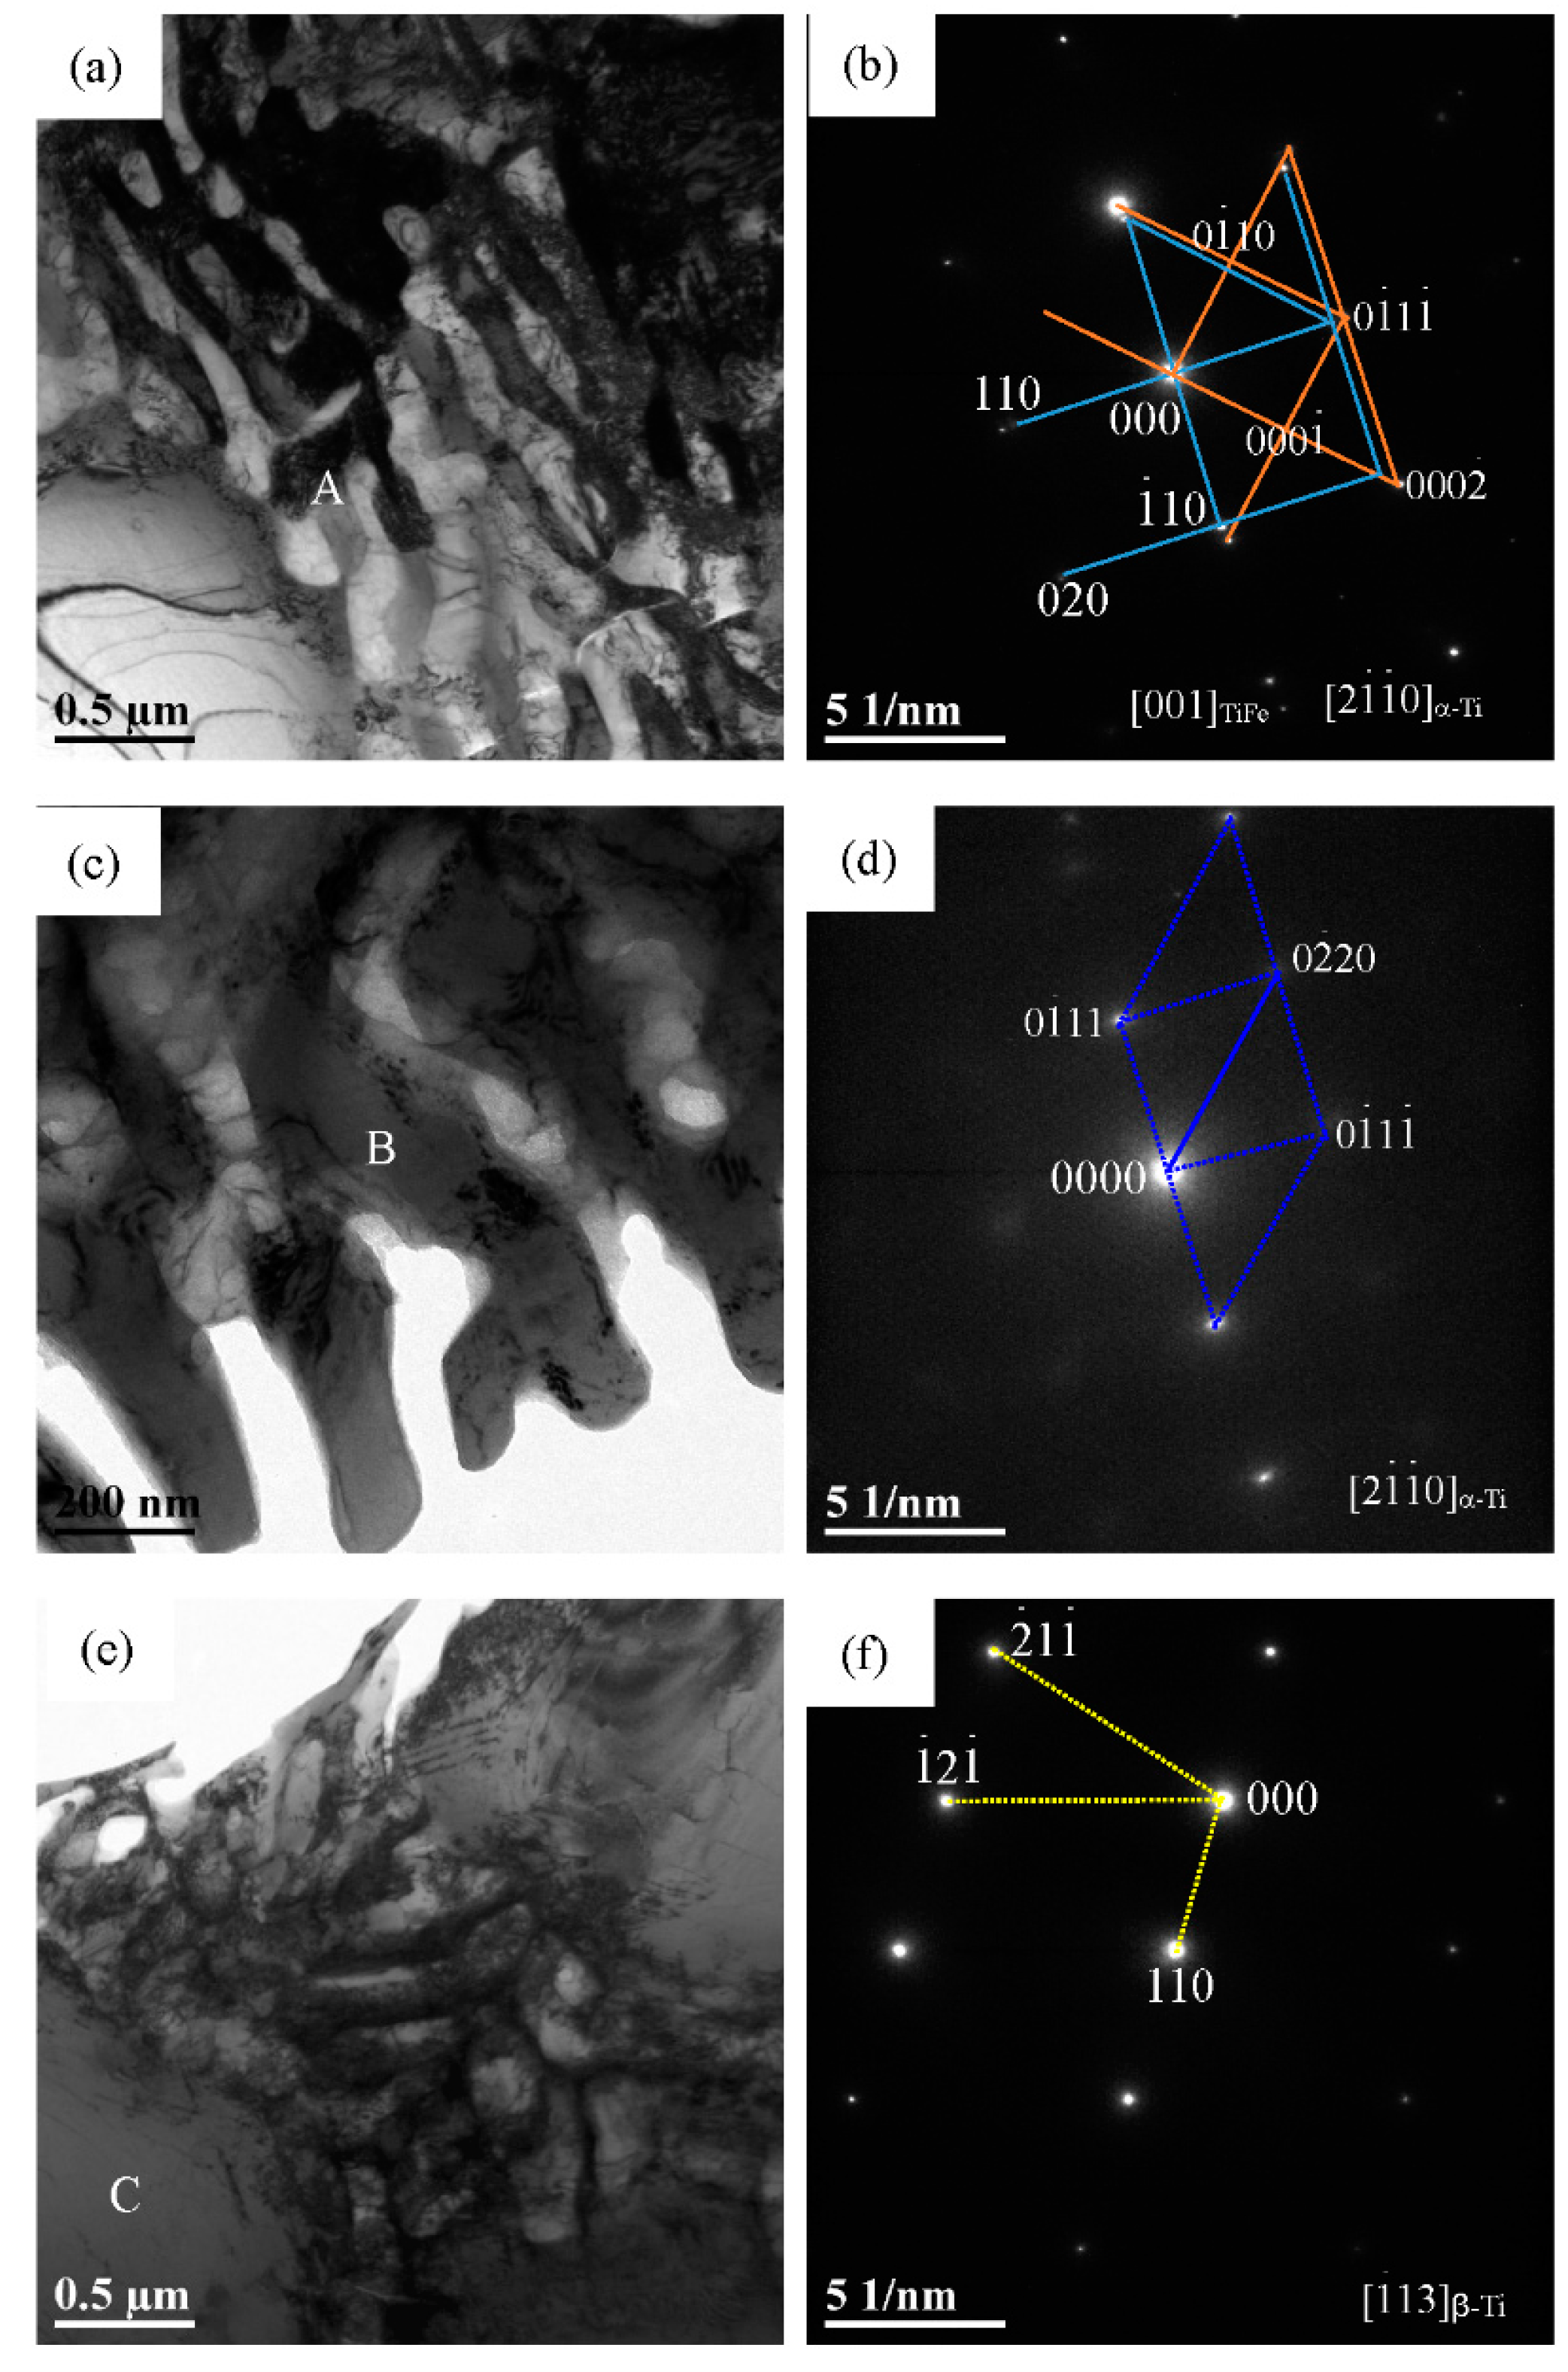
The microstructure of Ti75Fe19Sn5Mo1 alloy was observed by TEM to further understand of the microstructure and phase composition of the Ti–Fe–Sn–Mo alloys, as shown in Figure 4. Figure 4a,c show the stripe grain with a width between 0.1 µm and 0.2 µm and the black massive grains. The selected electron diffraction spots of the strip grains calibrate the diffraction spots that were obtained. Combining with the analysis of phases in XRD, the gray stripe grain is α-Ti phase, and the black block grain is TiFe phase, as shown in Figure 4a,c. The diffraction spots of Figure 4b come from the labeled “A” region in Figure 3a, the calibrated crystal band axis of the α-Ti phase is [2 1 ¯ 1 ¯ 0], the crystal planes (000 1 ¯ ), (0 1 ¯ 10), and (0 1 ¯ 1 1 ¯ ) are also marked in Figure 4b, respectively. In addition, the crystal band axis of TiFe phase with BCC structure is [001], and the three corresponding crystal planes are (110), ( 1 ¯ 10), and (020), respectively. The diffraction spots in Figure 4d are derived from the electron diffraction in the “B” region marked in Figure 4c to better display the diffraction of gray striped α-Ti grain, and the crystal band axis and the corresponding diffraction plane are also the same as the diffraction spots of the corresponding α-Ti phase in Figure 4b. In Figure 4f, the diffraction spots of BCC β-Ti phase are electron diffraction in Figure 4e. The crystal band axis of the β-Ti phase is [ 1 ¯ 13], and the three corresponding diffraction planes of (110), ( 2 ¯ 1 1 ¯ ), and ( 1 ¯ 2 1 ¯ ) is also labeled in Figure 4f, respectively.

3.2. Mechanical Properties of Ti–Fe–Sn–Mo Alloys

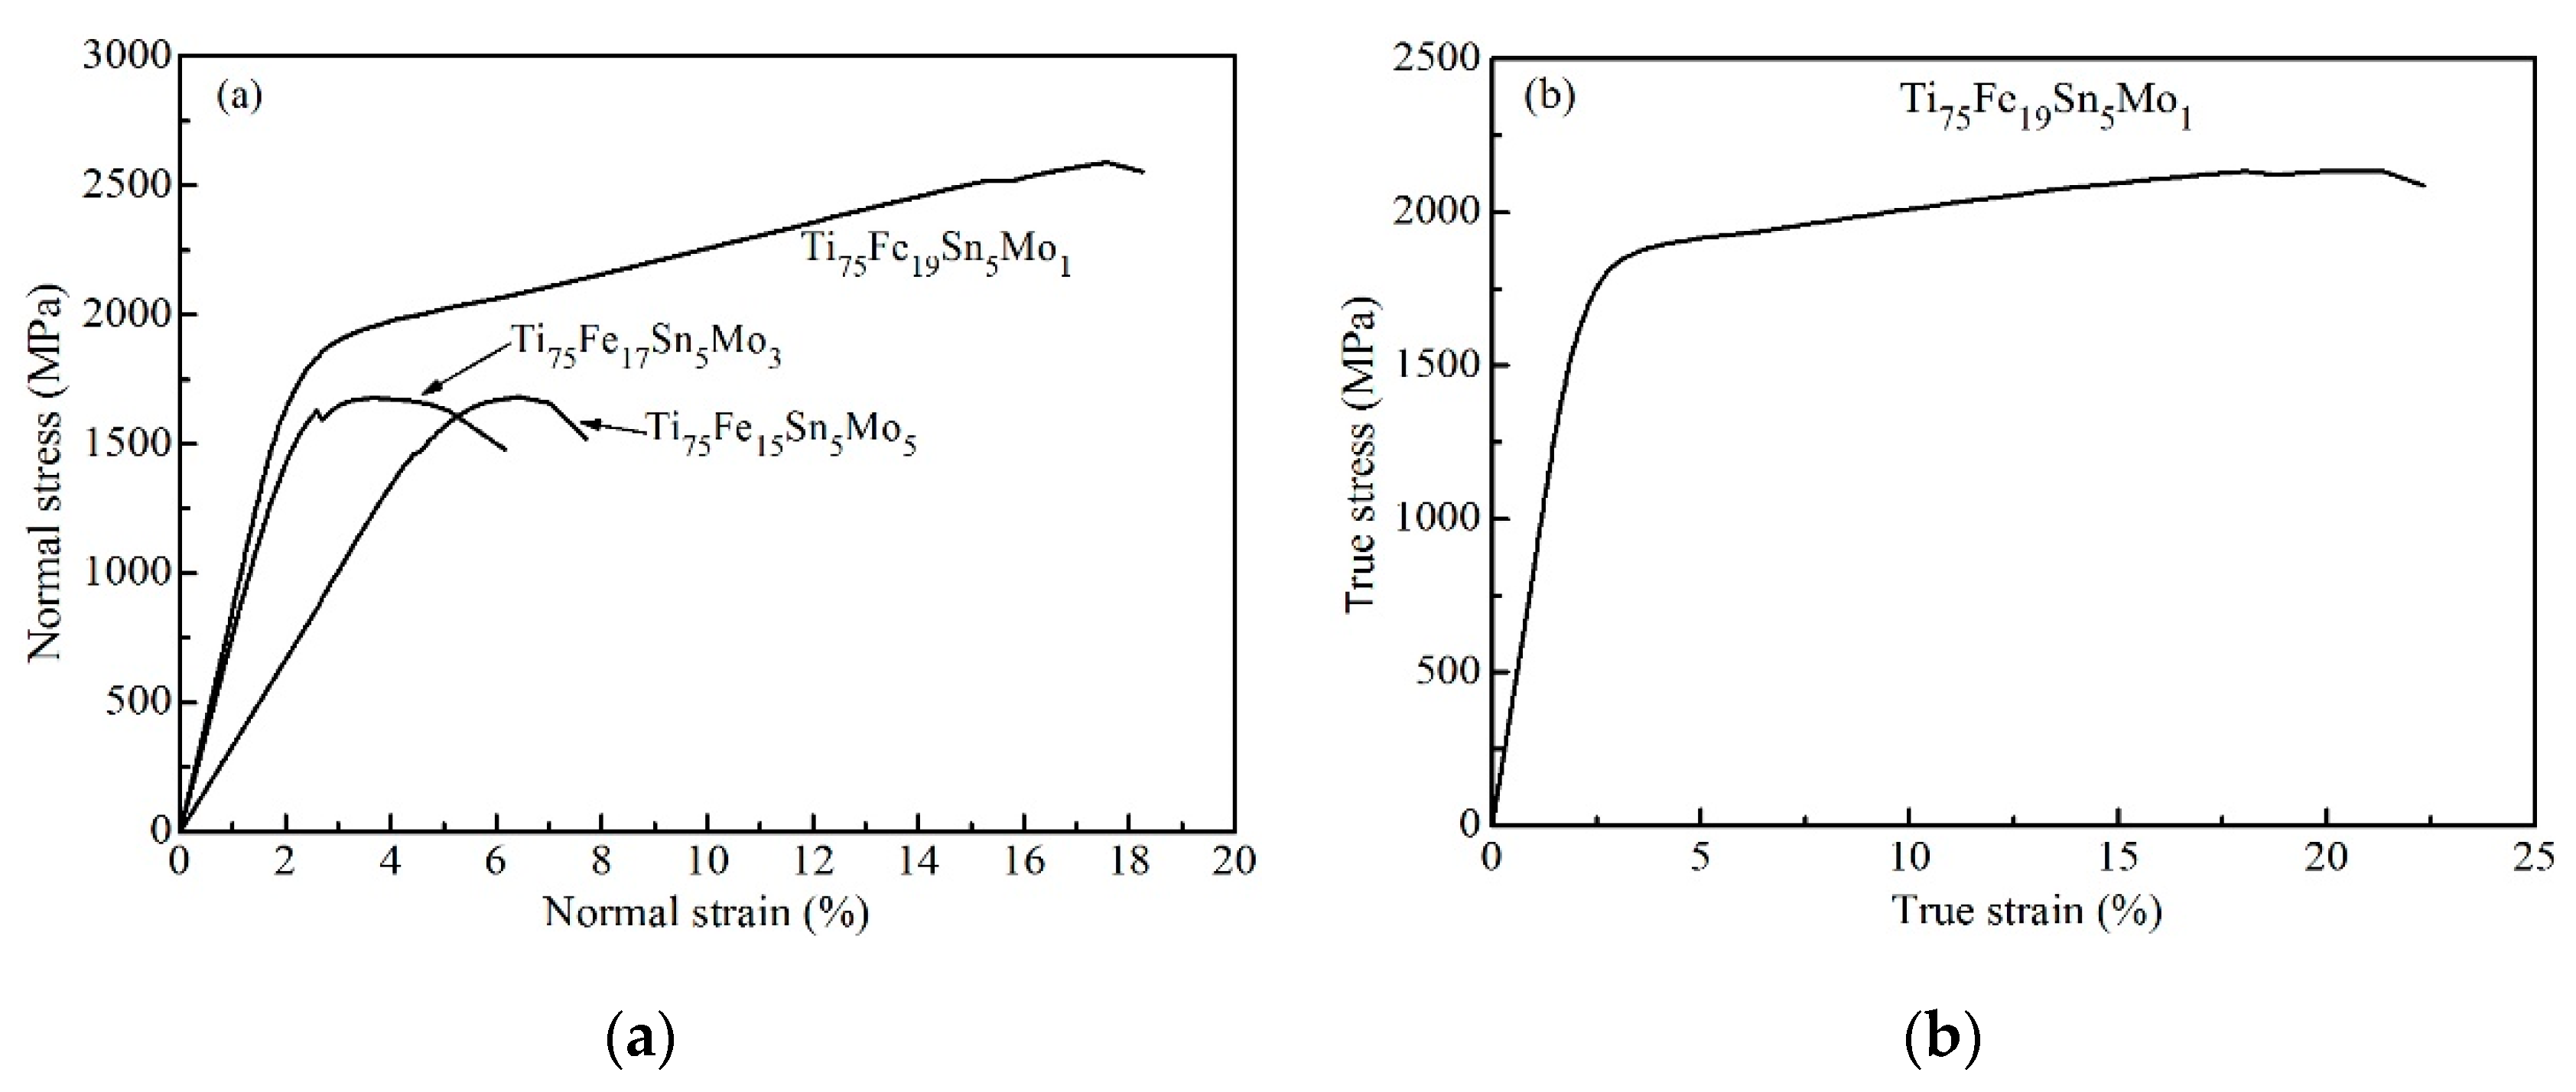
Figure 5 shows the stress-strain curves of the Ti–Fe–Sn–Mo alloys. Table 1 lists the mechanical data calculated by Figure 5a. The results show that the linear elastic limit (σe) and the 0.2% offset yield strength (σ0.2) of the Ti75Fe19Sn5Mo1 alloy are 1502 MPa and 1734 MPa, respectively, which are larger than those of the Ti75Fe17Sn5Mo3 and Ti75Fe15Sn5Mo5 alloys in Table 1. The plastic deformation (εp) of the Ti75Fe19Sn5Mo1 alloy is 16.1%, which is larger than those of Ti75Fe17Sn5Mo3 and Ti75Fe15Sn5Mo5 alloys, and it is also larger than that of the Ti75Fe20Sn5 alloy (10.4%) [11]. In addition, the Ti75Fe19Sn5Mo1 alloy (2590 MPa) has the maximum compressive strength (σb) in the present Ti–Fe–Sn–Mo alloys, which are also higher than that of Ti75Fe20Sn5 alloy (2332 MPa) [11]. In fact, the yield strength, plastic deformation, and maximum compressive strength of Ti75Fe19Sn5Mo1 alloy are the largest in the Ti–Fe–Sn–Mo and reported Ti–Fe–Sn alloys [11]. Accordingly, the addition of minor Mo element significantly improves the strength and plastic deformation of Ti75Fe20Sn5 alloy.
As the density of Mo element (10.22 g⋅cm−3) is larger than that of Fe element (7.86 g⋅cm−3), when the Mo element partially replaces the Fe element, the densities of Ti–Fe–Sn–Mo alloys increase with the increase of Mo content. The densities of Ti–Fe–Sn–Mo alloys are from the 5.475 g⋅cm−3 of Ti75Fe19Sn5Mo1 alloy to 5.624 g⋅cm−3 of Ti75Fe15Sn5Mo5 alloy. As an engineering material, the specific strength of Ti-rich Ti alloy has important practical significance in engineering applications. The specific yield strength (σ0.2/ρ) and specific compressive strength (σb/ρ) of the Ti75Fe19Sn5Mo1 alloy are 316.7 Pa⋅m3⋅g−1 and 473.1 Pa⋅m3⋅g−1, respectively, which are larger than those of the Ti75Fe20Sn5 alloy (308.53 Pa⋅m3⋅g−1 and 423.23 Pa⋅m3⋅g−1, respectively) [11], and they are also larger than those of the Ti75Fe17Sn5Mo3 and Ti75Fe15Sn5Mo5 alloys (see Table 3). In addition, the Vickers hardness (HV) of Ti75Fe19Sn5Mo1 and Ti75Fe17Sn5Mo3 alloys are 590 HV and 571 HV, respectively, which are larger than those of Ti75Fe20Sn5 (558 HV) [11] and Ti75Fe15Sn5Mo5 alloys (534 HV) in Table 1. Accordingly, the addition of an appropriate Mo element can improve the specific strength and Vickers hardness of Ti75Fe20Sn5 alloy.
In quasi-static compression test, the elastic modulus (E) of alloys can be calculated according to the slope of stress-strain curve at the linear elastic stage. Table 1 lists the calculated E values of the three alloys. The E value of Ti75Fe19Sn5Mo1 alloy is 85.4 GPa, higher than those of Ti75Fe17Sn5Mo3 (74.0 GPa) and Ti75Fe15Sn5Mo5 (33.4 GPa) alloys, which indicates that the E values decreases with the increase of Mo content. In fact, the elastic modulus of the Ti75Fe15Sn5Mo5 alloy is very close to that of human bone (10–30 GPa) [8,9,30], indicating that the alloy is a good biomedical material. In fact, the E values for the Ti75Fe19Sn5Mo1 and Ti75Fe17Sn5Mo3 alloys are larger than that of the Ti75Fe20Sn5 alloy (35.5 GPa) [11]; the E value of Ti75Fe15Sn5Mo5 alloy is close to that of the Ti75Fe20Sn5 alloy.
In Figure 5, the Ti75Fe19Sn5Mo1 alloy exhibits work hardening during plastic deformation. The work–hardening index (n) can reflect the resistance of plastic deformation, and, the larger the resistance of plastic deformation is, the larger the n value is. The true stress–strain curve of Ti75Fe19Sn5Mo1 alloy is shown in Figure 5 to calculate the n value. According to the true stress, σ = k ε n , where, k is the strength coefficient and ε is the true strain. The formula of ln σ = ln k + n ln ε can be written to facilitate that calculation of the
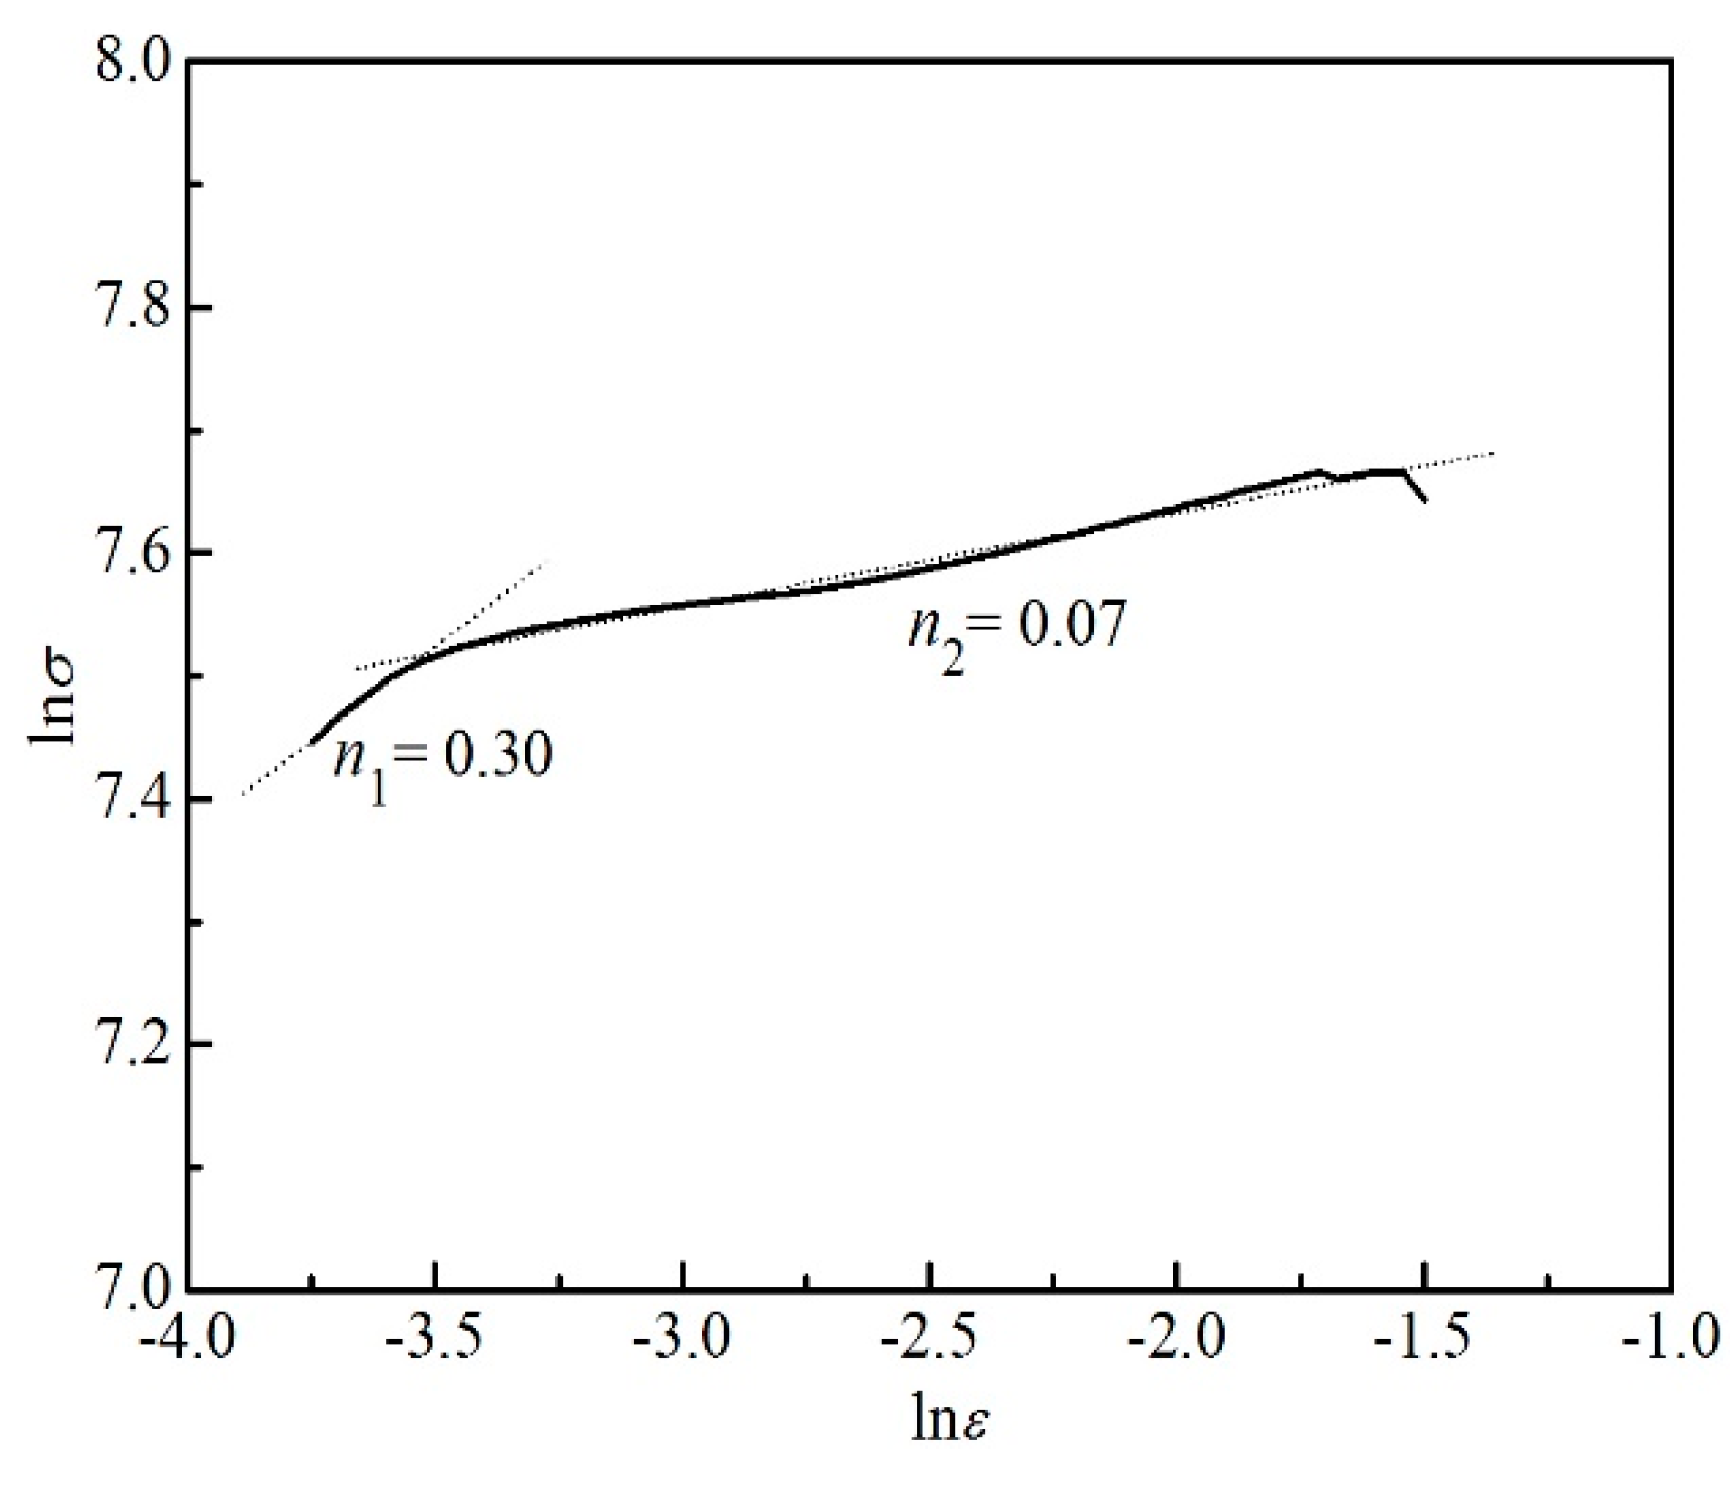
 n value. Figure 6 shows a graph of the relation between lnσ and lnε of the Ti75Fe19Sn5Mo1 alloy. The n1 value of elastic–plastic stage is 0.30 and the n2 value is equal to 0.07 in the stage of plastic deformation. In fact, the work–hardening ability of materials in the stage of plastic deformation is more meaning than that in elastic–plastic stage. The n2 value of the Ti75Fe19Sn5Mo1 alloy is less than those of the Zr52Co48 (0.15) and Zr54Co46 (0.09) alloys with the high ductility [31], which indicates that the Ti75Fe19Sn5Mo1 alloy has a small resistance of plastic deformation as compared to the high–ductility Zr–Co alloys [31]. However, the n2 value of the Ti75Fe19Sn5Mo1 alloy is larger than that of the Ti75Fe20Sn5 alloy (0.012), indicating that a small amount of Mo addition increases the plastic deformation resistance of the Ti75Fe20Sn5 alloy. In addition, For the Ti75Fe17Sn5Mo3 and Ti75Fe15Sn5Mo5 alloys, no work-hardening ability is present in the stage of plastic deformation. Accordingly, a proper amount of Mo content not only improves the strength and the plastic deformation, but also improves the work-hardening ability for the Ti75Fe20Sn5 alloy.

3.3. Elastic Energy and Toughness of Ti–Fe–Sn–Mo Alloys

The Ti alloy can be used not only as biomedical alloy, but also as engineering material. As a biomedical alloy, besides its low elastic modulus, it is necessary to calculate the elastic energy (We) of the alloy, and the larger the elastic energy is, the higher the safety is in the application of biomedical materials. Similarly, as engineering materials, the larger the static compression toughness is, the higher the safety of the material is in engineering application. In Figure 5, as the elastic strain of Ti75Fe15Sn5Mo5 alloy exceeds 4%, the calculation method of elastic energy for the selected Ti75Fe15Sn5Mo5 alloy is shown in Figure 7. Table 1 lists the calculated We values of the three alloys. The We value of the Ti75Fe19Sn5Mo1 alloy is 13.36 × 10⁶ J⋅m−3, which is larger than that of the Ti75Fe17Sn5Mo3 alloy (10.16 × 10⁶ J⋅m−3), but less than that of the Ti75Fe15Sn5Mo5 alloy (30.30 × 10⁶ J⋅m−3). Although the We values of the Ti–Fe–Sn–Mo alloys are less than that of Ti75Fe20Sn5 alloy (67.7 × 10⁻⁶ J⋅m−3) [11], they are larger than those of Ti-11Nb-9Fe (7.1 × 10⁶ J⋅m−3) and Ti-6Al-4V (2.8 × 10⁶ J⋅m−3) biomedical alloys [30,32]. Therefore, the present Ti–Fe–Sn–Mo alloys can be used as a new biomedical alloys.
Figure 8 is a method for calculating the toughness (At) of Ti75Fe19Sn5Mo1 alloy at room temperature compression. Table 1 lists the calculated At values As the high strength and plastic deformation of Ti75Fe19Sn5Mo1 alloy, the toughness value of Ti75Fe19Sn5Mo1 alloy (383.14 × 10⁶ J m−3) is much larger than those of the Ti75Fe17Sn5Mo3 (82.14 × 10⁶ J m−3) and Ti75Fe15Sn5Mo5 (85.70 × 10⁶ J m−3) alloys. In addition, the At value of Ti75Fe19Sn5Mo1 alloy is larger than that of Ti75Fe20Sn5 alloy (258.66 × 10⁶ J m−3) [11]. Therefore, the appropriate addition of Mo element can improve the At value of Ti75Fe20Sn5 alloy and thus improve the safety in the application of engineering materials.

3.4. Fracture Morphology of Ti–Fe–Sn–Mo Alloys

Figure 9 shows the fracture morphology of Ti–Fe–Sn–Mo samples compressed at room temperature. A large area of ductile fracture is observed in Figure 9a for the fracture morphology of the Ti75Fe19Sn5Mo1 alloy. The formation of ductile region can absorb a large amount of plastic deformation work, which results in large plastic deformation in the process of compression. This is consistent with the large plastic deformation of the Ti75Fe19Sn5Mo1 alloy. In addition, cleavage fracture is also observed in Figure 9a, which is a macroscopic brittle fracture, and cleavage fracture generally occurs in body-centered cubic and closed packing hexagonal metal materials. The β-Ti and TiFe phases are body-centered cubic and the α-Ti phase is closed packing hexagonal, so cleavage fracture can be observed in the compressed fracture morphology, as shown in Figure 9c,e. The larger the area of cleavage fracture is, the less plastic work will be absorbed in plastic deformation, and the smaller the plastic deformation will be. In Figure 9c,e, the region of cleavage fracture is obviously larger than that of thee cleavage fracture in Figure 9a, indicating that the plastic works absorbed for the Ti75Fe17Sn5Mo3 and Ti75Fe15Sn5Mo5 alloys during compression are smaller than those for the Ti75Fe19Sn5Mo1 alloy. It results in the plastic deformation for the Ti75Fe17Sn5Mo3 and Ti75Fe15Sn5Mo5 alloys being smaller than while that for the Ti75Fe19Sn5Mo1 alloy. The results are consistent with the mechanical experimental data observed Table 1. In Figure 9b, a small amount of the intergranular fracture-type dimples are distributed; however, the intergranular fracture-type dimples are not observed in Figure 9d,f. The grain boundary can be easily damaged when the sample is subjected to compressive stress, as a small amount of TiFe phases precipitate along the grain boundary. The movement of dislocation in the grain boundary is affected by the grain boundary, which results in the stress concentration caused at the grain boundary. When the concentration stress reaches the grain boundary strength, the crack at the grain boundary leads to the formation of dimples of intergranular fracture. In addition, a large number of cleavage steps are observed in Figure 9d,f, which indicates that the fracture mechanism of Ti75Fe17Sn5Mo3 and Ti75Fe15Sn5Mo5 alloys is macroscopic brittle fracture; the cleavage steps are relatively few in Figure 9b, indicating that the fracture mechanism of Ti75Fe19Sn5Mo1 alloy is macroscopically plastic fracture.

3.5. Nanoindentation of Ti–Fe–Sn–Mo Alloys

The elastic modulus that is measured by the compression instrument might differ greatly from the real value due to the elastic deformation of the instrument in the quasi-compression process. To get closer to the true elastic modulus of materials, the reduced elastic modulus (Er) of three Ti–Fe–Sn–Mo alloys were measured by the nanoindentation technique. 
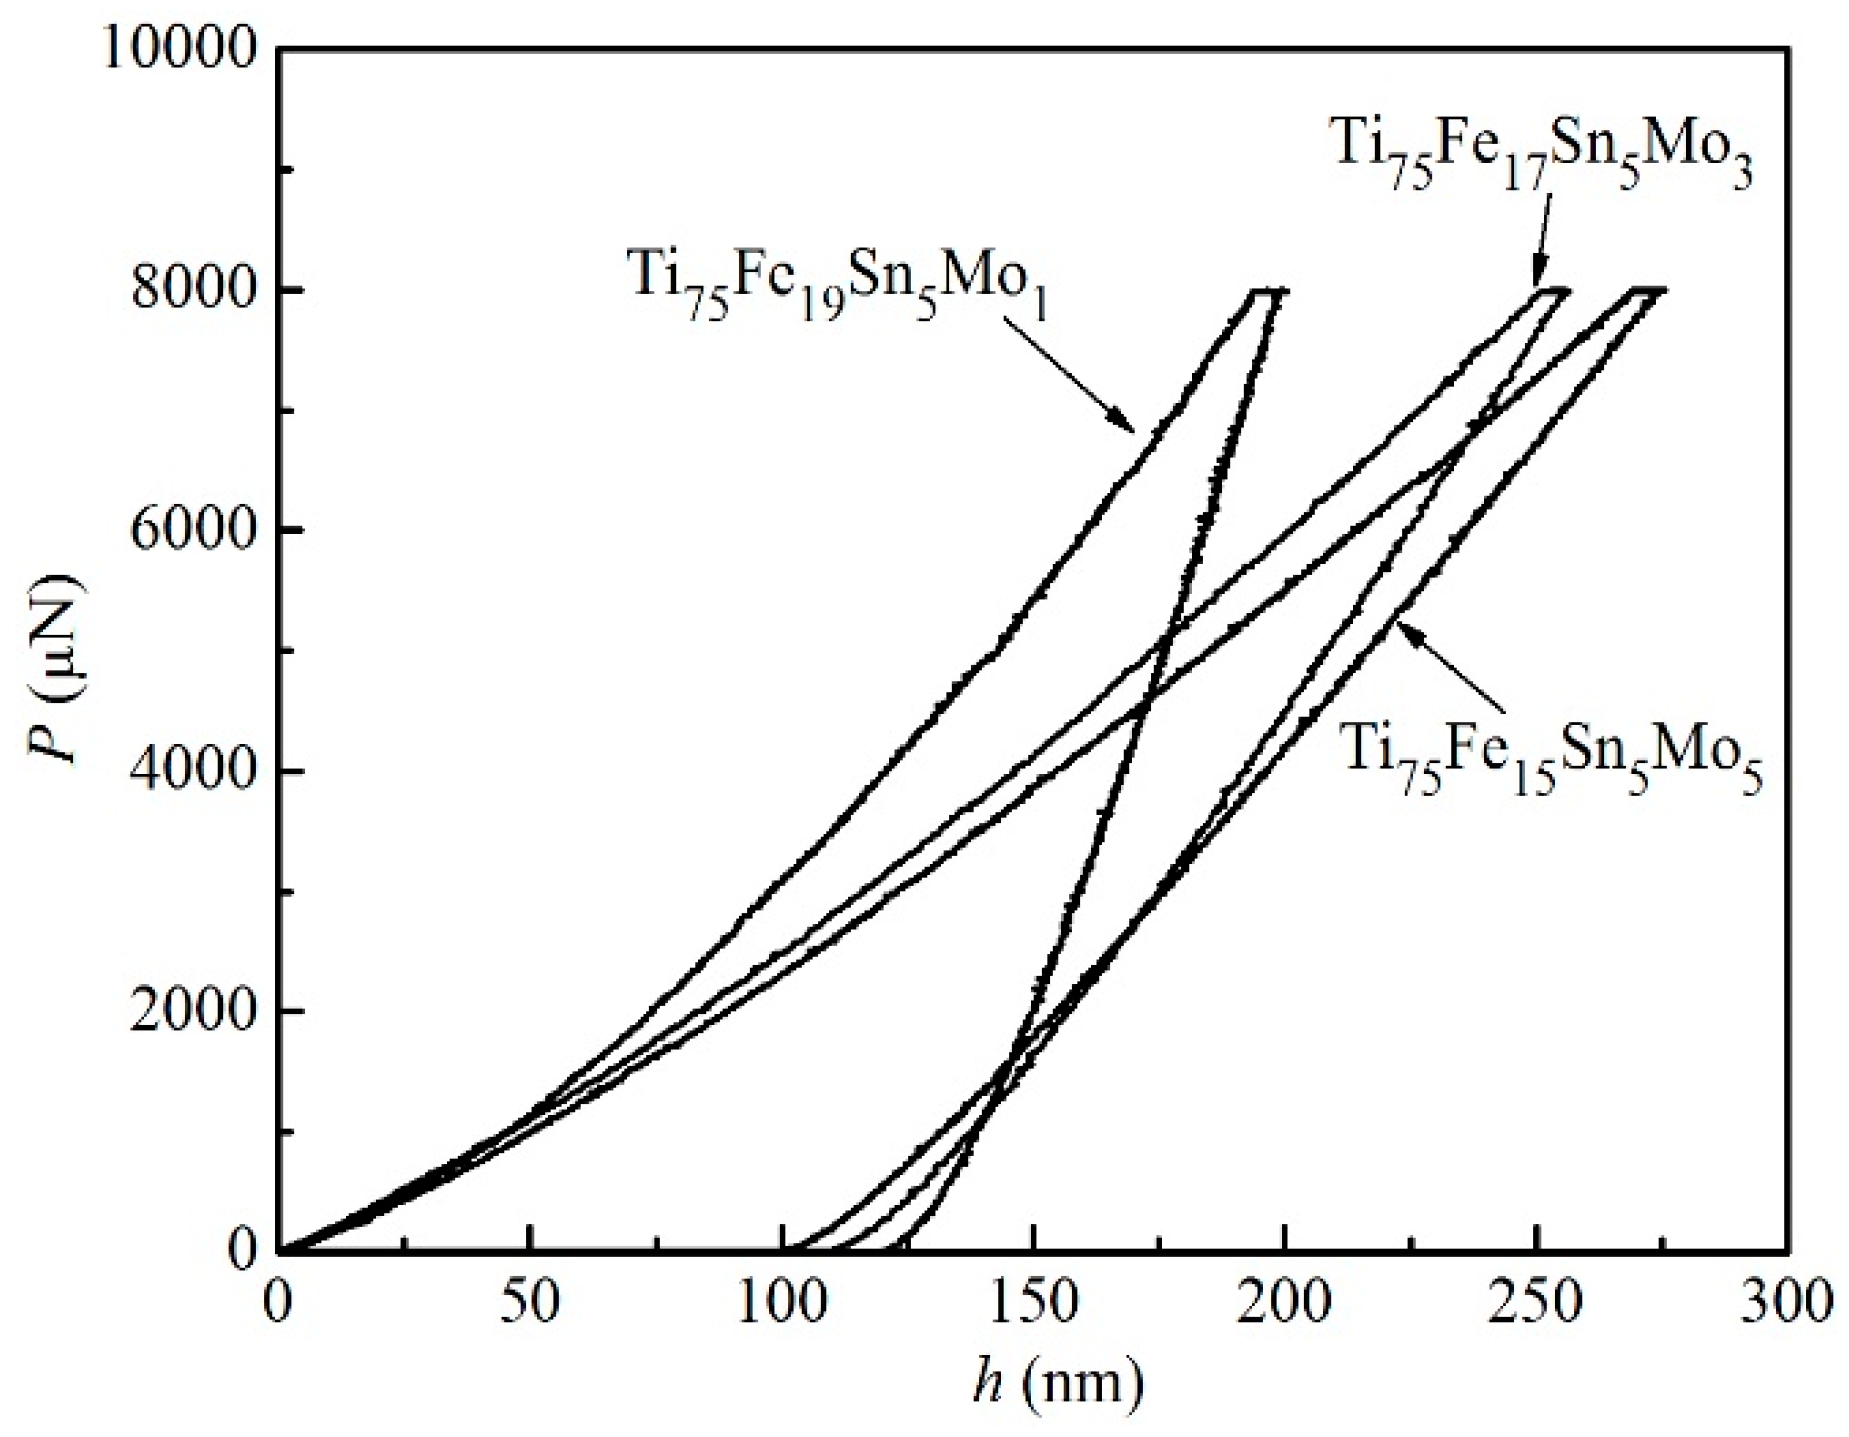
Figure 10 shows the representative load (P)-displacement (h) nanoindentation curves for the Ti–Fe–Sn–Mo alloys. The Er and hardness (H) values that were measured for the three alloys are listed in Table 3. The Er values of the Ti75Fe19Sn5Mo1, Ti75Fe17Sn5Mo3, and Ti75Fe15Sn5Mo5 alloys are 110.8 GPa, 51.1 GPa, and 42.1 GPa, respectively. The Er values of the Ti75Fe19Sn5Mo1 and Ti75Fe15Sn5Mo5 alloys are larger than the E values of two alloys in the quasi-static compression test, but the Er value of the Ti75Fe17Sn5Mo3 alloy is obviously lower than the E value in the quasi-static compression test. Accordingly, based on the elastic modulus that was measured by the two methods, the Ti75Fe19Sn5Mo1 alloy with a high specific strength has high elastic modulus, which indicates that the alloy is a new type of engineering material with excellent mechanical properties. The elastic modulus of Ti75Fe15Sn5Mo5 alloy is very close to the elastic modulus of human bone, indicating that the alloy can be used as a good biomedical alloy. The hardness value of Ti75Fe19Sn5Mo1 alloy is 6.84 GPa, higher than that of the Ti75Fe17Sn5Mo3 (6.24 GPa) and Ti75Fe15Sn5Mo5 (6.40 GPa) alloys, respectively. In fact, the H values of the three alloys are larger than that of the Ti75Fe20Sn5 alloy (5.00 GPa), which indicates that the addition of Mo element improves the hardness of the Ti75Fe20Sn5 alloys.
Wear behavior of engineering materials and hard tissue implant materials occurs during their application. The longer the service life of materials with good wear resistance is in use. The wear resistance of materials is not only related to the hardness, strength, and plasticity of materials, but also to the structure and environment of materials. When these wear-resistant experiments are completed, a lot of manpower, material resources, and experimental costs are needed. As a new material, some researchers have found that some parameters can qualitatively characterize the wear resistance of materials, thus saving manpower, material resources and experimental costs for the selection of wear resistant materials. The parameter H/Er can characterize the wear resistance of materials based on the measured Er and H values [33]. The greater the H/Er value is, the better wear resistance of materials is, and the longer the corresponding service life is [33]. However, the Ti75Fe15Sn5Mo5 alloy has the highest H/Er value, being 0.152, which is larger than that of Ti75Fe20Sn5 alloy (0.149). In addition, the H/Er values of Ti75Fe19Sn5Nb1 and Ti75Fe17Sn5Mo3 alloys are 0.062 and 0.122, respectively, which are smaller than those of Ti75Fe15Sn5Mo5 and Ti75Fe20Sn5 alloys. The results show that the wear resistance and service life of the alloy can be improved by adding a suitable Mo element. In fact, the reported parameter H3/Er2 can also characterize the anti-wear ability of materials [34]. The H3/Er2 values increase from 0.026 GPa of Ti75Fe19Sn5Mo1 alloy to 0.148 GPa of Ti75Fe15Sn5Mo5 alloy. In particular, the H3/Er2 value of Ti75Fe15Sn5Mo5 alloy is larger than that of Ti75Fe20Sn5 alloy without Mo element, which indicates that the Ti75Fe15Sn5Mo5 alloy has good anti-wear ability and long service life. In fact, the H/Er and H3/Er2 values of Ti75Fe19Sn5Mo1 alloy with high strength and plasticity are larger than those of CP-Ti and biomedical Ti–Nb–Sn alloys [11,35], which indicates that the Ti75Fe19Sn5Mo1 alloy has good wear resistance and long service life as biomedical materials.
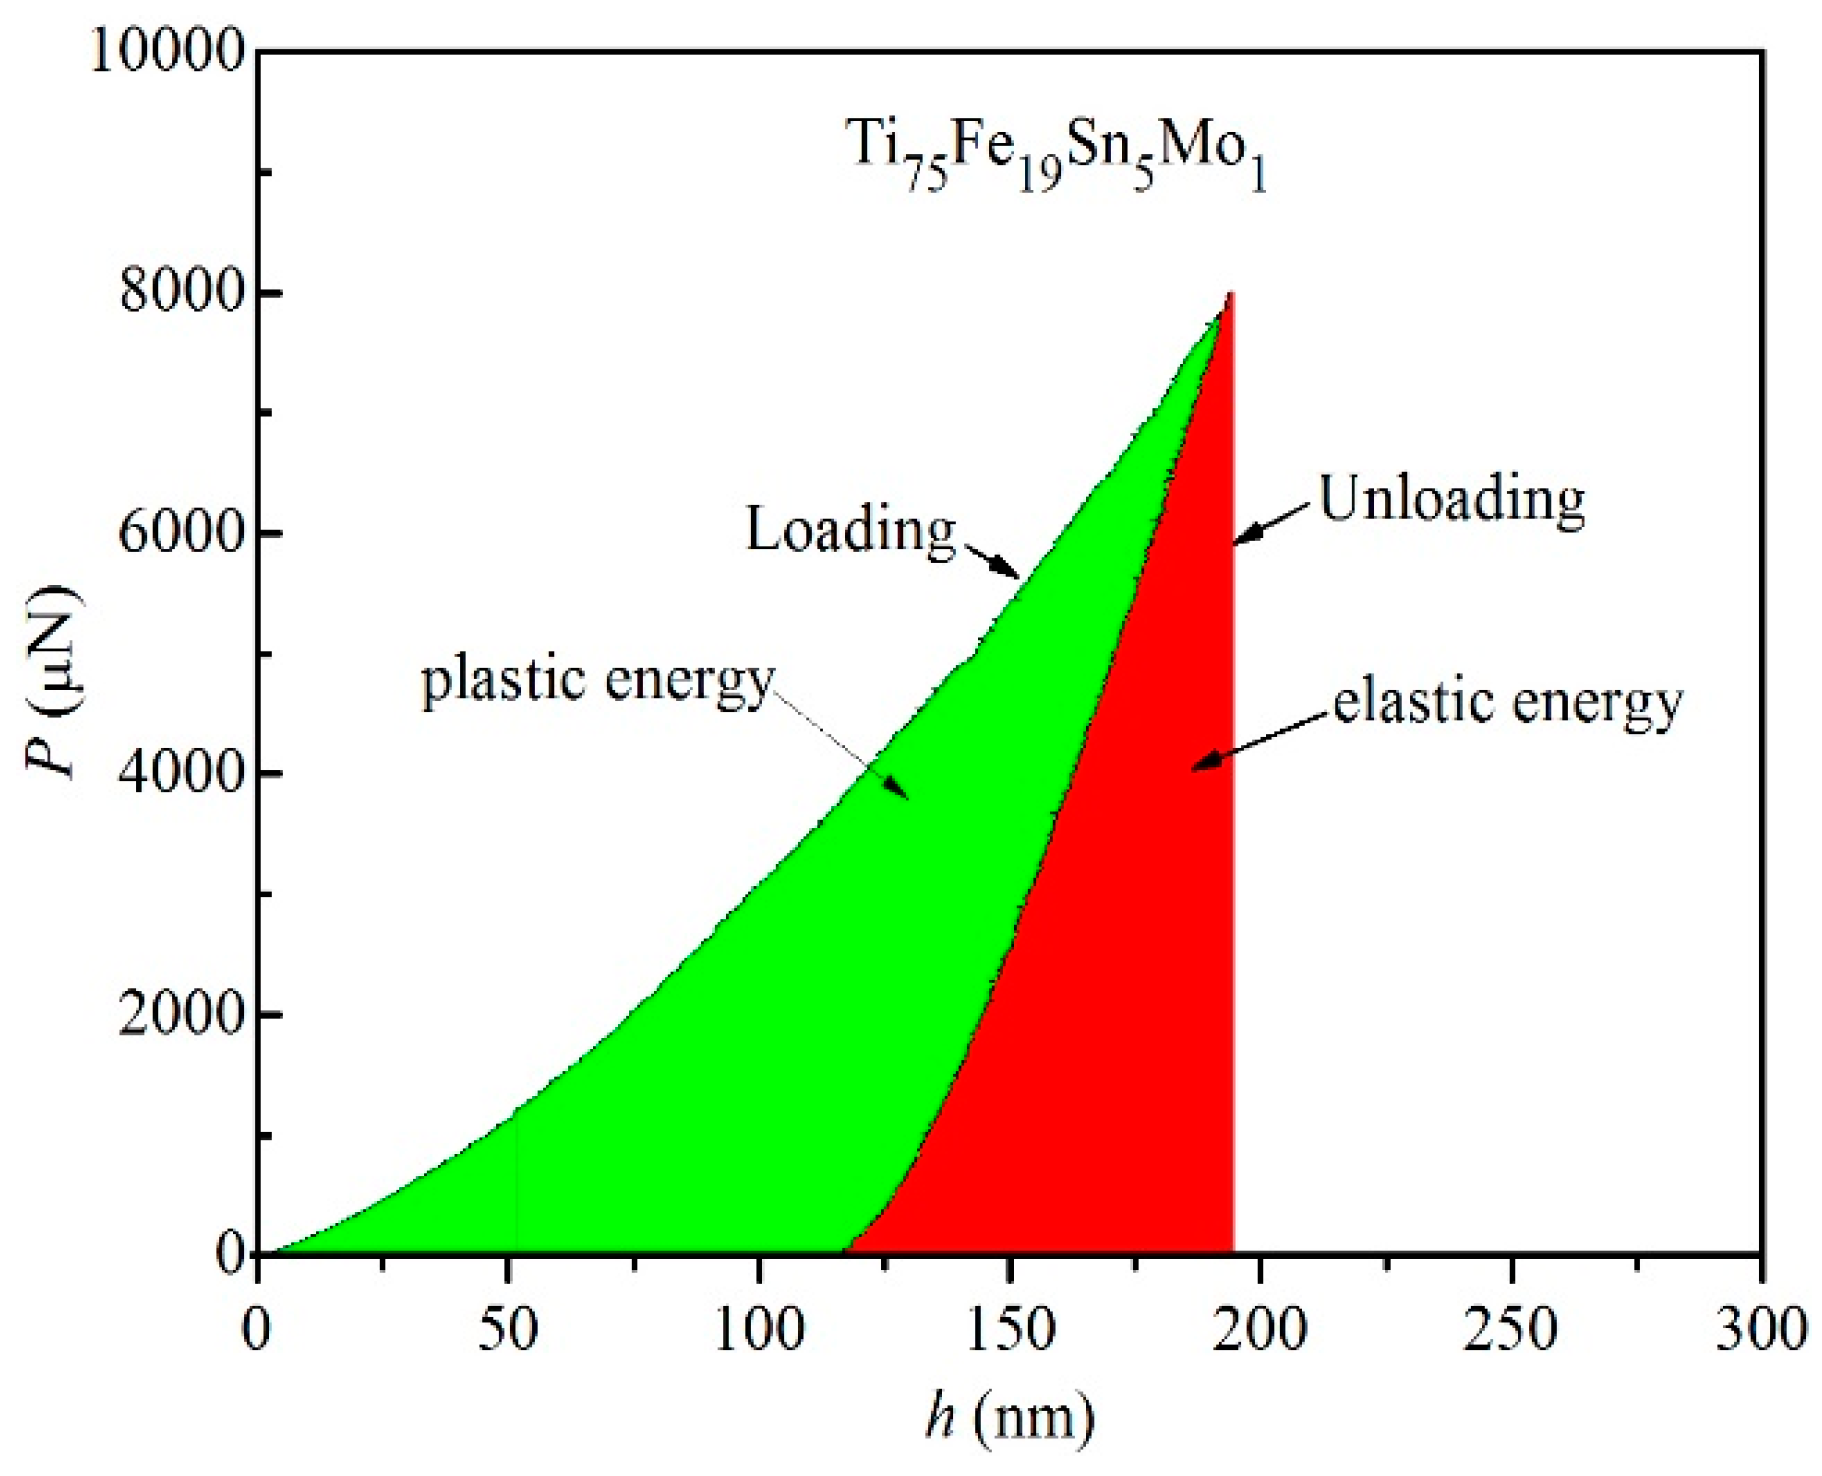
Figure 11 shows the loading-displacement curve of the Ti75Fe19Sn5Mo1 alloy, which is different from the nanoindentation curve in Figure 10. The displacement of the unloading curve in Figure 11 is obtained by using the displacement of the unloading curve subtracts the isobaric displacement to show the relationship between plastic and elastic energy. Based on the method in Figure 11, Table 3 lists the calculated elastic energy (Ue) and plastic energy (Up) of the three alloys. The Ue values increase from 26.71 × 10⁻¹¹ J⋅m−3 of the Ti75Fe19Sn5Mo1 alloy to 64.81 × 10⁻¹¹ J⋅m−3 of the Ti75Fe15Sn5Mo5 alloy; the Up values decrease from 36.61 × 10⁻¹¹ J⋅m−3 of Ti75Fe19Sn5Mo1 alloy to 32.24 × 10⁻¹¹ J⋅m−3 of the Ti75Fe15Sn5Mo5 alloy. The sum of elastic energy and plastic energy is equal to the work done by nano-indentation displacement during loading, that is, Ut = Ue + Up [35,36]. The elastic recovery parameter (Ue/Ut) can denote the resistance of materials under impact loading [33], and the plasticity index (Up/Ut) indicates the intrinsic plasticity of materials [33]. Table 3 lists the calculated Ue/Ut and Up/Ut values. The Ti75Fe15Sn5Mo5 alloy has the largest Ue/Ut value (67.5%), while the Ti75Fe19Sn5Mo1 alloy has the smallest Ue/Ut value (42.2%) in Table 3, indicating that the Ti75Fe15Sn5Mo5 alloy has the high resistance of impact loading, while the Ti75Fe19Sn5Mo1 alloy has the weak resistance of impact loading in the present Ti–Fe–Sn–Mo alloys. However, the Ue/Ut values of the Ti–Fe–Sn–Mo alloys are far larger than those of the Ti–Co–Zr alloys (<28.5%) and CP-Ti alloy (20.4%) [5,33], indicating that the three alloys have good impact resistance. The Up/Ut value of Ti75Fe19Sn5Mo1 alloy (57.8%) is larger than those of Ti75Fe17Sn5Mo3 (40.5%) and Ti75Fe15Sn5Mo5 (32.5%) alloys, which indicates that the Ti75Fe19Sn5Mo1 alloy has good intrinsic plasticity.

4. Conclusions

The microstructure and mechanical properties of rapidly solidified β-type Ti–Fe–Sn–Mo alloys with high specific strength and low elastic modulus were investigated, and the main conclusion are as follows,
(1)
The results show that the matrix phase of the Ti75Fe19Sn5Mo1 and Ti75Fe15Sn5Mo5 alloys is the α-Ti phase, and the second phases are the β-Ti and TiFe phases, while the matrix phase of the Ti75Fe17Sn5Mo5 alloy is the β-Ti phase, and the second phases are the α-Ti and TiFe phases. The volume fraction of TiFe phase decreases with the increase of Mo content. The high Fe content results in deposition along the grain boundary of Ti phase.
(2)
The Ti75Fe19Sn5Mo1 alloy exhibits the high yield strength (1734 MPa), maximum compressive strength (2590 MPa), large plastic deformation (16.1%), high specific yield and compressive strength (316.7 Pa⋅m3⋅g−1 and 473.1 Pa⋅m3⋅g−1), high Vickers hardness (590 HV), and large toughness value (383.14 × 10⁶ J⋅m−3), which is a superior new engineering material.
(3)
The elastic modulus (42.1 GPa) of the Ti75Fe15Sn5Mo5 alloy is very close to the elastic modulus of human bone (10–30 GPa), which indicates that the alloy can be used as a good biomedical alloy. In addition, the large H/Er and H3/Er2 values of Ti75Fe19Sn5Mo1 alloy indicates the good wear resistance and long service life as biomedical materials; the large Ue/Ut of three Ti–Fe–Sn–Mo alloys indicate good impact resistance.

Author Contributions

P.L., X.M. and Y.J. conceived and designed the experiments; P.L., X.M., Y.J., F.M. and L.T. performed the experiments, analyzed the data; P.L. wrote original draft preparation; P.L. and Z.H. wrote review and editing.

Funding

This research received no external funding.

Conflicts of Interest

The authors declare no conflict of interest.

References

  1. Lin, P.; Tang, T.T.; Chi, C.Z.; Zhang, S.Z.; Zhang, C.J. Dynamic globularization behavior of O-Phase lamellae in Ti-22Al-25Nb (at.%) alloy during deformation at elevated temperatures. Rare Met. Mater. Eng. 2018, 47, 416–422. [Google Scholar]
  2. Li, P.Y. Microstructural and mechanical properties of novel β-type Ti–Nb–Ni alloys containing a second phase. Int. J. Mater. Res. 2018, 109, 708–715. [Google Scholar] [CrossRef]
  3. Li, P.Y.; Ma, X.D.; Wang, D.; Zhang, H. Microstructural and mechanical properties of β-type Ti–Nb–Sn biomedical alloys with low elastic modulus. Metals 2019, 9, 712. [Google Scholar] [CrossRef]
  4. Cao, S.Z.; Xia, S.L.; Chen, Y.Y.; Xu, L.J.; Wang, X.P.; Han, J.C.; Jia, Y. Phase transformations of the L12-Ti3Al phase in γ-TiAl alloy. Mater. Des. 2017, 121, 61–68. [Google Scholar] [CrossRef]
  5. Li, P.Y. Microstructure and mechanical properties of novel β-type Ti–Co–Zr alloys with high specific strength. Mater. Res. Express 2019, 6, 076559. [Google Scholar] [CrossRef]
  6. Long, M.; Rack, H.J. Titanium alloys in total joint replacement—A materials science perspective. Biomaterials 1998, 19, 1621–1639. [Google Scholar] [CrossRef]
  7. Wang, K. The use of titanium for medical applications in the USA. Mater. Sci. Eng. A 1996, 213, 134–137. [Google Scholar] [CrossRef]
  8. Niinomi, M. Recent metallic materials for biomedical applications. Metall. Mater. Trans. A 2002, 33, 477–486. [Google Scholar] [CrossRef]
  9. Niinomi, M. Recent research and development in titanium alloys for biomedical applications and healthcare goods. Sci. Technol. Adv. Mater. 2003, 4, 445–454. [Google Scholar] [CrossRef] [Green Version]
  10. Hanada, S.; Masahashi, N.; Jung, T.K.; Yamada, N.; Yamako, G.; Itoi, E. Fabrication of a High-Performance hip prosthetic stem using β Ti-33.6Nb-4Sn. J. Mech. Behav. Biomed. Mater. 2014, 30, 140–149. [Google Scholar] [CrossRef]
  11. Li, P.Y.; Zhang, H.; Tong, T.; He, Z.R. The rapidly solidified β-type Ti–Fe–Sn alloys with high specific strength and low elastic modulus. J. Alloys Compds. 2019, 786, 986–994. [Google Scholar] [CrossRef]
  12. Zhao, G.H.; Ketov, S.V.; Jiang, J.; Mao, H.; Borgenstam, A.; Louzguine-Luzgin, D.V. New Beta-Type Ti–Fe–Sn–Nb alloys with superior mechanical strength. Mater. Sci. Eng. A 2017, 705, 348–351. [Google Scholar] [CrossRef]
  13. Haghighi, S.E.; Lu, H.B.; Jian, G.Y.; Cao, G.H.; Habibi, D.; Zhang, L.C. Effect of martensite on the microstructure and mechanical properties of beta-type Ti–Fe–Ta alloys. Mater. Des. 2015, 76, 47–54. [Google Scholar] [CrossRef]
  14. Pettan, G.C.; Afonso, C.R.; Spinelli, J.E. Microstructure development and mechanical properties of rapidly solidified Ti–Fe and Ti–Fe–Bi alloys. Mater. Des. 2015, 86, 221–229. [Google Scholar] [CrossRef]
  15. Das, J.; Kim, K.B.; Baier, F. High-Strength Ti-Base ultrafine eutectic with enhanced ductility. Appl. Phys. Lett. 2005, 87, 161907. [Google Scholar] [CrossRef]
  16. Louzguine, D.V.; Kato, H.; Inoue, A. High strength and ductile binary Ti–Fe composite alloy. J. Alloys Compd. 2004, 384, L1–L3. [Google Scholar] [CrossRef]
  17. Han, J.H.; Park, D.H.; Bang, C.W.; Yi, S.; Lee, W.H.; Kim, K.B. Sn effect on microstructure and mechanical properties of ultrafine eutectic Ti–Fe–Sn alloys. J. Alloys Compd. 2009, 483, 44–46. [Google Scholar] [CrossRef]
  18. Han, J.H.; Kim, K.B.; Yi, S.; Park, J.M.; Sohn, S.W.; Kim, T.E.; Kim, D.H.; Das, J.; Eckert, J. Formation of a bimodal eutectic structure in Ti–Fe–Sn alloys with enhanced plasticity. Appl. Phys. Lett. 2008, 93, 141901. [Google Scholar] [CrossRef]
  19. Cao, G.H.; Schneider, R.; Gerthsen, D.; Chulist, R.; Schaarschuch, R.; Oertel, C.G.; Skrotzki, W. Sn and Nb modified ultrafine bulk alloys with High-Strength and enhanced ductility. Appl. Phys. Lett. 2013, 102, 061908. [Google Scholar] [CrossRef]
  20. Zadorozhnyy, V.Y.; Shchetinin, I.V.; Chirikov, N.V.; Louzguine-Luzgin, D.V. Tensile properties of a dual-axial forged Ti–Fe–Cu alloy containing boron. Mater. Sci. Eng. A 2014, 614, 238–242. [Google Scholar] [CrossRef]
  21. Zadorozhnyy, V.Y.; Inoue, A.; Louzguine, D.V. Ti-Based nanostructured Low-Alloy with high strength and ductility. Mater. Sci. Eng. A 2012, 551, 82–86. [Google Scholar] [CrossRef]
  22. Zhao, G.H.; Ketov, S.V.; Mao, H.H.; Borgenstam, A.; Louzguine-Luzgin, D.V. Ti–Fe–Sn–Nb hypoeutectic alloys with superb yield strength and significant strain-hardening. Scripta Mater. 2017, 135, 59–62. [Google Scholar] [CrossRef]
  23. Zadorozhnyy, V.Y.; Shi, X.; Kozak, D.S.; Wada, T.; Wang, J.Q.; Kato, H.; Louzguine-Luzgin, D.V. Electrochemical behavior and biocompatibility of Ti–Fe–Cu alloy with high strength and ductility. J. Alloys Compd. 2017, 707, 291–297. [Google Scholar] [CrossRef]
  24. Ruzic, J.; Emura, X.; Ji, X.; Watanabe, I. Mo segregation and distribution in Ti–Mo alloy investigated using nanoindentation. Mater. Sci. Eng. A 2018, 718, 48–55. [Google Scholar] [CrossRef]
  25. Timoshenko, S.; Goodier, J.N. Theory of Elasticity, 2nd ed.; Mcgraw-Hill: New York, NY, USA, 1951. [Google Scholar]
  26. Jeong, H.W.; Kim, S.E.; Hyun, Y.T.; Lee, Y.T.; Park, J.K. Microstructures and elastic moduli of binary titanium alloys containing biocompatible alloying elements. Mater. Sci. Forum 2005, 475–479, 2291–2294. [Google Scholar] [CrossRef]
  27. Gornakova, A.S.; Straumal, B.B.; Nekrasov, A.N.; Kilmametov, A.; Afonikova, N.S. Grain boundary wetting by a second solid phase in Ti–Fe alloys. J. Mater. Eng. Perform. 2018, 27, 4989–4992. [Google Scholar] [CrossRef]
  28. Gornakova, A.S.; Prokofiev, S.I.; Straumal, B.B.; Kolesnikova, K.I. Growth of (αTi) Grain-Boundary layers in Ti–Co alloys. Russ. J. Non-Ferr. Met. 2016, 57, 703–709. [Google Scholar] [CrossRef]
  29. Takeuchi, A.; Inoue, A. Classification of bulk metallic glasses by atomic size difference, heat of mixing and period of constituent elements and its application to characterization of the main alloying element. Mater. Trans. 2005, 46, 2817–2829. [Google Scholar] [CrossRef]
  30. Fischer, F.D.; Reisner, G.; Werner, E.; Tanaka, K.; Cailletaud, G.; Antretter, T. A new view on transformation induced plasticity (TRIP). Int. J. Plast. 2000, 16, 723–748. [Google Scholar] [CrossRef]
  31. Li, P.Y. Microstructure and mechanical properties of rapidly solidified B2-type Zr–Co alloys containing a second phase of Zr2Co. Mater. Res. Express 2018, 5, 046522. [Google Scholar] [CrossRef]
  32. Haghighi, S.E.; Liu, Y.J.; Cao, G.H.; Zhang, L.C. Phase transition, microstructural evolution and mechanical properties of Ti–Nb–Fe alloys induced by Fe addition. Mater. Des. 2016, 97, 279–286. [Google Scholar] [CrossRef]
  33. Fornell, J.; Van Steenberge, N.; Varea, A.; Rossinyol, E.; Pellicer, E.; Suriñach, S.; Baró, M.D.; Sort, J. Enhanced mechanical properties and in vitro corrosion behavior of amorphous and devitrified Ti40Zr10Cu38Pd12 metallic glass. J. Mech. Behav. Biomed. Mater. 2011, 4, 1709–1717. [Google Scholar] [CrossRef]
  34. Musil, J.; Kunc, F.; Zeman, H.; Poláková, H. Relationships between hardness, Young’s modulus and elastic recovery in hard nanocomposite coatings. Surf. Coat. Technol. 2002, 154, 304–313. [Google Scholar] [CrossRef]
  35. Haghighi, S.E.; Cao, G.H.; Zhang, L.C. Nanoindentation study of mechanical properities of Ti based alloys with Fe and Ta additions. J. Alloys Compds. 2017, 692, 892–897. [Google Scholar] [CrossRef]
  36. Medeiros, B.B.; Medeiros, M.M.; Fornell, J.; Sort, J.; Baró, M.D.; Jorge Junior, A.M. Nanoindentation response of Cu–Ti based metallic glasses: Comparison between as-cast, relaxed and devitrified states. J. Non-Cryst. Solids 2015, 425, 103–109. [Google Scholar] [CrossRef]
Figure 1. X-ray diffractometer (XRD) patterns of the Ti–Fe–Sn–Mo alloys. (a) 20°–100°; (b) 35°–45°.
Metals 09 01135 g001
Figure 2. Microstructure of the (a,b) Ti75Fe19Sn5Mo1, (c,d) Ti75Fe17Sn5Mo3, (e,f) Ti75Fe15Sn5Mo5 alloys.
Metals 09 01135 g002
Figure 3. Energy dispersive spectrometer (EDS) pictures of Ti75Fe19Sn5Mo1 alloy. (a) Scanning electron microscopy (SEM) picture and element content at each point scanning; (b–e) surface distribution of elements at place scanning.
Metals 09 01135 g003
Figure 4. Transmission electron microscope (TEM) bright field images (a,c,e) of Ti75Fe19Sn5Mo1 alloys. (b,d,f) Electron diffraction patterns taken respectively from the areas marked “A”, “B”, and “C” in (a,c,e).
Metals 09 01135 g004
Figure 5. The (a) normal and (b) true stress–strain curves of the Ti–Fe–Sn–Mo alloys.
Metals 09 01135 g005
Figure 6. Relationship of lnσ and lnε for the Ti75Fe19Sn5Mo1 alloy.
Metals 09 01135 g006
Figure 7. The elastic energy (We) of the Ti75Fe15Sn5Mo5 alloy.
Metals 09 01135 g007
Figure 8. The toughness (At) of the Ti75Fe19Sn5Mo1 alloy.
Metals 09 01135 g008
Figure 9. Fracture morphology of as-cast Ti–Fe–Sn–Mo alloys. (a,b) Ti75Fe19Sn5Mo1, (c,d) Ti75Fe17Sn5Mo3, (e,f) Ti75Fe15Sn5Mo5.
Metals 09 01135 g009
Figure 10. Representative load/unload (P)-displacement (h) nanoindentation curves for the Ti–Fe–Sn–Mo alloys.
Metals 09 01135 g010
Figure 11. Loading and unloading in a cycle of indentation and corresponding energy fractions for the Ti75Fe19Sn5Mo1 alloy.
Metals 09 01135 g011
Table 1. Mechanical properties of Ti–Fe–Sn–Mo alloys, including linear elastic limit (σe), the 0.2% offset yield stress (σ0.2), true plastic strain (εp), maximum compression strength (σb), elastic energy (We), toughness values (At), approximate volume fraction of phase (V), Vickers hardness (HV), and elastic modulus (E) in quasi–static compression test.
Alloysσeσ0.2εpσbWe × 106At × 106Vβ-TiVα-TiVTiFeHVE
(MPa)(MPa)(%)(MPa)(J⋅m−3)(J⋅m−3)(%)(%)(%)(GPa)
Ti75Fe19Sn5Mo11502173416.1259013.36383.1442.347.310.459085.4
Ti75Fe17Sn5Mo3120315483.9168010.1682.1456.833.49.857174
Ti75Fe15Sn5Mo5140714963.5168330.385.737.8602.253433.4
Table 2. Heat of mixing of Ti–Fe–Sn–Mo Alloys.
ElementsHeat of mixing (kJ⋅mol−1) [29]
TiFeSnMo
Ti0−17−21−4
Fe-011−2
Sn--020
Mo---0
Table 3. Density (ρ) and mechanical properties of Ti–Fe–Sn–Mo alloys. Such as specified yield strength (σ0.2/ρ), specific maximum strength (σb/ρ), harden (H), reduced elastic modulus (Er), H/Er, H3/Er2, Ue, Up, Ue/Ut, and Up/Ut (where Up, Ue, and Ut denote the plastic, elastic, and total indentation energies, respectively).
Alloysρσ0.2σbErHH/ErH3/Er2Ue × 10−11Up × 10−11Ue/UtUp/Ut
(g cm−3)(Pa m3 g−1)(Pa m3 g−1)(GPa)(GPa)(GPa)(J m−3)(J m−3)(%)(%)
Ti75Fe19Sn5Mo15.475316.7473.1110.86.840.0620.02626.7136.6142.257.8
Ti75Fe17Sn5Mo35.496281.7305.751.16.240.1220.09352.7535.9259.540.5
Ti75Fe15Sn5Mo55.624266299.342.16.40.1520.14864.8132.2467.532.5

