Article

Comparative Study of Two Nanoindentation Approaches for Assessing Mechanical Properties of Ion-Irradiated Stainless Steel 316

1
Australian Nuclear Science and Technology Organization, New Illawarra Road, Lucas Heights, NSW 2234, Australia
2
School of Materials Science and Engineering, University of New South Wales, Sydney, NSW 2052, Australia
*
Author to whom correspondence should be addressed.
Metals 2018, 8(9), 719; https://doi.org/10.3390/met8090719
Submission received: 31 July 2018 / Revised: 10 August 2018 / Accepted: 23 August 2018 / Published: 13 September 2018
(This article belongs to the Special Issue Radiation Effects in Metals)

Abstract

:
Nanoindentation is a commonly used method to measure the hardness of surfaces with thin layers, and is especially useful in studying the change in mechanical properties of ion irradiated materials. This research compares two different methods of nanoindentation to study the changes in hardness resulting from ion irradiation of SS316 alloy. The samples were irradiated by He2+ ions at beam energies of 1, 2, and 3 MeV, respectively. The first method involves the indentation of the irradiated surface perpendicular to it using the continuous stiffness mode (CSM), while the second applies the indents on an oblique surface, accessing an inclined cross-section of the irradiated material. Finite element modelling has been used to further illuminate the deformation processes below the indents in the two methods. The hardness profiles obtained from the two nanoindentation methods reveal the differences in the outcomes and advantages of the respective procedures, and provide a useful guideline for their applicability to various experimental conditions. It is shown through an in depth analysis of the results that the ‘top-down’ method is preferable in the case when the ion irradiation energy, or, equivalently, the irradiated depth is small, due to its greater spatial resolution. However, the oblique cross section method is more suitable when the ion irradiation energy is >1 MeV, since it allows a more faithful measurement of hardness as a function of dose, as the plastic field is much smaller and more sensitive to local hardness values.

1. Introduction

The construction of high efficiency, low waste nuclear reactors (such as Gen IV reactors) necessitates the use of materials resistant to severe operating conditions (radiation doses of up to 200 displacements per atom (dpa) and temperatures of up to 700–1000 °C) [1,2,3]. A major obstacle in performing research on the effects of extremely high radiation dose on the microstructure and mechanical properties of the relevant structural materials is the extended time period necessary to impart these doses in the available research reactors. The application of such large amounts of neutron flux also results in the samples becoming radioactive and, creates problems in handling and further sample processing for characterization and testing. Ion irradiation can be used as a viable surrogate or alternative for achieving high radiation damage doses, while avoiding the problem of radioactivity in the irradiated samples [4]. The use of ion irradiation results in the formation of an extremely thin damaged layer, ranging typically from a few hundred nanometers to about 10 μm. Most of the radiation affected thickness, starting from the surface, has a very low dose, which increases rapidly close to the range of the ions [5]. The limited thickness of the ion irradiated layer and the sudden change in the dose near the end of range create difficult obstacles in the proper assessment of hardness changes and plastic behaviour in the irradiated regions. A variety of testing methods have been utilized up to now to study the consequences of ion irradiation in regards to the mechanical behaviour of the radiation-affected layers. These include instrumented nanoindentation, micro/nano-pillar compression, cantilever bending, and micro-tensile testing. These methods are used in measuring a variety of effects, such as changes in hardness, residual stress, tensile strength, etc. While residual stress is affected by irradiation, sometimes actually changing in nature from tensile to compressive [6], and there are various methods for measuring this effect, such as suggested by Ghidelli et al. [7], the focus of this paper is on the measurement of changes in hardness due to ion irradiation, and therefore, this aspect of residual stress will not be discussed further here, although it is an important effect which will be considered in a separate study.
The most popular of all the methods for measuring changes in mechanical properties has been nanoindentation, since it involves relatively uncomplicated sample preparation, and also has the advantage of simplicity of testing methodology, i.e., it is easy to set up and perform. Nonetheless, it involves the formation of a complex, three-dimensional stress-state underneath the tip of the indent, which makes the analysis of the results quite complicated. Moreover, these results are influenced to some extent by the orientation of the grains on which the different indents are made [8], and thus these results may need to be normalized with respect to orientation, especially in highly anisotropic materials such as hexagonal close packed (HCP) Ti, Zr, Mg, and their alloys. In consequence, the comparison of the results with bulk tensile properties becomes extremely complex.
There have been two different approaches towards hardness measurements on thin irradiated layers using nanoindentation—(a) applying the indents from the top surface which has been irradiated—the ‘top-down’ method; and (b) a cross-sectional indentation method which is sometimes applied on an oblique surface to enable greater spatial resolution in the hardness measurements—the oblique cross-section (OCS) method. These methods have been used by various researchers in different experimental conditions [9,10,11,12,13]. The first method, ‘top-down’, is used more frequently as it is easy to perform, while the latter method (OCS) allows a greater spatial resolution in hardness measurements along the thickness direction. The second method requires more careful sample preparation and skillful alignment.
Here, the authors attempt to compare the efficacy of the two methods mentioned above in studying the relationship between the calculated depth of peak damage and the corresponding depth of hardness peak as a function of ion irradiation energy. A finite element model, developed by the authors in previous works [14,15] for both nanoindentation methods has been used to understand the deformation behaviour in the plastic zone below the indents. The nature of the dependence of measured hardness on indentation depth vis-à-vis the ion beam energy is discussed for both methods, and appropriate ranges of applicability for each method are suggested based on the experimental results and analysis. This paper is focused exclusively on the comparison of the two methods, hence it necessarily refers to and occasionally reproduces some figures presented in the earlier papers where these methods are developed, to facilitate the comparison. However, it goes more deeply into certain aspects of the deformation below the indents which could not be discussed in the earlier papers, and it brings out the differences between the two methods explicitly, providing guidelines for the use of each method.

2. Materials and Methods

2.1. Materials and Microstructural Characterization

The current study focuses on stainless steel 316 (SS316) in the annealed condition. This steel is of major interest to the nuclear and radiation community as it is a primary alloy used in nuclear waste storage, steam separation plates, reactor pressure vessels (RPVs), piping, etc. The microstructures and the grain size of the samples were characterized by scanning electron microscopy (SEM) and transmission electron microscopy (TEM), using a Zeiss™ Ultra Plus® SEM (Zeiss, Oberkochen, Germany) and Jeol® 2200FS™ and Jeol® 2010F™ TEM (JEOL, Tokyo, Japan), pre and post irradiation.
The samples exhibit equiaxed austenitic grains, as shown in a previous work by the authors (Figure 1 in [12]). As can be seen from these SEM micrographs, the sample has relatively large grain size, ranging from ~20–140 μm.

2.2. Radiation Damage Simulations

The damage profiles (displacements per atom dpa vs. depth d) were simulated for the irradiating ions, helium (He+), through the SRIM® 2013 (Stopping and Range of Ions in Matter), details of which can be found in Zeigler and Biersack [5]. The input parameters are given in Table 1. Damage in dpa was calculated using the formula
d p a ( x ) = ω ( x )   × 10 8 × F ρ
where ω(x) is total number of vacancies generated at depth x Å from surface (x = 0 at surface) in number/Å-ion; F is total fluence, fixed at 1 × 10¹⁷ ions/cm2; and ρ is material density in atoms/cm3.

2.3. Irradiation of Samples

Cylindrical samples of SS316 were irradiated with He+ ions to energies of 1, 2, and 3 MeV. The STAR accelerator at ANSTO, Australia was used for the irradiation of all specimens. To contrast the effects of the ion irradiation with the unirradiated surface, half of each sample was masked by copper foil. This facilitates the examination of an irradiated and ‘virgin’ surface within the same specimens alleviating differences that may arise to varying sample batches or large microstructural changes. Post irradiation, the samples underwent a two stage cleaning procedure: firstly using ethanol and acetone and secondly using an argon plasma cleaner (South Bay Technology®, San Clemente, CA, USA), for 25 min, to remove the thin organic contamination layer deposited during the irradiation/implantation process.

2.4. Nanoindentation

Measurements of the surface hardness of the as-received and irradiated samples were carried out on an MTS™ Nanoindenter G300® (Agilent, Santa Clara, CA, USA) equipped with a diamond Berkovich tip. This type of indenter has a tip shaped like a triangular pyramid with a face angle of 65.27° from the axis, which gives the same projected area-to-depth ratio as the Vickers indenter [16]. It is more commonly used than the Vickers indenter in nanoindentation experiments as it is easier to manufacture a tip with three faces so that they meet at a point, than one with four faces which almost inevitably result in a line edge. Poisson’s ratio was set as 0.3 for all materials.
In the ‘top-down’ hardness measurement method, the hardness profiles (hardness H vs. depth d) were determined by indentation through continuous stiffness mode (CSM). The specimens were indented perpendicularly to their respective surfaces, using a maximum indentation depth of 3 μm, and a displacement rate of 5 nm/s. A 7 × 7 grid of indents, totalling 49 indents, was made for each sample with 100 μm spacing in both the vertical and horizontal directions. A diagram of a representative indentation array is shown in [12]. A schematic drawing showing the relative orientation of the indent and the ion irradiation, and the corresponding dose profile, is shown in Figure 1a. The data was further processed by applying a ‘spline’ routine in MATLAB® (MATLAB Release 2016a, The MathWorks Inc., Natick, MA, USA) [17] to align the data from the 49 profiles before taking an average. This is necessary since the depths at which the hardness measurements are stored for each indentation run, and also the depth intervals for recording the hardness during any one indentation experiment, are not the same. The difference between the averages of the ‘virgin’ and irradiated hardness profiles at each depth was calculated to obtain a radiation-hardening profile (ΔH vs. d).
For the ‘oblique cross-sectional method’, the irradiated samples were mounted in epoxy with a steel pin as support on one side at the bottom, such that the top surface was at an angle of 15° from the horizontal, as shown in the schematic drawing in Figure 1b (after [13]). The sample was then ground flat and this new surface (surface A in Figure 1b) was polished to a finish of ~10–20 nm. This procedure exposed a cross-section of the irradiated thickness at an angle of 15° from the top surface (see Figure 1 for a schematic diagram of the sample orientation for this method). A schematic profile of the irradiation dose is shown next to the 3 dimensional cross-section diagram in Figure 1b for clarity. Nanoindentation was performed on surface A, starting from the epoxy, in a row which was rotated from the edge of the sample by ~4° (shown as α in Figure 1b). The indents were made in the non-CSM depth control mode, which gives only one hardness value for each indent at maximum depth. Each indent was made to a depth of ~250 nm, and there was a gap of 7 μm between successive indents. This line extended from the epoxy to the un-irradiated area below the irradiated region. The row of indents was repeated at reasonable gaps to provide statistically significant data, without influencing the results of neighbouring rows by avoiding overlapping plastic strain fields. The oblique pattern of indent rows allowed a large number of indents to be made in the thin irradiated region, thus enhancing the spatial resolution of the data even further, over and above that enabled by the oblique cross-sectioning. There were about 10 rows of 40–60 indents made in each sample (for more details, see [14]).

3. Results

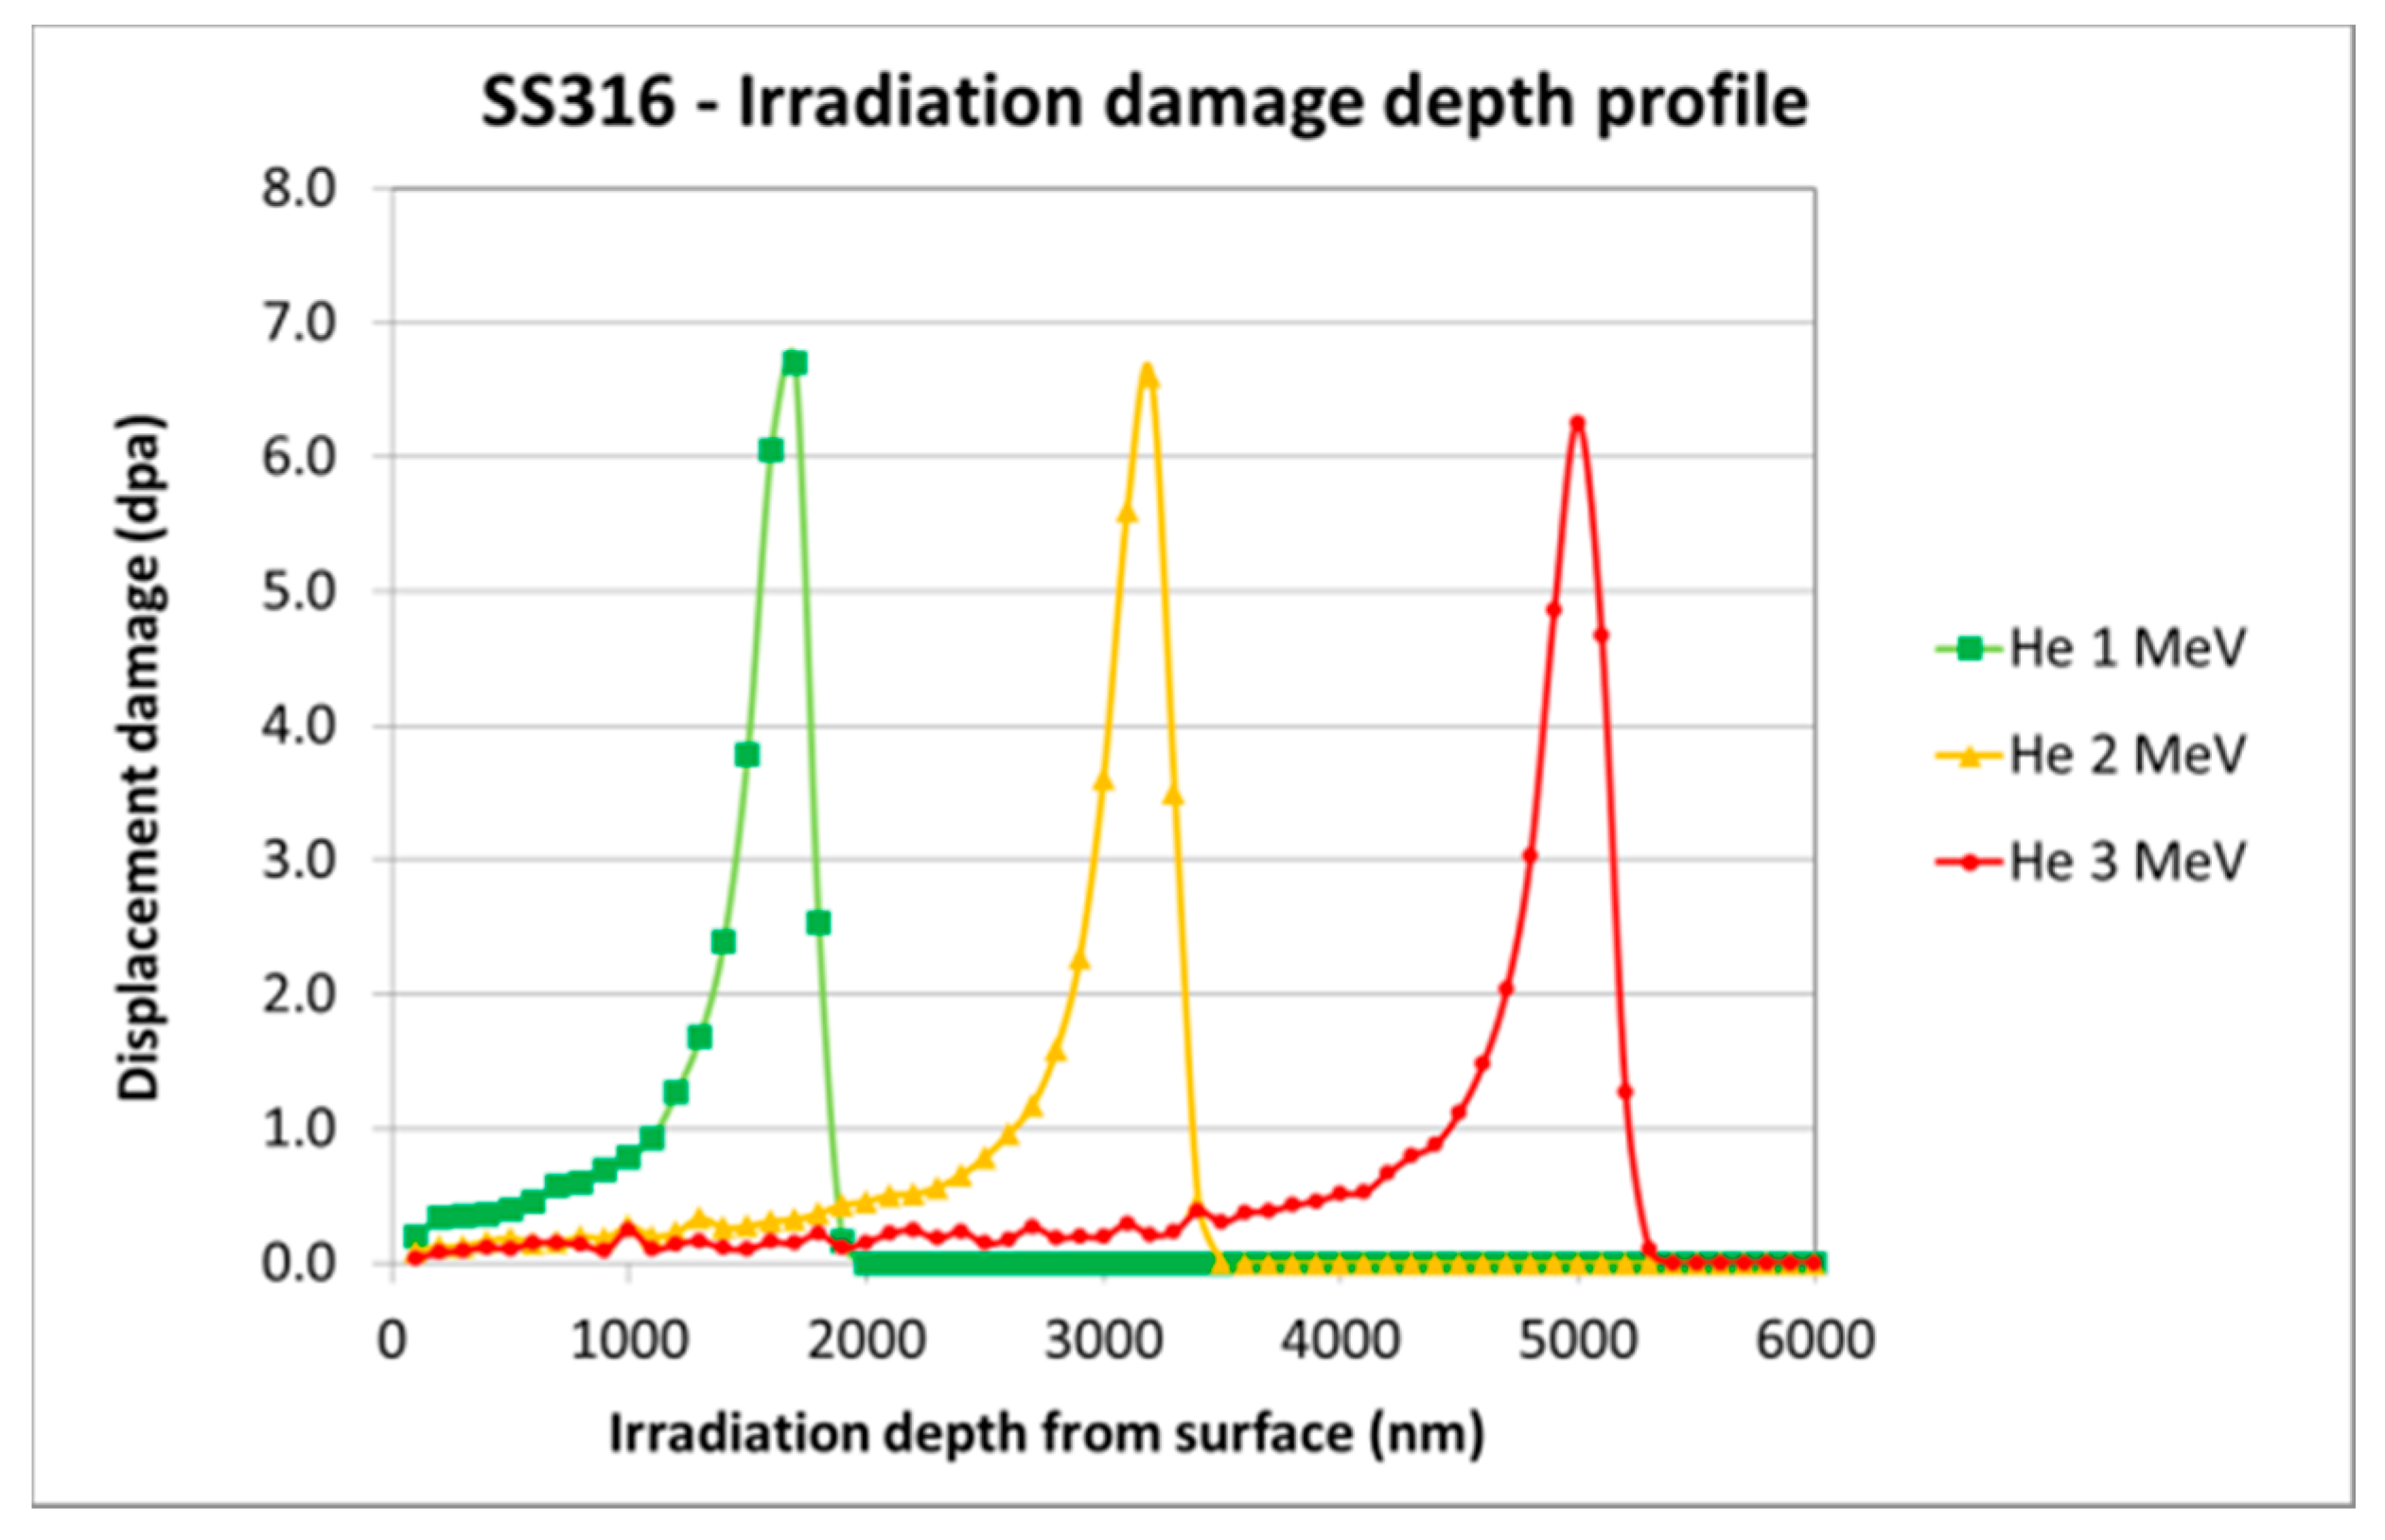
3.1. Ion Damage Profiles Simulated by SRIM

The simulated displacement damage profiles (in dpa) obtained from SRIM calculations are shown in Figure 2 (after the authors’ previous publication [14]). The plot shows the damage in SS316 as a function of depth and energy of the incoming He+ ion-beam. Some points to be noted in the displacement damage plots are:
(i)
With increasing ion beam energy, the authors observe an increase in the depth of the damage peak, as expected. Also observable in the near linear relationship between these two aspects, indicative of a direct proportionality.
(ii)
In the damage plots, at higher ion beam energy, the peak damage is slightly lower, and the peak is broader.

3.2. Radiation Hardening Profiles

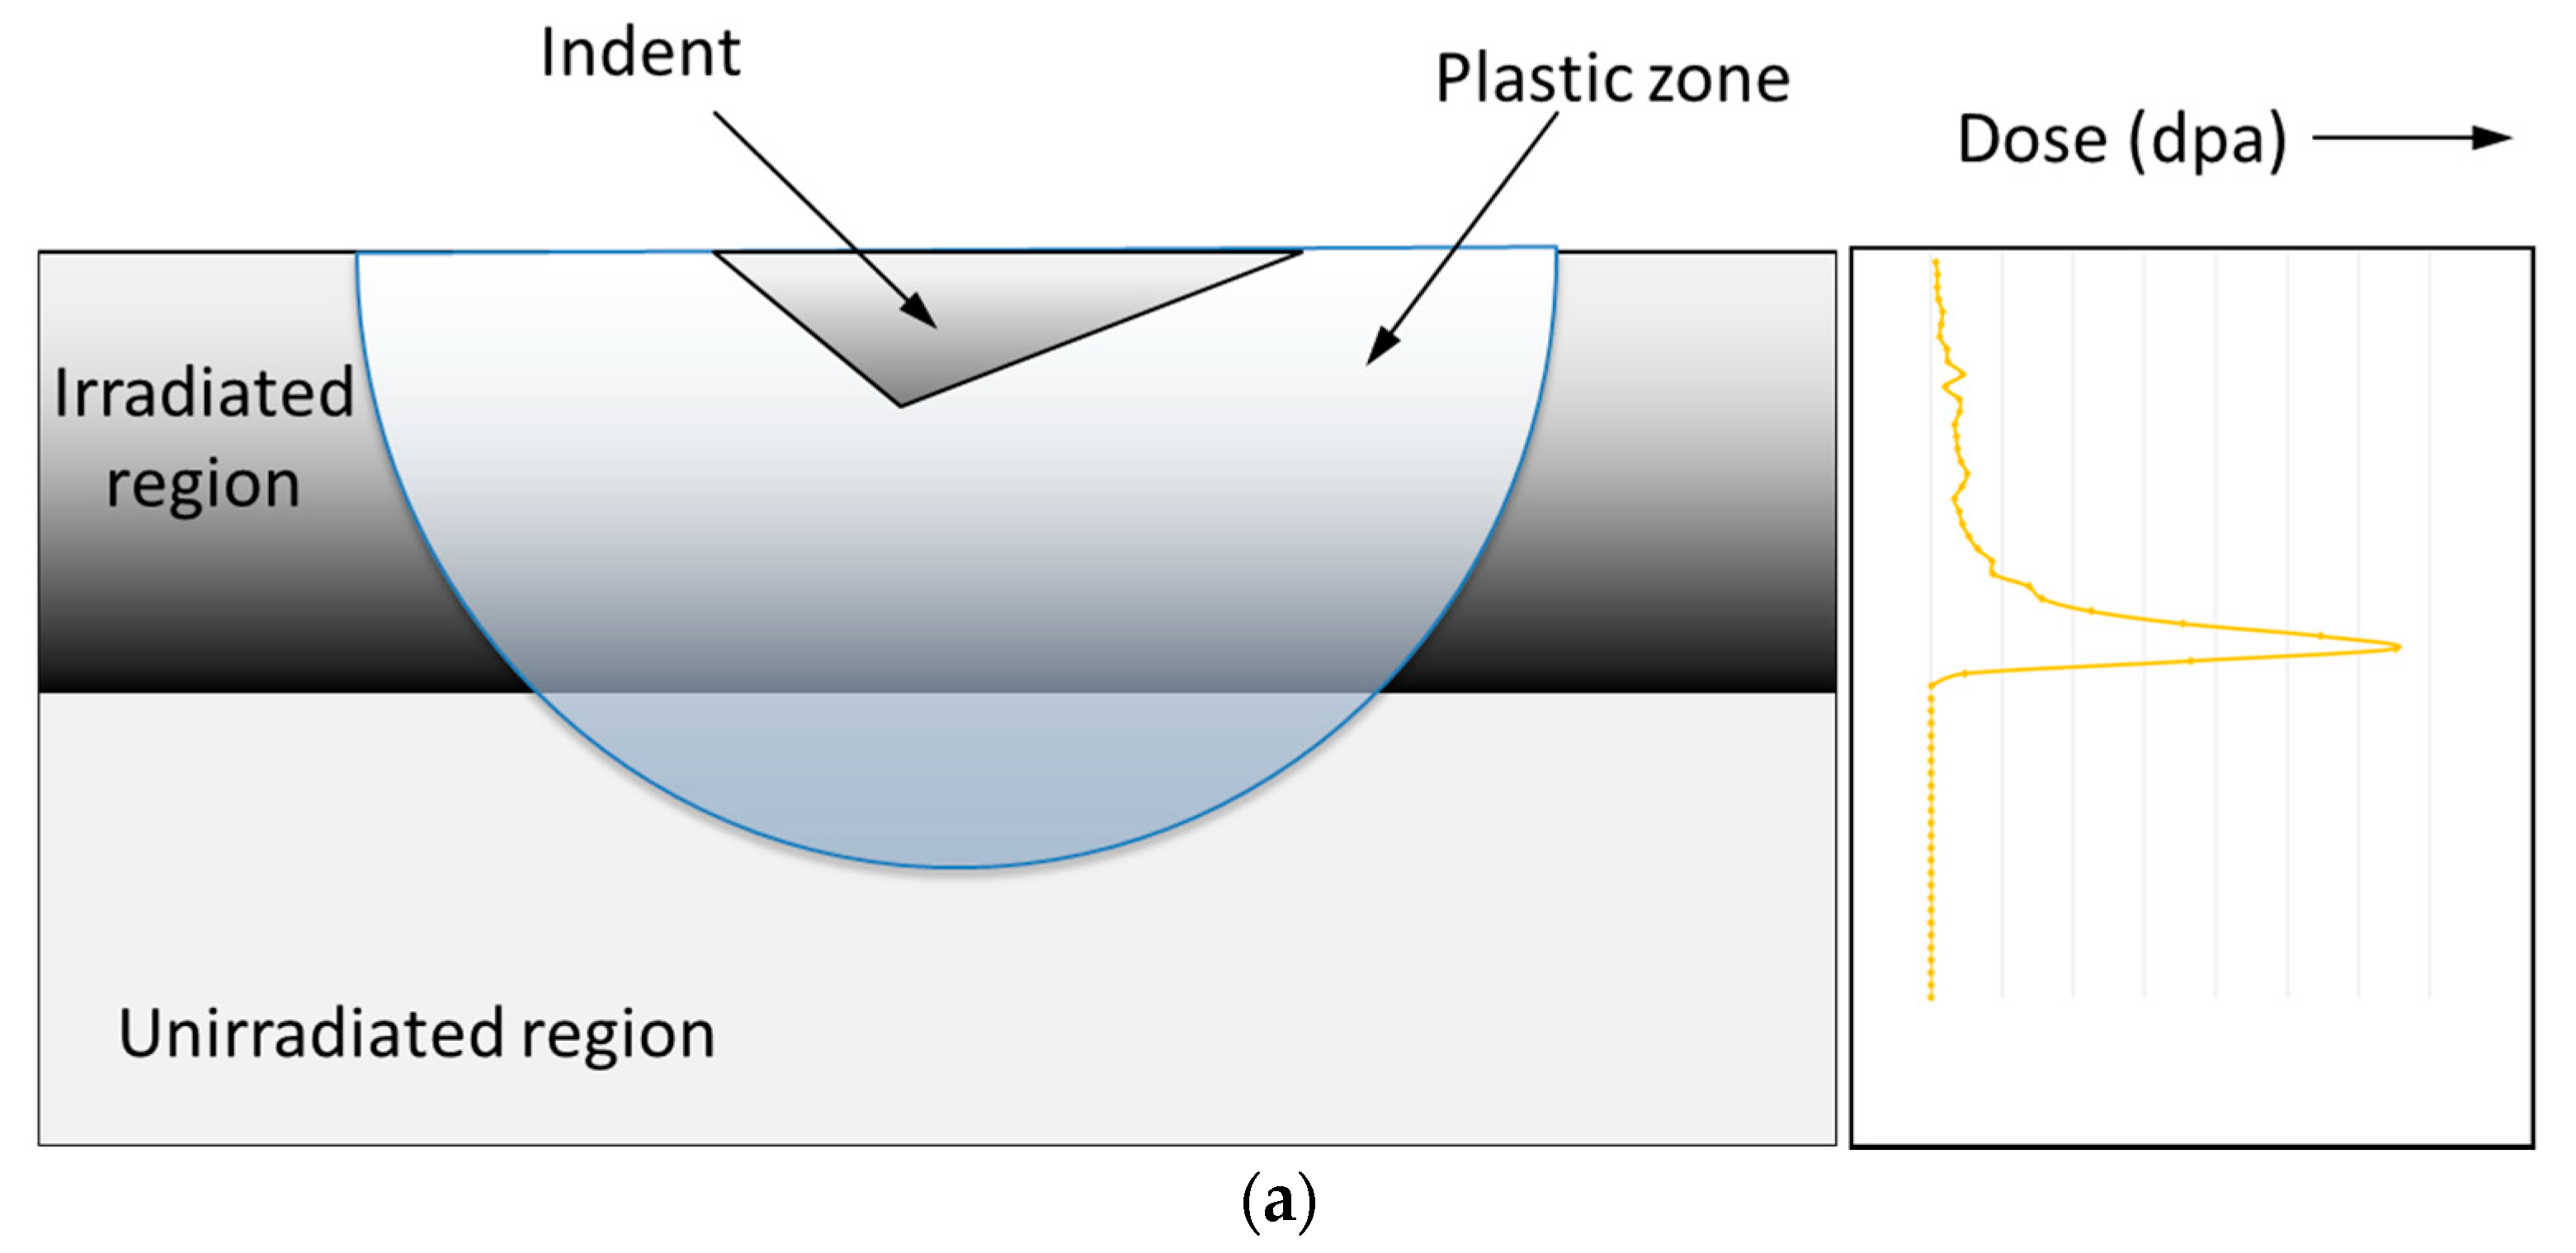
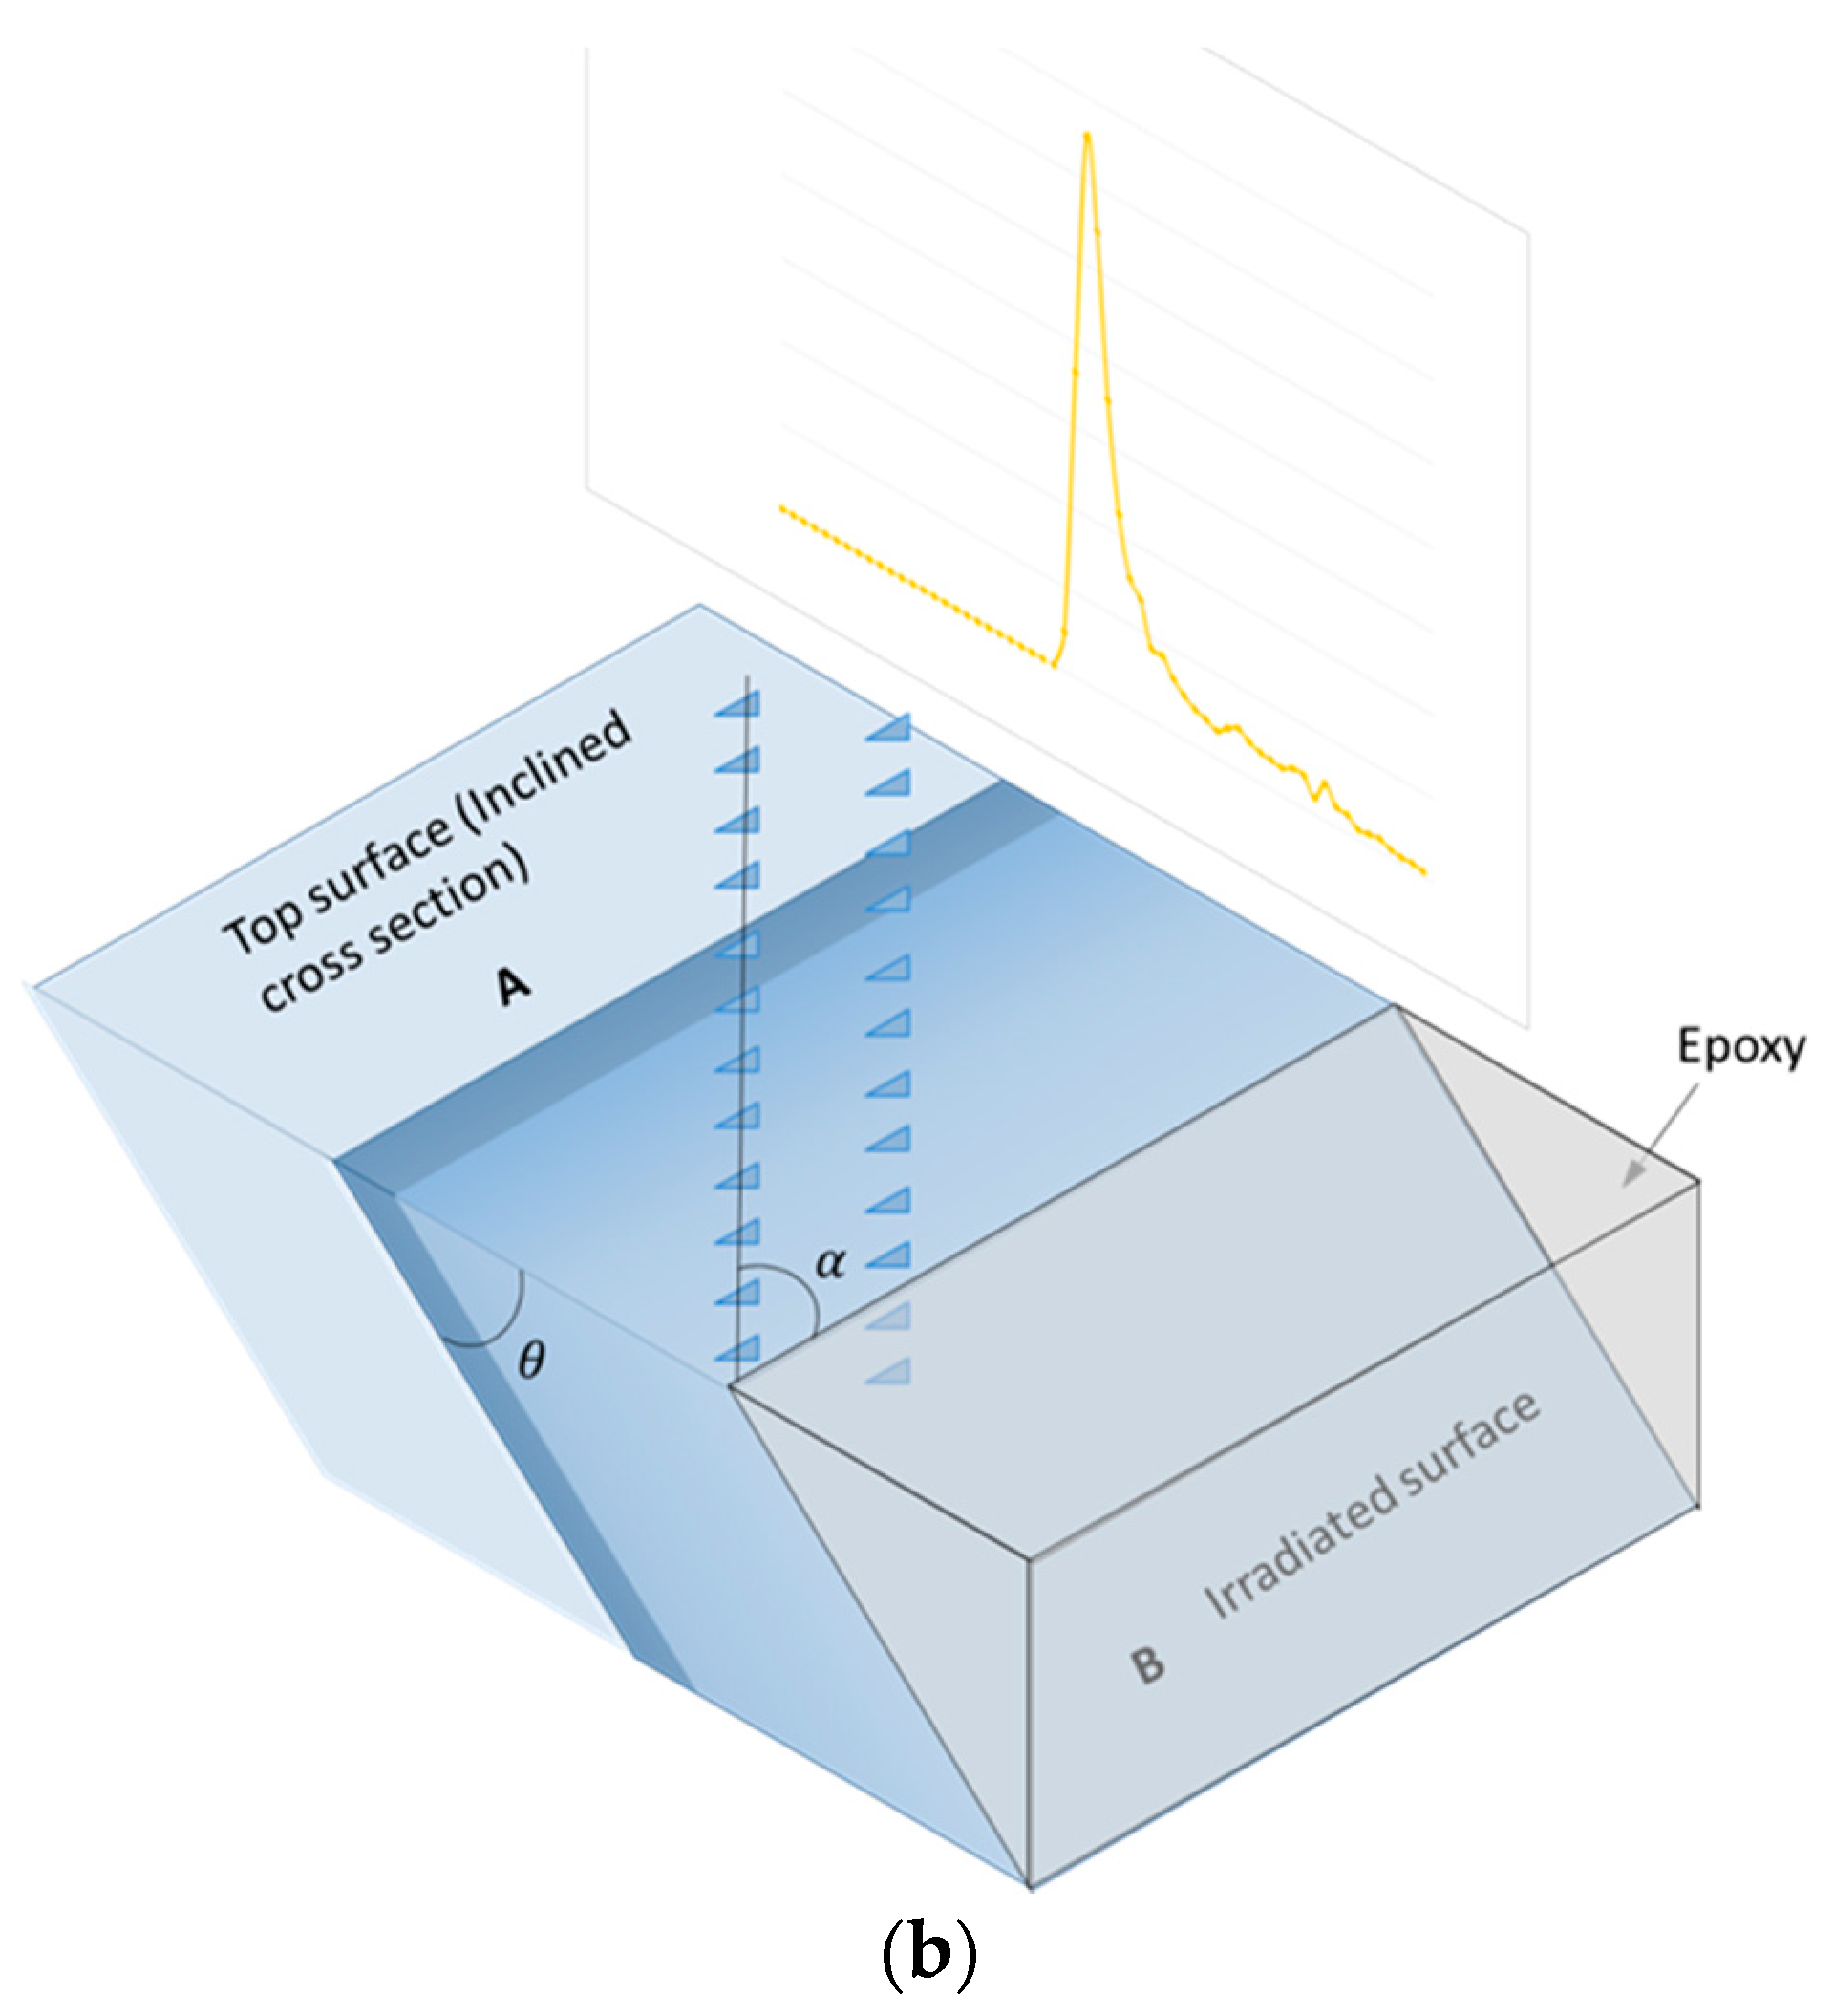
3.2.1. ‘Top-Down’ Indentation Method

The average hardness values obtained from set of 25–49 indents performed in the top-down method are given in Figure 3a. These plots show the hardness without any corrections for indentation size effect. As can be seen clearly form this plot, the 1 MeV sample shows a significant shoulder at about 275 nm, and the 2 and 3 MeV plots show gentle ‘shoulder’ regions at 470 nm and 740 nm, respectively. None of these hardness average curves shows any peak, and all that can be said from this plot is that the irradiated hardness is higher than the un-irradiated hardness, and the positions of the shoulders move deeper with increasing ion energy.
The measured hardness values were corrected for the indentation size effect (ISE) [18] using a methodology as shown in a previous paper by the authors [12]. This process removes the artificial effect of increased hardness near the surface cause by geometrically necessary dislocations (GNDs). To assess the actual hardening due to He+ irradiation damage in the ‘top-down’ indentation method, a procedure described in a previous paper by one of the present authors [12] for subtracting the hardness of the unirradiated or virgin material from that of the irradiated samples at a given energy was adopted. The change in hardness, ΔH, calculated for 1, 2, and 3 MeV He+ irradiated samples is shown in Figure 3b [12]. The peak ΔH values decrease and the peaks move to greater depths at higher ion energies. As the energy of irradiation increases there is also an observable peak broadening with the curve at 3 MeV exhibiting a large plateaued region, devoid of a distinct peak. Thus this procedure for correcting for the ISE and obtaining the hardness difference (ΔH) for the irradiated samples brings out the differences in the three cases more prominently than the raw hardness data.

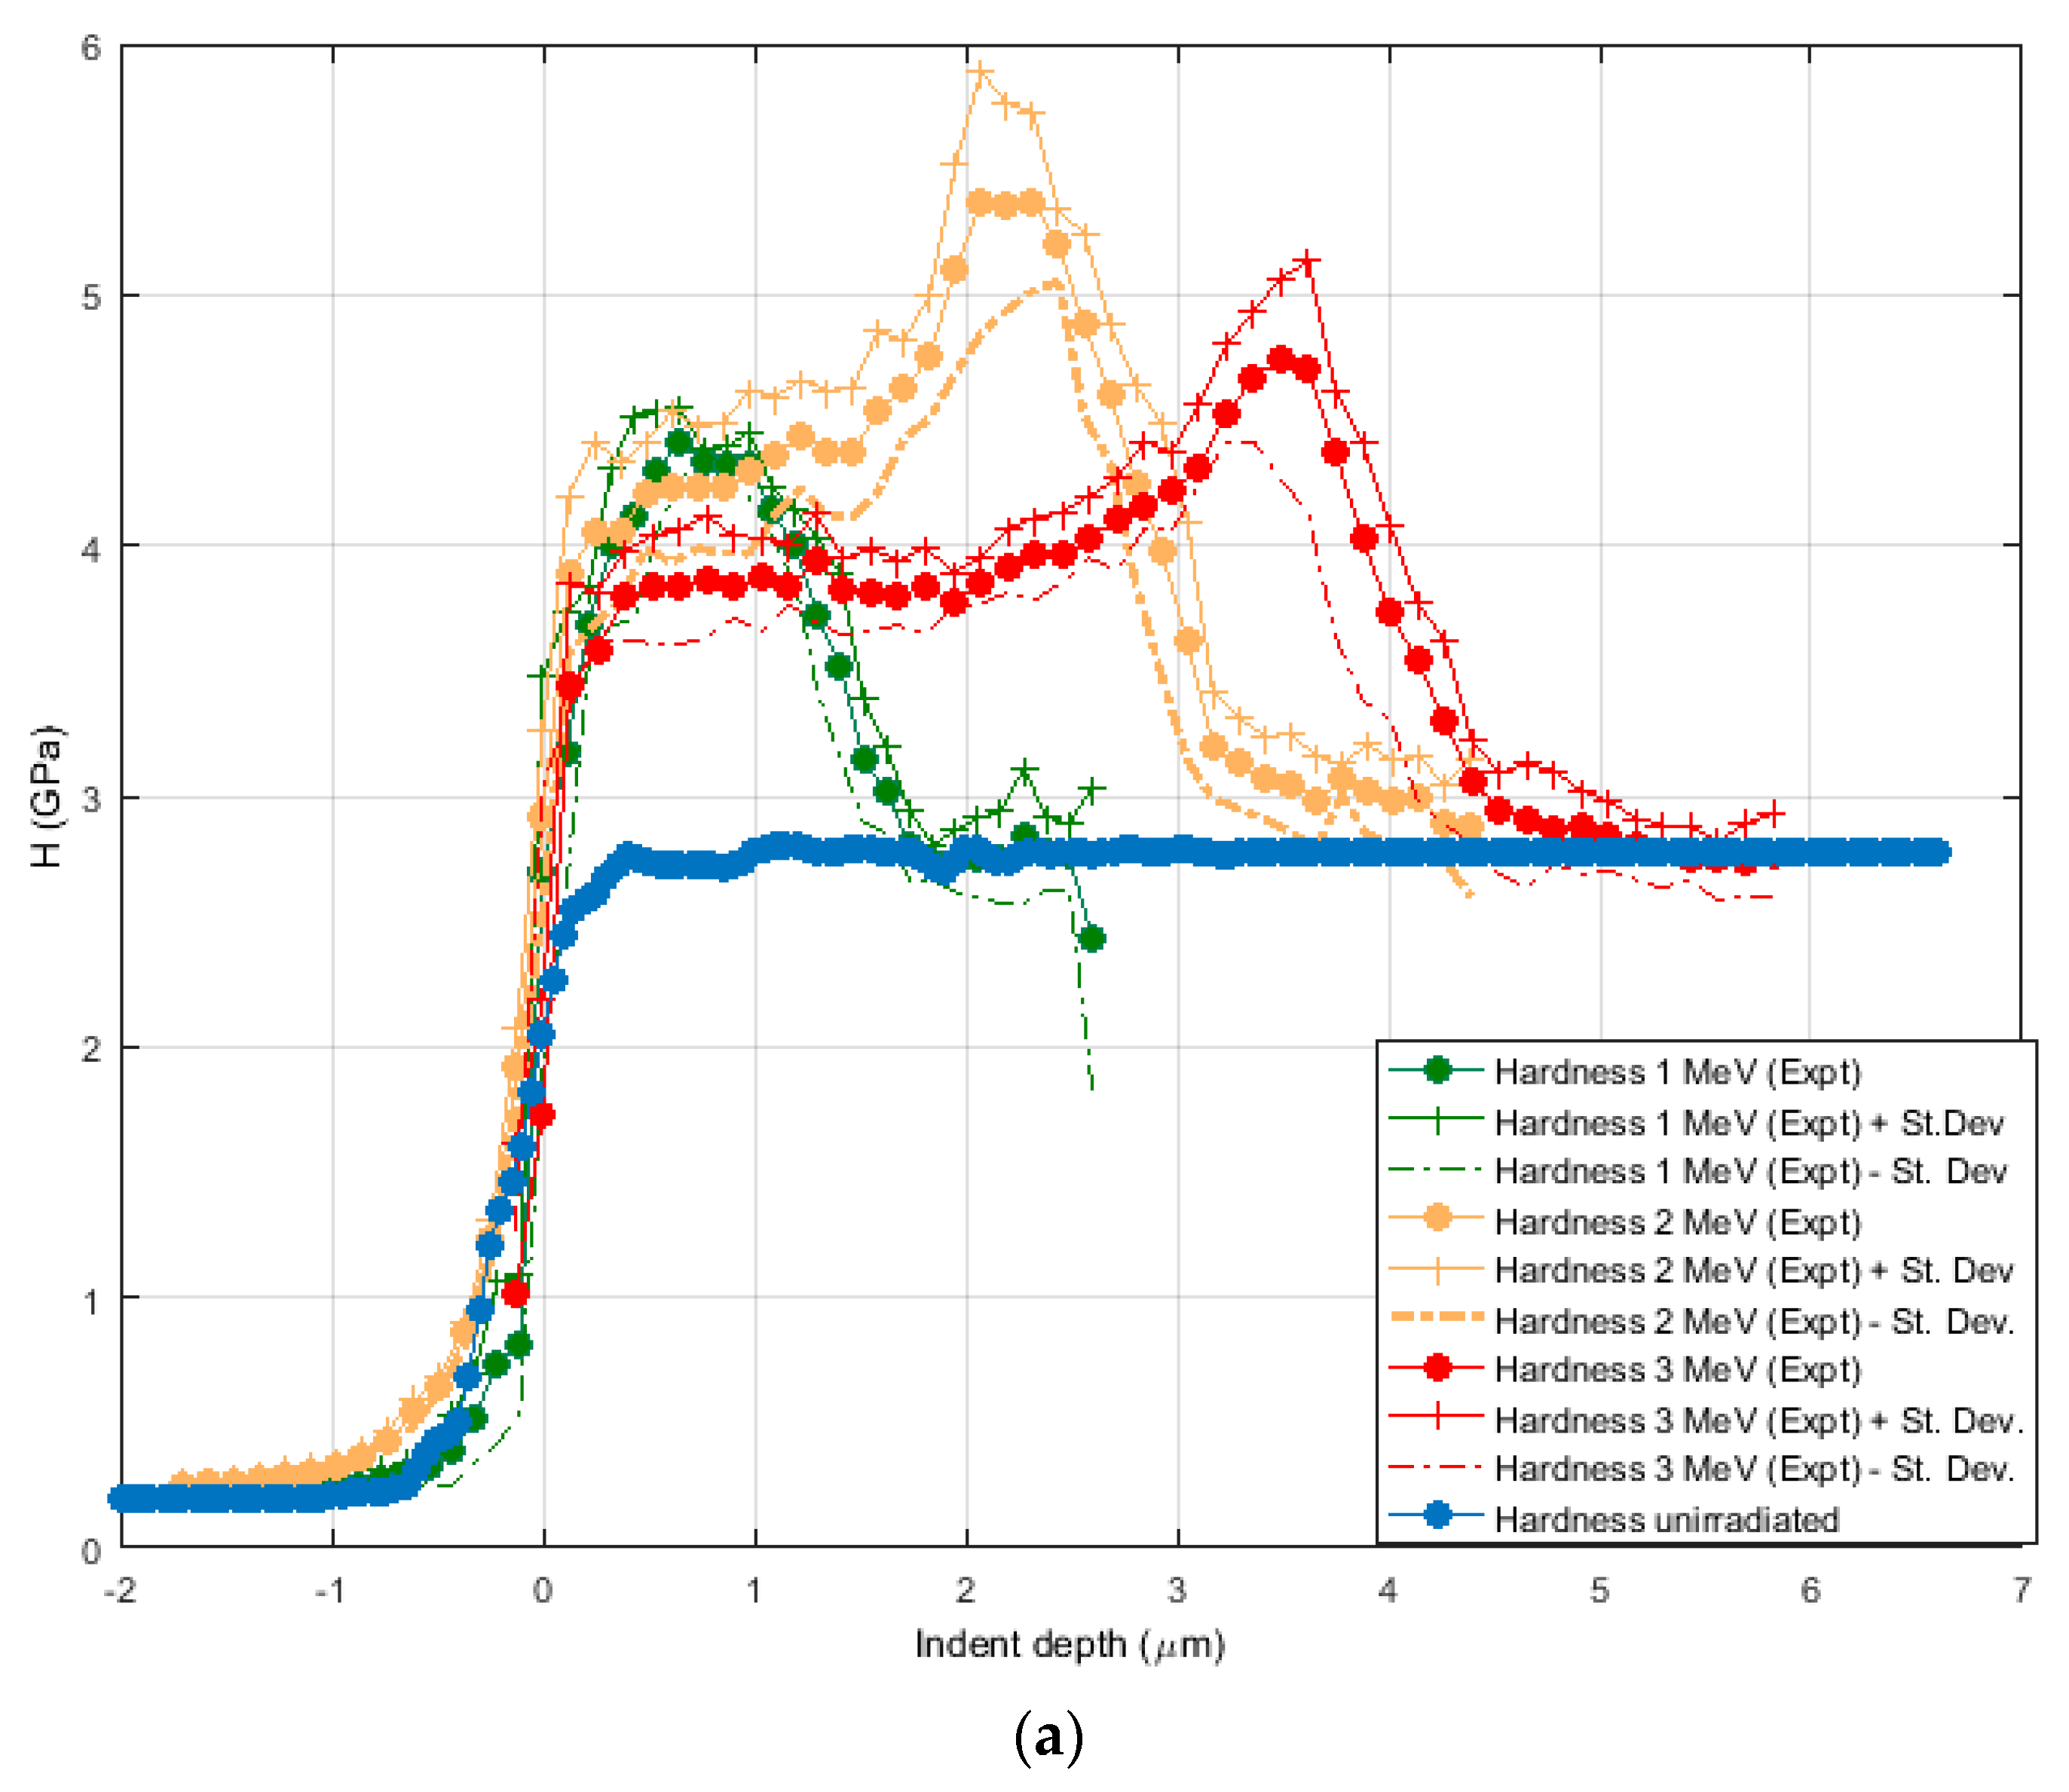
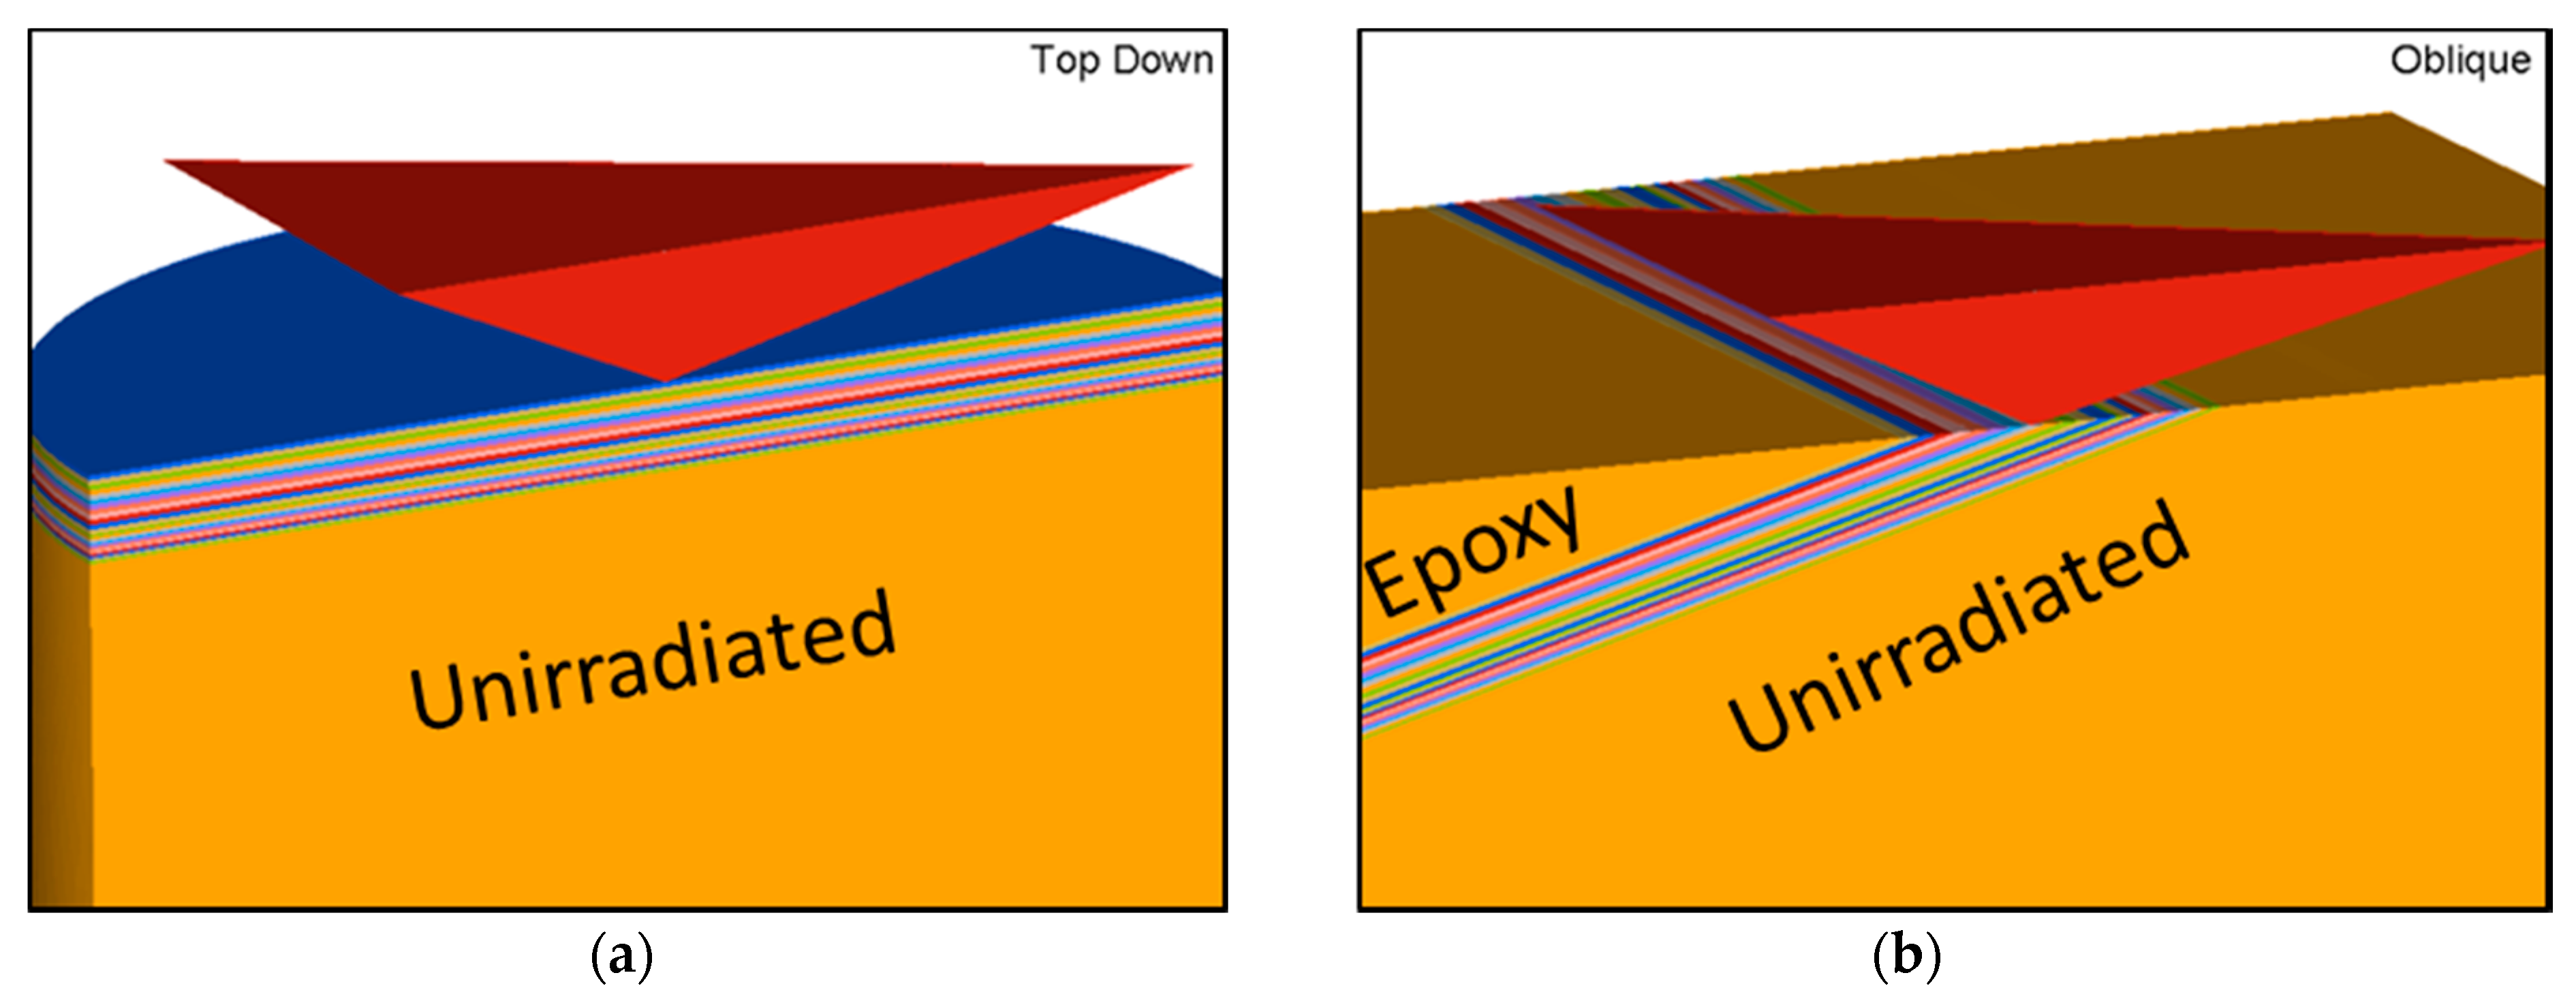
3.2.2. ‘Oblique Cross-Section’ Indentation Method

In this method, the nanoindents were made in the non-CSM mode, as mentioned in the experimental section. A series of nanoindents were made on the oblique surface (cut at 15° to the irradiated surface) at an angle of ~4° to the edge of the sample, as shown in Figure 1. The projected depth d of the nanoindents with respect to the irradiated surface was calculated using the following formula
d = x   × ( n 1 ) × sin 4 ° × sin 15 °
where x = distance between the successive indents in a row (=7 μm), n = the serial number of the indent in the row, starting from the sample-epoxy interface. The data from different rows was checked for alignment, to set the Point no. 1 at the sample-epoxy interface. It was found that the most reliable method for achieving this was to set the indent that showed a sudden increase in the modulus (from the low modulus of the epoxy) at no. 1, and the distance at 0 from this surface. For the subsequent indents, the projected depths from the irradiated surface were calculated using the expression for d given above. The average hardness vs. depth profile for the three samples irradiated at 1, 2, and 3 MeV was plotted, as shown in Figure 4a, with the upper and lower envelopes determined by ±1 standard deviation. The hardness profile of the unirradiated sample is also shown in the curve, with the data points shown as blue dots. The large depth end of the unirradiated curve is extrapolated from the actual experimental data using the last data point at ~3.3 μm, in order to give an idea of the level of base hardness compared to the measured hardness of irradiated samples. There is a sharp drop in the hardness values of all samples near the sample/epoxy interface, starting at a depth of about 400–500 nm from the irradiated surface. This observation implies that the hardness measured on this cross-sectional surface gets affected by the epoxy as far as almost ~0.5 μm from the interface.
The baseline hardness of all four samples (including the unirradiated sample) is about 2.7–2.9 GPa. This is higher than the baseline hardness of the SS316 sample as measured in the ‘top-down’ method, which was about 2.2 GPa. This is expected, since the indent depth here is only ~250 nm, which therefore causes the measurements to be heavily influenced by the ISE in the unirradiated layers of each sample. The hardness of the same sample in the top-down method, when measured at a depth of ~250 nm, is, in fact, close to 2.7 GPa.
In order to correct for the sample/epoxy interfacial effect, and to calculate the hardness increase due to irradiation, the hardness profile of the unirradiated sample was subtracted from that of the irradiated samples. This was achieved after aligning all the samples to the reference of zero depth at the first indent on the epoxy–sample interface. The resulting ΔH-depth profiles for the sample irradiated with 1, 2, and 3 MeV He to a fluence of 1 × 10¹⁷ ions/cm2 are given in Figure 4b [15]. Some observations that can be made from this graph are:
(i)
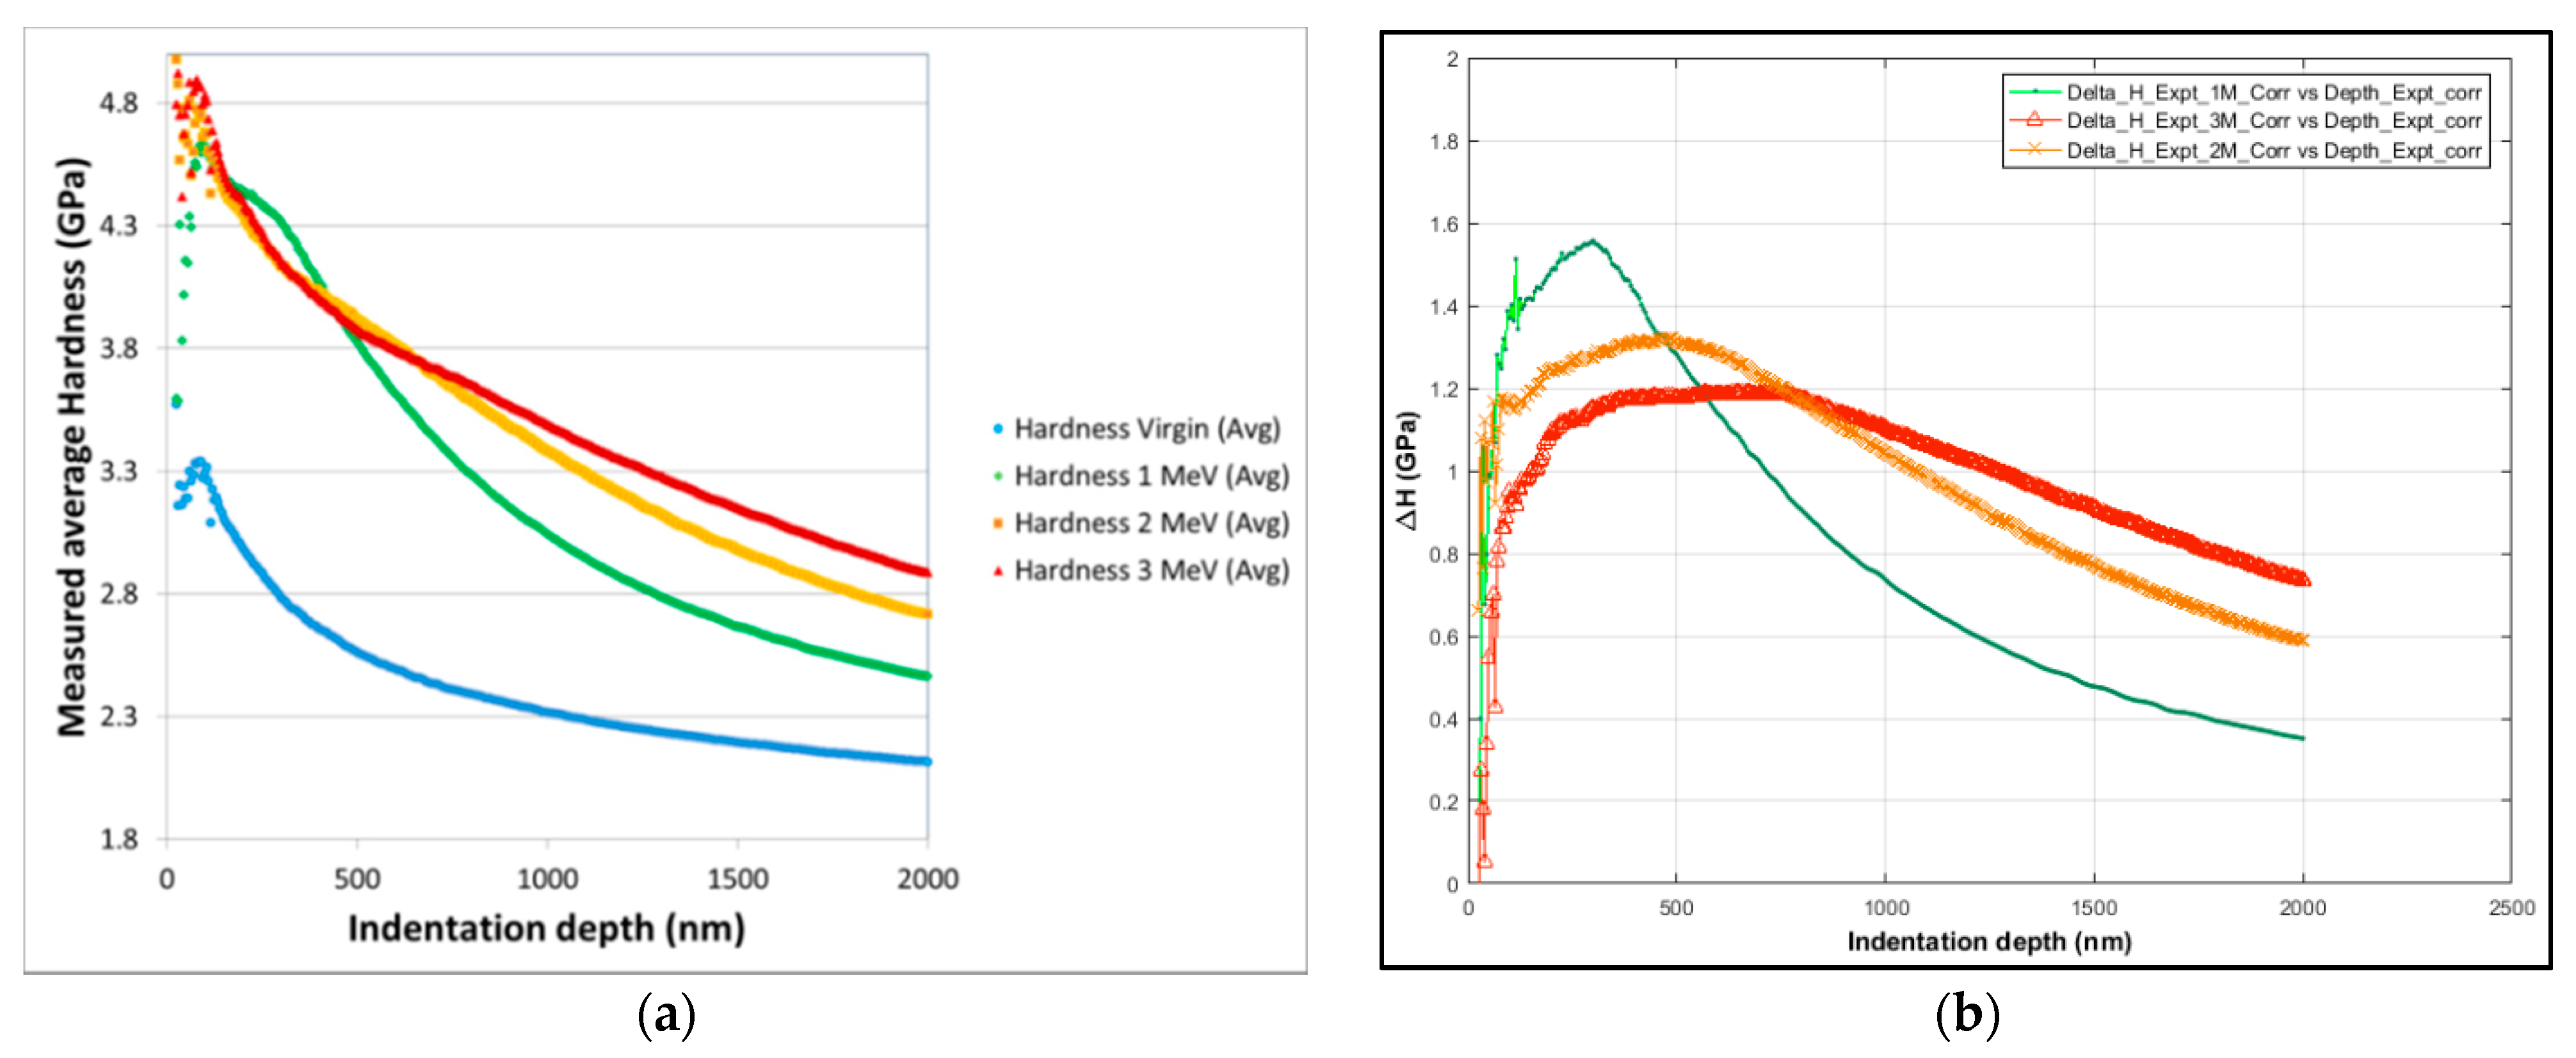
The hardness peaks increase in depth with increasing ion beam energy (i.e., with increasing depth of the displacement damage peak).
(ii)
The hardness at depths smaller than the peak hardness depth is higher than the base hardness, as expected, since this region undergoes a finite, albeit small, displacement damage. There is a distinct ‘plateau’ or ‘shoulder’ in this curve.
(iii)
The peak hardness initially increases with decreasing ion beam energy (3 MeV → 2 MeV), but decreases with further decrease in ion beam energy (2 MeV → 1 MeV).

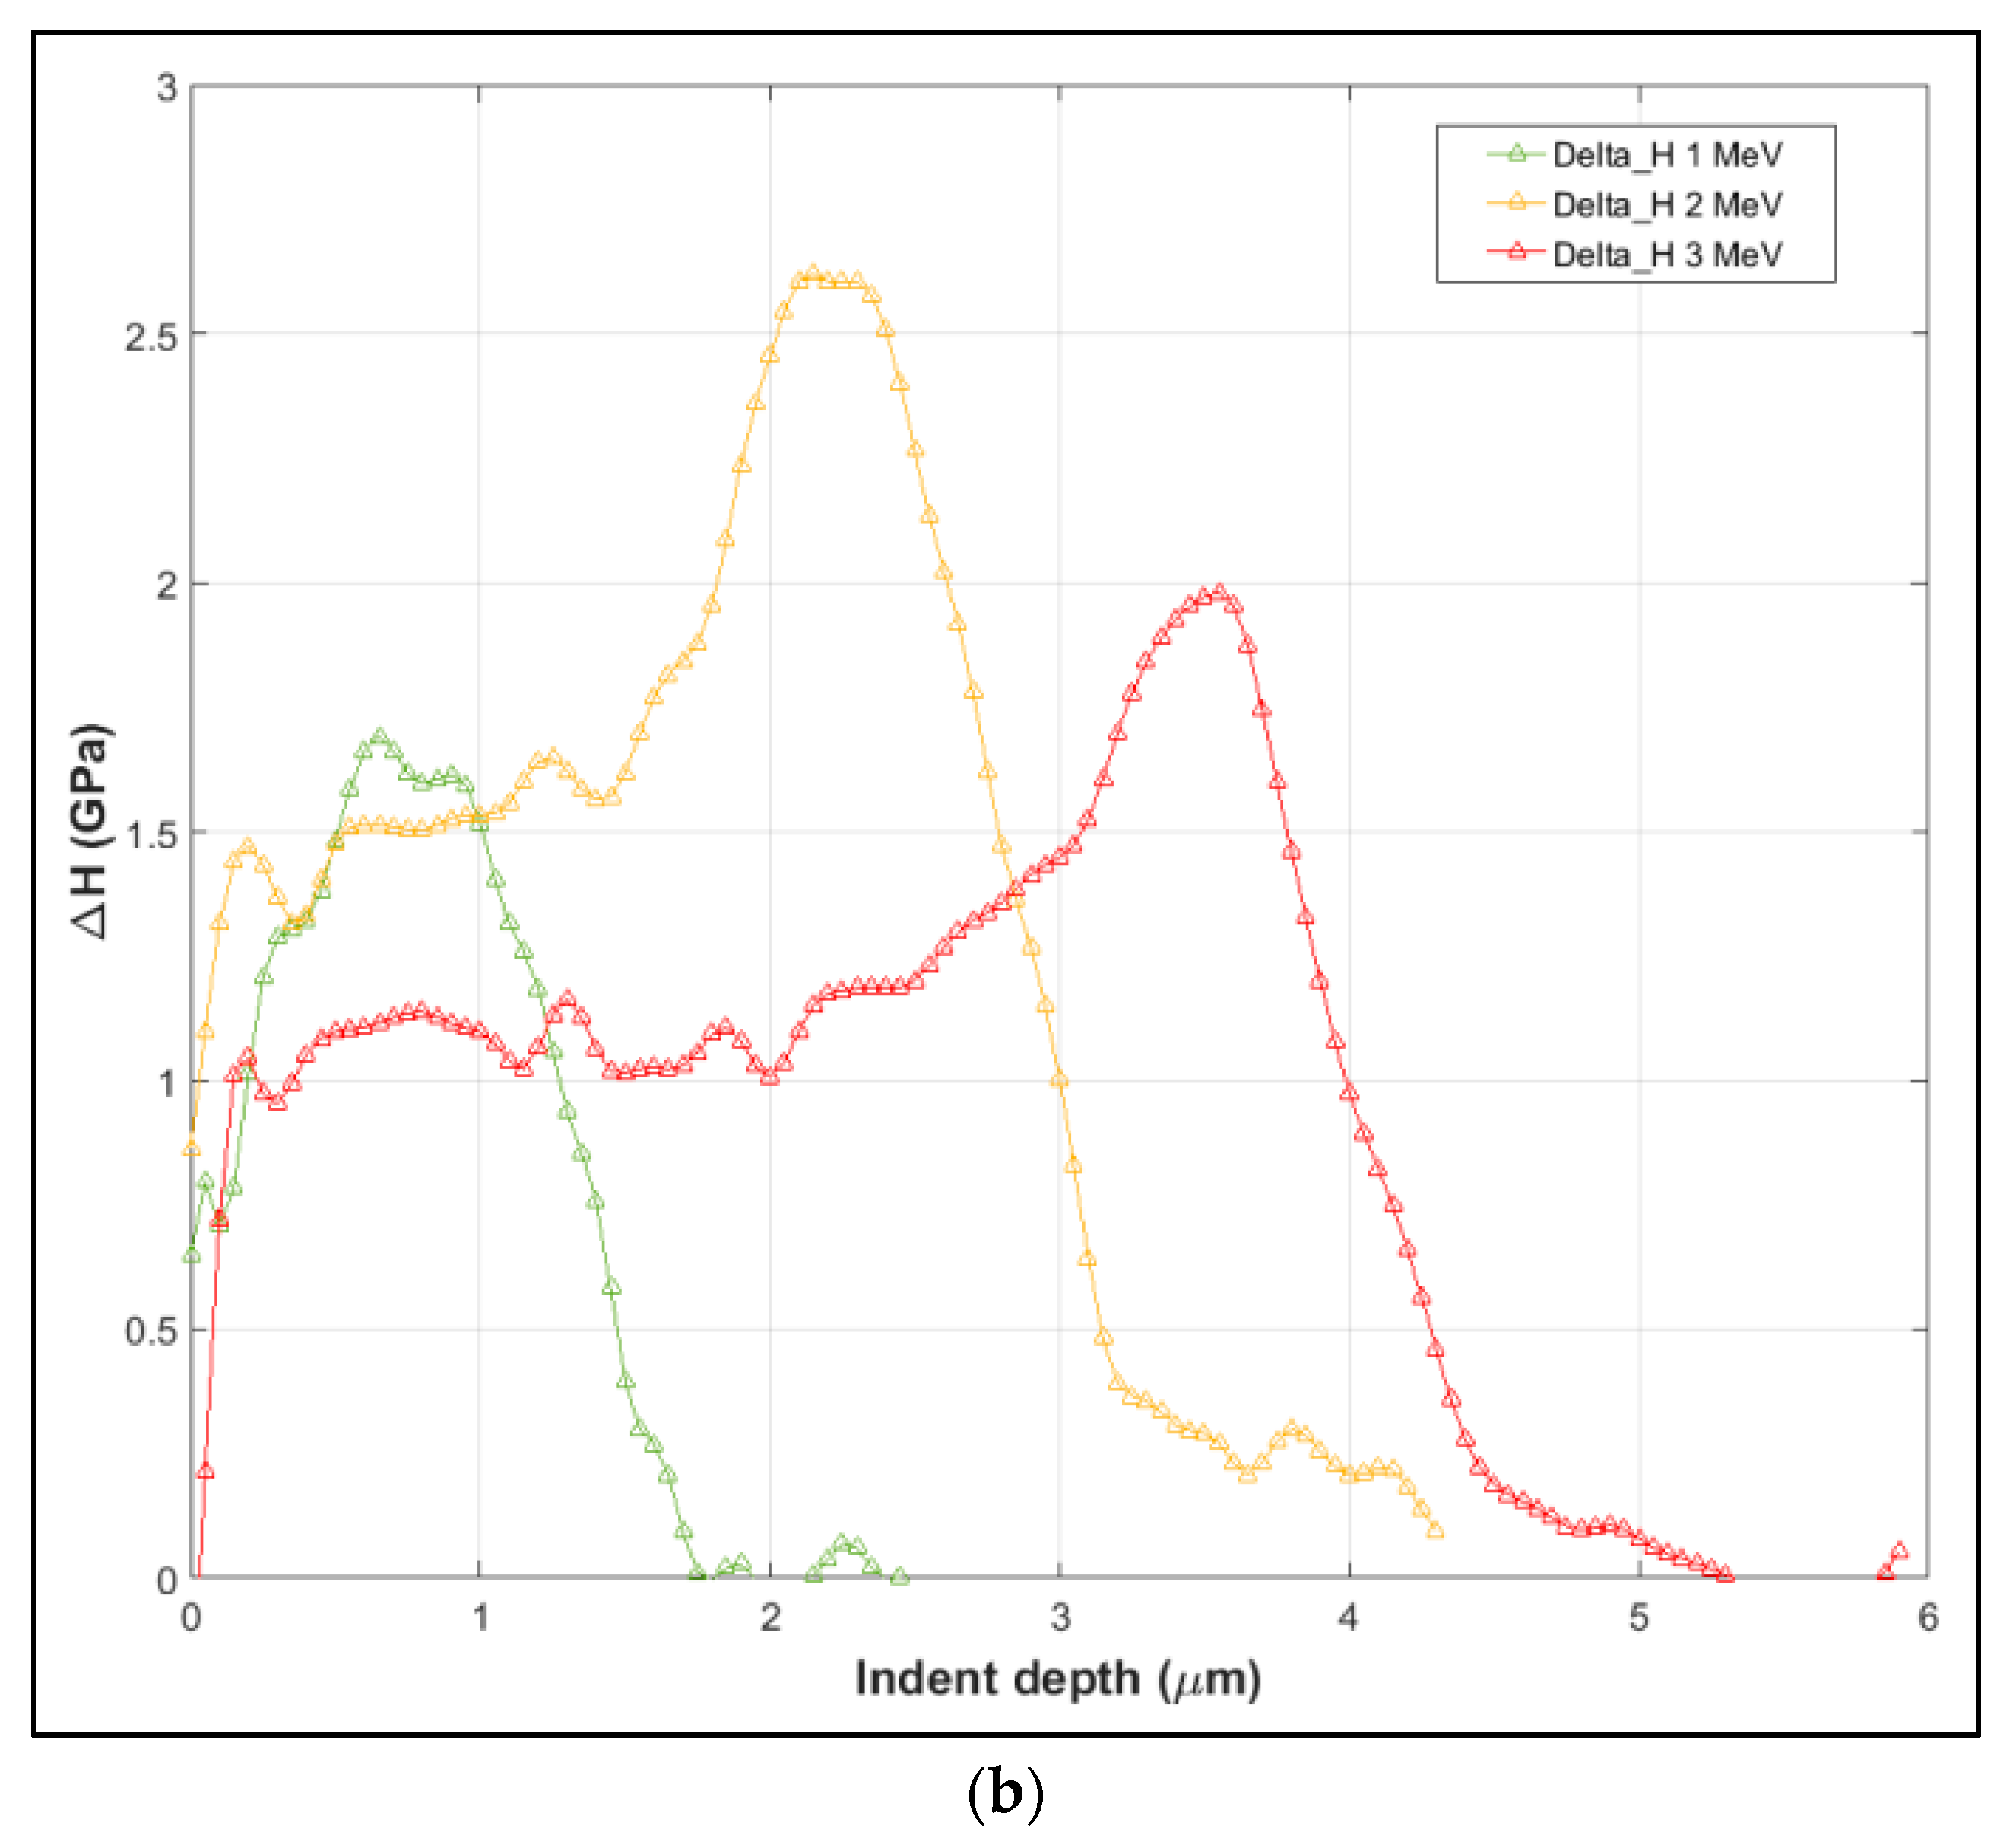
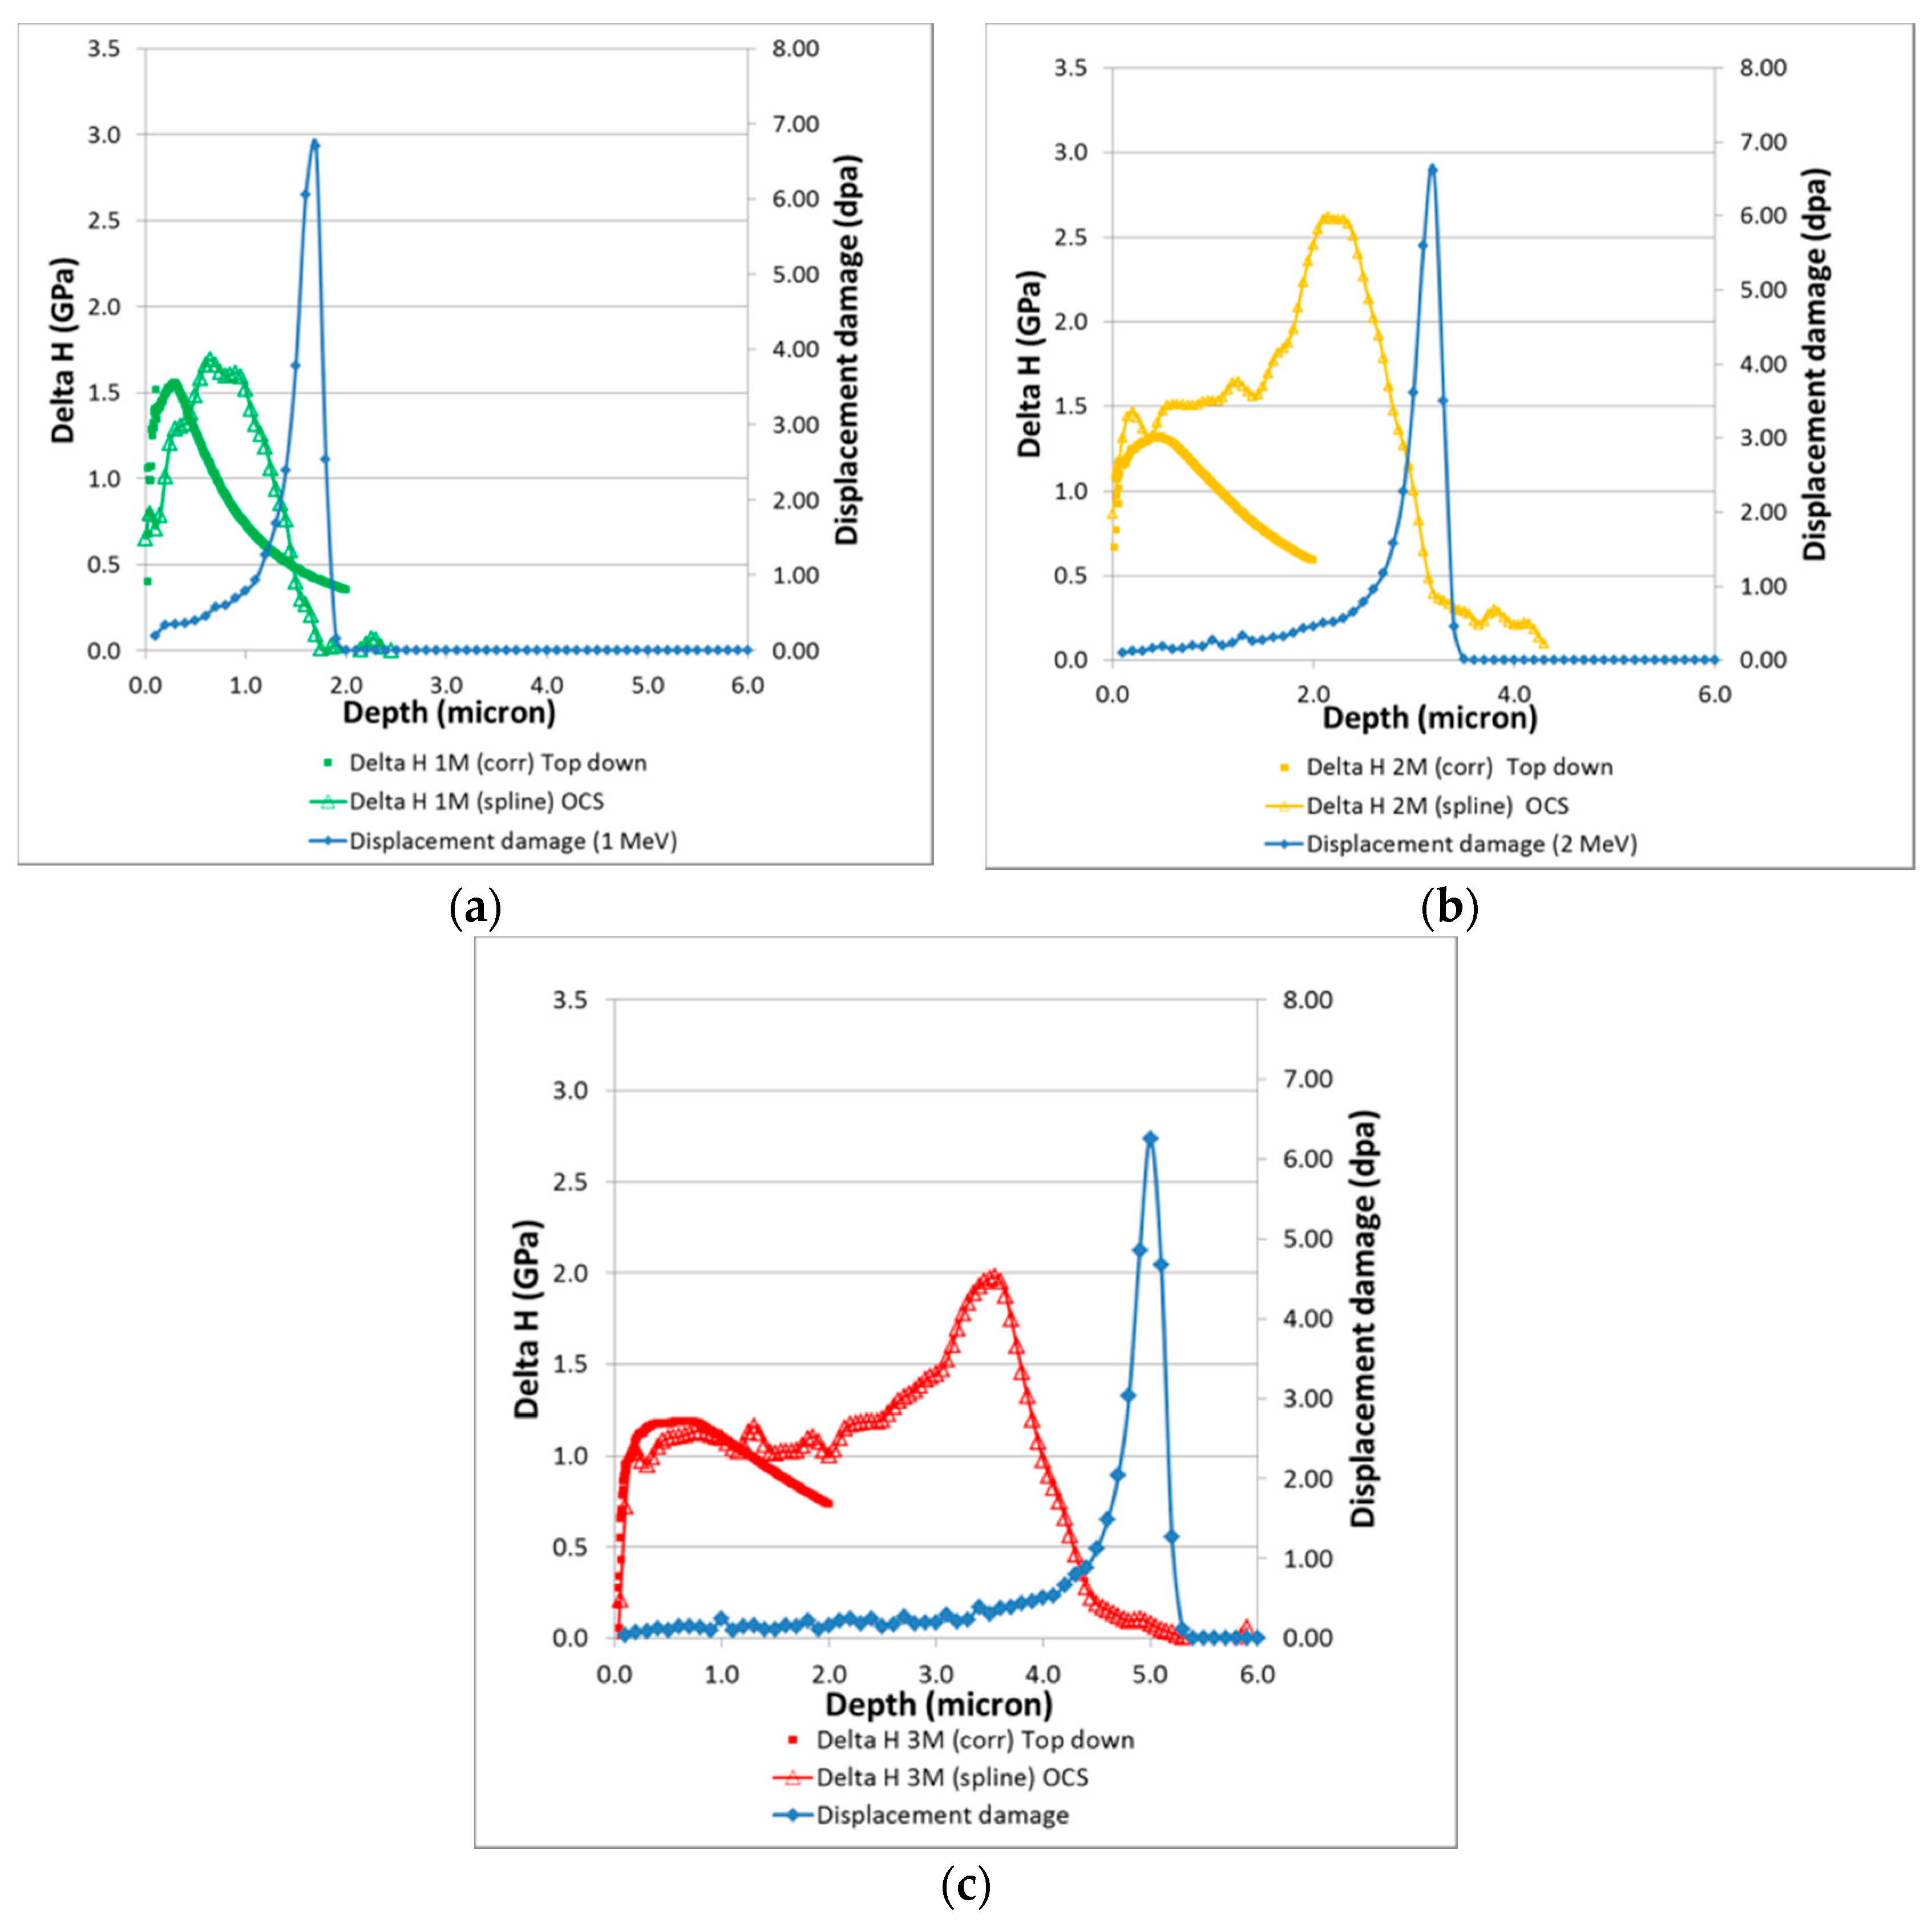
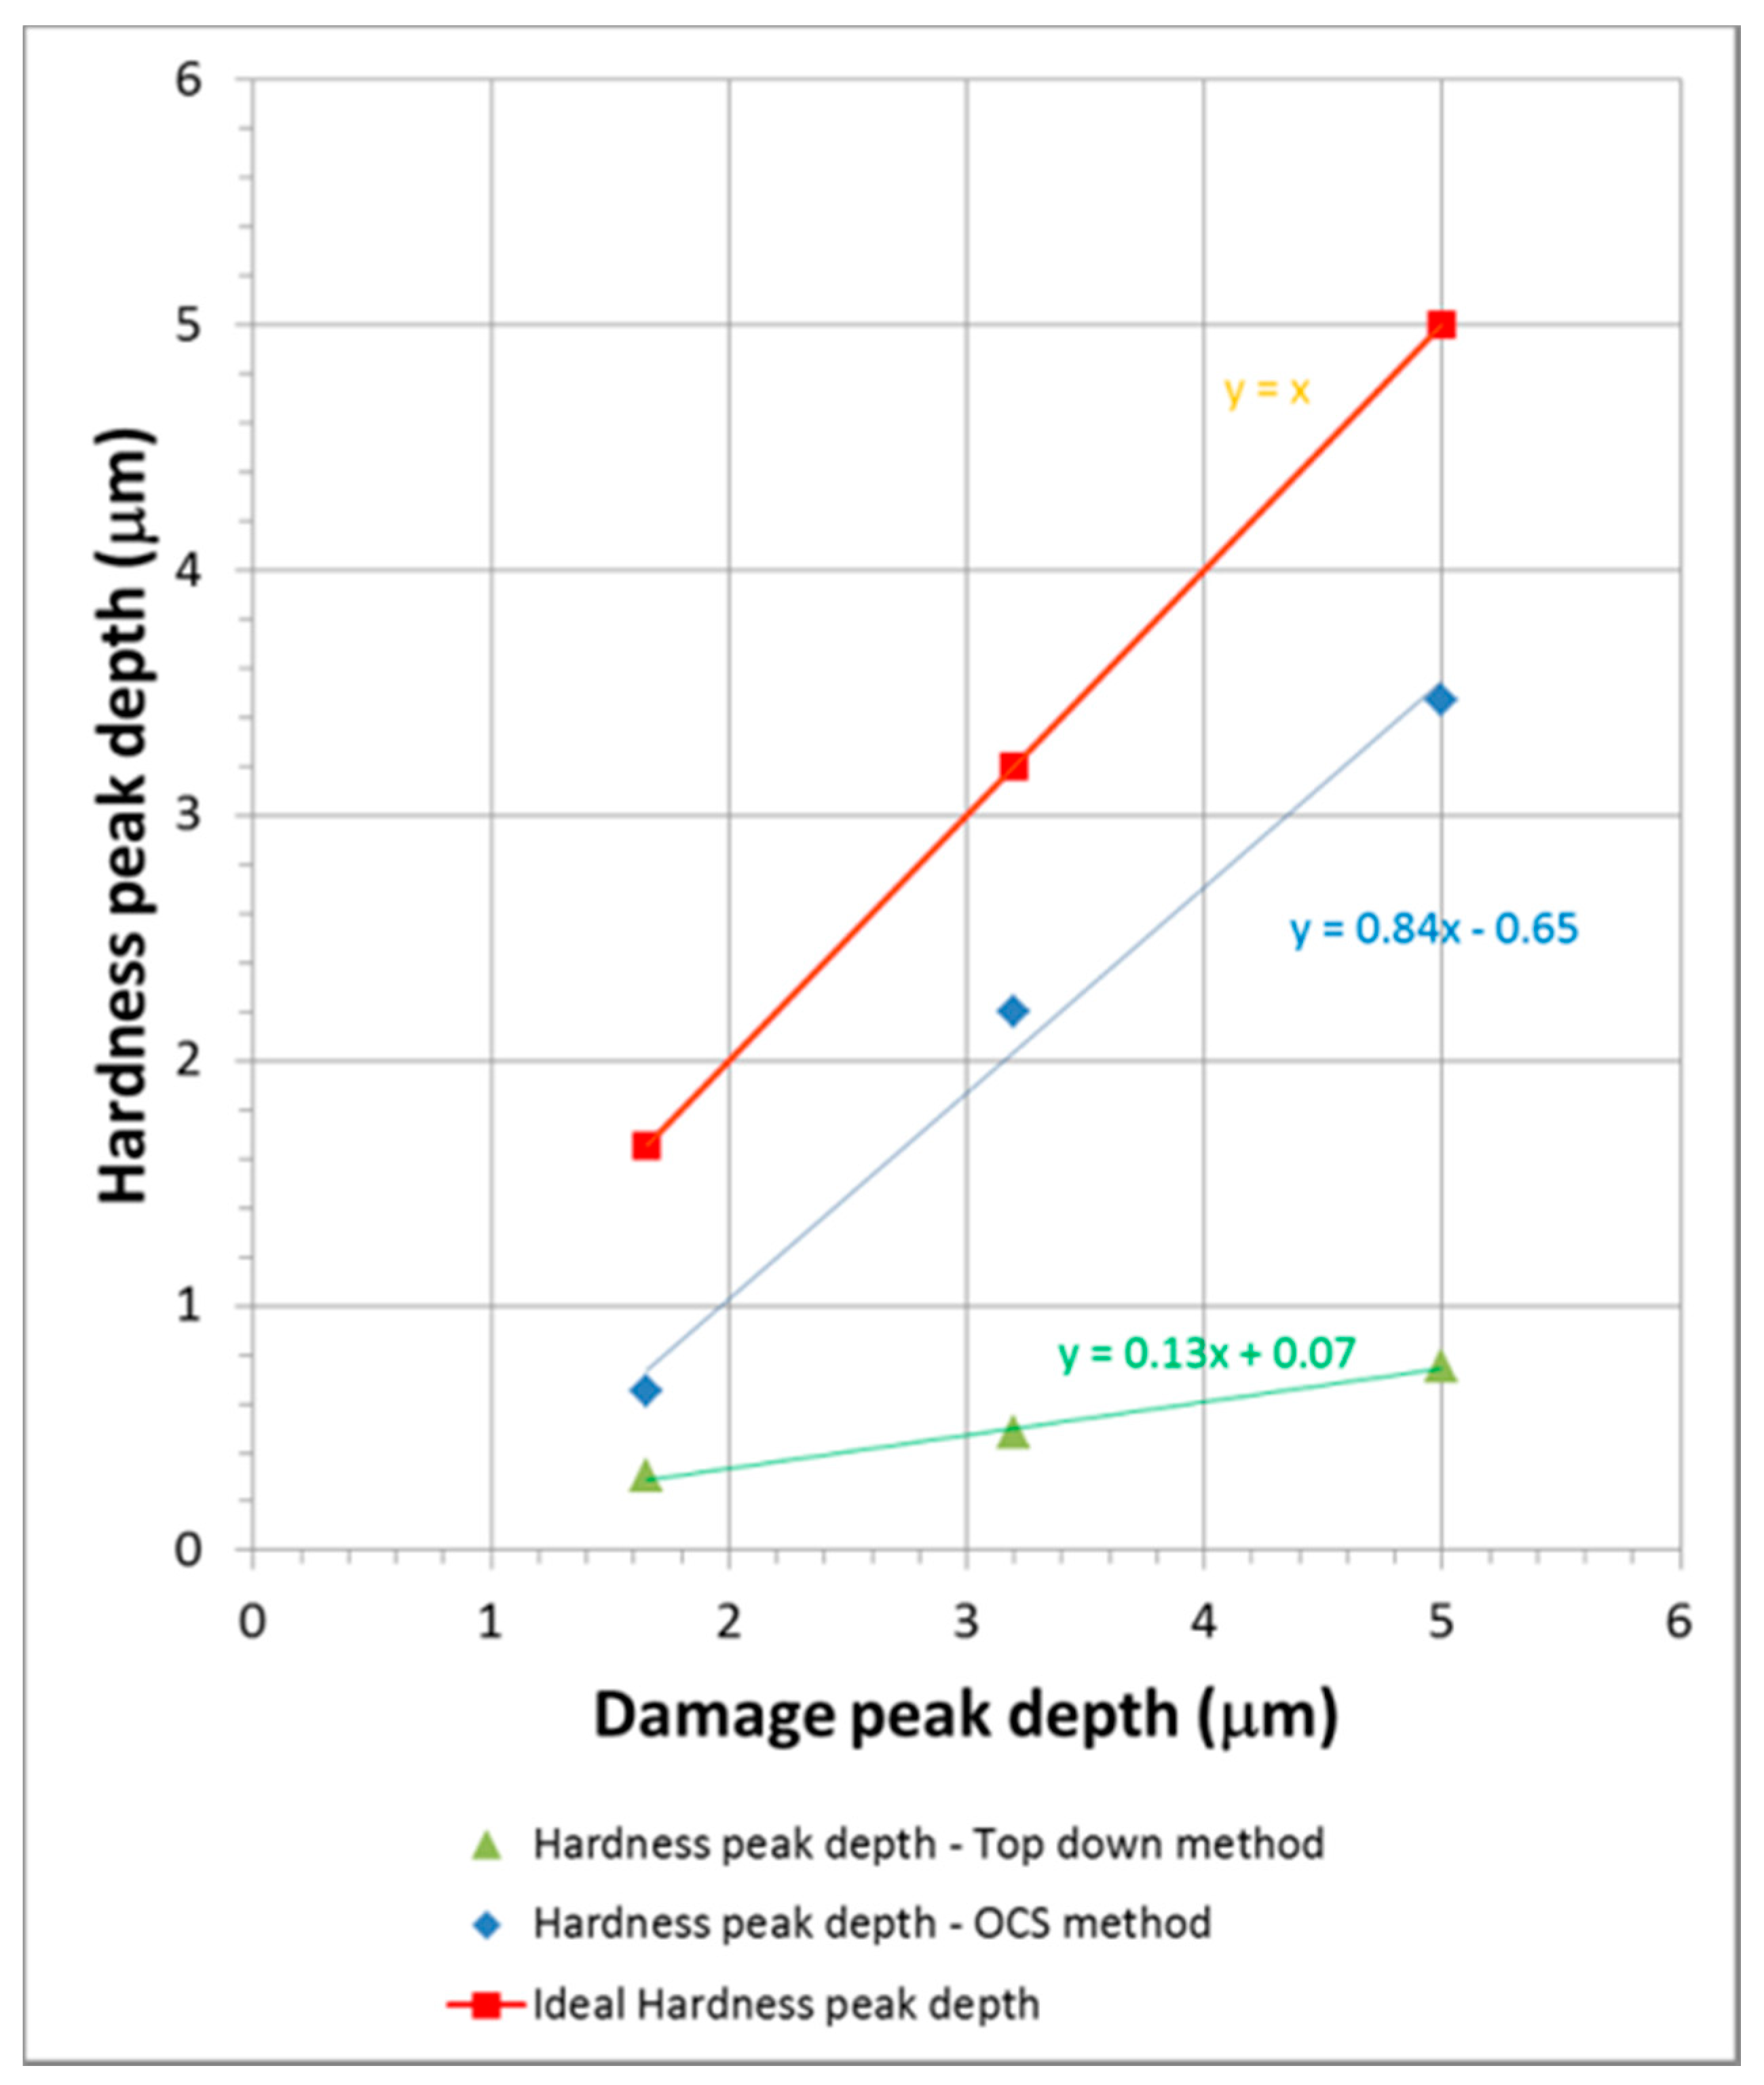
3.2.3. Comparison of Hardening Profiles

In order to be able to compare the two methods directly, the ΔH-depth graphs for both methods are plotted along with the dose-depth profile for 1, 2, and 3 MeV irradiation in Figure 5a–c respectively.
The peak increase in hardness ΔH, the ΔH peak position and the damage peak position for the three samples is given for both top-down (TD) and OCS methods in Table 2 below.
Some important observations can be made immediately from these plots:
(i)
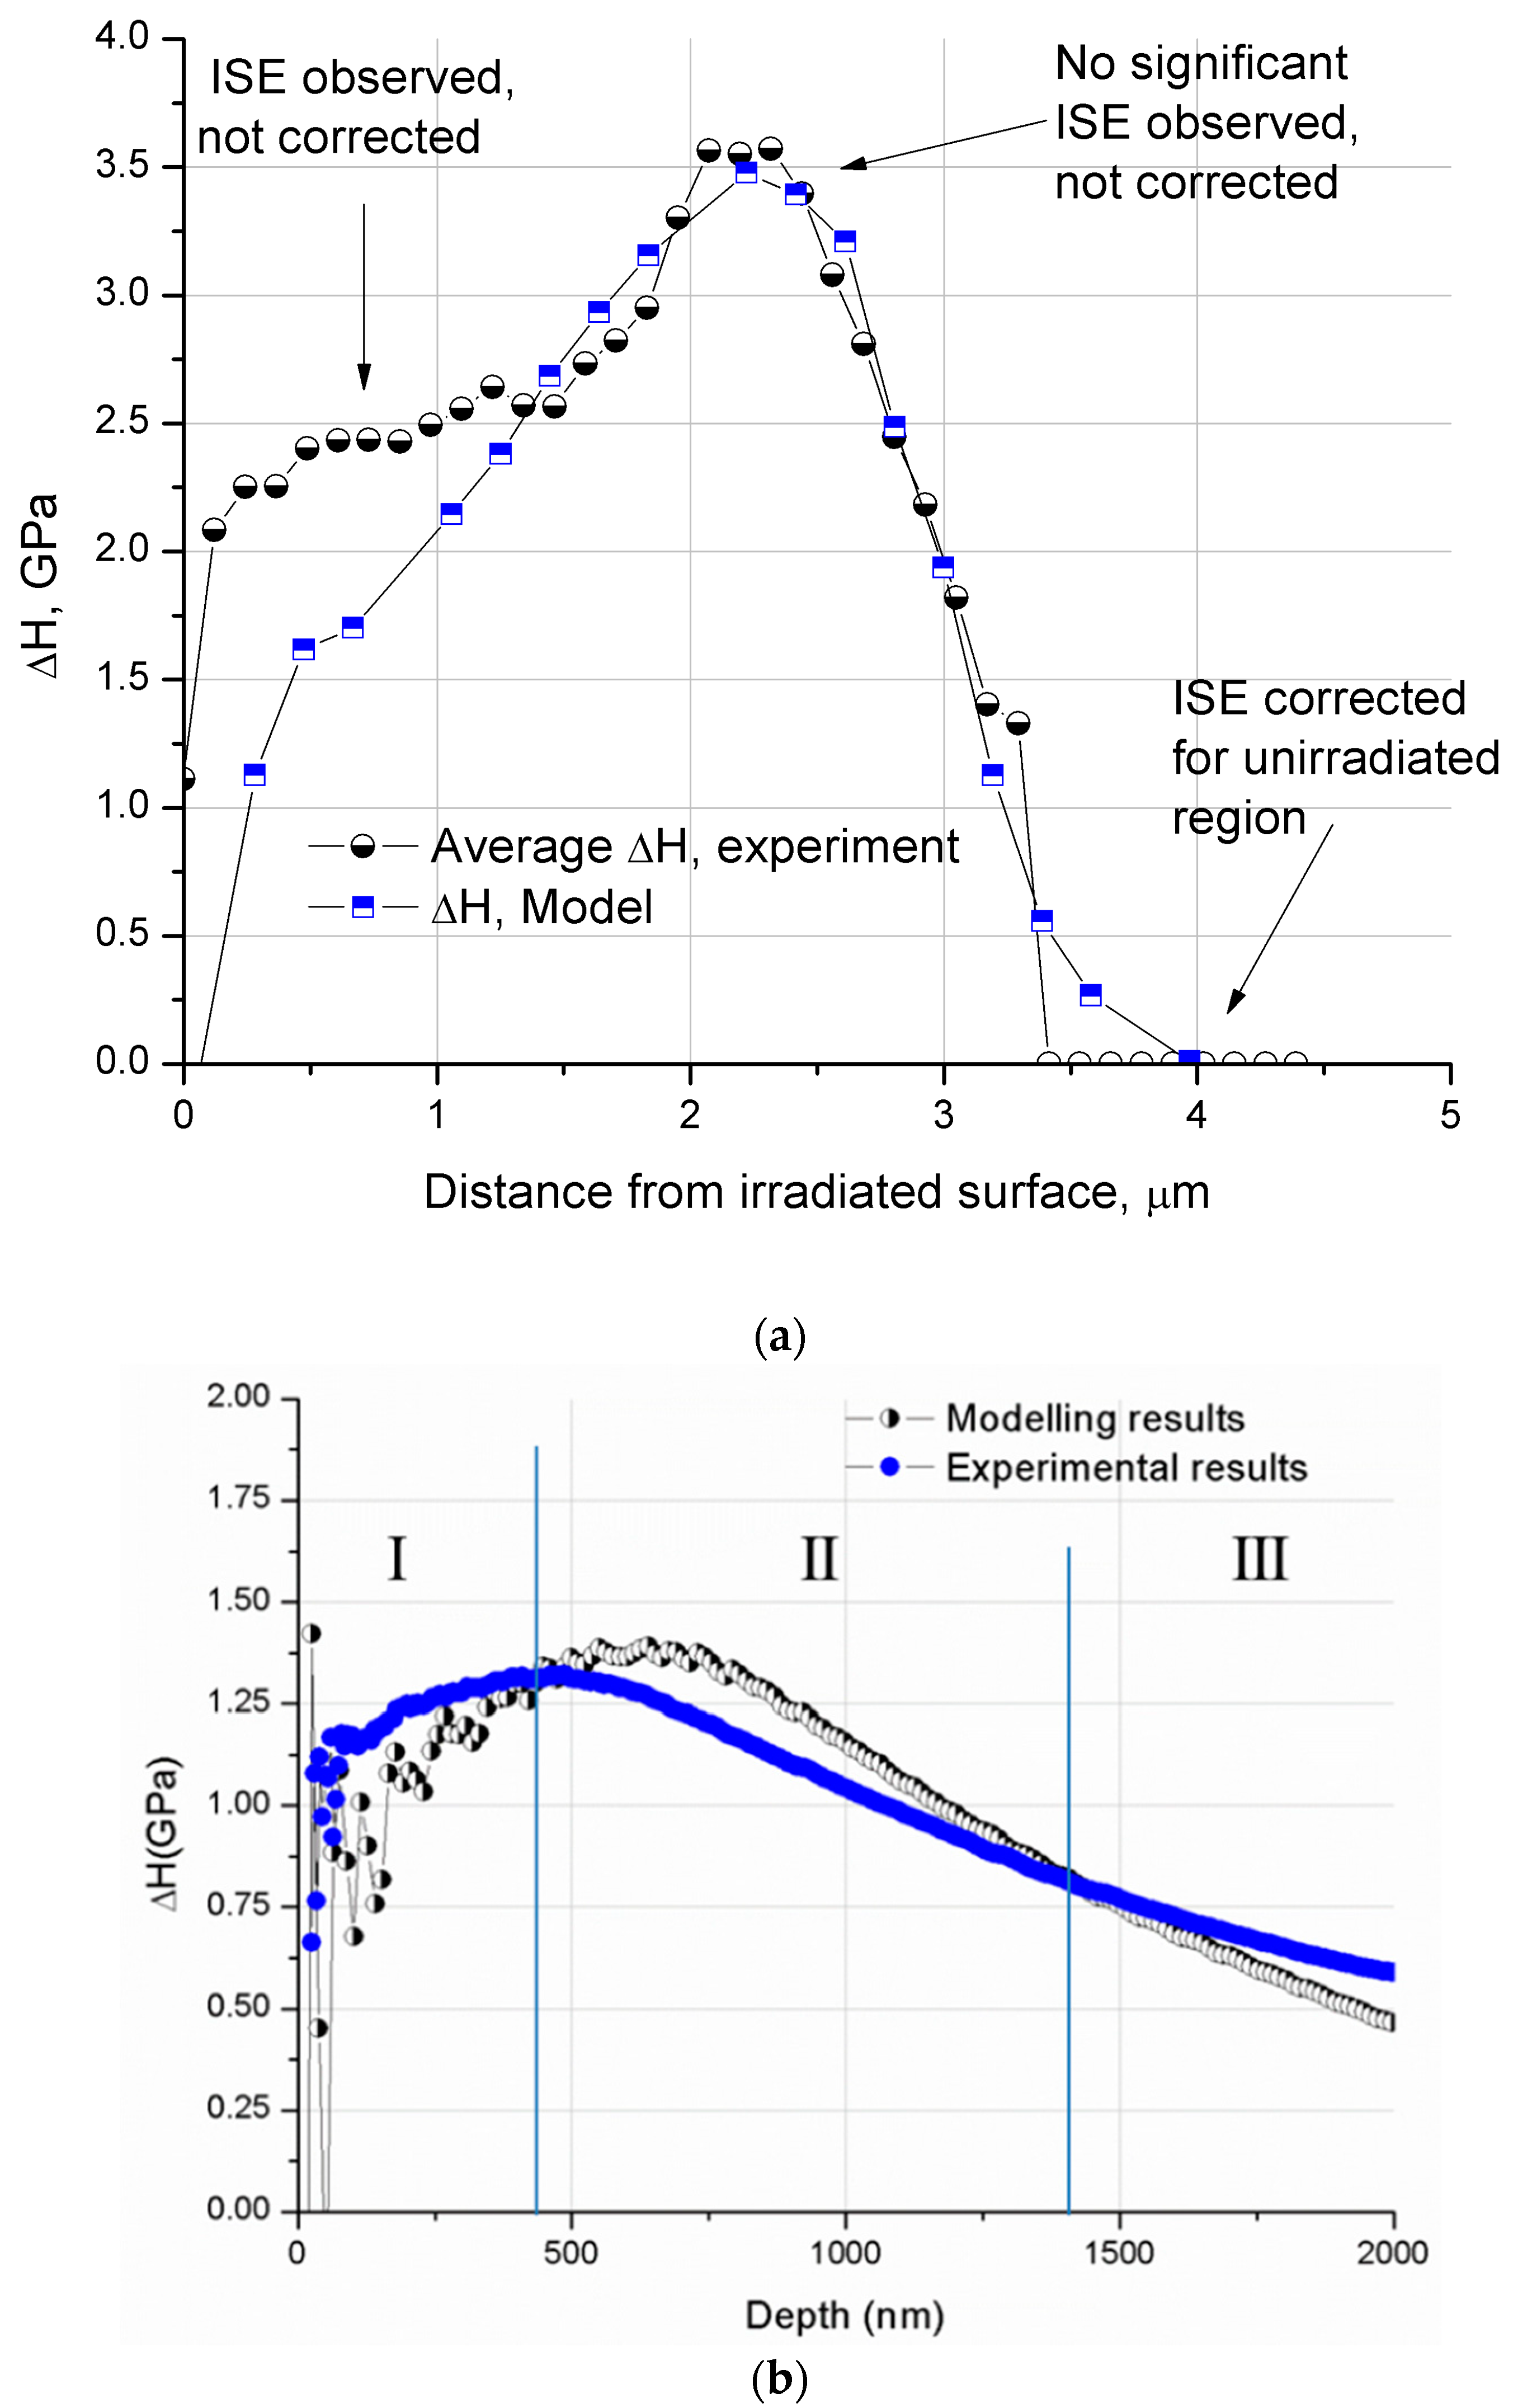
The peaks of the ΔH plots for all irradiated samples are much closer to the displacement damage peaks for the respective ion energies in the ‘oblique cross-section’ method than in the ‘top-down’ method.
(ii)
The position of the ΔH peaks in the OCS method is more sensitive to the ion energy. The peaks of the ΔH plots move from~0.3 to 0.75 μm for the top-down method, while they move from ~0.65 to 3.55 μm in the OCS method, when the ion energy increases from 1 MeV to 3 MeV.
(iii)
The ΔH peaks in the OCS method are much sharper and more prominent for all ion energies, compared to those in the top-down method, for the 2 and 3 MeV irradiated samples.
(iv)
There is a well-defined shoulder region in the low dose area, followed by a peak, in the OCS method, while no such distinct regions corresponding to the regions of different dose are found in the top-down method.
The hardness peak positions are plotted against the calculated SRIM damage peak positions for SS316 samples for both the ‘top-down’ method and the ‘oblique cross-section’ method in Figure 6. It is clear from this plot that the relationship between the hardness peaks and the damage peaks is linear or nearly linear for both methods. However, the slope of the line for the OCS method (~0.84) is much higher than that of the top-down method (0.13), and the difference of the data points from the peak damage depth is much smaller in the OCS method, as is also visible from the ΔH-depth profiles.
At this point, it is pertinent to mention that the elastic modulus of a material depends on the atomic bonding—i.e., the bond distance, bond angle, type of atoms, type of bonds, etc. Since the ion irradiation process creates clusters of defects, which leaves the structure of the crystal around them mostly unaffected, it is expected that this process would not cause measurable, statistically significant changes in the modulus.
Our measurements of the modulus from the oblique cross-section tests, which yielded only one value per test (at an indentation depth of ~250 nm), indicate that the elastic modulus, E, fluctuated between an average value of ~193–230 ± 25 GPa, exhibiting no correlation with the irradiated layer depths, and being more or less equal even at the unirradiated layers. When the modulus was measured in the top-down method, it yielded a similar average value −215 ± 15 GPa in the unirradiated sample and 225 ± 10 GPa in the 2 MeV irradiated sample at a depth of 250 nm. Thus, no significant changes in modulus could be seen as a result of ion irradiation, even at a region near the peak of ΔH in the top-down method.

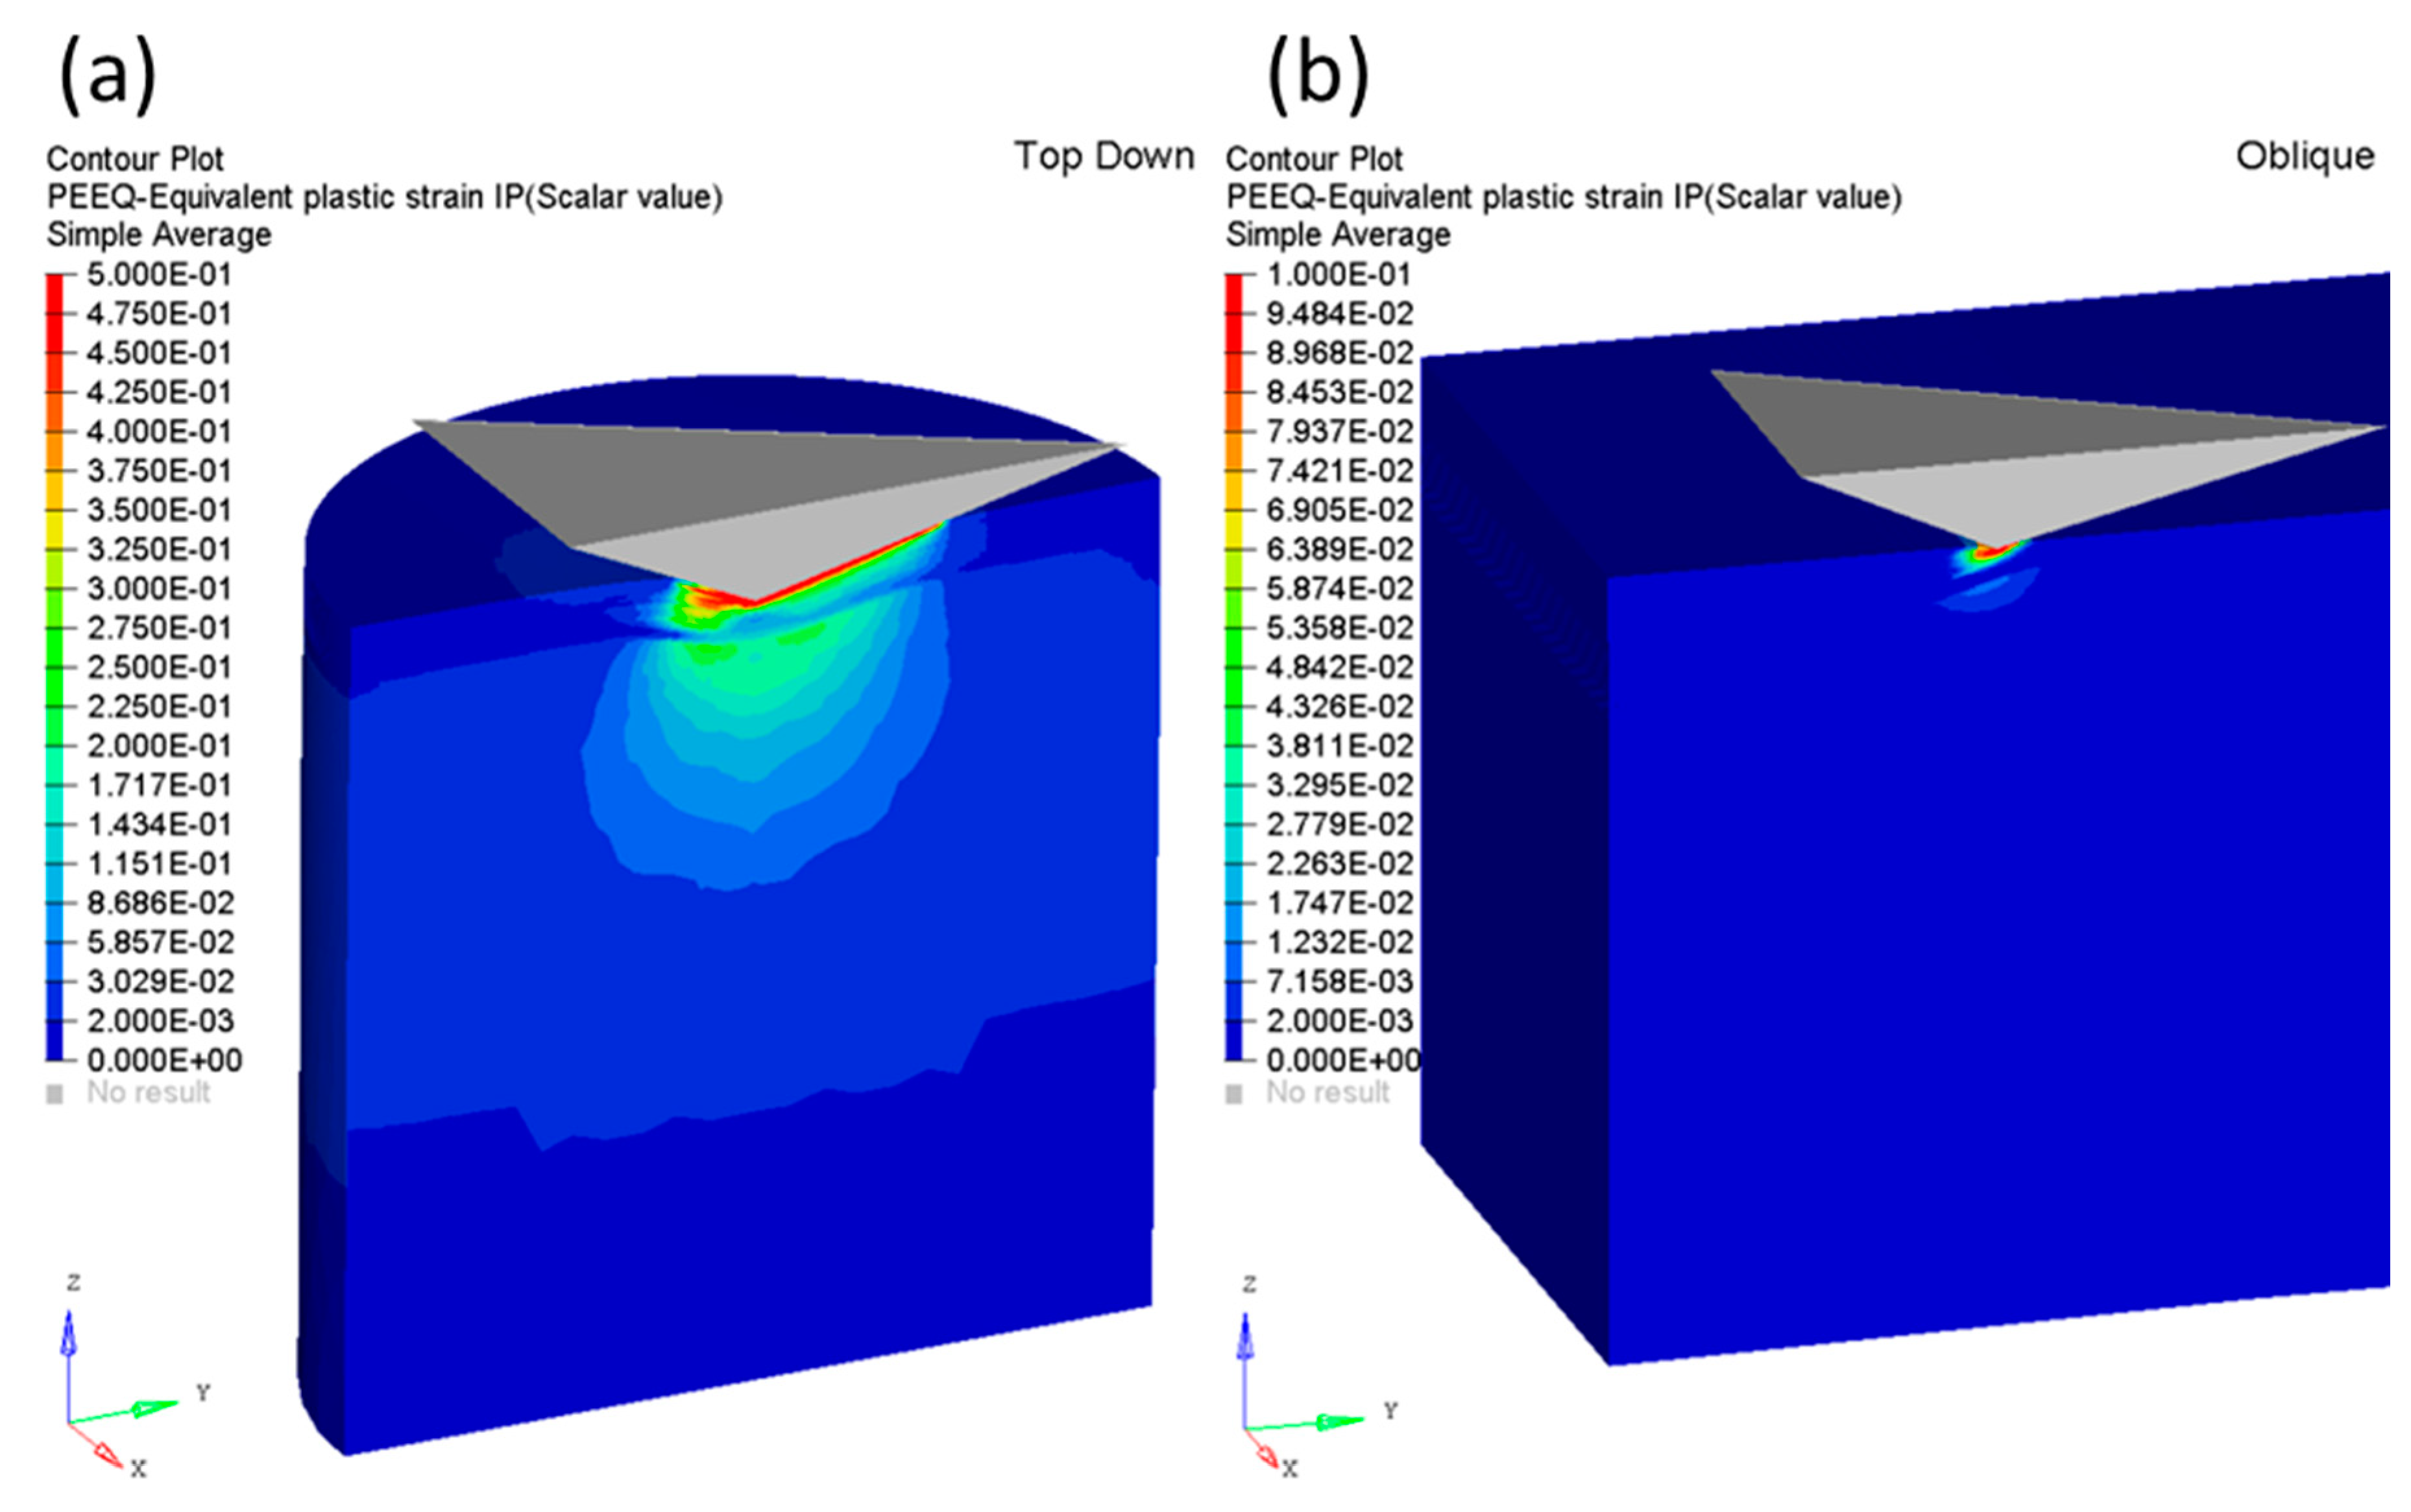
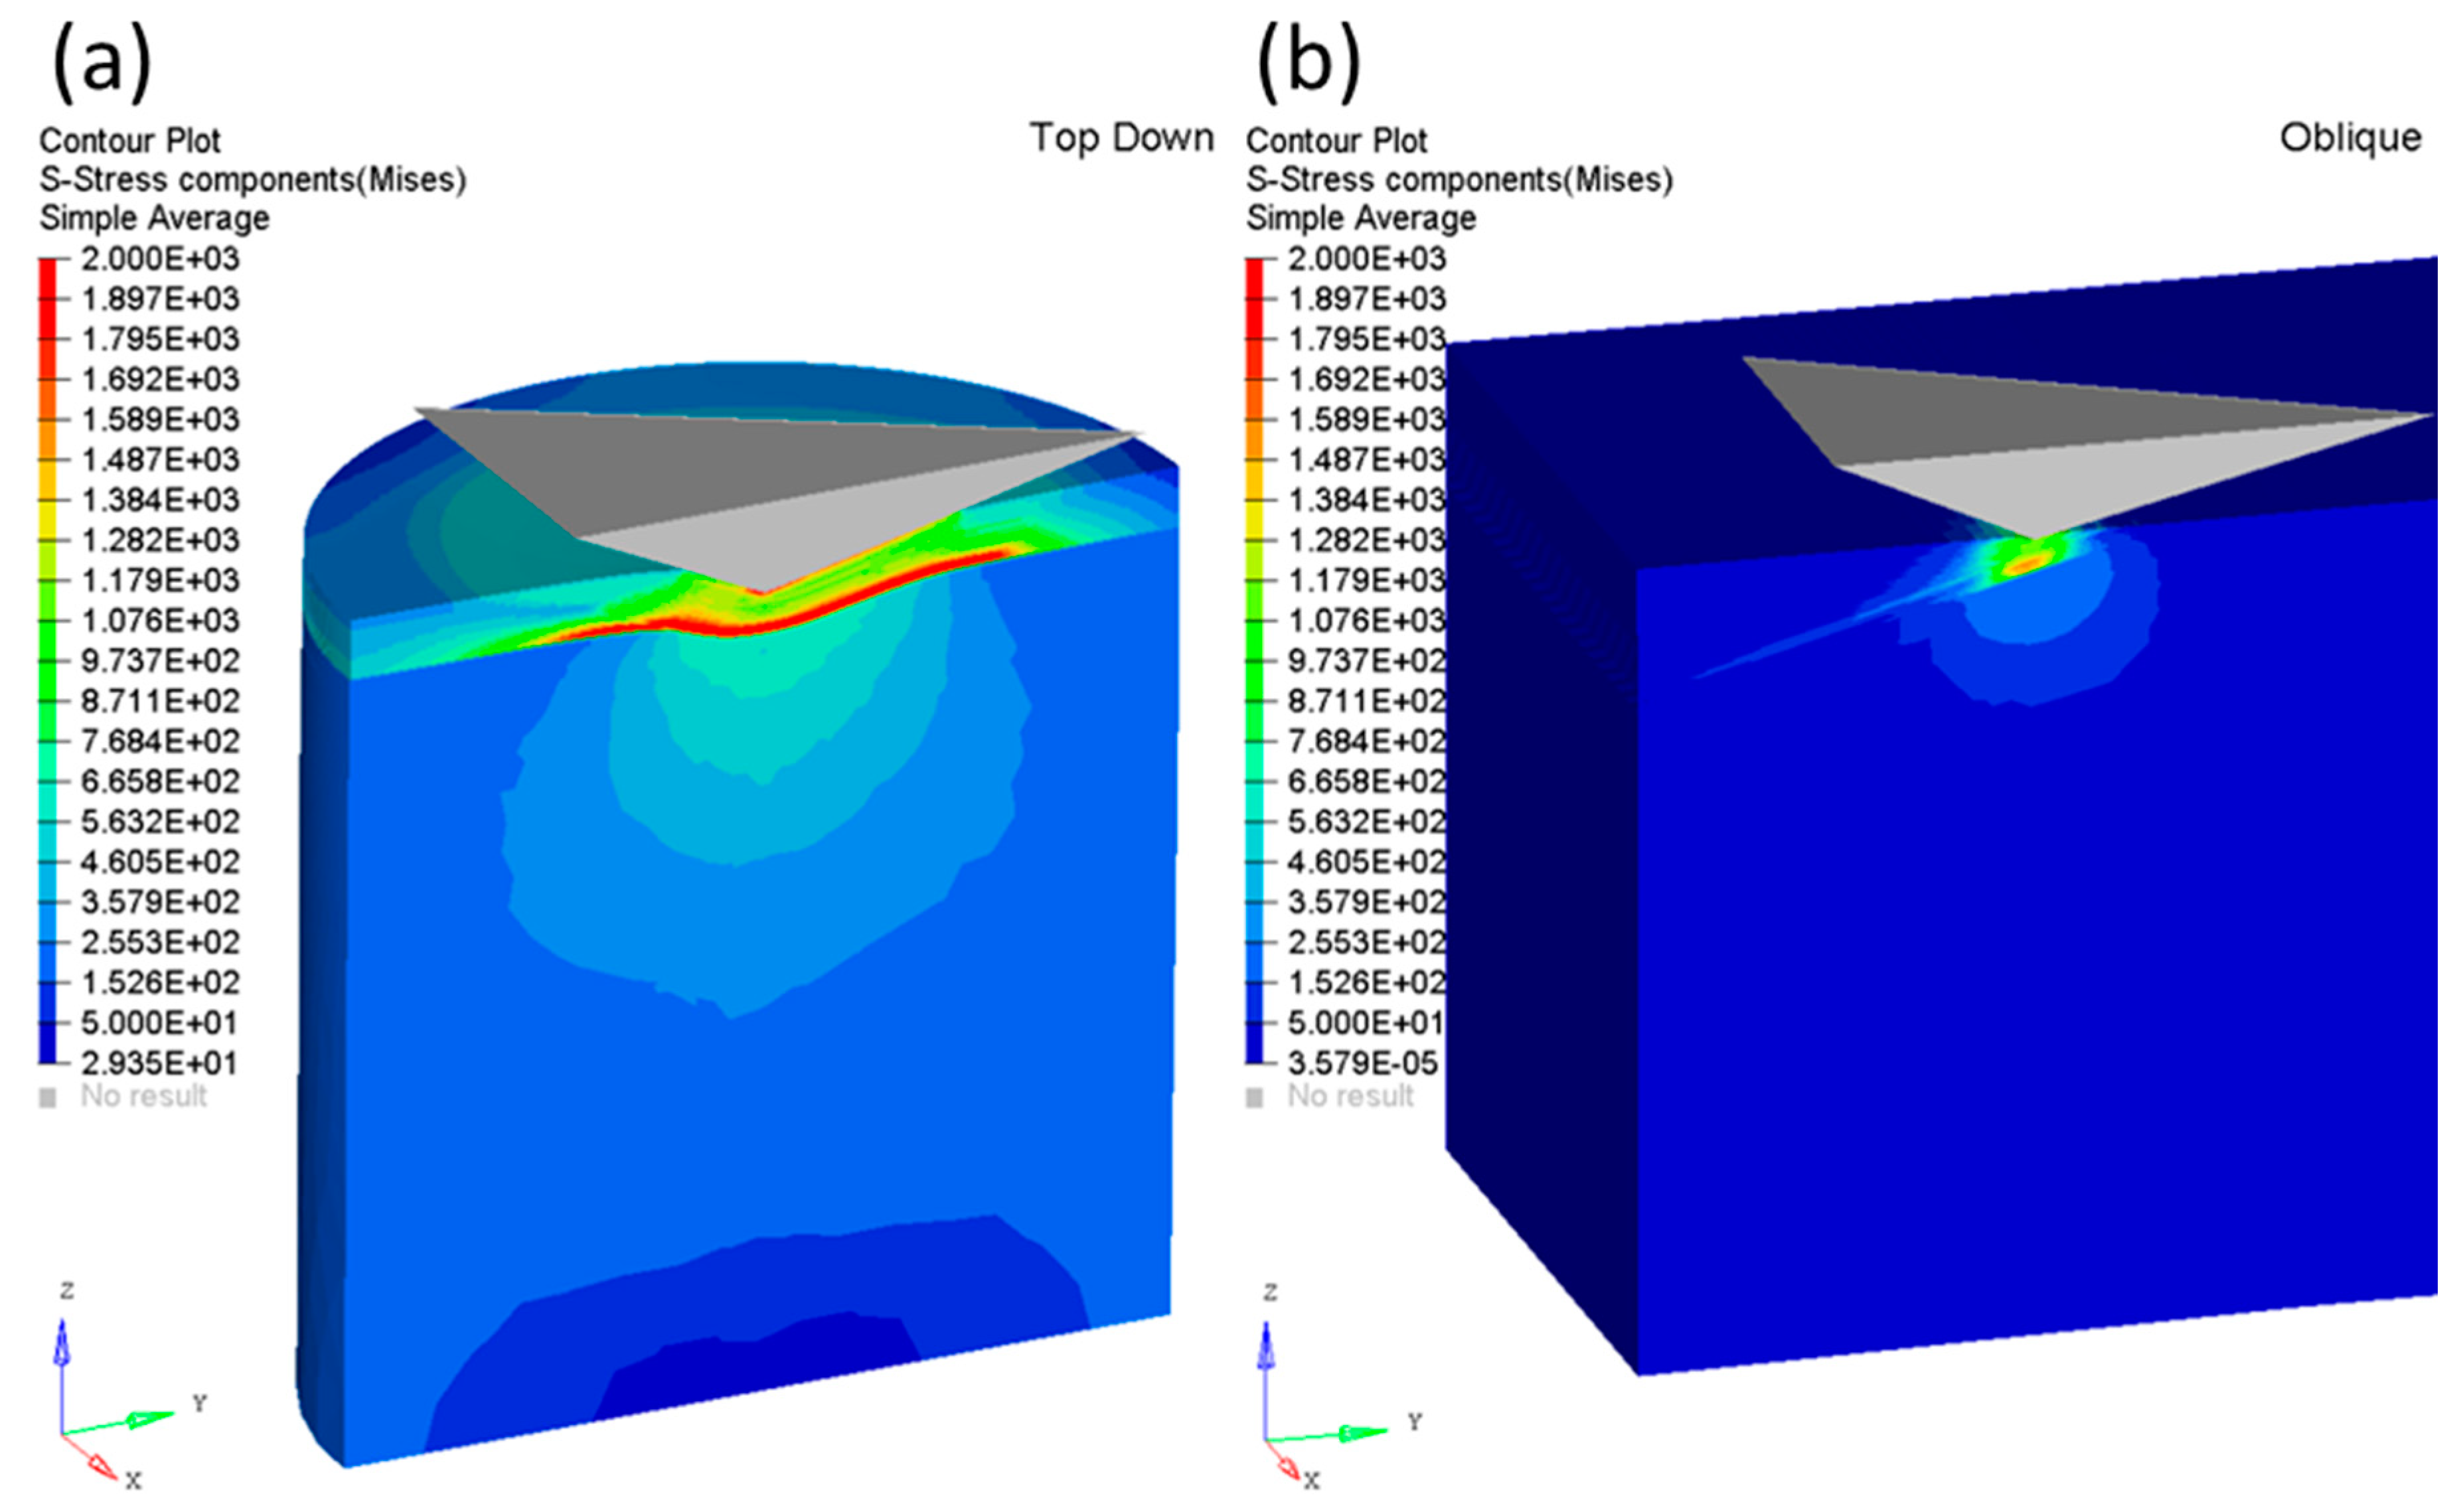
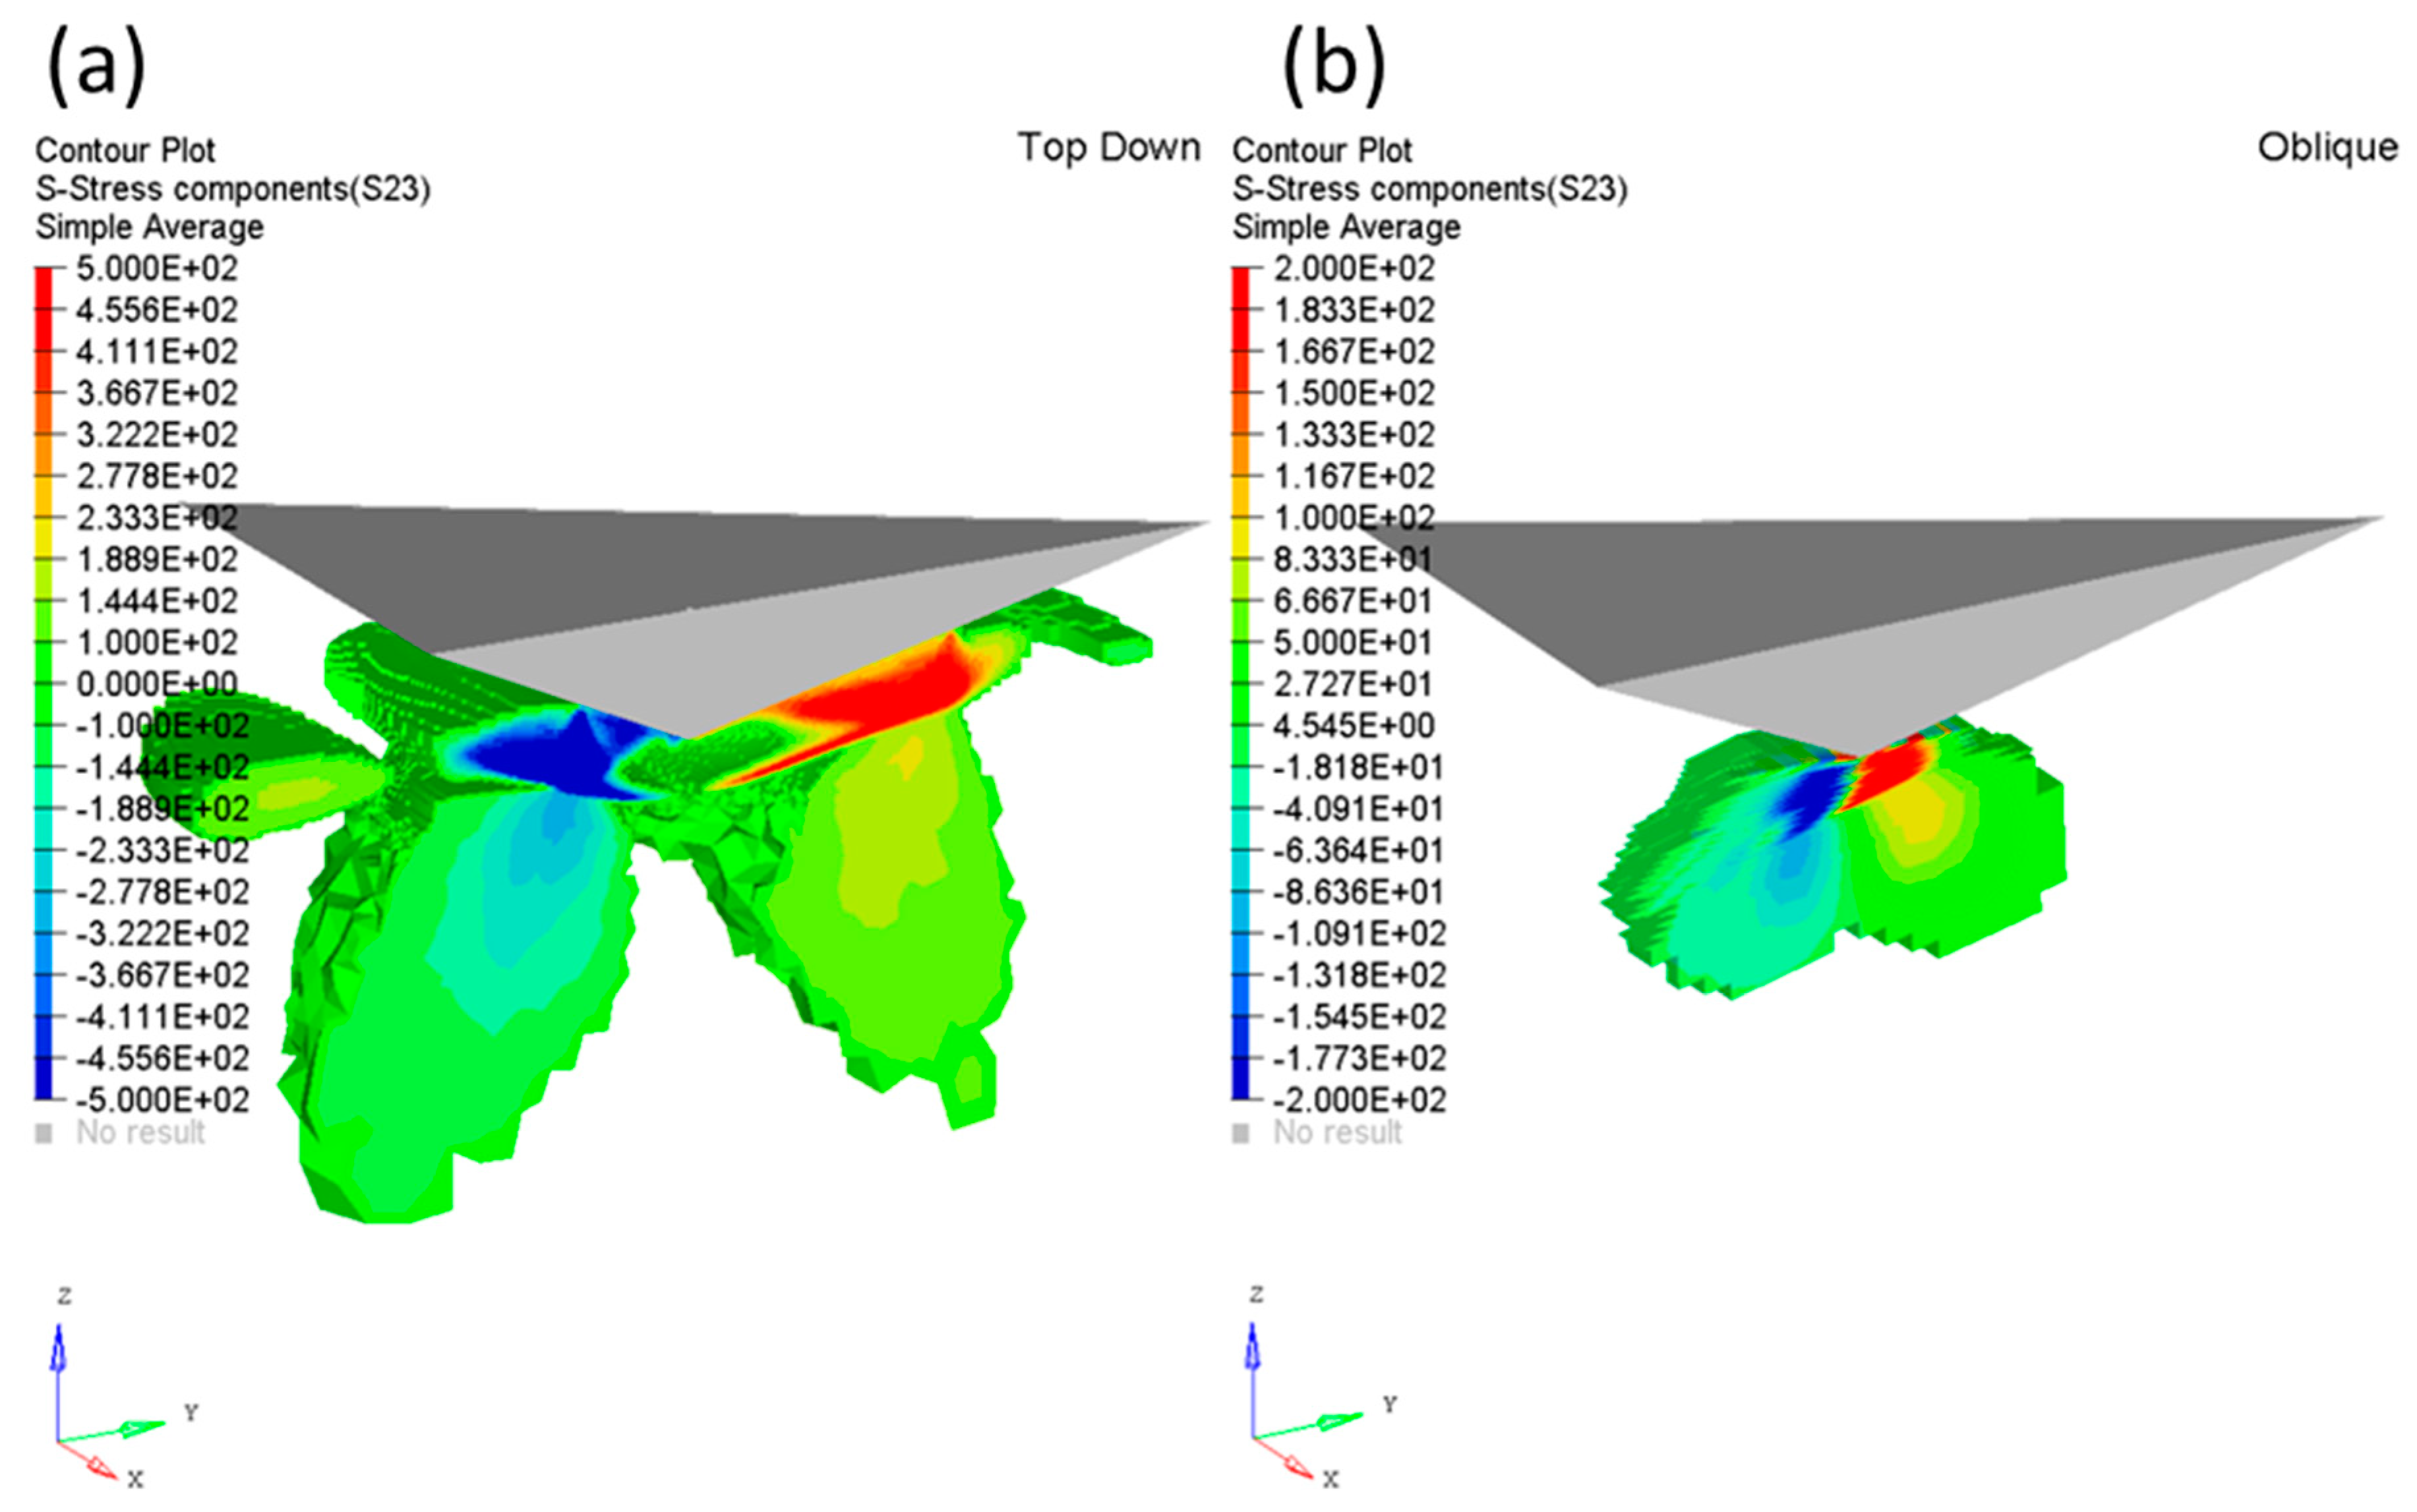
3.3. Finite Element Modelling

In this section, an effort is made to perform a comparative study of the phenomena involved in the two different methods of nanoindentation by finite element modelling (FEM). Experiments by Byun et al. [19] on SS316 suggests that hardening due to irradiation is comparable to hardening by deformation-induced dislocation formation. The approach taken herein is analogous to the study detailed in the authors’ previous work [14], where the influence of the most pronounced Frank loop obstacles [20] and forest dislocation obstacles in stainless steel are reduced to a simplified fitted model, where σrad0,dpa) is a first order function that expresses the irradiated hardening and provides a continuum level bulk property response as outlined in [21]
σrad = σ0 + K√dpa
Fitting this unsaturated damage model to the experimental SS316 tensile data in [22] provides a K value of approximately 990 MPa/√dpa, which the authors have rounded up to 1000 MPa/√dpa for simplification. The fitting of the data was carried out in MATLAB [17] using the non-linear least squares fit which solves for
min x | | f ( d p a ) | | 2 = min x ( f 1 ( d p a ) 2 + f 2 ( d p a ) 2 + + f n ( d p a ) 2 )
where f(dpa) is the user defined function, which computes the vector value-function using the Levenberg–Marquardt algorithm with equal weighting to all data, as shown in our earlier work
f ( d p a ) = ( σ 0 + K d p a ) σ r a d
The fitting exhibits small under-predictions for low irradiation doses and over prediction at higher irradiation levels, as outlined in our earlier study. The domain discretisation for each model differs insofar as to allow for the designation the material properties in the direction of sample orientation. The top-down approach employs larger domain to account for the larger indentation depths, 2000 nm (vs. 250 nm for oblique specimen), with the irradiated layers discretised horizontally. In the oblique nanoindentation method the elements are oriented at 15° to the horizontal plane with a material property variation to represent the slanted irradiation layers. The two different configurations are shown in the schematic diagrams of Figure 7a,b, respectively.
An isotropic hardening elastic-plastic material model is used for the SS316 in ABAQUS/Standard 6.12 [23]. The baseline data is derived from tensile tests on virgin material which is subsequently coupled to the SRIM calculations for the irradiated layers. The hardness results reported are expressed in terms of computed hardness derived from the load and area function of the Berkovich tip. The material is characterized by the experimentally derived elastic modulus, E = 192 GPa, Poisson’s ratio, ν = 0.3 and a yield stress versus plastic strain curve as user inputs for the varying dpa outlined in the earlier study [14]. In the following treatment, we compare the results of the modelling of the samples irradiated with 2 MeV He2+ ions, tested in the top-down and the OCS mode.
The simulated plots of the hardness difference (ΔH) vs. indenter depth, along with the experimental plots, for the ‘oblique’ (non-CSM) mode are shown in Figure 8a, while those for the increase in hardness due to irradiation (ΔH) for the ‘top-down’ (CSM) indentation method are presented in Figure 8b. The shallow indentation depths of the oblique method provide a hardness plot (Figure 8a) characterised by a shoulder region with a plateaued hardness level left of the peak hardness value. The result exhibit an ISE in the shoulder region which cannot be corrected, conversely in the highly irradiated regions the plots are in a good agreement indicative of a greatly diminished ISE in those areas. The model results underestimate the hardness in the shoulder region with a larger gradient close to the metal-epoxy interface. The model captures the position and magnitude of the peak hardness accurately after correction of the ISE of the unirradiated region as per the work of Pöhl et al. [24] and outlined in the author’s earlier study [15]. Conversely, for the top-down method, Figure 8b, we observe a broad hardness peak, both in the experiments and the simulation results, whereby the model slightly over-predicts the depth position at peak hardness (100–130 nm) and the magnitude of the hardness difference. Nonetheless, the simulation result for the top-down method is in close agreement with the experimental results with a peak hardness difference of 5% and a positional shift, with respect to total indentation depth, of between 5–7.5%. The hardness results were corrected in the authors’ previous work to account for the ISE using the Nix–Gao model [18]. The model empirically accounts for the geometrically necessary dislocations near the surface which accommodate the indenter, this manifests itself as an increase in hardness on the surface. The Nix–Gao model expresses the depth dependence of the hardness, H, as
H = H 0 1 + ( h * h )
where H0 is the hardness at infinite depth, h* is the characteristic length, and h is the indentation depth. This correction can only be applied to the CSM indentation method.
Analysis of the load–displacement curves of the two techniques highlights some significant differences in the two methods, Figure 9a,b respectively. The point at which peak hardness is detected in each case is highlighted but the area function differs slightly from the experimental results due to the idealization of the tip geometry in the FE models and the length scales the used in the computation. We observe a divergence in the load paths between the model and the experiment for the OCS case. The authors attribute this to:
  • Blunting and deterioration of the Berkovich tip in the experimental tests, which do not align as well with the initial calibrated state
  • A constant value of the strain hardening exponent in the model:
    The flow stress within the unirradiated material is assumed to adhere to a power law relation whereby σ = A ε n , where A is a strength coefficient and n is the strain-hardening exponent, the authors had extrapolated the low dpa results in [19] to higher doses, but the choice to maintain a constant strain-hardening rate may result in an anomalous increase in reported values as seen in Figure 9. For greater correlation between the experimental results the authors note the irradiated flow stress model is better represented by
    σ rad = A ε n + K d p a  
    where the new model would have a variable value of n, such that n 1 d p a or other similar function, owing to the increased defect density. This would imply that the strain hardening effect decreases with increase in irradiation dose.
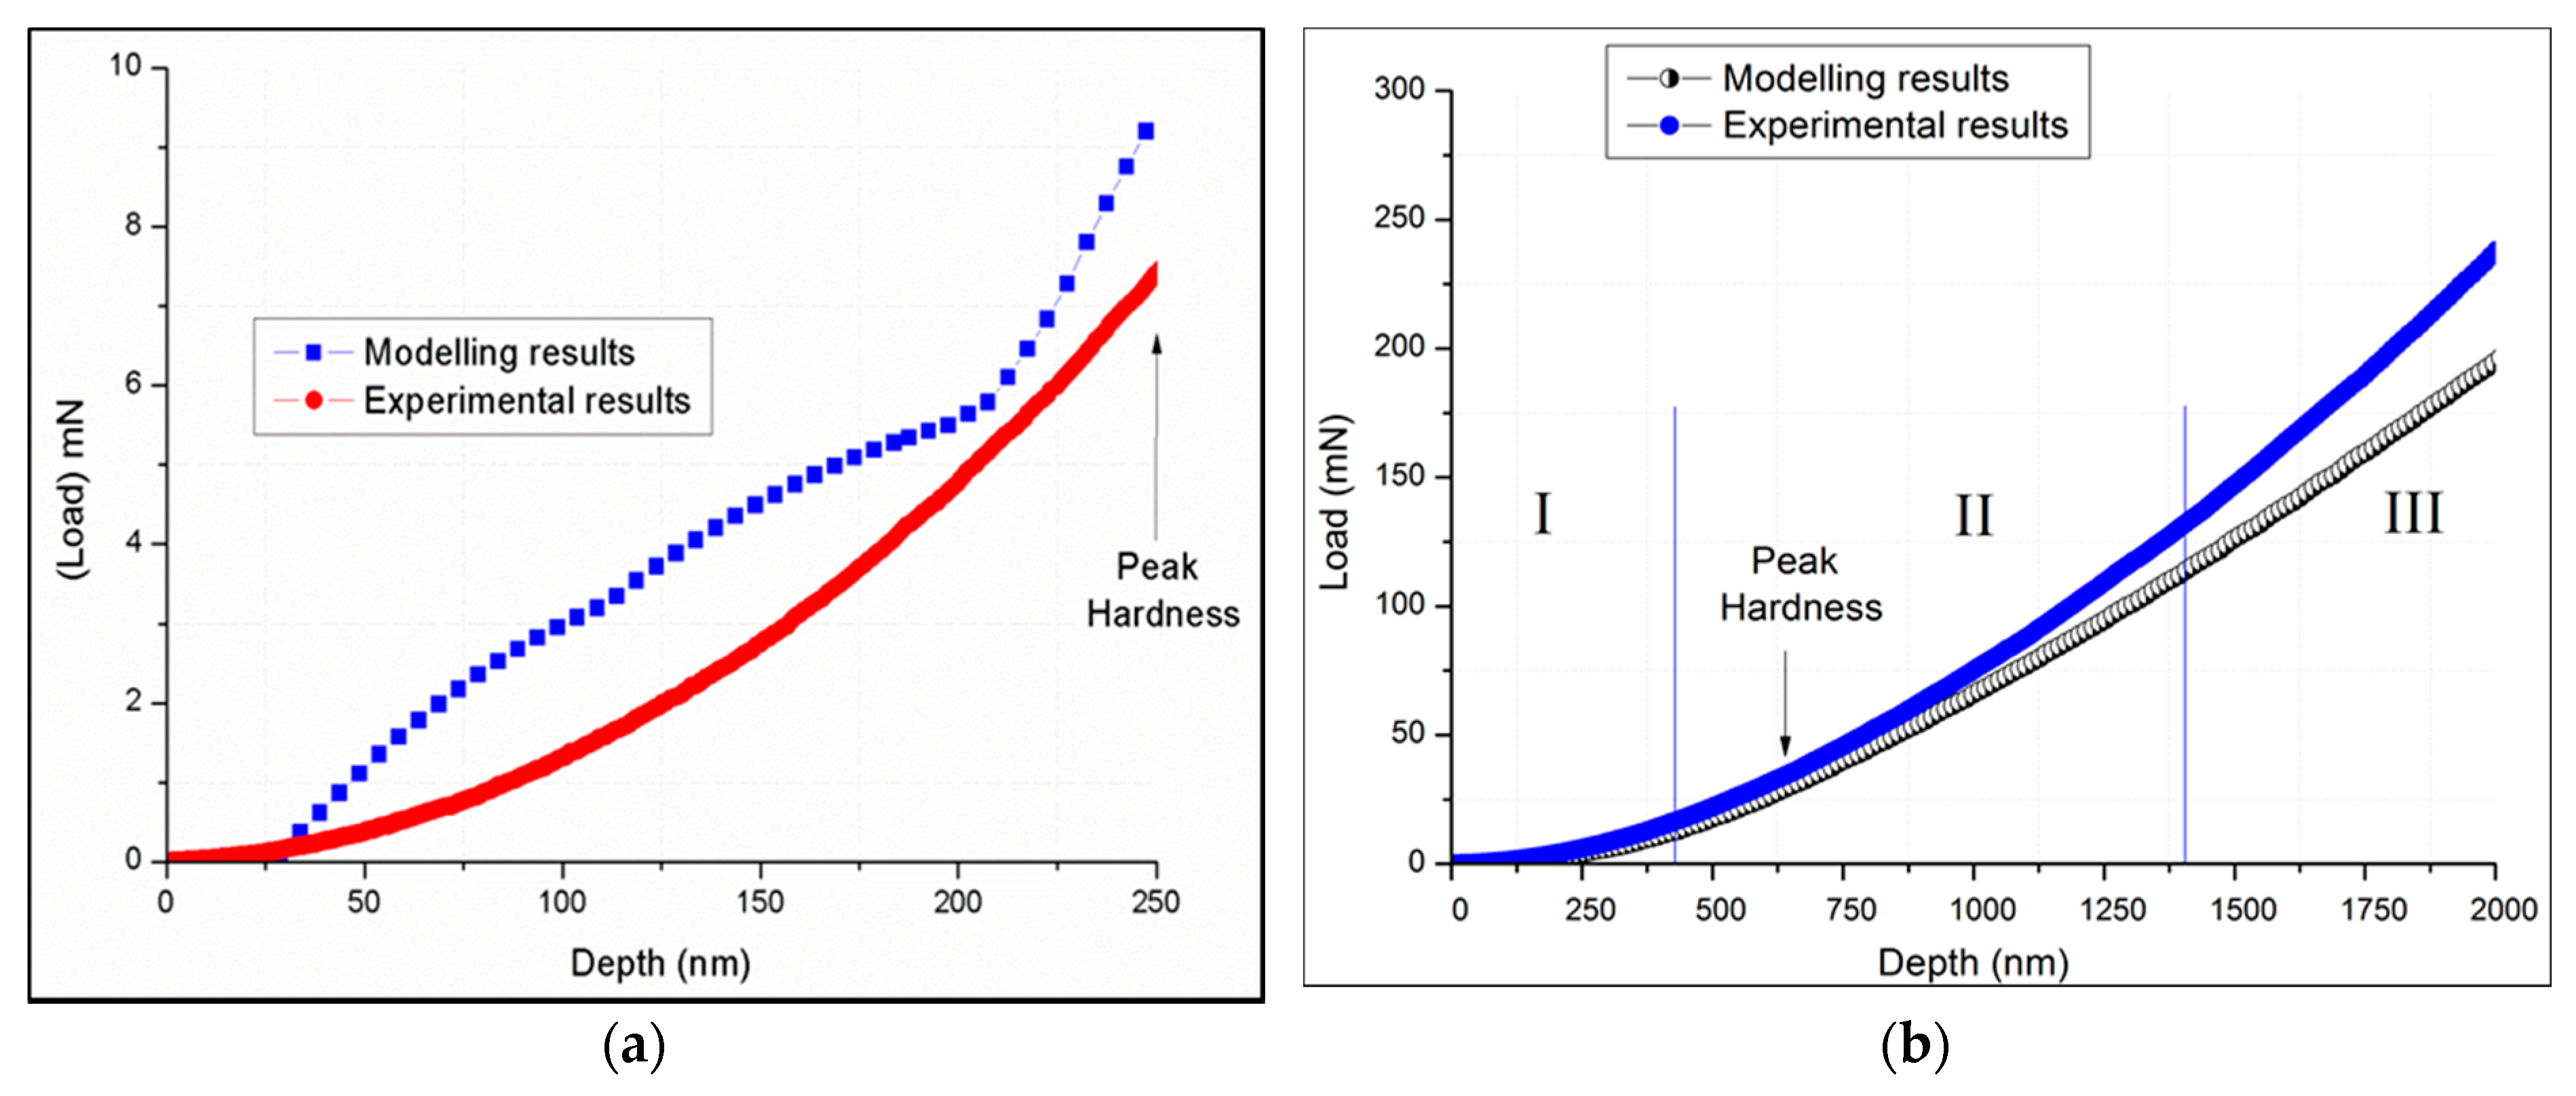
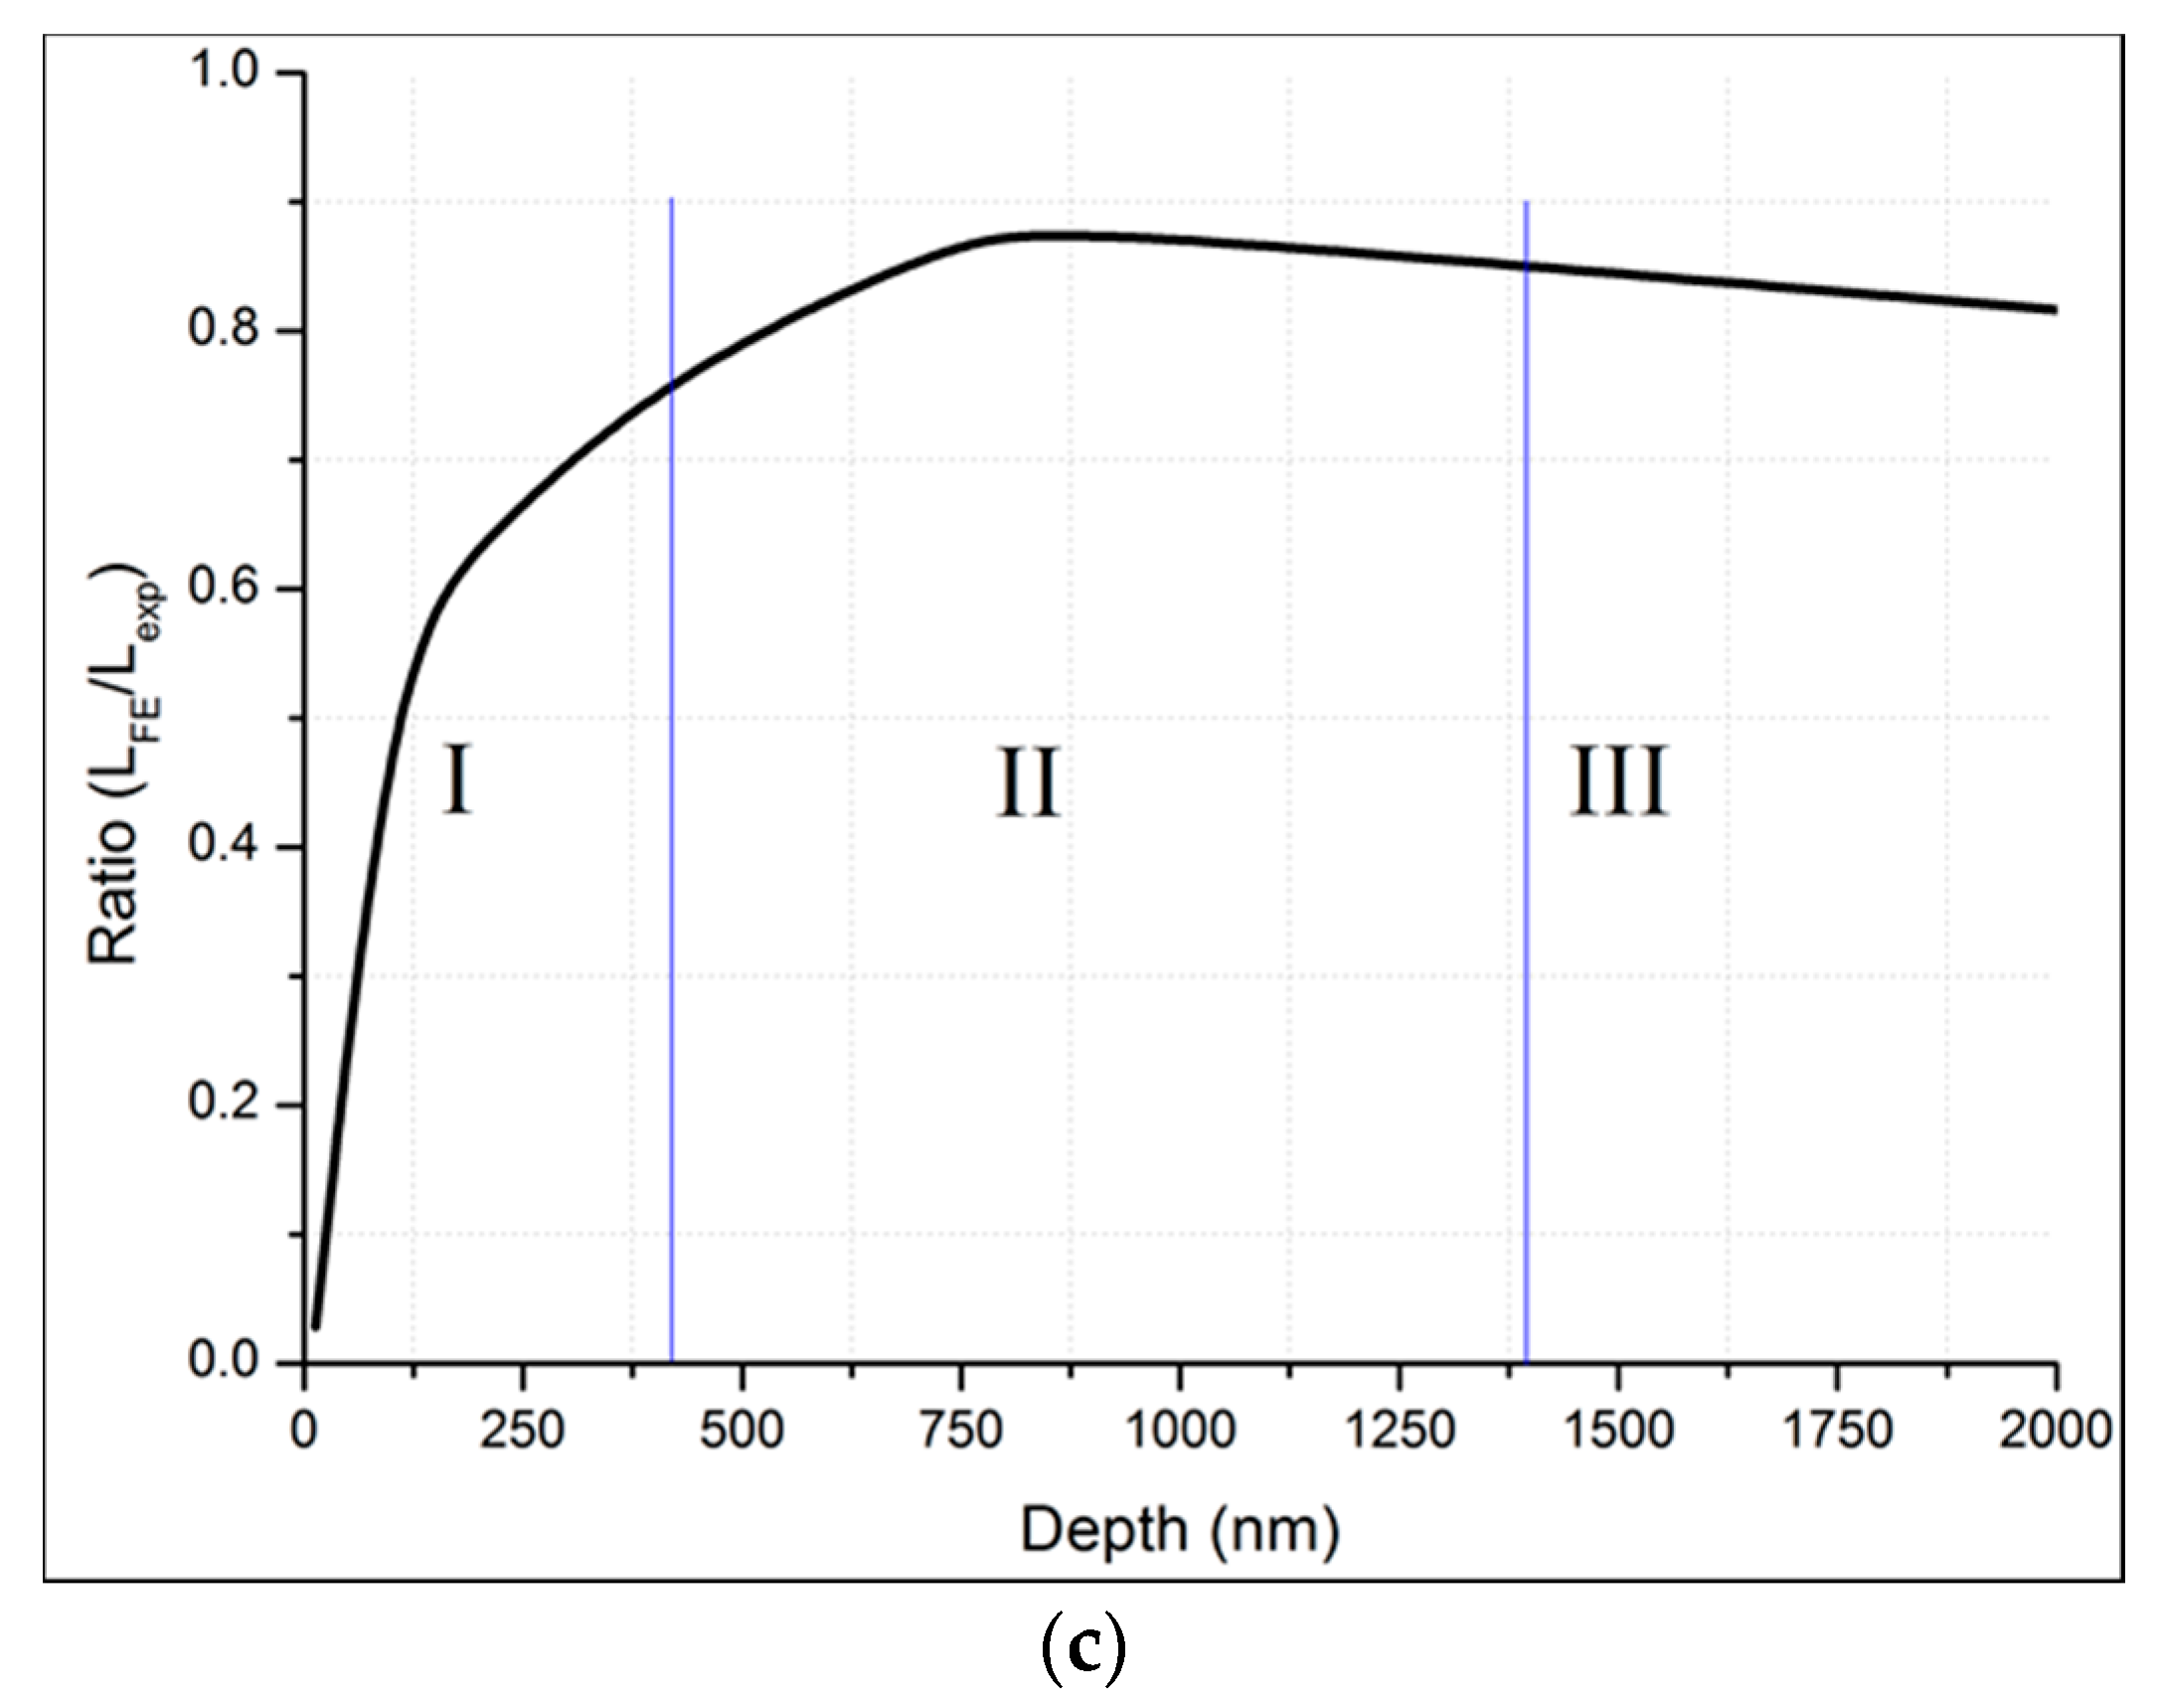
  • The shallow nature of the indentation is more sensitive to the discretization of the mesh and the stratification of the flow stress formulation: this is highlighted by the inflection point present at a depth of 200 nm in Figure 9a, where the strength of the hardened layer is detected. The final load at peak hardness does not deviate too greatly from the reported experimental results (~7.5 mN for experimental vs. ~9.0 mN for the model at 250 nm), but the smooth transition in the experimental graph is in stark contrast to the model’s prediction. The authors believe that the results obtained at the shallow depth of the indentations used for the OCS method are greatly influenced by tip blunting and resultant changes in the area functions.
In the case of the top-down method the load–displacement curve is captured in the model well up to the point where the peak hardness in the model is recorded, thereafter there is a more substantial under-prediction of the load compared to the experimental results. On comparing the hardness–displacement curves, it is clear that while the model load is always slightly under-predicted, the hardness is initially under-predicted and then it reaches the peak value at a greater depth, showing a slightly higher peak hardness than the experiment. Subsequently, the model hardness starts to decrease at a faster rate than the experimental results, and finally it shows lower values than the experiment again. One reason for this seeming discrepancy between the load and the hardness curves is that the model considers a perfect Berkovich tip, while the actual tip in the experiment is blunted, which is likely to be asymmetric. Now, it is well recognized that a blunt tip would cause the load and the projected area A to be higher for a given depth. The first of these factors would contribute to a higher measured hardness, while the second would result in a lower hardness than the actual hardness at a given depth. The effect of the difference in projected area decreases with an increase in indentation depth. If in the model, a perfect Berkovich tip is assumed, both the predicted load and hardness are lower than the experiment in the first few hundred nanometers (designated Regime I), as seen from Figure 8b and Figure 9b. Moreover, the hardness calculated in Regime I in the model fluctuates significantly. The fluctuation and low load can be attributed to contact problems at shallow depths due to the contact instabilities, nodal penetrations, and element distortion and skewness which affect the penalty contact algorithm. The results of these numerical instabilities can be seen in the Figure 9c whereby at very shallow depths the model severely under predicts the load in the model and the corresponding ratio; the latter continues to increase and reach a plateau value of 0.87 in Region II, before falling again in Region III. In Region II, the model load is lower than the experimental load, but Area A is substantially smaller in the model than in the experiment, hence there is a relative increase in predicted hardness compared to the experiment. With increasing depth, in Region III, while the load required by a blunt tip to penetrate to a certain depth remains larger than a sharp (idealized) tip, the projected area of the indent becomes increasingly closer to the idealized area. Hence, the under-prediction of load at larger depths along with the almost equal projected Area A, causes the model hardness to decrease, and reach values below the experimental hardness. In addition to these effects, the authors have previously attributed the discrepancies in the observed and model hardness curves to, firstly, the SRIM calculations leads to an erroneous distribution of damage in some regions and the subsequent flow on effect in terms of yield strength and hardness, and secondly, weaker mechanisms as outlined by [25], which may play a more significant strengthening role at greater depths, are not entirely captured through the hardening model. The aforementioned change in the strain–hardening coefficient would also lead to variations in the reported load and subsequent hardness calculations. The smoothness of the model’s curve can be attributed to the large volume of unirradiated material being detected by the Berkovich indenter, which acts to smooth out the response. This can be seen in the plastic strain contours of Figure 10a, where the plastic zone is significantly larger for the top-down method.
Underneath the indenter the plastic strain contours show a ‘doubled dished’ plastic zone profile, for both indentation methods, with the irradiated zone behaviour showing similarities to thin metallic films, (Figure 10). Previously the authors have termed these contiguous zones as: primary plastic zone (within the irradiated region) and secondary plastic zone (unirradiated virgin material) [14]. It should be noted that in both methods the models experience fluctuations in the loads reported at shallow depths, this is due to the contact algorithms, the finite number of nodes at which the penalty coupling is applied and the mesh distortion in elements adjacent to the indenter face.

4. Discussion

The authors have endeavoured in this paper to compare two techniques of nanoindentation used for the measurement of hardening due to ion irradiation, and to assess their relative merits with respect to the ion irradiation condition. The first, more common of the two, is the top-down method, where nanoindentation is performed directly on the ion irradiated surface, while the second is the oblique cross-section or OCS method, which involves nanoindentation on a cross-section polished at an angle to the irradiated surface. The most common reason for applying the first method is the ease of sample preparation and testing, while the second method provides a way of accessing the cross-section of the irradiated thickness of the sample, enabling the extraction of a hardness profile with depth and damage dose. However, sample preparation is more difficult in the latter case.
In this paper, the authors take a closer look at the relative merits of the two techniques. It appears that the top-down method performs better in the cases where the ion energy, and therefore the peak damage depth is small, than when the ion energy is higher. This is clear from the fact that the hardness peak or the ΔH peak is sharper for the 1 MeV sample, while it gets progressively broader and less well defined with increasing energy. The top-down method may actually be better than the OCS method in the cases where the peak damage depth is small, since the spatial resolution of the former is better, as it uses the CSM mode. Moreover, the hardness values measured by the OCS method near the surface are influenced by the hardness of the epoxy, and since the hardness peak due to irradiation is closer to the surface in the low energy case, the measurements of irradiation hardening near the peak are also influenced by the epoxy.
However, it is clear from the plots of the top-down hardness measurements that the position of the hardness peak becomes progressively uncertain with increasing ion energy, as the hardness profile gets flatter e.g., for the 3 MeV ΔH curve, there is a broad flat peak, almost a plateau, between ~350–700 nm. This happens because of the large plastic zone below the indent at greater depths, resulting in an averaging of hardness over a large volume with great variation in hardness (see, e.g., the plastic zone in the 2 MeV model in Figure 10a). On the other hand, the OCS method results in sharp hardness peaks even for high energy samples, since the depth of penetration of the indents remains small (250 nm in this case) for all indents, both near and far from the irradiated sample surface. Therefore, this characteristic becomes a distinct advantage for the OCS method when the ion energy is high (with a deeper peak damage layer).
It is evident from the two plots of hardness peak vs. damage peak in Figure 6 that the hardness peaks in the OCS method are closer to the actual damage peaks than those in the top-down method. This is expected as indent depth, and therefore the plastic zone, is much smaller in the OCS method than in the top-down method (see Figure 10). Therefore, the volume ‘sensed’ by the indenter is much smaller in the OCS method, providing for the closer occurrence of the hardness peak to the damage peak.
The von Mises stress contours shown in Figure 11 exhibit a thin band of heightened stresses where the maximum irradiation dose is present and this is seen across both models. The reduction in plastic flow and the increased hardening in those regions is manifest in the increased stress levels. The contours also show a discontinuous stress field below the indenter: this is attributable to the sharp variation in material strengths below the heavily irradiated layers. The contour plot for the OCS method is from within the shoulder region and is characterized by the formation of a skewed hemispherical stress region that is truncated by the epoxy–metal interface and the peak irradiated layer. The localization of the von Mises stress to the areas below the indenter also highlights the low influence of the epoxy on the reported hardness, with no large stresses shown in the contour plots of Figure 11 within the epoxy region. Also observable are two stress regions, a low stress region below the highly irradiated layer and a higher stress region between the indenter and the highly damaged layer. It is pertinent to highlight that the presence of a shoulder region is seen as a direct consequence of the reduced influence of the peak damaged layer for shallow indentation, as it lies too deep within the sample to affect the strain fields beneath the indenter.
The 3D plots of the shear stresses in both methods exhibit the formation of an asymmetric two lobed configuration, as prominently seen in the OCS method within the irradiated regions of specimens in Figure 12. This stems from the asymmetric nature of this orientation of the Berkovich tip, which leads to a small lobe forming on the short side and a larger lobe forming on the long side.
The authors also note the large shear stresses present near the interface of the highly damaged region and softer unirradiated material. This is a consequence of the highly irradiated layers constraining the plastic flow in the adjacent low dose regions through the large defect density induced. As noted in the authors’ earlier work [14] the two plastic zones are separated by the peak damage layer which gives rise to a localized shear zone that remains confined to the primary plastic zone with increased indenter penetration.
Ultimately, the immobility of these static shear zones adjacent to the highly irradiated layers governs the reported hardness. In both indentation methods, the volume of material in the primary plastic region and the shear stress magnitude govern the hardness profile and peak hardness values. For the OCS method, the orientation of the indenter with respect to the inclination of the irradiated samples results in the larger lobe being oriented towards the highly irradiated layer, with the limited plastic flow in that direction leading to an amplification of shear stresses, thus highlighting the sensitivity of the OCS method with respect to the indenter orientation. This sensitivity is not apparent for the top-down method. The OCS method is expected to be less asymmetric in its shear zones if a conical or a spherical indenter is used. This aspect will be investigated in future work.
As mentioned earlier, a consequence of the ion irradiation process is the shallowness of the damage and the OCS method can elucidate some aspects of areas with lower defect densities, as is demonstrated by its ability to predict the hardening in the shoulder region with reasonable accuracy. Furthermore, it is necessary to compute the ISE for the CSM top-down method, but this effect is reduced in the OCS method by virtue of the increase in the irradiation-induced defects for indents in the peak damage region, while the ISE remains an important factor in the low or zero dose regions. Other studies have shown the ISE pop-ins are the result of difficulty in activating dislocations sources (e.g., Frank-Read sources) [26,27], but for the inclined nanoindentation studies presented herein (i.e., the indentations in the regions in and adjacent to the peak of the hardness curve), there is greater activation due to the higher number of irradiation induced dislocation sources [28]. This diminishes the ISE in the highly irradiated regions and provides for greater correlation between the model and experiments after the use of ISE corrections in the virgin material. The ISE is still apparent in the area near the epoxy interface, but ISE correction cannot be performed for the composite sections represented in the irradiated areas for non CSM indentation methods.
The OCS method was also able to highlight the deviation of the load–displacement curves due to the differing hardening exponent, n, for highly irradiated materials. This deviation was largely obscured in the top-down method and will be the focus of future work. Further work will also be devoted to the discretization of the layered domain and the meshing techniques employed, which is seen to be particularly important for the OCS method.

5. Conclusions

Stainless steel 316, a commonly used structural material for various nuclear applications, was irradiated with He2+ ions and subjected to nanoindentation by the top-down method and the oblique cross-section (OCS) method in order to compare the relative merits and applicability of these techniques in measuring the hardness change due to ion irradiation. A number of salient points are outlined below:
(i)
The top-down method is better suited when the ion beam energy is low, resulting in a shallow peak damage depth (<1 μm), since it has better spatial resolution due to the CSM mode of indentation employed in this technique.
(ii)
The OCS method is better suited for high energy ion irradiation, since it provides a closer approach of the hardness peak to the damage peak, and gives a sharp hardness peak for all ion energies. This is possible because of the shallow indentation depths in the OCS method.
(iii)
The height and the sharpness of the hardness peaks vary much less in the OCS method as compared to the top-down method, and this would be another reason for preferring this method over the top-down method for greater damage peak depths.
(iv)
The OCS method also enables examination of the hardness–damage correlation for the low damage region, by exhibiting a shoulder in the hardness–depth curve.
(v)
The radiation dependent hardening model used in the FE simulation was able to capture salient features of the indentation process, with good qualitative and quantitative agreement with the experimental results. Notably, the FE model highlighted the presence of a double dished plastic zone below the indenter for the ion irradiated samples.
(vi)
The models also show that the OCS method is more sensitive to the indenter orientation with strong indenter asymmetry amplified through the oblique sample mounting.

Author Contributions

Conceptualization, D.B.; Methodology, D.B. and M.S.; Software, M.S.; Formal Analysis, D.B. and M.S.; Investigation, Z.Z., C.H., M.I., and D.B.; Writing—Original Draft Preparation, D.B. and M.S.; Writing—Review & Editing, D.B., M.S., and P.M.; Supervision, D.B.

Funding

This research received no external funding, and was supported by ANSTO internal funding.

Acknowledgments

The authors acknowledge with gratitude Tim Palmer and Kim Lu at the Metallography Lab of the Nuclear Materials Development and Characterization division in ANSTO for their invaluable help in sample preparation. The help of Ken Short from the Nuclear Materials Development and Characterization (NMDC) division at ANSTO in performing nanoindentation experiments is also deeply appreciated. The IT department at ANSTO is also gratefully acknowledged for the provision of HPC.

Conflicts of Interest

The authors declare no conflict of interest.

References

  1. IAEA. Development of Radiation Resistant Reactor Core Structural Materials. In Proceedings of the 51st IAEA General Conference, Vienna, Austria, 17–21 September 2007; International Atomic Energy Agency: Vienna, Austria, 2007. [Google Scholar]
  2. Yvon, P.; Carré, F. Structural materials challenges for advanced reactor systems. J. Nuclear Mater. 2009, 385, 217–222. [Google Scholar] [CrossRef]
  3. Allen, T.; Busby, J.; Meyer, M.; Petti, D. Materials challenges for nuclear systems. Mater. Today 2010, 13, 14–23. [Google Scholar] [CrossRef]
  4. Was, G.S. Simulation of neutron irradiation effects with ions. In Fundamentals of Radiation Materials Science—Metals and Alloys; Springer: Berlin/Heidelberg, Germany, 2007; pp. 545–577. [Google Scholar]
  5. Ziegler, J.F.; Biersack, J.P. SRIM—The Stopping and Range of Ions in Solids, version 2013. Available online: http://www.srim.org/ (accessed on 12 September 2018).
  6. Misra, A.; Fayeulle, S.; Kung, H.; Mitchell, T.E.; Nastasi, M. Effects of ion irradiation on the residual stresses in Cr thin films. Appl. Phys. Lett. 1998, 73, 891–893. [Google Scholar] [CrossRef]
  7. Ghidelli, M.; Sebastiani, M.; Collet, C.; Guillemet, R. Determination of the elastic moduli and residual stresses of freestanding Au-TiW bilayer thin films by nanoindentation. Mater. Des. 2016, 106, 436–445. [Google Scholar] [CrossRef]
  8. Miura, T.; Fujii, K.; Fukuya, K.; Takashima, K. Influence of crystal orientation on hardness and nanoindentation deformation in ion-irradiated stainless steels. J. Nuclear Mater. 2011, 417, 984–987. [Google Scholar] [CrossRef]
  9. Hosemann, P.; Kiener, D.; Wang, Y.; Maloy, S.A. Issues to consider using nano indentation on shallow ion beam irradiated materials. J. Nuclear Mater. 2012, 425, 136–139. [Google Scholar] [CrossRef]
  10. Hosemann, P.; Swadener, J.G.; Kiener, D.; Was, G.S.; Maloy, S.A.; Li, N. An exploratory study to determine applicability of nano-hardness and micro-compression measurements for yield stress estimation. J. Nuclear Mater. 2008, 375, 135–143. [Google Scholar] [CrossRef]
  11. Hosemann, P.; Vieh, C.; Greco, R.R.; Kabra, S.; Valdez, J.A.; Cappiello, M.J.; Maloy, S.A. Nanoindentation on ion irradiated steels. J. Nuclear Mater. 2009, 389, 239–247. [Google Scholar] [CrossRef]
  12. Dayal, P.; Bhattacharyya, D.; Mook, W.M.; Fu, E.G.; Wang, Y.-Q.; Carr, D.G.; Anderoglu, O.; Mara, N.A.; Misra, A.; Harrison, R.P.; et al. Effect of double ion implantation and irradiation by Ar and He ions on nano-indentation hardness of metallic alloys. J. Nuclear Mater. 2013, 438, 108–115. [Google Scholar] [CrossRef]
  13. Kasada, R.; Takayama, Y.; Yabuuchi, K.; Kimura, A. A new approach to evaluate irradiation hardening of ion-irradiated ferritic alloys by nano-indentation techniques. Fusion Eng. Des. 2011, 86, 2658–2661. [Google Scholar] [CrossRef] [Green Version]
  14. Saleh, M.; Zaidi, Z.; Ionescu, M.; Hurt, C.; Short, K.; Daniels, J.; Munroe, P.; Edwards, L.; Bhattacharyya, D. Relationship between damage and hardness profiles in ion irradiated SS316 using nanoindentation—Experiments and modelling. Int. J. Plast. 2016, 86, 151–169. [Google Scholar] [CrossRef]
  15. Saleh, M.; Xu, A.; Hurt, C.; Ionescu, M.; Daniels, J.; Munroe, P.; Edwards, L.; Bhattacharyya, D. Oblique cross-section nanoindentation for determining the hardness change in ion-irradiated steel. Int. J. Plast. 2018. [Google Scholar] [CrossRef]
  16. Fischer-Cripps, A.C. Nanoindentation; Springer: New York, NY, USA, 2004. [Google Scholar]
  17. Matlab, MATLAB Release 2016a; The MathWorks Inc.: Natick, MA, USA, 2016.
  18. Nix, W.D.; Gao, H. Indentation size effects in crystalline materials: A law for strain gradient plasticity. J. Mech. Phys. Solids 1998, 46, 411–425. [Google Scholar] [CrossRef]
  19. Byun, T.S.; Farrell, K.; Li, M. Deformation in metals after low-temperature irradiation: Part II—Irradiation hardening, strain hardening, and stress ratios. Acta Mater. 2008, 56, 1056–1064. [Google Scholar] [CrossRef]
  20. Gupta, J.; Hure, J.; Tanguy, B.; Laffont, L.; Lafont, M.C.; Andrieu, E. Characterization of ion irradiation effects on the microstructure, hardness, deformation and crack initiation behavior of austenitic stainless steel: Heavy ions vs protons. J. Nuclear Mater. 2018, 501, 45–58. [Google Scholar] [CrossRef]
  21. Was, G.S. Irradiation hardening and Deformation. In Fundamentals of Radiation Materials Science—Metals and Alloys; Springer: Berlin/Heidelberg, Germany, 2007; pp. 581–642. [Google Scholar]
  22. Kim, J.W.; Byun, T.S. Analysis of tensile deformation and failure in austenitic stainless steels: Part II—Irradiation dose dependence. J. Nuclear Mater. 2010, 396, 10–19. [Google Scholar] [CrossRef]
  23. ABAQUS. ABAQUS Documentation; Dassault Systèmes: Providence, RI, USA, 2012. [Google Scholar]
  24. Pöhl, F.; Huth, S.; Theisen, W. Detection of the indentation-size-effect (ISE) and surface hardening by analysis of the loading curvature C. Int. J. Solids Struct. 2016, 84, 160–166. [Google Scholar] [CrossRef]
  25. Queyreau, S.; Monnet, G.; Devincre, B. Orowan strengthening and forest hardening superposition examined by dislocation dynamics simulations. Acta Mater. 2010, 58, 5586–5595. [Google Scholar] [CrossRef]
  26. Pathak, S.; Stojakovic, D.; Doherty, R.; Kalidindi, S.R. Importance of surface preparation on the nano-indentation stress-strain curves measured in metals. J. Mater. Res. 2011, 24, 1142–1155. [Google Scholar] [CrossRef]
  27. Wang, Z.; Bei, H.; George, E.P.; Pharr, G.M. Influences of surface preparation on nanoindentation pop-in in single-crystal Mo. Scr. Mater. 2011, 65, 469–472. [Google Scholar] [CrossRef]
  28. Pathak, S.; Kalidindi, S.R.; Weaver, J.S.; Wang, Y.; Doerner, R.P.; Mara, N.A. Probing nanoscale damage gradients in ion-irradiated metals using spherical nanoindentation. Sci. Rep. 2017, 7, 11918. [Google Scholar] [CrossRef] [PubMed]
Figure 1. (a) Schematic of nanoindentation procedure used for ‘top-down’ indentation method; (b) Schematic 3D view of ion irradiated sample mounted obliquely for nanoindentation on cross section of irradiated depth (not to scale).
Metals 08 00719 g001aMetals 08 00719 g001b
Figure 2. Damage profiles of He in stainless steel 316. Reproduced from [15], with permission from Elsevier Publishing, 2018.
Metals 08 00719 g002
Figure 3. (a) The average hardness profiles of the 1, 2, and 3 MeV He irradiated samples, and the unirradiated sample, measured by the ‘top-down’ method, without correction for indentation size effect. (b) The difference in hardness of the 1, 2, and 3 MeV samples with respect to the as received material, after correction for indentation size effect. Reproduced from [14], with permission from Elsevier Publishing, 2018.
Metals 08 00719 g003
Figure 4. (a) Hardness profiles of the 1, 2, and 3 MeV He irradiated samples, and the unirradiated sample, measured by the oblique cross-section (OCS) method. The upper and lower bounds were calculated by adding and subtracting 1 standard deviation, respectively. (b) ΔH vs. depth curves for the 1, 2, and 3 MeV irradiated samples respectively.
Metals 08 00719 g004aMetals 08 00719 g004b
Figure 5. Displacement damage profile and ΔH values for both top-down and OCS method for (a) 1, (b) 2, and (c) 3 MeV samples.
Metals 08 00719 g005
Figure 6. Plot of the experimental depth of hardness peak (dH) vs. depth of damage peak (dD) for top-down and OCS nanoindentation method, respectively.
Metals 08 00719 g006
Figure 7. Schematic diagrams showing the orientation of the indenter tip with respect to the irradiated layers: (a) top-down method, (b) oblique cross-section method.
Metals 08 00719 g007
Figure 8. Experimental and FEA modelling results for (a) oblique cross section method for hardness difference variation with depth in sample (Reproduced from [15] with permission from Elsevier Publishing, 2018) and (b) top-down method for the change in hardness with indent depth for 2 MeV He2+ irradiated sample.
Metals 08 00719 g008
Figure 9. Experimental and FE simulated load–displacement curves for (a) oblique cross-section method and (b) top-down method. (c) Ratio of modelling and experimental loads, LFE/LExp, for top-down method.
Metals 08 00719 g009aMetals 08 00719 g009b
Figure 10. Equivalent plastic strains for (a) top-down method at an indent depth of d = 2000 nm, and (b) OCS method at an indent depth of d = 250 nm.
Metals 08 00719 g010
Figure 11. Von Mises stress (a) at d = 2000 nm for Top-down method, and (b) at d = 250 nm for the OCS method.
Metals 08 00719 g011
Figure 12. Shear stress, τ 23 , (a) at d = 2000 nm for the top-down method, and (b) at d = 250 nm for the OCS method.
Metals 08 00719 g012
Table 1. SRIM (Stopping and Range of Ions in Matter) parameters used in calculating damage profiles.
ParameterInput
TRIM calculation methodDetailed calculation with full damage cascades
Name of elementHelium
Irradiation energy (keV)1000, 2000, 3000
Layer—stainless steel 316Stainless steel (typical) with Cr (16%) and Ni (10%)
Displacement energy25 eV
Table 2. Peak hardness value, peak hardness depth, and peak damage depth for samples irradiated by He2+ ions at all three energies compared, for the OCS method and the top-down method. Adapted from [14,15], with permission from Elsevier Publishing, 2018.
Ion EnergyIndentation MethodΔHMax (GPa)dHMax (μm)dDamage (μm)
1 MeVOCS1.690.651.65
TD1.550.29
2 MeVOCS2.622.153.2
TD1.320.48
3 MeVOCS1.983.555.0
TD1.20.75

