Article

Contact Fatigue Failure Analysis of Helical Gears with Non-Entire Tooth Meshing Tests

1
School of Mechanical Engineering, Taiyuan University of Science and Technology, Taiyuan 030024, China
2
Gear Research Institute, Taiyuan University of Technology, Taiyuan 030024, China
3
Engineering Research Center Heavy Machinery Ministry of Education, Taiyuan 030024, China
*
Authors to whom correspondence should be addressed.
Metals 2018, 8(9), 693; https://doi.org/10.3390/met8090693
Submission received: 20 June 2018 / Revised: 22 August 2018 / Accepted: 24 August 2018 / Published: 4 September 2018

Abstract

:
This study presents an experimental approach based on partial tooth meshing contact fatigue with constant amplitude and different lengths of load cycles. To achieve this, 20CrH helical gears were considered, limiting the region of interest to one-third of the tooth to accelerate crack initiation and propagation. Different factors, such as number of fatigue cycles, tooth flank morphology, residual stress, hardness, and microstructure evolution under fatigue, were considered. The ultimate goal was to relate these variations with the observed failure modes. The results showed that with increasing cycle number, the residual stress at the same position in the meshing zone of the tooth flank increased first and then decreased. The residual stress values at the lower position of the pitch circle were larger than that of the addendum and dedendum. After cyclic loading, the content of the twin martensite within the microstructure below the pitch circle decreased and the corresponding hardness value of the tooth flank was reduced. After long-term cyclic loading, the precipitated phases aggregated and grew and the discontinuous distribution hindered the grain boundary slip. The dislocation density increased, and the pile-up of dislocation resulted in stress concentration at the grain boundary and the phase boundary, which induced the initiation of fatigue crack of the tooth flank.

1. Introduction

Due to the advantages of meshing performance and long service life, helical gears have been widely applied in mechanical power transmission systems. Under high-speed and heavy-duty conditions, helical gears might incur contact fatigue failures, such as pitting and spalling due to insufficient tooth flank bearing capacity, offset load, or tooth profile error, etc. [1,2,3,4,5], as well as incurring tooth breaking due to insufficient bending strength [6]. As such, it was necessary to combine machining processes and the heat treatment process of gears to complete basic research, including residual stress measurement, failure morphology analysis, and hardness and microstructure analysis, to provide theoretical and experimental bases for the failure analysis of contact fatigue tests and fatigue life prediction.
The existing research on gear residual stress mainly focuses on the effect of machining or the heat treatment process on the residual stress of the tooth flank and the effect of residual stress on fatigue. Rego et al. [7] studied the effect of shot peening, grinding, and heat treatment processes on the residual stress of gears in the machining of 16MnCr5 spur gears. Conrado et al. [8,9,10,11,12] studied the relationship between the residual stress of tooth root and the bending fatigue strength of spur gears of different materials under carburizing and nitriding processes. Lingamanaik and Chen [13] carried out a carburization treatment of an SAE 5120 automotive gear for different lengths of time. They found that longer carburization allowed the gears to obtain higher residual compressive stress and a deeper hardened layer. Savaria and colleagues [14,15] studied the effect of different degrees of induction quenching on the residual stress of AMS6414 spur gears. With the same shape and depth of the hardened layer of the tooth root, the residual compressive stress of the tooth root had a significant effect on improving the bending fatigue strength of gears. Mallipeddi et al. [16] studied the variation in residual stress of 16CrMn5 spur gear tooth roots after the running-in period. Liu et al. [17] studied the residual stress on the tooth flank of helical gears in a wind turbine and found that internal cracks formed farther from the surface as compressive residual stress in the hardened layer decreased in magnitude. Fukumasu et al. [18] measured compressive residual stress in the −580 to −550 MPa range near the surface regions of 17NiCrMo helical gears. Jo et al. [19] used CrMo steel bar samples for axial tensile fatigue and rotating tensile fatigue tests, and found that the depth at which residual compressive stress changes to residual tensile stress was same as the depth of the hardness change position, at which the hardness changed from high to low. While studying the trend in the residual stress value change at the near-surface region of gears in the process of fatigue testing, Lv et al. [20] found that residual compressive stress on the surface of W6Mo5Cr4V2 gears was released after contact fatigue. Pariente et al. [21] measured the residual stress value of 16CrNi4 gears after contact fatigue testing and found that the initial residual stress of the tooth root was released near the surface zone. Batista et al. [22] found that the only carbo-nitrided gear tooth flank residual compressive stress in the tooth flank of AISI 4130 helical gears increased with fatigue cycles, whereas for the gear with additional shot-peening, residual compressive stress decreased.
Moreover, studying hardness variations in the tooth flank and near-flank regions of the hardened layer allowed the monitoring of crack development during the fatigue process. Yu and Xu [23] observed the surface failure of 42CrMo gears with a nitrided layer thickness of 0.40–0.45 mm. By analyzing the hardness of different depths of addendum, dedendum, and pitch circle of the tooth flank, due to the low hardness under the composite layer and in the core zone, the gear teeth could not bear the load well. Thus, initial cracks appeared in the dedendum zone under the maximum tensile stress. Terrin et al. [24] found that hardened 17NiCrMo6-4 steel gears had a similar hardness distribution in the near-surface region before and after the shot peening process. Al-Meshari et al. [25] revealed the hardness distribution across a cross-section surface of a gear; the hardness value of the tooth flank was 1.5 times higher than that of the core. Yucel et al. [26] found that when the hardness value of the flywheel ring gear of DIN CK45 material met the requirement, the engine would not fail under low cycle fatigue (LCF). Siddiqui et al. [27] studied the failure of AISI 8617 gears. When the hardness difference between tooth flank and core was too large, the core was severely deformed and the tooth flank peeled off from the matrix.
In addition, researchers used optical microscopes, a Transmission Electron Microscope (TEM), and other instruments to analyze the microstructure evolution of gears throughout the fatigue failure process. Asi et al. [28,29,30,31] observed failure in the tooth flank of the carburizing gear of AISI 8620 steel using an optical microscope. The microstructure was composed of martensite and retained austenite. Yu and Xu [23] also observed a cross-section near the fracture of 42CrMo steel gears using a Scanning Electron Microscope (SEM), and found the microstructure of the core consisted of tempered sorbite and ferrite. Manda et al. [32] further found that martensite grains of failed gears were larger than their counterpart of unfailed gears. Guagliano et al. [33] utilized SEM to study the trend in micro-cracks leading to spalling of the tooth flank. Through transmission microstructure studies, Kattoura et al. [34] also found that high twin content and dislocation densities could hinder the formation and development of surface fatigue cracks.
In this paper, non-entire tooth meshing testing for 20CrH helical gears was performed on a closed electric power streaming gear test machine. We found that the driven gears easily exhibited contact failures such as pitting and spalling. With SEM, a nano indenter, a residual stress measurement system, and TEM, the failure of gears subjected to different numbers of cycles was analyzed in terms of morphology, residual stress, hardness, and microstructure. Variations in measured parameters were related to the observed failure modes.

2. Experiments

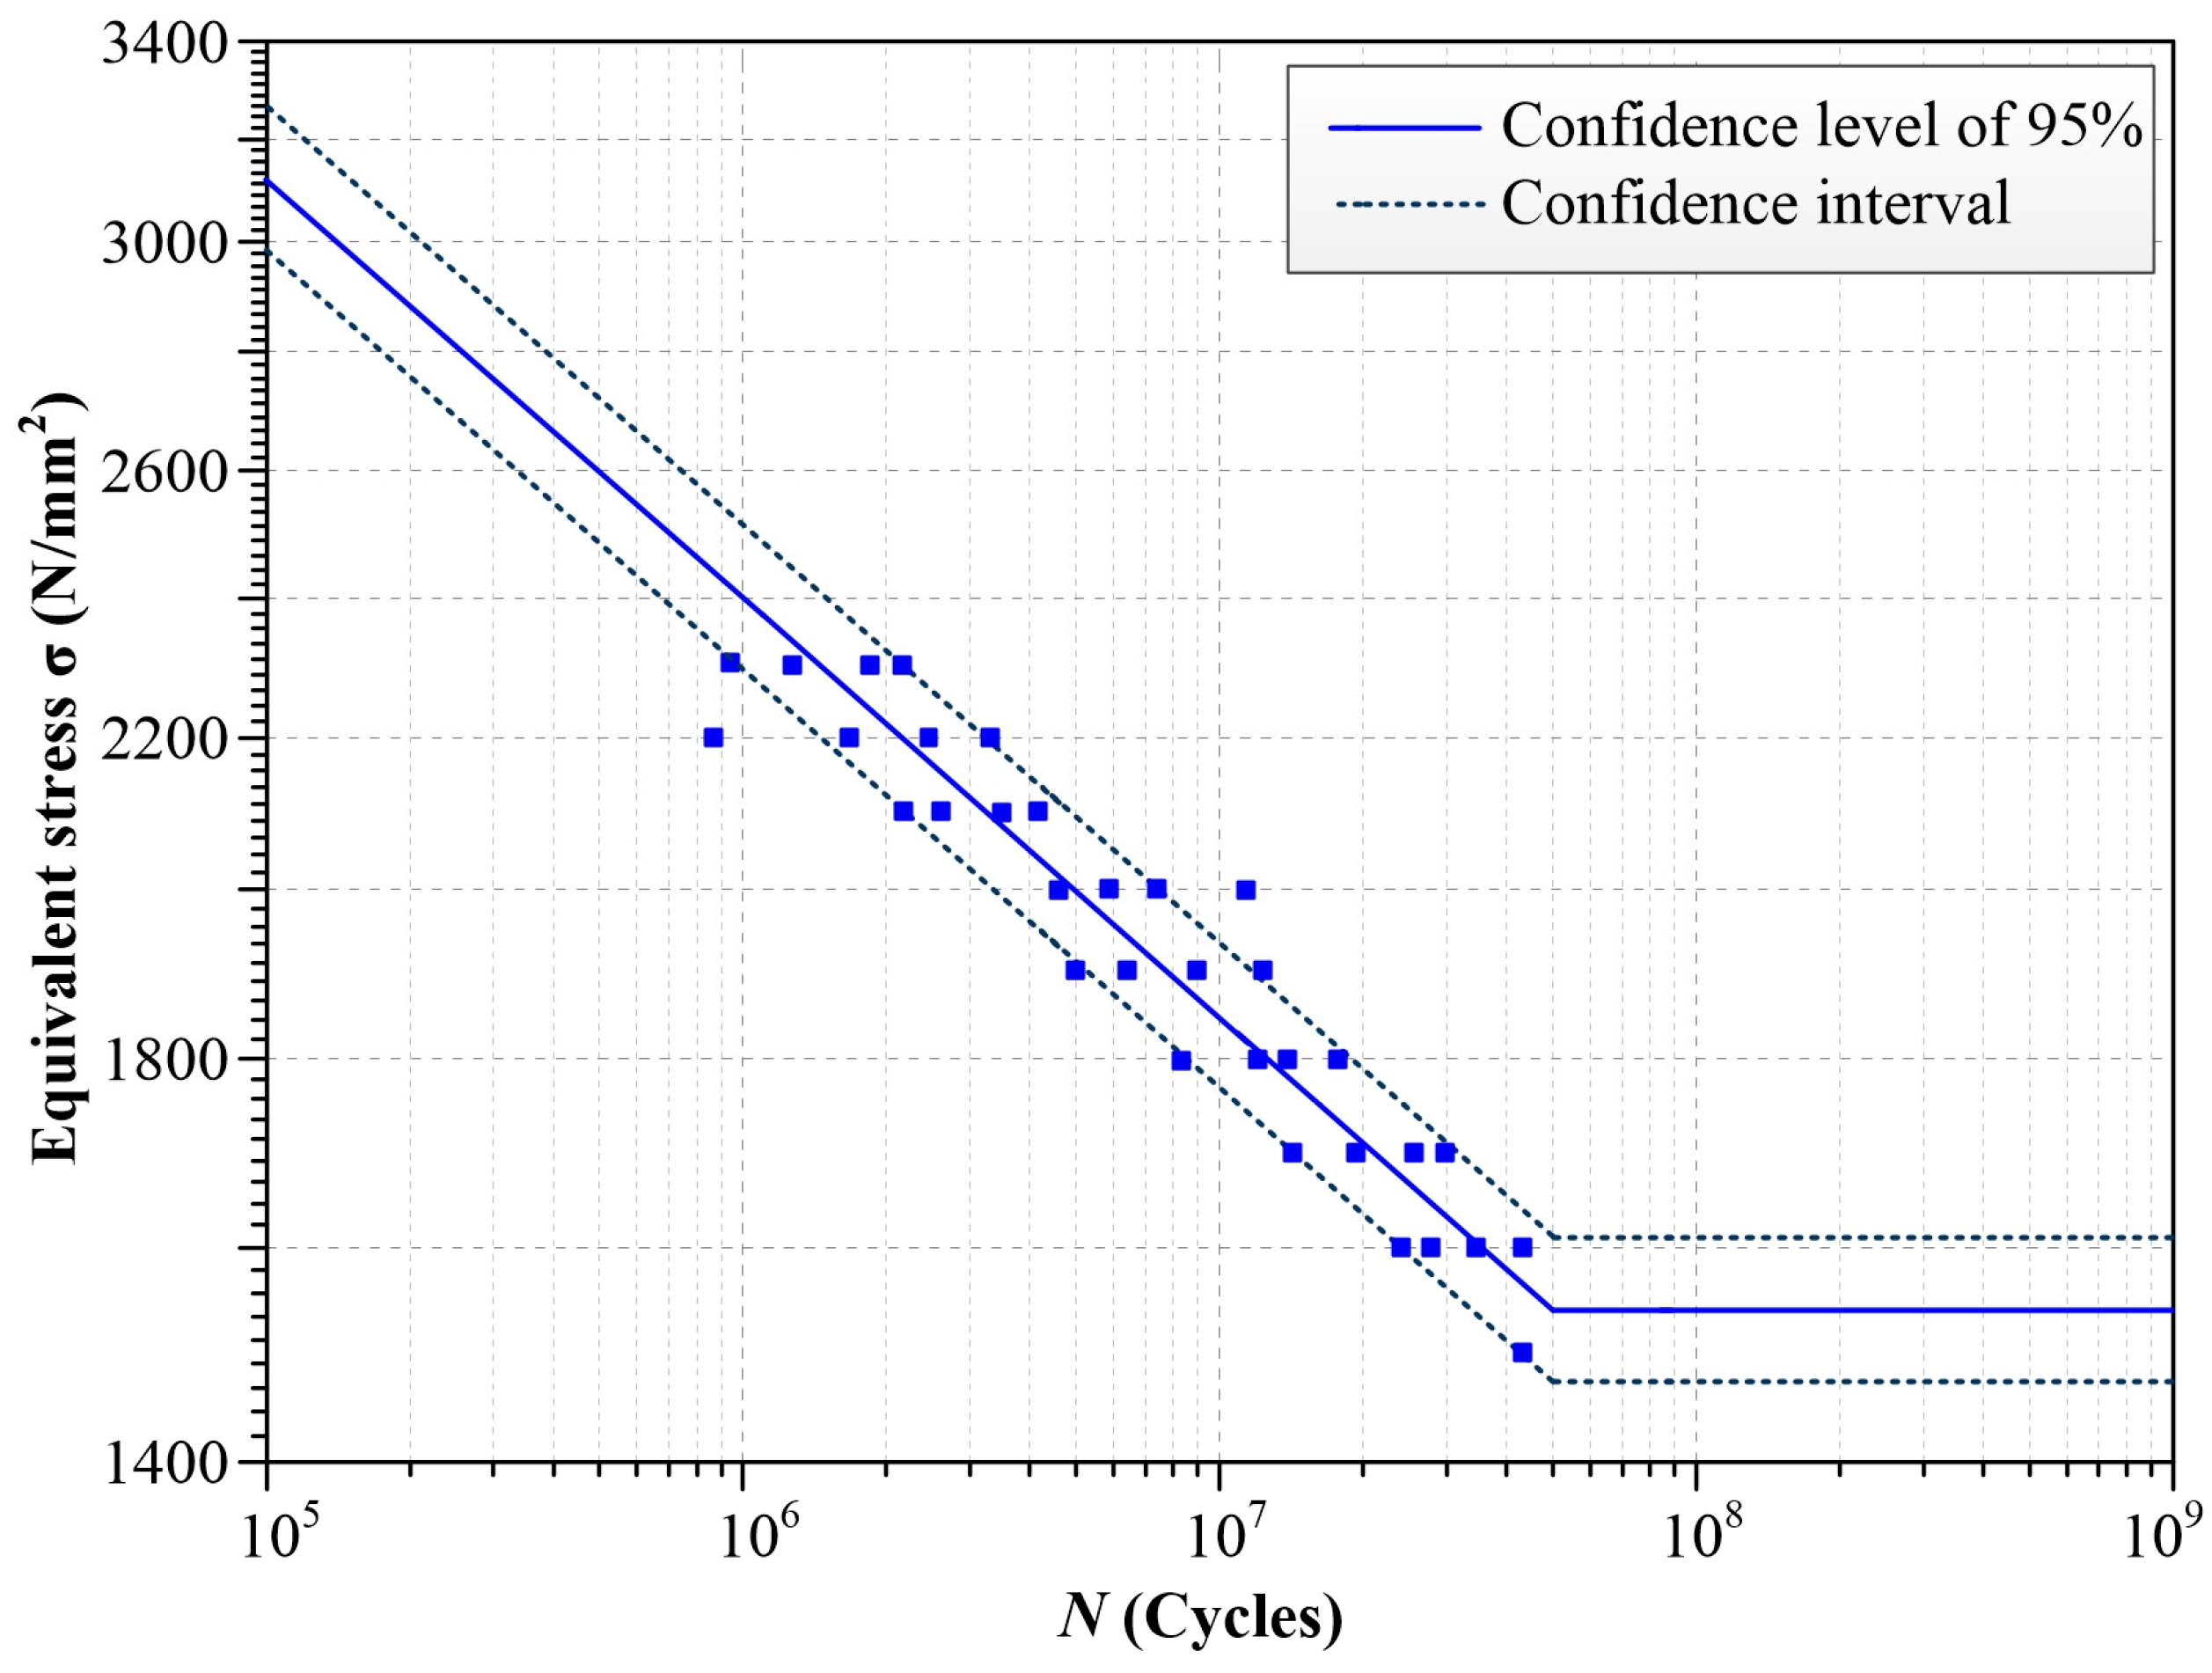
2.1. Tested Gears and Fatigue Analysis of Experimental Data

The test rig was a closed electric power streaming gear test machine (Taiyuan University of Technology Gear Research Institute, Taiyuan, China), as shown in Figure 1a,b, which was designed and improved according to ISO 14635-1: 2000(E). Two sets of identical gear pairs were installed in gear box 1 and gear box 2, respectively. Gear box 1 was the main test box, and gear box 2 was the accompanying test box. Gear pairs installed in gear box 1 were considered as the objects to be studied. Considering the linear speed of gears during the meshing process, the rotary speed of the gears was 1200 rpm and the center distance of gears was 150 mm.
A counter was used to record the rotation number of the gears. The rotary speed and the torque of gears were respectively monitored online by rotary speed and torque sensors. A temperature-controlling device was used to control the temperature of the lubricating oil. The range of the speed and torque sensor was 2000 Nm and its accuracy was ±0.5%. The temperature sensor accuracy was ±0.5%. The lubricating oil used in this test was GL-4 85w90.
The gears material was 20CrH, and the chemical composition is shown in Table 1. After hobbing and shaving, as well as carburization at 915 °C, the depth of the hardened layer reached up to 0.8–1.2 mm. Then the gears were tempered at 170–200 °C. The machining accuracy of the gears was ISO 7. In this test, the gear pair prototype was a transmission. The gear pair speed ratio was 27/34 and the module was 4.5 mm. Details of the gears are shown in Table 2. The gear pair only needed minor modification to meet the center distance requirement of the test rig. This provided effective data for engineering applications.
The contact fatigue stress-number of cycles curve (S-N curve) of the gear material under the processes mentioned above was obtained using a gear fatigue test. According to the combination method with a few test points in GB/T14229-93, the selected test stress σH (equivalent stress) values were 1400, 1500, 1600, 1700, 1800, 1900, 2000, 2100, 2200, and 2300 N/mm2, with a total of 10 stress levels, and four gear pairs were tested at each stress level. The criteria for gear contact fatigue failure were as follows. (1) When the pitting area of a single tooth reached 4% or the pitting area of gear pair reached 0.5%, the cycle was determined as the contact fatigue life; (2) When the cycles of the test gear N0 satisfy N0 ≥ 5 × 10⁷, and the pitting area does not reach the percentages in criteria (1), the test was stopped and the contact fatigue life was determined to be infinite. After the fatigue test, the S-N curve was obtained using the least squares method to fit the data, with a confidence level of 95% and reliability of 95%. The curve is shown in Figure 2.
One-third of the tooth width meshing fatigue test was conducted, as shown in Figure 3. This fatigue test amplifies the magnitude of stresses developed in the tooth flank under the same input torque, so that contact fatigue failure of the meshing tooth flanks would appear faster than entire tooth width meshing. In this paper, the contact stress of the tooth surface was computed using transient dynamic analysis, which is a finite element method (FEM) in ANSYS Mechanical. The purpose was to provide the basis for determining and predicting the contact fatigue failure of the tooth surface by analyzing the position of the dangerous section of the tooth surface. Five constraints were imposed on the driving wheel, restricting the moving degree of freedom (DOF) along the X, Y, Z axes and the rotational DOF of X, Y axes. The rotational DOF of the Z axis was retained, and the axis of the gear was parallel to the Z axis. The same constraints were applied to the driven wheel, and the rotational DOF of the Z axis of the driven gear was maintained. The contact constraint was applied to the meshing surfaces of the two gears. The hole of the driving gear was applied at a speed of 1200 rpm and the hole of the driven gear was applied with a torque of −1500 Nm (Figure 4a). The meshing is shown in Figure 4b.
Because the main analysis object was the contact condition of the teeth surface, the mesh was only refined on the tooth surface of several contact teeth. The element used in models for the gear teeth was solid187, which is a tetrahedral element that contains 10 nodes in each element. The element used for the gear spoke was solid186, which is a hexahedral element that contains 20 nodes in each element. The driving gear model contained 131,255 nodes and 52,879 elements. The driven gear model contained 146,826 nodes and 55,800 elements. Each node only had moving DOF along the directions of the X, Y, and Z axes. The equivalent stress nephograms are shown in Figure 5a,b. In Figure 5, the critical meshing zone is the pitch circle zone near the transverse of the gear. The maximum equivalent stress computed by FEM was about 2000 MPa at points A and B. According to the S-N curve, the designed fatigue life of one-third of the tooth width meshing test was 3.3 × 10⁶ cycles.
Three groups of test gears and one group of gears without cyclic loading were set. The details of the experimental tests are provided in Table 3. Identical loading (1500 Nm, 1200 rpm), temperature (60–80 °C), and lubrication conditions were used in all test groups. Test groups were under 106, 3.3 × 10⁶, and 5.0 × 10⁶ cyclic loading. Our inspection was carried out at half-hour intervals during the testing.

2.2. Morphology and Measurement of Residual Stress

The representative single tooth was cut by a wire cutting machine after cyclic loading. The morphology of the tooth flank was observed using a Digital `Microscope VHX-2000c (KEYENCE, Osaka, Jalan). The meshing zone of the tooth flank was meshed (Figure 6a). The H lines were always parallel to the axis of the gear, and the V lines were always parallel to the transverse profile. The spacing between lines was 1 mm, and the pitch circle was line H5. The residual stress values at intersecting points of mesh on the tooth flank were measured with an X-ray diffraction system. The sin2ψ value used for fitting was tested in the seven directions of positive and negative ψ, which is the angle between the normal line of the specimen and the normal line of the diffraction crystal. The diameter of the optical grating used was 1 mm. We attempted to ensure that the tooth flank was perpendicular to the instrument probe when we installed the test sample. After measurement, 96 data points measured on each tooth flank were fitted to the residual stress nephogram using the four-grid spline function interpolation method in MATLAB. Then the residual stress values on H5, V2, and V7 lines of the four driven gears were compared to determine the relationship between the changing law of residual stress and fatigue failure.

2.3. Hardness Measurement

The representative gear teeth selected above were cut from line V2 along the plane parallel to gear transverse. Abrasive papers (400#, 800#, 1000#, and 2000#) were used to grind the cross-section surface, and then mechanical polishing was carried out. We selected the points on the tooth flanks: (V2, H4), (V2, H5), (V2, H6), and (V2, H8), and then the hardness values of points of L1, 2, 3, and 4 were measured using a Nano Indenter G200 (KLA-Tencor, Milpitas CA, USA) (Figure 6b). From the tooth flank to a depth of 1.5 mm, hardness at control locations was spaced every 0.15 mm, and from a 1.5-mm depth to the core of the teeth, hardness was measured every 0.50 mm.

2.4. Microstructure Sample Preparation

The cross-section surfaces of the samples mentioned above were ground by abrasive 2000#, and then mechanical polishing was carried out. After that, the cross-section surface was corroded with 4% nitric acid alcohol solution for 4 s and washed with absolute ethanol, and the surface was dried using a dryer. The microstructure of the samples was observed using a Zeiss SEM microscope (Zeiss, Obbo Cohen, Germany).
Slices with a thickness of 0.5 mm were cut from the zone near point (V3, H5) without failure on the tooth flank of gears 2-2 and 4-2. The sampling position was 0.1 mm under the surface. The cutting position is shown in Figure 7a and the schematic diagram of slices is shown in Figure 7b. Slices were ground to 70 μm and then thin discs were cut from the slices. These thin discs served as TEM samples after having been thinned by two-jet thinning processes. The microstructure of the samples was observed by means of a JEM-F200 TEM microscope (JEOL, Tokyo, Japan).

3. Results and Discussion

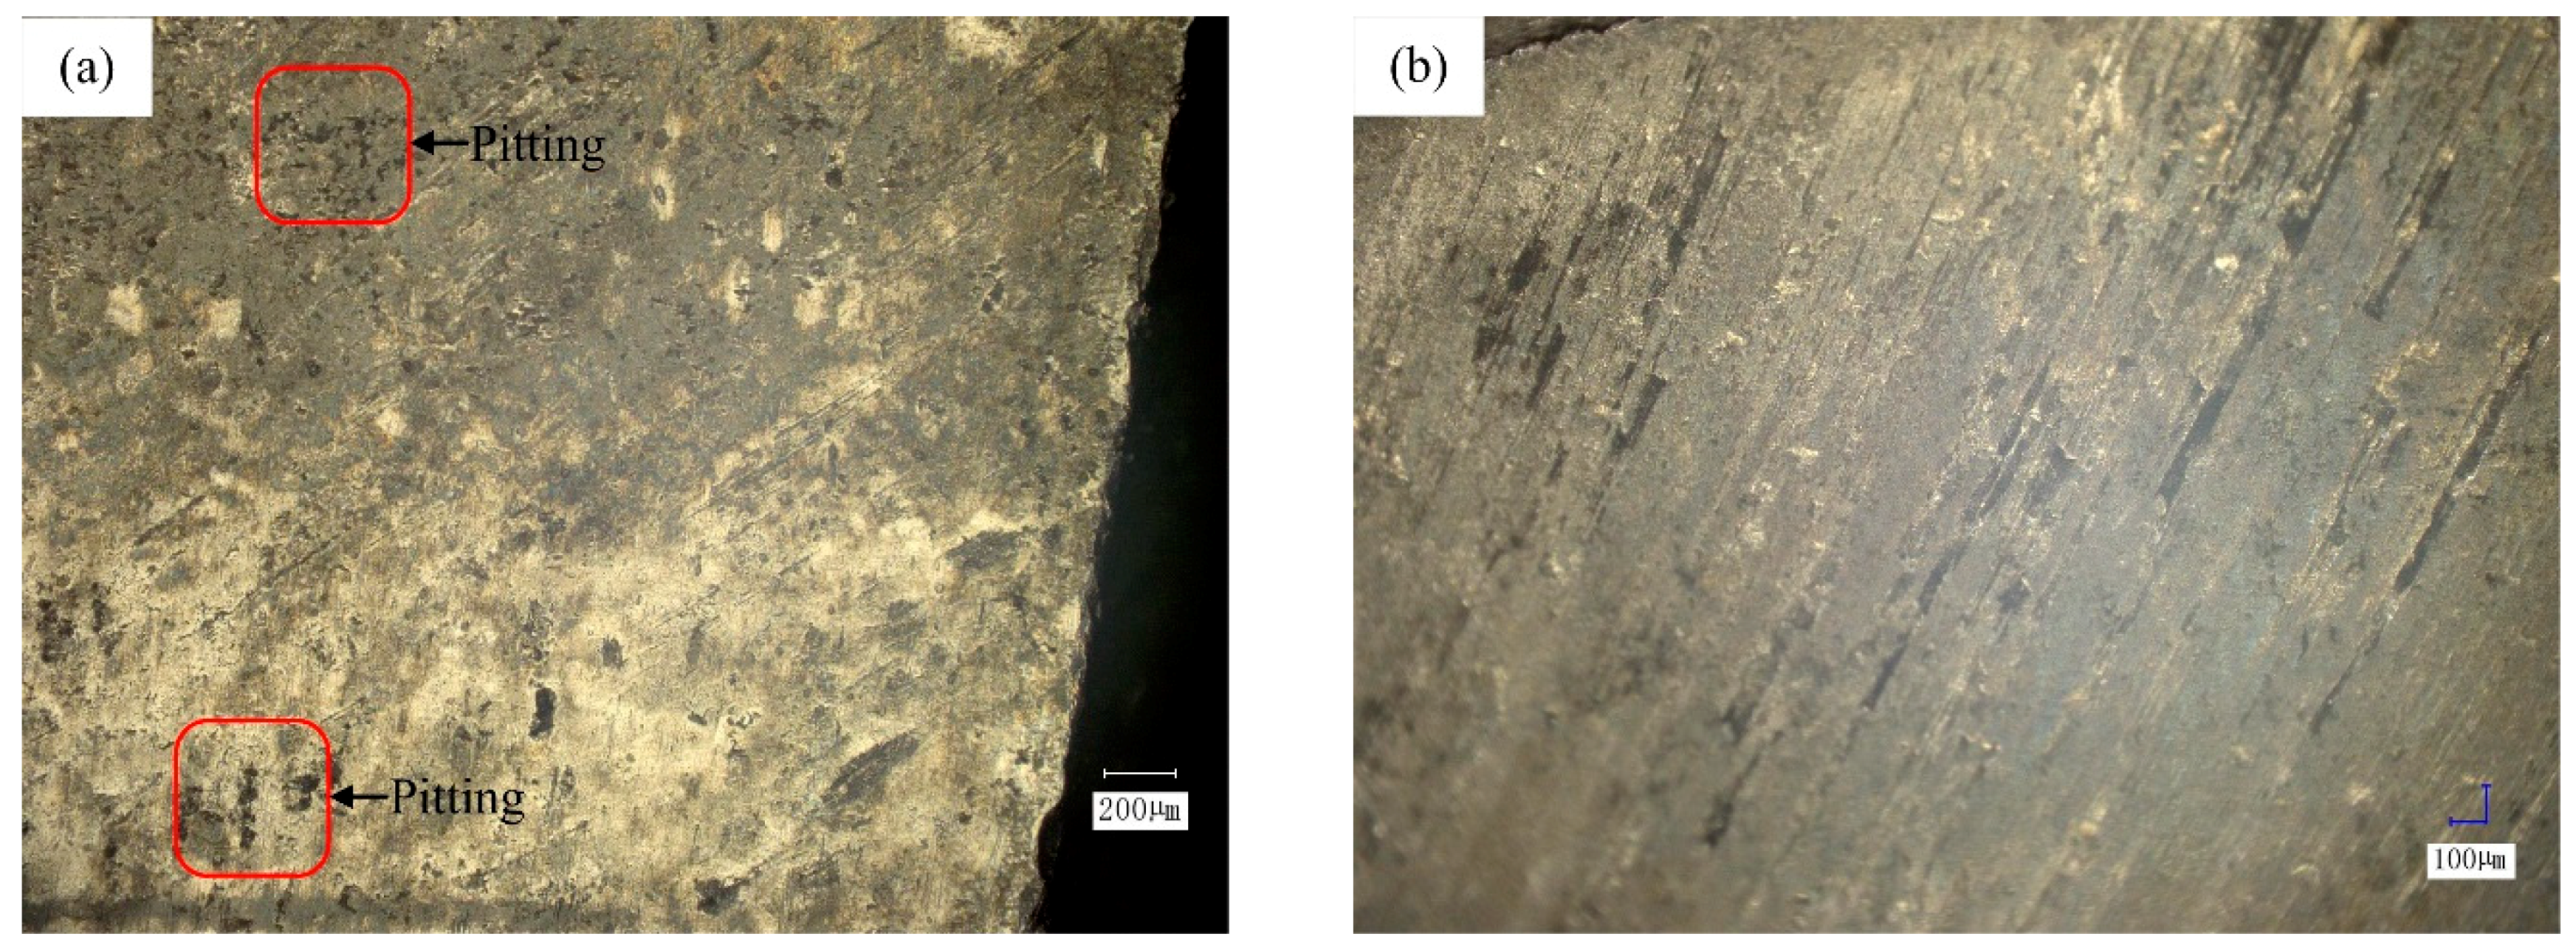
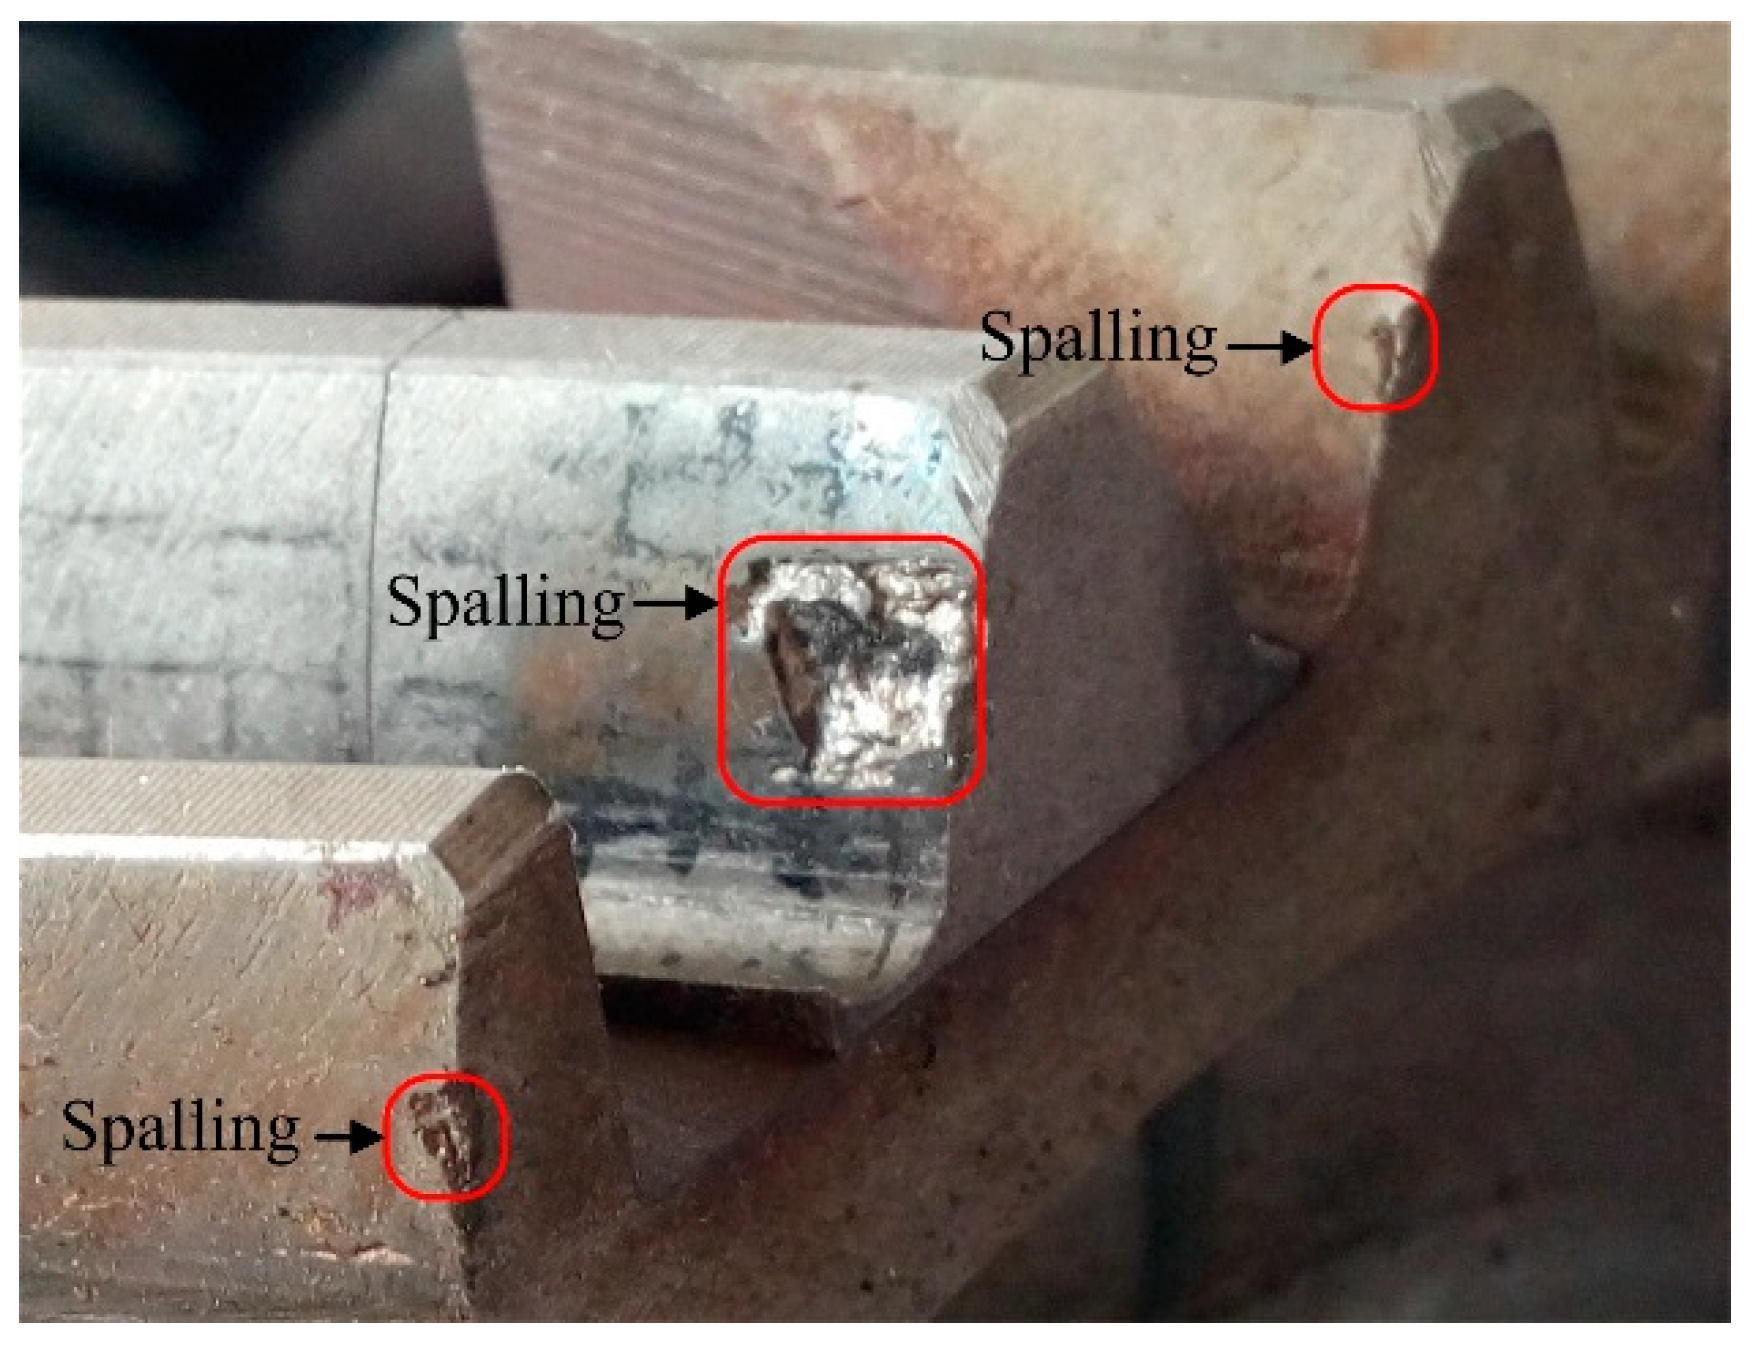
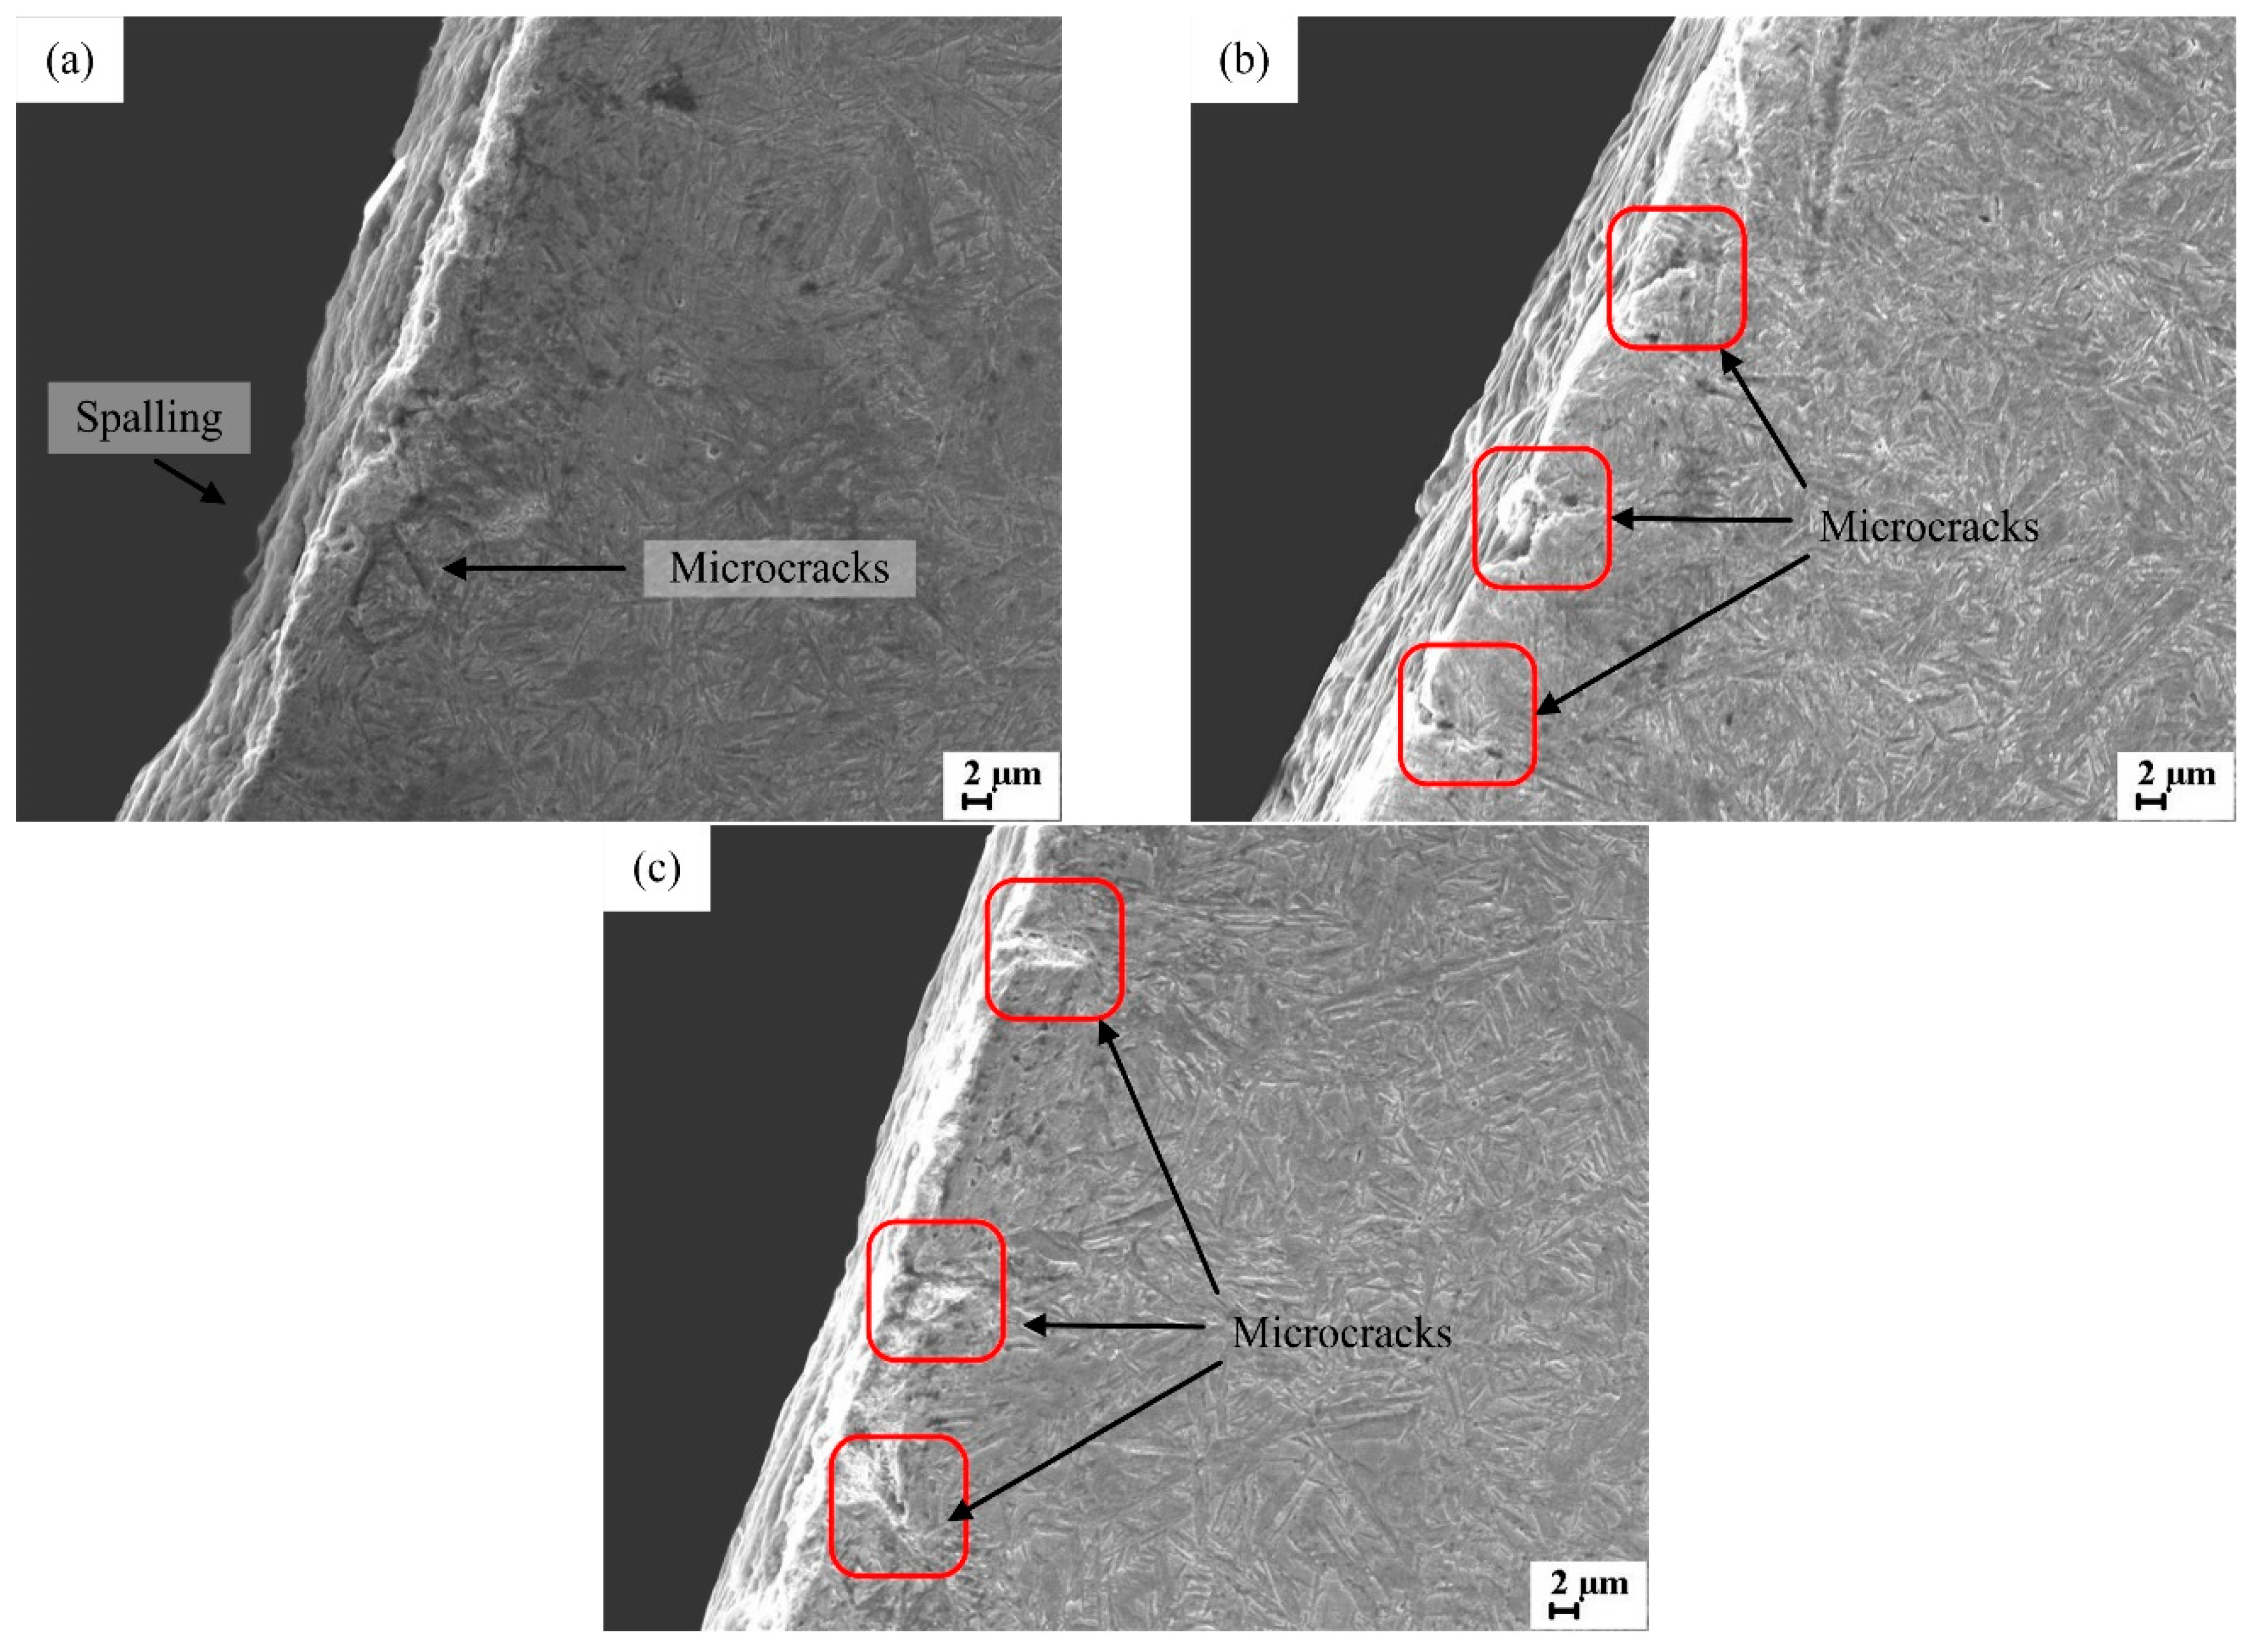
3.1. Analysis of Morphology

The cut representative teeth are shown in Figure 8, without cyclic loading for gear 1-2 (Figure 8a). Gear 2-2 had no teeth failure (Figure 8b). In the third test group, gear 3-1 did not fail, and gear 3-2 had a 1.5 × 4 mm spalling near the point (V8, H5) close to the pitch circle of the transverse (Figure 8c). No failure occurred on the gear 4-1 tooth flank; there was a large zone of continuous cracking spalling near the transverse of gear 4-2 (Figure 8d). The maximum depth of the spalling was 0.72 mm. This spalling usually had the characteristics of a sharp edge profile and irregular edge shape.
The tooth of gear 2-2 was observed with a digital microscope. Under 106 cyclic loading, a bright fatigue striation was formed on the lower side of the pitch circle. This indicated that in the early stage of meshing, the effective contact zone of the tooth flank increased with increasing number of cycles, and gear meshing condition was good. It should be noted that a small amount of pitting formed in the fatigue striation zone around point (V7, H6) in this stage (Figure 9a). Diameters of the small pits were less than 50 μm, and pit depths were less than 10 μm. This is related to the intrusion of lubricating oil into surface cracks, and fluid pressure forced cracks to develop into pitting. In Figure 9a, a large amount of small pits were formed in the upper left corner (V7, H4) farther from the pitch circle. The reason for this was that the relative sliding speed of the zone farther from the pitch circle was large, and the friction coefficient was large because of the poor lubricating condition caused by the large linear velocity. After cyclic alternating loading, tangential instability lodging of the small bulges created during the machining process occurred. Small bulges peeled off after repeated bending. The spalling of small bulges was also clearly observed in the tooth addendum (Figure 9b).
Under 3.3 × 10⁶ cyclic loading, the edge of the spalling on the tooth flank of gear 3-2 was observed (Figure 10a), and a large amount of conchoidal shallow spalling with a diameter of less than 0.5 mm and depth of less than 0.2 mm appeared at the zone 0.4–2 mm from the transverse. Using a digital microscope to further observe the spalling 0.6 mm away from the edge of the large spalling at the transverse, we found that there were a large number of aggregated granular objects with a diameter of 3–6 μm in the spalling pit (Figure 10c). This might have been caused by the mismatch between the plastic formation process and the subsequent heat treatment process. In addition, at the zone 0.3–0.8 mm away from the spalling at the transverse, a large amount of micro-cracks 0.3 mm in length and less than 0.02 mm in depth appeared.
Continuous spallings on the boundary of the tooth meshing zone were observed in the teeth in the vicinity of the cut tooth of gear 4-2 (Figure 11). This further indicated that the spalling began at the pitch point of the transverse, which might have been due to the insufficient bearing capacity of the transverse profile caused by the machining marks on the transverse. Under the effect of variable loading, a number of fatigue crack sources in the circumferential direction formed; the connection of fatigue cracks could cause spalling. Meanwhile, as observed in Figure 8d, the edge of the spalling was sharp and the spalling pit was stepped. This occurred because the carburizing process of the gear increased the brittleness of the material and accelerated the crack propagation. With the increase in the single tooth spalling zone, uneven loading impact on the gear might have been caused. Due to this, the tooth flank spalling gradually occurred near the gear transverse.
Then, observing the indentation-type spalling boundary near the pitch circle of the cut tooth of gear 4-2, a large number of cracks with lengths of approximately 100–600 μm appeared at a distance of 0.2 mm (V6, H8) from the edge of the shallow spalling (Figure 12a). The zone near point (V5, H5) showed a stepped layer spalling (Figure 8d and Figure 12b). We observed that the surface layer was crushed and separated. The depth of step 1 was about 0.3 mm, and the depth of step 2 was about 0.6 mm. According to Hertz’s theory, the failure form belonged to typical spalling caused by the initiation of cracking in the transition zone of the hardened layer, and multi-layer spalling was caused by continued cyclic loading after failure.

3.2. Residual Stress Analysis

Both normal and shear stresses were measured in this study, but we actually focused our analyses on normal stresses. The residual stress distribution on the one-third contact tooth flank of gear 1-2 without loading was observed (Figure 13a). The carburized zone covered the tooth flank area from the addendum to the addendum-dedendum transition zone, and the average residual compressive stress value was −593.1 MPa. Also, there were no obvious changes in the residual compressive stress in the zone near the addendum and the pitch circle. This indicated that the carburizing process would contribute to forming uniform residual compressive stress on the tooth flank. In addition, due to the hobbing and shaving processes, a micro-deformation zone arose on the tooth flank, and the tensile and compressive stresses in the zone increased. Thus, this led to residual stress error in the measurement. There were small fluctuations in the residual compressive stress of the tooth flank in the carburizing hardening zone (Figure 13a). The shot peening process was not adopted to strengthen the dedendum of gear. Therefore, compared with the tooth flank, the residual compressive stress at the dedendum line H12 was smaller, and the average residual compressive stress value was −369.3 MPa.
The tooth flank of gear 2-2 was in a normal wear stage (Figure 8b) after 106 cyclic loading. In Figure 13b, the residual compressive stress in the meshing zone, except for line H1, was obviously larger than that of the unloaded gear. This occurred because, in the early period of cyclic loading, the tooth flank had micro plastic deformation under the low-cycle alternating circulation contact stress, which then produced cold-work hardening. Also, the contact fatigue strength of the tooth flank further increased and the residual compressive stress improved. The residual compressive stress values at line H5 and line H6 below the pitch circle were obviously higher than those of the other zones of the tooth flank, and the average value was −782.0 MPa. The reason for this was that the contact stress in this zone was larger than the others, and the effect of cold-work hardening was more apparent than the others. Comparing gear 1-2 with gear 2-2, the residual compressive stress at the dedendum line H12 decreased from −369.3 MPa to −285.5 MPa (Figure 13a,b, respectively). This indicates that the superimposed bending fatigue stress surpassed the cyclic yield strength of the material, and residual compressive stress relaxation appeared near the dedendum line H12.
The gear failure mode after 3.3 × 10⁶ cyclic loading is shown in Figure 8c. The residual stress fitting flank of the meshing zone is shown in Figure 13c. Comparing the residual stress value of gear 3-2 with those of the other gears, the residual compressive stress values at pitch circle H5 and line H6 were lower than the others. Also, the average residual compressive stress value of pitch circle H5 and line H6 were reduced by 7.6% with respect to gear 1-2, and by 29.0% compared with gear 2-2 (Figure 13a–c). This indicated that the aggregation of the pitting in the zone resulted in residual compressive stress relaxation. In addition, the residual compressive stress value 1 mm away from the edge of the spalling was larger than that farther away from the spalling. The residual compressive stress value of the dedendum of gear 3-2 was lower than that of gear 2-2, and its average residual compressive stress value decreased to −138.7 MPa.
After 5.0 × 10⁶ cyclic loading, the residual stress distribution of the meshing zone of gear 4-2 was fitted (Figure 13d). The residual compressive stress of the tooth flank fluctuated in the zone from lines V5 to V8 and from lines H5 to H8. That zone was the spalling on the tooth flank. The average value of the residual compressive stress on the tooth flank outside the spalling zone was lower than that of gear 2-2. The average residual compressive stress value of the dedendum line H12 of gear 4-2 was −138.6 MPa.
Variation in the residual compression stresses in the contact fatigue process was further analyzed, as shown in Figure 14.
For the pitch circle H5 of gear 1-2, residual stress varied between −640 and −540 MPa. This indicated that although carburization enabled the tooth flank to obtain better contact strength, the tooth flank still had a large residual compressive stress value because there was no grinding process after carburization. For 1.0 × 10⁶ cycles, the residual stresses in pitch circle H5 of gear 2-2 were higher than those of gear 1-2 but the two distributions showed the same trend. The residual compressive stress value gradually decreased along the direction from the meshing boundary to the transverse profile. Because the contact stress value of the pitch circle near the transverse was large, the smaller residual compressive stress could avoid contact fatigue failure in the early period of cyclic loading. For 3.3 × 10⁶ cycles, diffuse pitting occurred near the pitch circle H5 of gear 3-2 (Figure 10b), thus relaxing the residual compressive stress that dropped between −610 and −490 MPa. For 5.0 × 10⁶ cycles, a spalling near the 4-2 gear transverse was observed (Figure 12b), covering about half the pitch circle in the meshing zone. Reduction in the contact area caused residual stress to increase significantly. It appears that residual compressive stress accumulated as loading cycles progressed below the design life. Residual stress relaxed as soon as micro-cracks and pitting occurred and developed in the flank and near-flank regions. Beyond fatigue life, the pitch circle near the transverse deformed plastically. Severe tooth flank spalling yielded higher residual compressive stress in the pitch circle of the tooth flank.
The distribution of the compressive residual stress along the tooth profile was also analyzed. Figure 15 shows the corresponding curves for lines V2 and V7, parallel to the transverse section of the tooth. Points 1–9 occur in the meshing zone and points 10–12 occur in the dedendum zone.
The residual compressive stress of line V2 showed a convex distribution with higher values in the central part (Figure 15a). The residual compressive stress value at points 4–6 near the pitch circle was the highest, and it gradually decreased to the lowest at points 11–12 near the dedendum. Similar distributions were obtained for line V7 (Figure 15b). Comparing Figure 15b with Figure 15a, the maximum residual compressive stress transferred to points 6–8, the lower side of the pitch circle. This indicated that the meshing line experienced the maximum contact stress, which led to the most obvious accumulative cycle of the residual compressive stress.

3.3. Micro-Hardness

Figure 16a presents the hardness distribution measured along the inner normal direction at point (V2, H5) of gears 2-2, 3-2, and 4-2. Hardness gradually decreased from the tooth flank to the core. Combined with the depth of the carburized layer, the shallow surface layer from the surface to a 0.3-mm depth was analyzed. Below 106 cycles, hardness was rather constant along the inner normal direction and reached, on average, 970 HV. With the increase in the cycle number, the hardness value of the surface hardened layer increased first and then decreased, and decreased along the inner normal direction. In addition, the hardness value of the hardened layer of the tooth flank increased at 106 cycles. Comparing the hardness of the tooth flank at lower cycle numbers, the hardness value of the hardened layer of the tooth flank was lower for 3.3 × 10⁶ cycles and 5.0 × 10⁶ cycles. This indicated that the long-term meshing decreased the hardness of the tooth flank, which would likely accelerate the contact fatigue failure of the gear. Subsequently, the hardness value decreased significantly from a depth of 0.3 mm to 1.2 mm of the carburized layer. From a 1.2-mm depth to the core, the hardness decreased slowly.
In Figure 16b, after 106 cycles, the hardness values on L3 were higher than those measured on L1, 2, and 4. Since contact stress on line H6 below the pitch circle was highest on the tooth flank, the hardness enhancement was more significant for L3 and the inner normal of intersection (V2, H6) in the early part of the fatigue progress. The hardness value of L2 and the inner normal of the intersection (V2, H5) were the second largest—slightly lower than that of L3. The hardness value of L4 and the inner normal of intersection (V2, H8) were the lowest.
Figure 16b–d were compared to each other. The carburized layer thickness was smaller than 2 mm. At 106 cycles, L2 showed the overall largest hardness. Hardness variations observed along lines L1 and L3 were consistent with those of line L2. Microstructure analysis (Figure 17 and Figure 18) indicated that structural performance of the gear flank decays for smaller values of hardness.

3.4. Microstructure

The microstructure near the pitch circle on the tooth flank of gear 4-2 was observed (Figure 17a), distributing a large amount of acicular martensite and a small amount of retained austenite. A flake is about to peel off at the pitch circle of the tooth flank. The initial crack began to expand inward, which could lead to the appearance of spalling. With the mutual expansion of some parallel micro-cracks on the subsurface layer, and with the contact internal compressive stress surpassing the critical value, due to the anisotropy of the material, tearing from the inside to the outside under the effect of cyclic loading led to this spalling formation. There was a small amount of micro-cracks inside the hardened layer located at point (V2, H2) above the pitch circle. Compared with the microstructure at the pitch circle, acicular martensite content increased (Figure 17b) and martensite content decreased at point (V2, H6) below the pitch circle. Lubricating oil was pressed into the micro-cracks, and a high-pressure chamber was formed, causing the cracks to expand and connect and thus leading to spalling (Figure 17c).
The micro-morphology of the tooth flank near the pitch circle of gear 1-2 was observed (Figure 18a). Compared with gear 4-2, the surface was relatively flat and there were no micro-cracks on the surface, but the content of martensite in the microstructure was the greatest. The core microstructure was composed of lath martensite, retained austenite, and cementite, and the content of martensite was obviously less than that of the tooth flank (Figure 18b). This proves that the carburized layer had a more acicular martensite, thereby increasing the surface hardness, and the surface could withstand greater contact stress. This improved the contact fatigue strength to reduce tooth flank failure.
The transmission microstructure near the pitch circle of the tooth meshing zone of gear 2-2 after 106 cycles loading was observed, and a large amount of twin martensite was distributed inside the microstructure (Figure 19a). The uniform distribution of the banding precipitated phases inside the microstructure, increasing the hardness value of the tooth flank (Figure 19b). In addition, there was a small number of dislocations within the microstructure (Figure 19c).
The transmission microstructure near the pitch circle of the tooth flank of gear 4-2 after 3.3 × 10⁶ cycles was observed (Figure 20a). Compared with gear 2-2, the content of twin martensite inside the microstructure was lower. The corresponding hardness value of the tooth flank decreased, and the tooth flank of gear 4-2 was prone to fail under cyclic loading. After long-term cyclic loading, the precipitates aggregated and grew (Figure 20b). The discontinuous distribution hindered the grain boundary slip. The dislocation density increased, and the pile-up of dislocation resulted in stress concentration at the grain boundary and the phase boundary, which induced the initiation of fatigue cracks of the tooth flank.

4. Conclusions

The morphology, residual stress, hardness, and microstructure evolution in helical gears under fatigue loads after different numbers of cycles were studied using the non-entire tooth meshing contact fatigue test. The following conclusions were derived:
(1)
Residual compressive stress accumulated as the number of fatigue cycles increased. Beyond a certain limit of cycles, stress relaxed with the appearance of micro-cracks and pitting in the flank and the near flank of the tooth. Local plastic deformations appeared at the pitch circle zone. If spalling was severe, residual compressive stress increased at the pitch circle zone of the tooth flank.
(2)
As cycle number increased, the hardness of the surface hardened layer increased first and then decreased, also decreasing along the inner normal direction. The hardness value of the hardened layer of the tooth flank increased under low cyclic loading. For example, the hardness value of the hardened layer of the tooth flank decreased under high cyclic loading. In the long-term tests, the hardness of the tooth flank decreased, thus accelerating fatigue failure.
(3)
The higher content of acicular martensite in the carburized layer allowed the surface to withstand higher contact stresses without the risk of tooth flank failure.
(4)
After cyclic loading, the content of twin martensite in the gear pitch circle decreased together with the hardness of the tooth flank. Long-term cyclic loading led to aggregation, growth, and discontinuous distribution of the precipitated phase, hindering the sliding of the grain boundary. Dislocation density increased and pile-up of dislocations resulted in stress concentration at the grain boundary and the phase boundary, which induced the initiation of fatigue cracks in the tooth flank.

Author Contributions

Conceptualization, F.Z.; Methodology, F.Z.; Software, R.C.; Formal Analysis, X.D.; Investigation, X.D.; Data Curation, Y.L.; Writing—Original Draft Preparation, X.F.; Writing—Review and Editing, T.W.; Visualization, R.C.; Funding Acquisition, F.Z.; Supervision, F.Z.

Funding

This work was supported by the post-doctoral start-up fund of Taiyuan University of Science and Technology (20152034), the Natural Science Foundation of Shanxi Province (201701D221135 and 201701D111003), National College Students Innovation and Entrepreneurship Project (201710109003 and 201610109007), National Key Research and Development Plan (2016YF130300200), and the 1331 Project of Shanxi Province.

Acknowledgments

Thank Taiyuan University of Technology Gear Research Institute for testing materials and equipment. Thank Taiyuan University of Science and Technology for providing analytical instruments.

Conflicts of Interest

The authors declare no conflict of interest. The funders had no role in the design of the study; in the collection, analyses, or interpretation of data; in the writing of the manuscript, and in the decision to publish the results.

References

  1. Kattelus, J.; Miettinen, J.; Lehtovaara, A. Detection of gear pitting failure progression with on-line particle monitoring. Tribol. Int. 2018, 118, 458–464. [Google Scholar] [CrossRef]
  2. Ma, H.; Li, Z.; Feng, M.; Feng, R.; Wen, B. Time-varying mesh stiffness calculation of spur gears with spalling defect. Eng. Fail. Anal. 2016, 66, 166–176. [Google Scholar] [CrossRef]
  3. Zhang, J.; Li, W.; Wang, H.; Song, Q.; Lu, L.; Wang, W.; Liu, Z. A comparison of the effects of traditional shot peening and micro-shot peening on the scuffing resistance of carburized and quenched gear steel. Wear 2016, 368, 253–257. [Google Scholar] [CrossRef]
  4. Aslantas, K.; Tasgetiren, S. A study of spur gear pitting formation and life prediction. Wear 2004, 257, 1167–1175. [Google Scholar] [CrossRef]
  5. Mariani, U.; Molinaro, R.; Sartori, S.; Gasparini, G.; Gorla, C. Improvements in fatigue evaluations of helicopter transmissions. In ICAF 2011 Structural Integrity: Influence of Efficiency and Green Imperatives, Proceedings of the 26th Symposium of the International Committee on Aeronautical Fatigue; Komorowski, J., Ed.; Springer: Berlin, Germany, 2011; pp. 959–969. [Google Scholar]
  6. Hein, M.; Tobie, T.; Stahl, K. Parameter study on the calculated risk of tooth flank fracture of case hardened gears. In Proceedings of the JSME International Conference on Motion and Power Transmissions, Kyoto, Japan, 1–3 March 2017. [Google Scholar]
  7. Rego, R.; Löpenhaus, C.; Gomes, J.; Klocke, F. Residual stress interaction on gear manufacturing. J. Mater. Process. Technol. 2018, 252, 249–258. [Google Scholar] [CrossRef]
  8. Conrado, E.; Gorla, C.; Davoli, P.; Boniardi, M. A comparison of bending fatigue strength of carburized and nitrided gears for industrial applications. Eng. Fail. Anal. 2017, 78, 41–54. [Google Scholar] [CrossRef]
  9. Gorla, C.; Rosa, F.; Concli, F.; Albertini, H. Bending fatigue strength of innovative gear materials for wind turbines gearboxes: Effect of surface coatings. In Proceedings of the ASME International Mechanical Engineering Congress and Exposition, Houston, TX, USA, 9–15 November 2012; pp. 3141–3147. [Google Scholar]
  10. Gorla, C.; Conrado, E.; Rosa, F.; Concli, F. Contact and bending fatigue behaviour of austempered ductile iron gears. Proc. Inst. Mech. Eng. Part C J. Mech. Eng. Sci. 2018, 232, 998–1008. [Google Scholar] [CrossRef]
  11. Gorla, C.; Rosa, F.; Conrado, E.; Concli, F. Bending fatigue strength of case carburized and nitrided gear steels for aeronautical applications. Int. J. Appl. Eng. Res. 2017, 12, 11306–11322. [Google Scholar]
  12. Emmert, S.; Schoennenbeck, G.; Oster, P.; Rettig, H. Testverfahren zur Untersuchung des Schmierstoffeinflusses auf die Entstehung von Grauflecken bei Zahnra¨ dern; No. 54/I-IV; FVA Informationsblatt: Frankfurt, Germany, 5 July 1993. [Google Scholar]
  13. Lingamanaik, S.N.; Chen, B.K. The effects of carburising and quenching process on the formation of residual stresses in automotive gears. Comput. Mater. Sci. 2012, 62, 99–104. [Google Scholar] [CrossRef]
  14. Savaria, V.; Monajati, H.; Bridier, F.; Bocher, P. Measurement and correction of residual stress gradients in aeronautical gears after various induction surface hardening treatments. J. Mater. Process. Technol. 2015, 220, 113–123. [Google Scholar] [CrossRef]
  15. Savaria, V.; Bridier, F.; Bocher, P. Predicting the effects of material properties gradient and residual stresses on the bending fatigue strength of induction hardened aeronautical gears. Int. J. Fatigue 2016, 85, 70–84. [Google Scholar] [CrossRef]
  16. Mallipeddi, D.; Norell, M.; Sosa, M.; Nyborg, L. Influence of running-in on surface characteristics of efficiency tested ground gears. Tribol. Int. 2017, 115, 45–58. [Google Scholar] [CrossRef] [Green Version]
  17. Liu, H.; Liu, H.; Bocher, P.; Zhu, C.; Wei, P. Effects of the case hardening properties on the contact fatigue of a wind turbine gear pair. Int. J. Mech. Sci. 2018, 141, 520–527. [Google Scholar] [CrossRef]
  18. Fukumasu, N.K.; Machado, G.A.A.; Souza, R.M.; Machado, I.F. Stress analysis to improve pitting resistance in gear teeth. Procedia CIRP 2016, 45, 255–258. [Google Scholar] [CrossRef]
  19. Jo, B.; Sharifimehr, S.; Shim, Y.; Fatemi, A. Cyclic deformation and fatigue behavior of carburized automotive gear steel and predictions including multiaxial stress states. Int. J. Fatigue 2016, 100, 454–465. [Google Scholar] [CrossRef]
  20. Lv, Y.; Lei, L.; Sun, L. Effect of microshot peened treatment on the fatigue behavior of laser-melted W6Mo5Cr4V2 steel gear. Int. J. Fatigue 2017, 98, 121–130. [Google Scholar] [CrossRef]
  21. Pariente, I.F.; Guagliano, M. Contact fatigue damage analysis of shot peened gears by means of X-ray measurements. Eng. Fail. Anal. 2009, 16, 964–971. [Google Scholar] [CrossRef]
  22. Batista, A.C.; Dias, A.M. Contact Fatigue of Carbonitrided and Shot-Peened Gears. Effects of Residual Stresses; Faculdade de Engenharia da Universidade do Porto: Porto, Portugal, 5 June 2003. [Google Scholar]
  23. Yu, Z.; Xu, X. Failure investigation of a truck diesel engine gear train consisting of crankshaft and camshaft gears. Eng. Fail. Anal. 2010, 17, 537–545. [Google Scholar] [CrossRef]
  24. Terrin, A.; Dengo, C.; Meneghetti, G. Experimental analysis of contact fatigue damage in case hardened gears for off-highway axles. Eng. Fail. Anal. 2017, 76, 10–26. [Google Scholar] [CrossRef]
  25. Al-Meshari, A.; Al-Zahrani, E.; Diab, M. Failure analysis of cooling fan gearbox. Eng. Fail. Anal. 2012, 20, 166–172. [Google Scholar] [CrossRef]
  26. Yücel, S.C.; Özenli, L.; Gençol, T.; Alanyalı, E. Flywheel starter ring gear failures and hardness variation reduction in surface hardening process. Case Stud. Eng. Fail. Anal. 2015, 4, 8–19. [Google Scholar] [CrossRef]
  27. Siddiqui, N.A.; Deen, K.M.; Khan, M.Z.; Ahmad, R. Investigating the failure of bevel gears in an aircraft engine. Case Stud. Eng. Fail. Anal. 2013, 1, 24–31. [Google Scholar] [CrossRef]
  28. Asi, O. Fatigue failure of a helical gear in a gearbox. Eng. Fail. Anal. 2006, 13, 1116–1125. [Google Scholar] [CrossRef]
  29. Lin, C.-K.; Lai, P.-K.; Shih, T.-S. Influence of microstructure on the fatigue properties of austempered ductile irons—I. Highcycle fatigue. Int. J. Fatigue 1996, 18, 297–307. [Google Scholar] [CrossRef]
  30. Magalhaes, L.; Seabra, J.; Sa, C. Experimental observations of contact fatigue crack mechanisms for austempered ductile iron (ADI) discs. Wear 2000, 246, 134–148. [Google Scholar] [CrossRef]
  31. Greno, G.L.; Otegui, J.L.; Boeri, R.E. Mechanisms of fatigue crack growth in Austempered Ductile Iron. Int. J. Fatigue 1999, 21, 35–43. [Google Scholar] [CrossRef]
  32. Manda, P.; Singh, S.; Singh, A.K. Failure analysis of cooler fan drive gear system of helicopter. Mater. Today Proc. 2018, 5, 5254–5261. [Google Scholar] [CrossRef]
  33. Guagliano, M.; Riva, E.; Guidetti, M. Contact fatigue failure analysis of shot-peened gears. Eng. Fail. Anal. 2002, 9, 147–158. [Google Scholar] [CrossRef]
  34. Kattoura, M.; Telang, A.; Mannava, S.R.; Qian, D.; Vasudevan, V.K. Effect of ultrasonic nanocrystal surface modification on residual stress, microstructure and fatigue behavior of ATI 718Plus alloy. Mater. Sci. Eng. A 2018, 711, 364–377. [Google Scholar] [CrossRef]
Figure 1. Closed electric power streaming gear test machine: (a) test rig and (b) schematic diagram of test rig: 1—motor, 2—counter, 3—gear box 2, 4—loader, 5—oil temperature indicator, 6—thermocouple, 7—gear box 1, 8—coupling, 9—speed and torque sensor, and 10—control cabinet.
Metals 08 00693 g001
Figure 2. Stress-number of cycles (S-N) curve.
Metals 08 00693 g002
Figure 3. Schematic diagram of one-third of the tooth width meshing.
Metals 08 00693 g003
Figure 4. Finite element method (FEM) model: (a) constraints and loadings and (b) mesh.
Metals 08 00693 g004
Figure 5. Finite element stress nephograms: (a) driving gear; (b) driven gear.
Metals 08 00693 g005
Figure 6. (a) Meshing method of tooth flank meshing zone: (V2, H2) illustrates the representation method of the intersecting points. For example, (V2, H2) is the intersecting point of line V2 and line H2. (b) Position distribution of hardness measurement (L1, 2, 3, and 4 denote lines along the inner normal direction of points (V2, H4), (V2, H5), (V2, H6), and (V2, H8), respectively.
Metals 08 00693 g006
Figure 7. Schematic diagram of the slice: (a) the cutting position of the slice labeled in blue, (b) the cut slice with the thin disc labeled in red.
Metals 08 00693 g007
Figure 8. Macroscopic morphology of gears’ teeth: (a) gear 1-2, (b) gear 2-2, (c) gear 3-2, and (d) gear 4-2.
Metals 08 00693 g008
Figure 9. Typical morphology of gear 2-2 tooth flank: (a) point (V8, H5) and (b) point (V6, H2).
Metals 08 00693 g009
Figure 10. Morphology of the zone near spalling on gear 3-2 tooth flank: (a) point (V8, H8), (b) point (V7, H5), and (c) the three-dimensional (3D) morphology of the spalling zone in (a) (the purple represents the deeper zone, and the red represents the shallower zone).
Metals 08 00693 g010
Figure 11. Macroscopic morphology of gear 4-2.
Metals 08 00693 g011
Figure 12. Morphology of the zones near the spalling on the gear 4-2 tooth flank: (a) point (V5, H8) and (b) point (V5, H5).
Metals 08 00693 g012
Figure 13. Fitting flanks of residual stress value: (a) gear 1-2, (b) gear 2-2, (c) gear 3-2, and (d) gear 4-2.
Metals 08 00693 g013
Figure 14. Variation in compressive residual stress along gear pitch circle H5.
Metals 08 00693 g014
Figure 15. Residual stress distributions curve in the direction from the addendum to dedendum: (a) line V2, and (b) line V7: control points are at the intersections between lines H1–H12 and V2, V7. For example, point 3 in (a) is point (V2, H3) in the tooth flank.
Metals 08 00693 g015
Figure 16. Hardness distributions measured for gear teeth: (a) gear 2-2, 3-2, and 4-2; (b) L1, 2, 3, and 4 of gear 2-2; (c) L1, 2, 3, and 4 of gear 3-2; and (d) L1, 2, 3, and 4 of gear 4-2.
Metals 08 00693 g016
Figure 17. Microstructure of the zone near the tooth flank of gear 4-2: (a) pitch point (V2, H5), (b) point (V2, H2), and (c) point (V2, H6).
Metals 08 00693 g017
Figure 18. Microstructure of the tooth flank and core of gear 1-2: (a) surface and (b) core.
Metals 08 00693 g018
Figure 19. Transmission electron microscopy (TEM) images of pitch point on the tooth flank of gear 2-2: (a) twin martensite, (b) banding precipitated phases, and (c) dislocation.
Metals 08 00693 g019
Figure 20. TEM images of the pitch point on the tooth flank of gear 4-2: (a) twin martensite and (b) banding precipitated phases and dislocation.
Metals 08 00693 g020
Table 1. Chemical composition (wt %) of 20CrH steel.
FeCSiMnSPCrNiCu
Base0.20.270.850.0140.0130.80.0130.015
Table 2. Details of the gears.
SpecificationDriving GearDriven Gear
Number of teeth2734
Tooth width2926
Pitch diameter (mm)132.78167.21
Normal module (mm)4.5
Pressure angle (°)22.5
Helix angle (°)23.74°
Table 3. Details of experimental tests on helical gears.
Numbers of Groups1234
Gear *1-11-22-12-23-13-24-14-2
Number of cycles01063.3 × 1065.0 × 106
Torque load (Nm)1500
Active face width (mm)9
Resultxxxxxoxo
* Gear number is used to represent a certain gear, for example, gear 2-1 represents the driving gear in the second group. x = intactness; o = spalling.

