Article

Electrodeposition Kinetics of Ni/Nano-Y2O3 Composite Coatings

Electrochemical Metallurgy and New Materials Laboratory, School of Materials & Metallurgy, University of Science and Technology Liaoning, Anshan 114051, China
*
Author to whom correspondence should be addressed.
Metals 2018, 8(9), 669; https://doi.org/10.3390/met8090669
Submission received: 23 July 2018 / Revised: 19 August 2018 / Accepted: 24 August 2018 / Published: 27 August 2018

Abstract

:
Ni/nano-Y2O3 composite films were successfully prepared by electrochemical deposition using an acid sulfamate bath. The influence of solid particles added to electrolyte on electrodeposition was investigated by electrochemical measurement methods. The linear sweep voltammetry test showed that the composite deposition took place at a greater potential than that of nickel, and the presence of nano-Y2O3 decreased cathodic polarization. Chronoamperometry studies indicated that the nucleation model of both deposits similarly approached the theoretical instantaneous nucleation mode based on the Scharifker–Hills model. The Y2O3 particles adsorbed on the cathodic surface were shown to facilitate the nucleation/growth of the nickel matrix which is consistent with the deposition kinetics parameters calculated by non-linear fitting experimental curves. The results of electrochemical impedance spectroscopy showed that the presence of Y2O3 particles in a bath is beneficial for the decrease in charge transfer resistance in the deposition. The atomic force microscopy observations of both deposits obtained in the initial electrodeposition stage confirmed that the Ni-Y2O3 composite had a higher grain number and finer mean grain size.

1. Introduction

Recently, metal matrix composites reinforced with solid particles have been widely applied in many engineering fields owing to their enhanced physical and chemical properties (e.g., high level of hardness, wear and corrosion resistance, and thermal stability, among others) [1,2,3]. Generally, metallic composites can be fabricated through diverse technologies, such as hot pressing [4], casting [5], thermal spraying [6], cold spraying [7], powder metallurgy [8], and electrochemical deposition [9]. Among these techniques, electrodeposition has attracted much attention due to its lower cost and ability to operate at an ambient temperature and under normal pressure. In addition, the superior properties of composite materials can be easily achieved by adjusting the operating parameters of the electrodeposition process. This unique advantage gives rise to a brand-new process of electrochemical deposition. Nickel coatings have been widely applied in various industrial and engineering fields due to their superiority in terms of mechanical properties which also makes it feasible to be used as a composite matrix. Indeed, various Ni-based composite coatings have been fabricated by electrodeposition, such as Ni-Al2O3 [10], Ni-SiC [11], Ni-CeO2 [12], Ni-TiO2 [13], Ni-Nd2O3 [14], Ni-TiN [15], Ni-WC [16] and Ni-WS2 [17]. However, thus far, only a few researchers have investigated the composite coating of a nickel matrix enhanced with nano-Y2O3 particles, and a few papers on the electrodeposition mechanism of the Ni-Y2O3 composite have been reported by using electrochemical measurements methods [18,19].
The co-deposition between solid particles and a metal matrix in an electrolyte bath is influenced by many factors, e.g., the composition of the bath, the current density applied to the deposition, the pH, the temperature, and the characteristics of the solid particles. Meanwhile, electro-crystallization, comprising nucleation and growth of fresh deposit, is critical to the morphology and properties of coatings. Studies on the electro-crystallization process of metal matrix composites have been reported in many republic journals. The co-deposition mechanisms of Ni-SiC and Ni-Al2O3 composite deposits measured in Watt-type plating-solutions have been studied, and the results showed that the nucleation/growth of both composites is governed by a progressive nucleation model under low potentials. However, instantaneous nucleation is dominant for both deposits under high potentials [10,11]. Ghaziof et al. [20] researched the electro-crystallization process of Zn-Ni/sol-Al2O3 composites from sulfate solutions, and the results showed that the nucleation of both deposits followed a 3D nucleation process controlled by diffusion. For Zn-Ni deposits, the nucleation mode approached theoretical progressive nucleation. However, instantaneous nucleation was predominant for the composite film, and the calculated nucleation rate and the number of active nucleation sites were higher than that of the alloy. Furthermore, particles absorbed on the cathodic surface were shown to provide feasible active reaction sites for the nucleation of the metal matrix during electrochemical deposition. Thus, the effect of solid particles on the initial electro-crystallization stage should be paid much attention. Accordingly, many theoretical models have been set up to explain the electro-crystallization between solid particles and metal matrices in co-deposition. Guglielmi’s two-step adsorption model is a widely accepted model which plays an important role in studying the co-deposition mechanism [21].
In this work, an attempt was made to determine the effects of nano-Y2O3 particles on the electro-crystallization processes of nickel during co-deposition through electrochemical measurement methods. The deposition kinetic parameters were calculated to provide a reference for the co-deposition mechanism. For this reason, electrochemical measurement methods, namely, linear sweep voltammetry (LSV), chronoamperometry (CA), and electrochemical impedance spectroscopy (EIS) were used in the acid sulfamate electrolyte bath. Atomic force microscopy (AFM) and an X-ray diffractometer (XRD) were applied for the characterization of surface morphology and microstructure.

2. Materials and Methods

2.1. Materials

Pure nickel film and Ni-Y2O3 composite were fabricated by electrodeposition in an acid sulfamate plating-solution (300 mL). Distilled water and analytical grade reagents were used to prepare plating-solutions consisting of 160 g/L Ni(NH2SO3)2·4H2O and 40 g/L H3BO3. For the composite, 10 g/L nano-Y2O3 particles were added to the plating solution, and the average size of nano-Y2O3 used was about 50 nm shown in Figure 1 [22], as observed by a transmission electron microscope (JEM-2100, JEOL, Beijing, China). For the electrodeposition, the anode was a polished pure nickel sheet of 30 × 30 × 2 mm3, and a pure copper plate of 30 × 30 × 2 mm3 was used as the cathodic substrate. The depositing area was 1 cm2, and the distance was 40 mm. Before plating, the polished samples were activated by dipping in 5% dilute hydrochloric acid for a few seconds and then they were washed with distilled water. Direct current power (Model PS-618, RongDa, Shenzhen, China) was used for the deposition, and the applied current density was 4 A/dm2. The electrochemical deposition was carried out at 40 ± 2 °C, and the pH was 4 ± 0.2. An output power of 100 W with an ultrasonic frequency of 35 kHz was applied by an ultrasonic extractor (Model XH-2008DE, Xianghu, Beijing, China) to the electrolyte solution to cause electrodeposition.

2.2. Methods

A traditional three-electrode system was applied to all electrochemical measurements, through an electrochemical analyzer/workstation (Model AUT85731, Nova1.9, Metrohm, Switzerland). The working electrode, the counter electrode, and the reference electrode were copper plates, platinum plates and standard calomel electrodes, respectively. Linear sweep voltammetry measurements were performed at a potential range from 0 V to −1.8 V, with a scan rate of 20 mV/s. Chronoamperometry curves were investigated from −1.00 V to −1.15 V, with a potential step of 50 mV. X-ray diffraction (XRD) was performed under Cu Kα filtered radiation, and each step was 0.02° (X’ Pert Powder, PANalytical, Almelo, The Netherlands). The morphologies of samples were characterized by atomic force microscopy (CSPM5500, Benyuan, Guangzhou, China).

3. Results and Discussion

3.1. Linear Sweep Voltammetry (LSV)

To study the influence of Y2O3 on the electrochemical reduction, linear sweep voltammetry curves were investigated from sulfamate electrolyte solutions, as shown in Figure 2. At the pure nickel electrolyte, the initial reduction of Ni2+ to pure nickel commenced at −0.95 V, resulting in the corresponding cathodic current density obviously increasing in the experimental curves. For the composites, the electrochemical deposition took place at −0.85 V, and the corresponding cathodic current densities increased somewhat rapidly. The LSV curves further indicated that the addition of nano-Y2O3 particles had a significant effect on the reduction process in the plating-bath by changing the related deposition mechanism, and thus decreasing the cathodic polarization of nickel and increasing the corresponding cathodic current density. The cause of this may have been that the nano-sized Y2O3 particles absorbed a large number of metal ions in the electrolyte, altering the conformation of the electric double-layer at the interface between the electrolyte and the cathode surface and promoting the reduction of nickel ions, which is similar to the reports of Tan et al. [10,11]. However, compared with nickel deposition, Ni-Y2O3 composite electrodeposition seems to be slow, as the cathodic current densities rose slowly at more negative potentials than −1.30 V. The nano-Y2O3 particles in the electrolyte seem to play different roles in the nucleation/growth process of nickel at different over-potentials. This was illustrated by the diverse adsorption strength of nano-Y2O3 particles on the cathodic surface under different over-potentials, which suggests that the electrochemical characteristics depend on the electrical field. In accordance with the two-step adsorption model developed by Guglielmi [21], the co-deposition between nickel ions and Y2O3 particles was carried out in two steps. First, particles in the electrolyte were loosely adsorbed on the cathodic surface. This process had a physical nature at low potentials, and these particles were still surrounded by a cloud of adsorbed ions and may offer extra active sites for the reduction of ions on the electrode surface. Consequently, the associated cathodic current density increased sharply. Secondly, these particles released an adsorbed ion cloud and became strongly adsorbed on the electrode surface due to the occurrence of a higher electric field force under more negative potentials. Then, they became embedded in the fresh deposit layers, producing a spatial hindrance effect and blocking the active sites available for reduction on the cathodic surface; thus, the cathodic current density increased slowly.
Figure 3 shows the open circuit potential (OCP) of the pure copper substrate measured in pure nickel and composite plating baths. The OCP of pure nickel deposit occurred at −0.089 V and the OCP of composite film occurred at −0.064 V. The composite had a more positive OPC value, meaning that the composite co-deposition required less energy. Moreover, this OCP curved further, revealing the electrochemical activity of particles in the composite plating solution. This could be used to illustrate the positive shift in the reduction potential and the decrease in cathodic polarization of the composite.

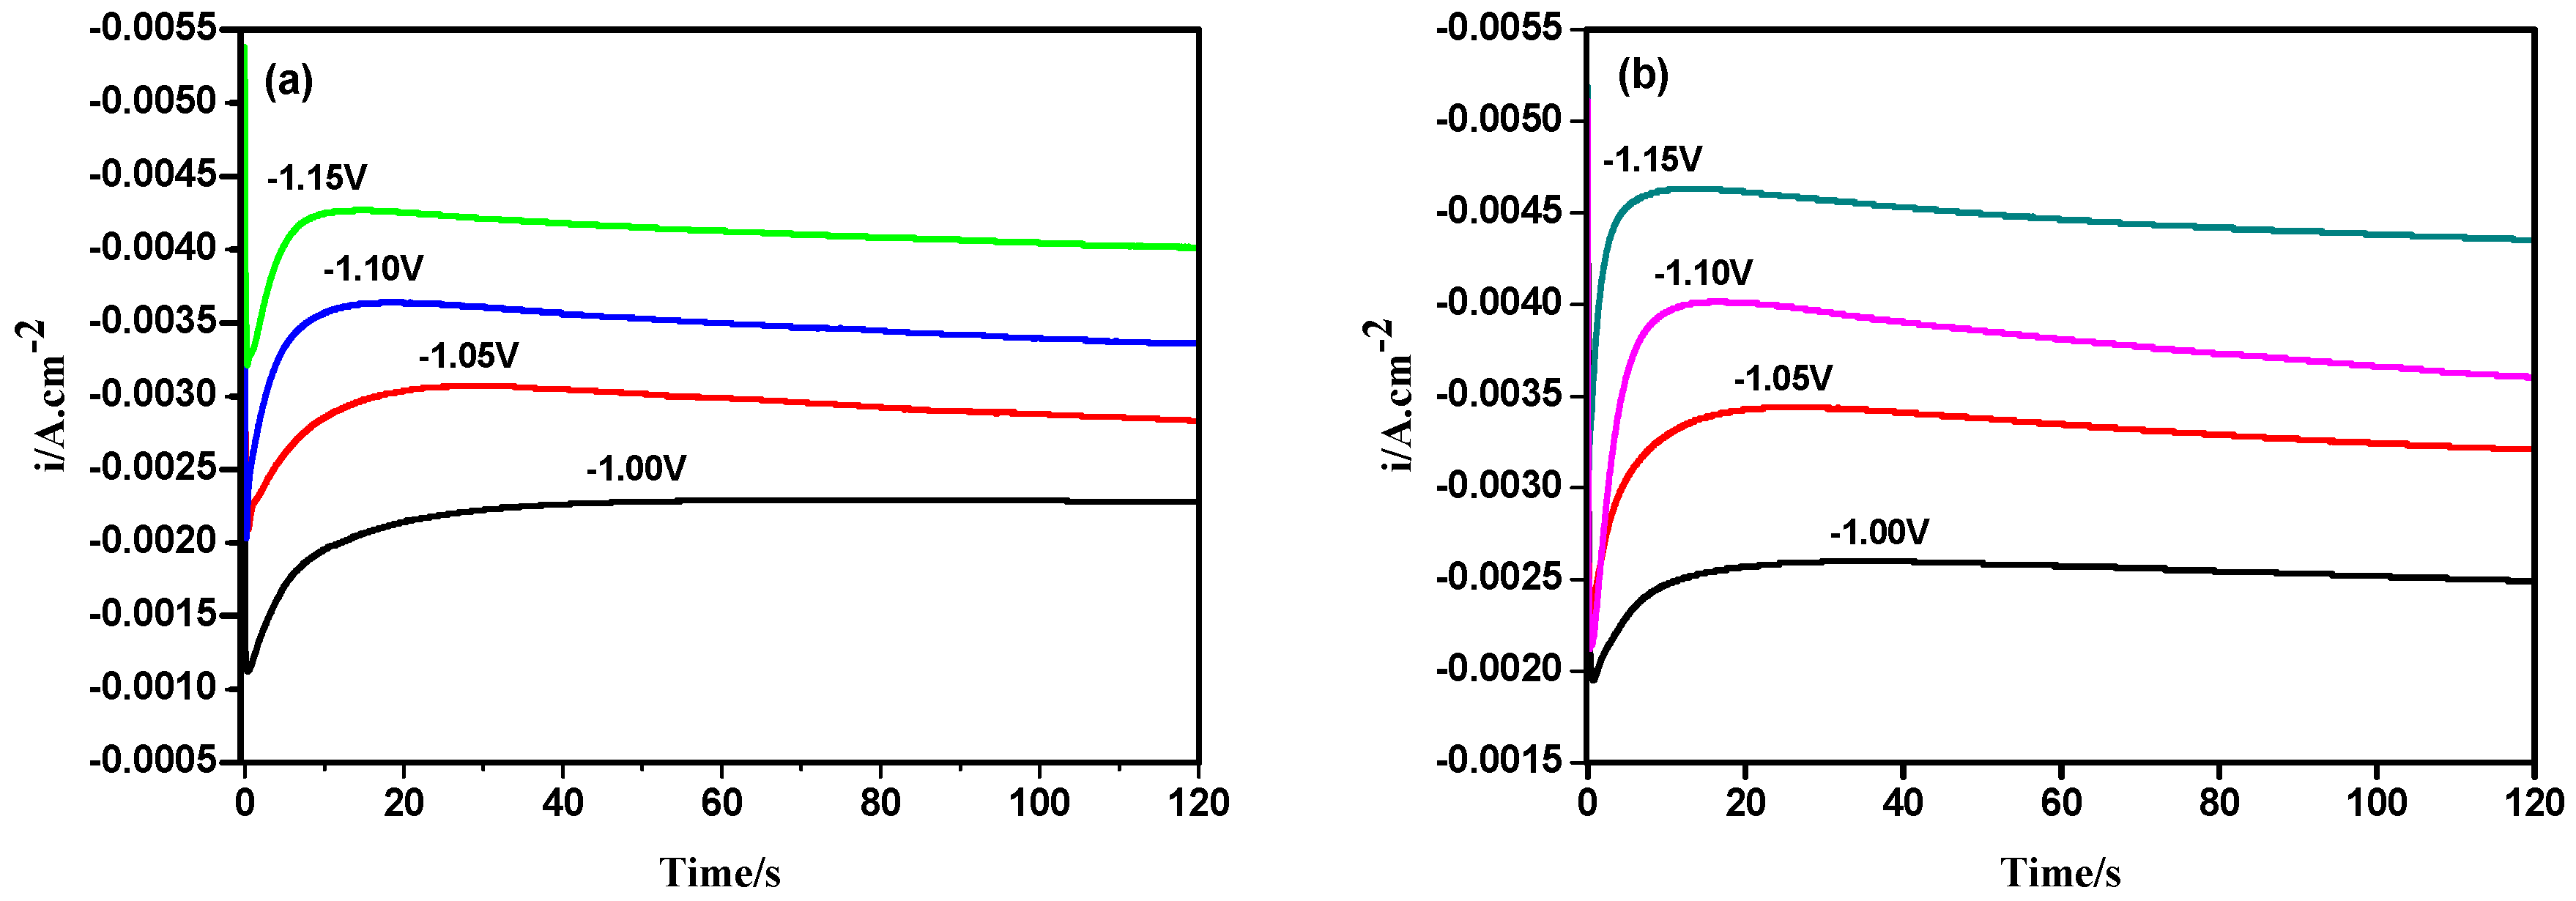
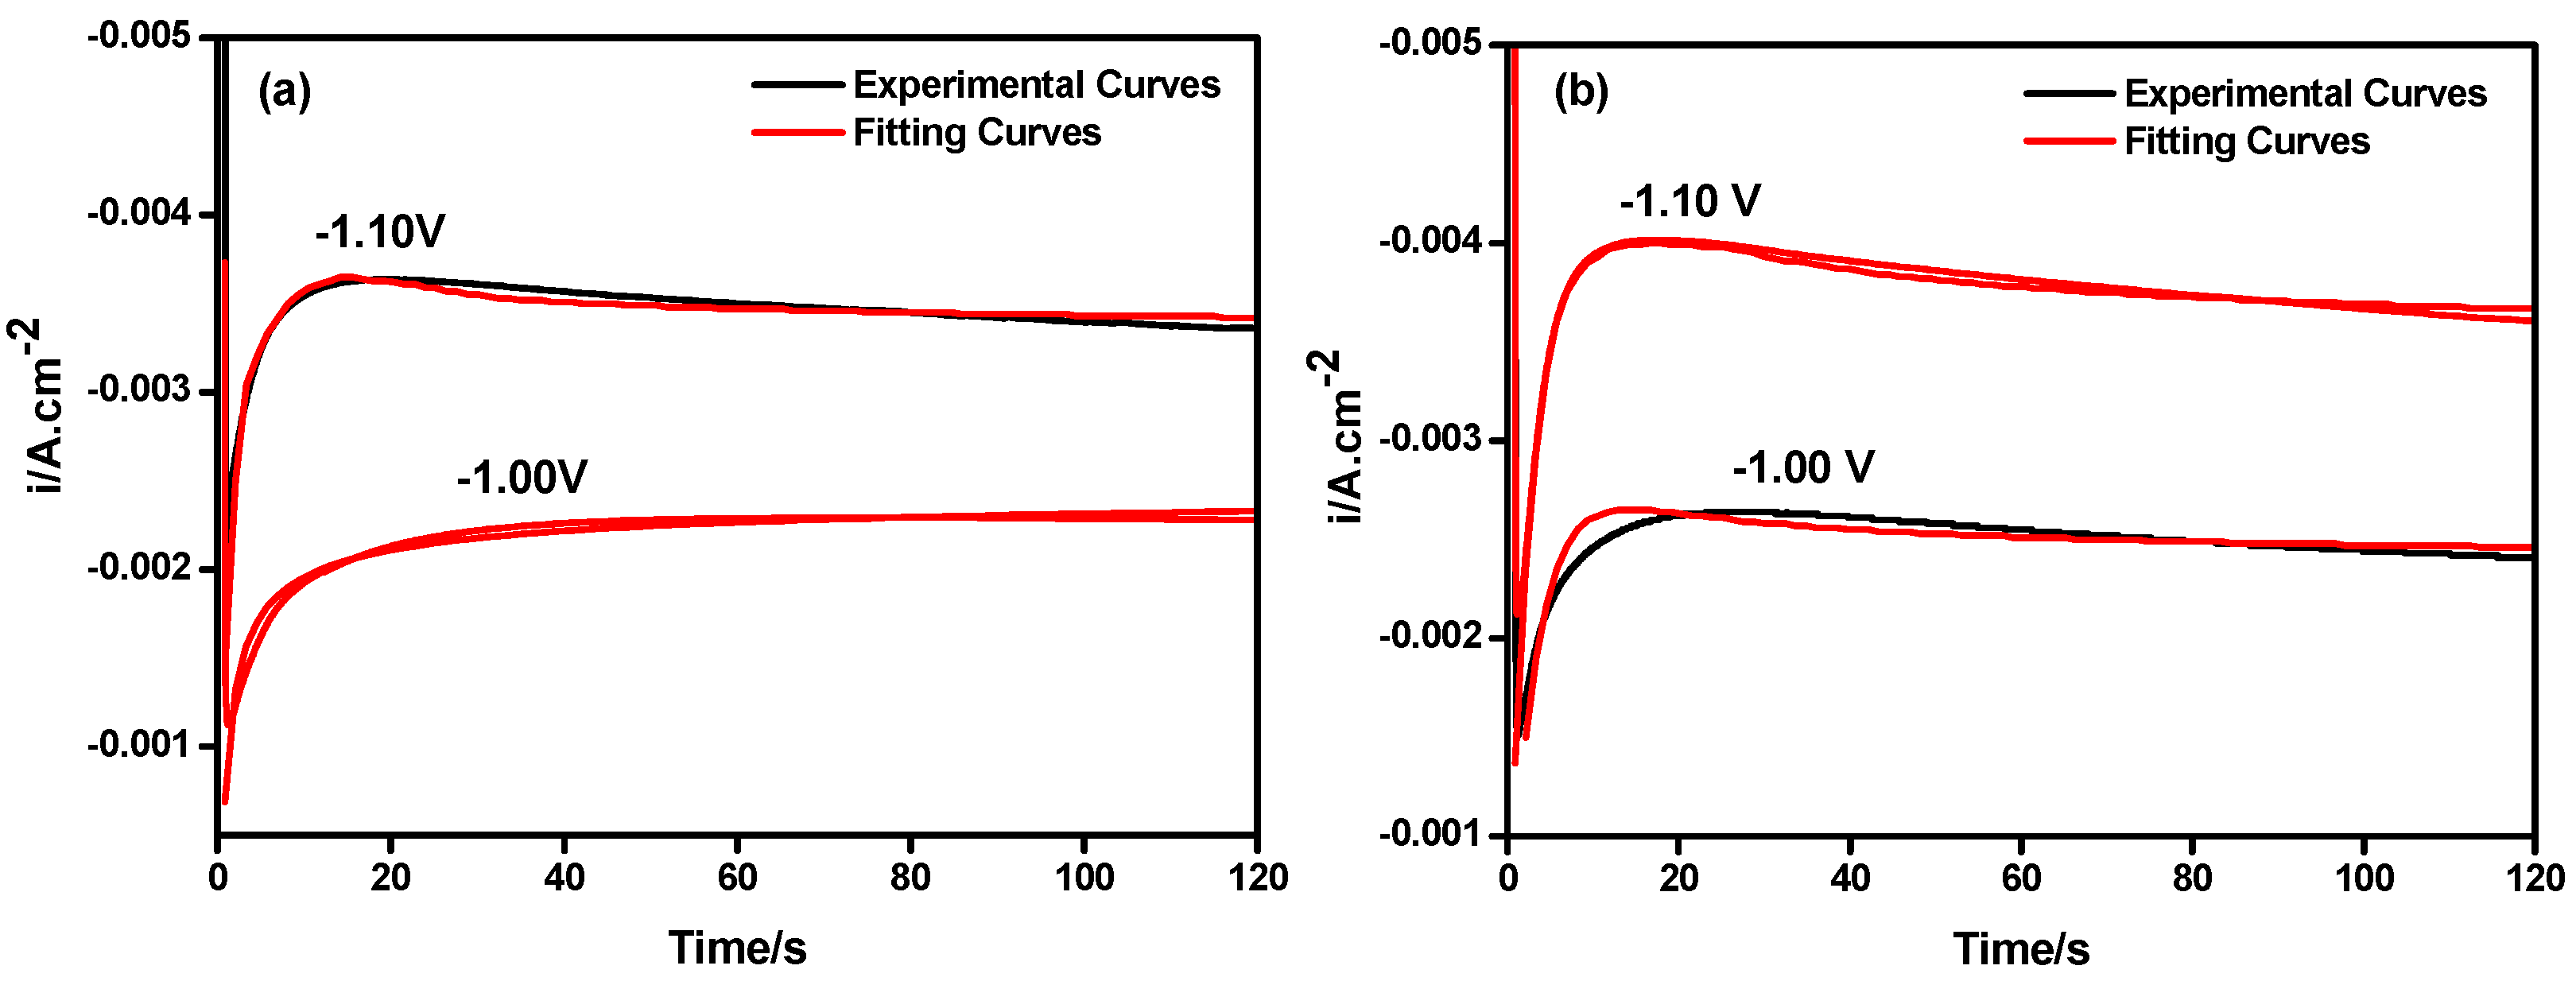
3.2. Chronoamperometry Study

Figure 4a,b shows the chronoamperometry curves for nickel and the composites in the acid sulfamate bath under the desired step potentials, with a measuring time of 120 s. In the chronoamperometry curves of both deposits, after a short electric double layer charging (t < 5 s), a clear cathodic current peak was observed at the individual potential which represented the commencement of the nucleation of metal in the measured potential range. In all I-t curves, the cathodic current density gradually decreased after reaching the peak current density, which is a typical three-dimensional nucleation characteristic that is controlled by diffusion [23,24]. With the increase in the measured potentials for both deposits, the maximum cathodic current densities (Im) gradually rose and the associated nucleation relaxation time (tm) shortened, indicating sharp nucleation/growth for the electro-crystallization of metal at higher over-potentials. This is because the charging time of the electric double-layer decreased as the step potentials became more negative, and lots of active nucleation sites existed on the electrode surface which was beneficial to the nucleation of the metallic matrix. Table 1 shows the maximum cathodic current density and associated nucleation relaxation times of nickel and composite deposits under different potentials according to the I-t curves in Figure 4. It can be seen in Table 1 that, compared to pure nickel, the electro-crystallization recorded in composite co-depositions always took place at a somewhat higher cathodic current density (Im) and had substantially decreased nucleation relaxation times (tm), meaning that the presence of Y2O3 nano-particles in electrolyte solutions is helpful for the nucleation/growth of the matrix on cathodic surfaces, which is in a good agreement with the reports in Ni-SiC [11].
To analyze the nucleation mechanism for the electrodeposited layers, the experimental data were normalized, as shown in Figure 4, to (I/Im)2 vs. (t/tm), and then the nucleation mode was determined through comparison with the Scharifker–Hills model [24] (progressive and instantaneous nucleation model obtained by Equations (1) and (2)). The comparisons of the experimental (I/Im)2 vs. (t/tm) plots and theoretical models for both deposits investigated under different cathodic potentials are shown in Figure 5.
( I / I m ) 2 = 1.9542 ( t / t m ) { 1 exp [ 1.2564 ( t / t m ) ] } 2   ( instantaneous   nucleation )
( I / I m ) 2 = 1.2254 ( t / t m ) { 1 exp [ 2.3367 ( t / t m ) 2 ] } 2   ( progressive   nucleation )
As shown in Figure 5, when t/tm < 1, the non-dimensional curves of both coatings approached theoretical nucleation curves, which shows that their nucleation mechanism is governed by the three-dimensional Scharifker–Hill growth model. The nucleation processes of nickel and composite coatings were shown to be similar and were located in the middle of the progressive and instantaneous nucleation modes under low step potentials (−1.00 V). Moreover, the nucleation model tended to be closer to instantaneous nucleation as the step potential became more negative, meaning that the nucleation rate of both deposits is higher under more negative potentials. However, when t/tm > 1, a deviation between the non-dimensional curves and the theoretical nucleation mode was observed. This may be because a smooth cathode surface is assumed to apply the nucleation field for metal ions in the theoretical nucleation model. However, some dislocations and scratches may have existed on the actual cathode surface (roughness: 0.32 nm, measured by AFM figure of the substrate, software: Imager 4.7 (Benyuan, Guangzhou, China), providing additional active nucleation sites for metal ions, resulting in the decrease of (I/Im)2 vs. (t/tm) being sluggish compared to the theoretical values. As a result, the experimental (I/Im)2 values were higher than the (I/Im)2 values recorded in the theoretical nucleation model. Moreover, the stepwise reduction process of Ni2+ in an acid plating-solution has been widely accepted, which is shown by [10,11]:
H 3 O + + 2 e H 2 + O H  
N i 2 +   + e + O H N i ( O H ) a d s
N i ( O H   ) a d s + e N i + O H
As can be seen from Equations (3)–(5), the electrochemical reduction from Ni2+ to Ni can be described as the acquisition of an electron by Ni2+ to generate Ni(OH)ads by combining with OH-, and then it reduces to nickel deposit. The concentration of Ni2+ on the electrolyte/cathode interface is sustainable during reduction, but concentrated polarization still results from the lower number of Ni2+ on the fresh deposit layer surface. Meanwhile, the hydrogen evolution in an acid plating-bath is coupled with the nucleation/growth progress of Ni based on Equation (3) which might offer extra cathodic current density during the reduction of Ni2+. The differences between the experimental (I/Im)2 vs. (t/tm) and theoretical nucleation plots can be explained by these factors, and moreover, the overall cathodic current density resulting from the discharge of Ni2+ and the hydrogen evolution reaction should be simultaneously considered in the calculation of deposition kinetic parameters. This was proven by Palomar-Pardave et al. [25], and Equation (6) was used to calculate the kinetic parameters in electro-crystallization:
i ( t ) = { Z P R   F K P R ( 2 c 0 M π ρ ) 1 2 + ( 2 F D 1 2 c 0 π 1 2 ) t 1 2 } × { 1 exp [ N 0 π ( 8 π c ρ ) 1 2 D ( t 1 exp ( A t ) A ) ] }
where c0 is the concentration of the metal ions in the electrolyte bath; F is the Faraday constant; ZPRF is the molar charge transferred in the proton reduction process; KPR is the rate constant of proton reduction; and A and N0 are the rate of nucleation and the number density of active sites for nucleation, respectively. Other parameters also represent their ordinary meanings. In Equation (6), t is an independent variable, and i is a dependent variable. To calculate the deposition kinetic parameters by non-linear fitting the chronoamperometry plots, Equation (6) can be simplified to P1* = ZPR FKPR (2c0 Mρ)1/2, P2 = N0π kD, k = (8πc0/ρ)1/2, P3 = A and P4 = 2FD1/2c01/2.
Figure 6 gives a comparison between the experimental chronoamperometry plots of both films and the theoretical plots obtained by the non-linear fitting calculation (through the Marquardt–Levenberg algorithm). These calculated curves fit closely to the experimental plots, which suggests that the calculated kinetics parameters suitable to explain the electrodeposition process. All calculated kinetic parameters retain two decimal places with a margin of error of less than 0.01, as shown in Table 2. The calculated data further showed that the addition of nano-Y2O3 to the bath contributed to the electro-crystallization of the nickel matrix by accelerating the nucleation, as a higher rate of nucleation (A) and a greater number of active nucleation sites (N0) were obtained in the composite electrolyte. Moreover, the observed higher current densities of the composite deposit might have been due to the higher nucleation rate, which is in accordance with the previous analysis of the experimental curves (shown in Figure 5).
To examine the surface morphology of depositions in the initial electro-crystallization stage, atomic force microscopy was used to observe the center area of 100 um2 for both deposits fabricated at the best fit potential (−1.10 V) for 60 s, and the AFM images are presented in Figure 7. Figure 7a,b shows that both fresh deposit layers covered the copper substrate surface, which was characterized by a coarse surface morphology in the observed micro-regions. Further, the nickel films exhibited an uneven surface morphology with some rough growth nodules. On the contrary, the composites showed uniform and dense surface structures with finer grains. Moreover, the grain number recorded in the Ni-Y2O3 composite was higher than that in the nickel film, which corresponded to the higher nucleation rate and greater number of active nucleation sites of the composite in the electrochemical deposition. The AFM images observed on both deposit surfaces support the calculated kinetics parameters in Table 2.

3.3. Electrochemical Impedance Spectroscopy (EIS) Studies

To study further the effect of nanoparticles on electrochemical deposition, the EIS of both deposits was performed at −1.15 V from an acid sulfamate bath and the obtained Nyquist curves were fitted by ZVIEW 3.1 (Solartron Metrology, London, UK), as shown in Figure 8. The simulated plots were closely related to the experimental curves in both cases and could be used to provide some helpful references for the electrodeposition parameters of both deposits. Figure 8a shows that the Nyquist plots of pure nickel films and composite deposits can be divided into two different electrochemical response regions consisting of a complete capacitive arc and an inductive arc. The capacitive arc is first observed at high frequencies (105–102 Hz), which is associated with the electric double-layer capacitor in parallel with the charge transfer resistance [20]. In particular, the charge transfer resistance can be estimated by the capacitive loop diameter. Compared to the nickel film, the capacitance arc diameter was observed in the Nyquist curves of composites, indicating that a lower charge transfer resistance appears in composite electrodeposition. The observed lower capacitance arc diameter of the composite deposits could be associated with the modified cathodic surface caused by the adsorption of Y2O3 particles. The modified surface has more active nucleation sites and thus, promotes the mass transfer rate of Ni2+ to the cathode, leading to a lower charge transfer resistance, which is similar to references [10,11,20]. In addition, at low frequencies (102–10−1 Hz), an inductive loop appears in the fourth quadrant of the Nyquist plots for both deposits which can be attributed to the adsorbed intermediate product (Ni(OH)ads) or the formation of deposits on the cathode surface [26]. The diverse inductive arcs observed in both deposit layers mean that the time constants corresponding to the formation of intermediate products in electrodeposition were different, and the nanoparticles in the electrolyte influenced the electrodeposition of the metal matrix.
The equivalent circuit of the experimental Nyquist plots of pure nickel and composite films measured at −1.20 V is shown in Figure 8b [22], where Rs is the solution resistance, CPE is a constant phase element used to represent the electric double-layer capacitor, Rt is the charge transfer resistance, L1 is the inductance, and R1 is the Faraday resistance. Table 3 gives the electrochemical deposition parameters calculated by ZVIEW 3.1. The charge transfer resistance of was found to be Rt = 85.39 Ω·cm2 for the nickel film and that 57.74 Ω·cm2 for the composite. In addition, the diverse values of R1 and L1 obtained by the fitting calculation of both experimental plots can be easily observed in Table 3. The calculated electrodeposition parameters corroborate the theoretical analysis of the experimental Nyquist plots.

3.4. Microstructure of Coatings

The influence of the incorporation of nano-Y2O3 particles on the developed microstructure of nickel was measured by X-ray diffraction (XRD). Figure 9 shows the XRD patterns of nickel and composite deposits. Three clear diffraction peaks obtained at 2θ values of around 44.3°, 52.2°, and 76.4° were observed in both deposits in the (111), (200) and (220) planes, respectively. The most intensive peak, which was located at 52.2°, is related to the (200) reflection of nickel. It is noteworthy that the relative diffraction peak of nano-Y2O3 particles can be observed in the lines of the composite at 28.6°(Ref. JCPDS card No. #96-720-5918), and the plots of the composite deposit gradually broadened and the associated intensity slightly decreased, which was related to the finer microstructure of the nickel matrix in the composite [27,28]. The computational results of the grain sizes calculated by the Scherrer equation (D = 0.9λ/β cosθ, where λ is the wavelength of the radiation (0.154 nm), β is the full width at half maximum (FWHM) of the peak, and θ is the position of the peak) [29] showed that the average grain size of the Ni deposit was 58.9 nm, and the average grain size of the Ni-Y2O3 composites was 38.6 nm. Accordingly, the combination of Y2O3 particles with a nickel matrix could lead to the refinement of grains.

4. Conclusions

Ni/nano-Y2O3 composite films electrochemically deposited from a sulfamate bath were characterized by LSV, CA, and EIS. The LSV test showed that the composite deposition took place at −0.95 V, and the presence of nano-Y2O3 decreases cathodic polarization. The nucleation/growth mechanism and co-deposition kinetic parameters were determined by chronoamperometry studies, and the results showed that the nucleation model of both deposits similarly approaches the theoretical instantaneous nucleation mode based on the Scharifker–Hills model. Greater maximum current densities and associated lower nucleation relaxation times were observed in the composites due to their higher nucleation rates in electrodeposition, and the Y2O3 particles adsorbed on cathodic surface were shown to facilitate the nucleation/growth of nickel matrix, which is consistent with the deposition kinetic parameters calculated by the non-linear fitting experimental curves. The EIS results showed that lower charge transfer resistance commenced in the presence of Y2O3 particles in the electrolyte bath. The atomic force microscopy observations of both deposits obtained in the initial electrodeposition stage confirmed that the Ni-Y2O3 composite has a higher grain number and lower mean grain size compared to pure Ni coating. The XRD patterns showed that the Y2O3 particles embedded in the metal matrix are beneficial to the refinement of grains.

Author Contributions

H.J. and Y.W. conceived and designed the experiments; X.Z. and Z.L. performed the experiments; and X.Z. wrote the paper.

Funding

This research was funded by the National Natural Science Foundation of China (51674141).

Acknowledgments

This work also was supported by the Natural Science Fund of Liaoning province (201602401).

Conflicts of Interest

The authors declare no conflict of interest.

References

  1. Musiani, M. Electrodeposition of composites: An expanding subject in electrochemical materials science. Electrochim. Acta 2000, 45, 3397–3402. [Google Scholar] [CrossRef]
  2. Walsh, F.C.; Leon, C.P.D. A review of the electrodeposition of metal matrix composite coatings by inclusion of particles in a metal layer: An established and diversifying technology. Trans. IMF 2014, 92, 83–98. [Google Scholar] [CrossRef]
  3. Tudela, I.; Zhang, Y.; Pal, M.; Kerr, I.; Cobley, A.J. Ultrasound-assisted electrodeposition of composite coatings with particles. Surf. Coat. Technol. 2014, 259, 363–373. [Google Scholar] [CrossRef]
  4. Zhang, G.J.; Deng, Z.Y.; Kondo, N.; Yang, J.F.; Ohji, T. Reactive Hot Pressing of ZrB2-SiC Composites. J. Am. Ceram. Soc. 2010, 83, 2330–2332. [Google Scholar] [CrossRef]
  5. Chou, S.N.; Huang, J.L.; Lii, D.F.; Lu, H.H. The mechanical properties of Al2O3/aluminum alloy composite manufactured by squeeze casting. J. Alloy. Compd. 2006, 419, 98–102. [Google Scholar] [CrossRef]
  6. Liu, H.; Huang, J. Reactive thermal spraying of TiC-Fe composite coating by using asphalt as carbonaceous precursor. J. Mater. Sci. 2005, 40, 4149–4151. [Google Scholar] [CrossRef]
  7. Bakshi, S.R.; Wang, D.; Price, T.; Zhang, D.; Keshri, A.K.; Chen, Y.; McCartney, D.G.; Shipway, P.H.; Agarwal, A. Microstructure and wear properties of aluminum/aluminum-silicon composite coatings prepared by cold spraying. Surf. Coat. Technol. 2009, 204, 503–510. [Google Scholar] [CrossRef]
  8. Jiang, Q.C.; Wang, H.Y.; Ma, B.X.; Wang, Y.; Zhao, F. Fabrication of B4C particulate reinforced magnesium matrix composite by powder metallurgy. J. Alloy. Compd. 2005, 58, 3509–3513. [Google Scholar] [CrossRef]
  9. Zimmer, A.; Broch, L.; Boulanger, C.; Stein, N. Growth Mechanism during the Early Stages of electrodeposition of Bismuth telluride films. Electrochim. Acta 2015, 174, 376–383. [Google Scholar] [CrossRef]
  10. Tan, C.; Cui, H.; Hu, W.; Liu, Y. Influence of Nano-Al2O3 Particles on Nickel Electrocrystallization at Initial Stage. Rare Met. Mater. Eng. 2010, 39, 10–16. [Google Scholar]
  11. Tan, C.Y.; Liu, Y.; Zhao, X.S.; Zheng, Z.Q. Nickel co-deposition with SiC particles at initial stage. Trans. Nonferr. Metal. Soc. China 2008, 18, 1128–1133. [Google Scholar] [CrossRef]
  12. Kasturibai, S.; Kalaignan, G.P. Characterizations of electrodeposited Ni-CeO2 nanocomposite coatings. Mater. Chem. Phys. 2014, 147, 1042–1048. [Google Scholar] [CrossRef]
  13. Kim, M.J.; Kim, J.S.; Kim, D.J.; Kim, H.P.; Hwang, S.S. Effects of current density and agitation on co-deposition behaviour of electrodeposited Ni-TiO2 composite coating. Surf. Eng. 2015, 31, 673–678. [Google Scholar] [CrossRef]
  14. Ao, Z.H.; Xue, Y.J.; Li, X.H.; Li, J.S. Preparation of Ni-Nd2O3 Nanocomposite Coatings by Electrodeposition under Dual-Frequency Ultrasound. Adv. Mater. Res. 2012, 591–593, 1001–1005. [Google Scholar] [CrossRef]
  15. Xia, F.F.; Wu, M.H.; Wang, F.; Jia, Z.Y.; Wang, A.L.; Elkhoshkhany, N.; Hafnway, A.; Khaled, A. Electrodeposition and corrosion behavior of nano-structured Ni-WC and Ni-Co-WC composite coating. J. Alloy. Compd. 2016, 695, 1505–1514. [Google Scholar]
  16. Elkhoshkhany, N.; Hafnway, A.; Khaled, A. Electrodeposition and corrosion behavior of nano-structured Ni-WC and Ni-Co-WC composite coating. J. Alloy. Compd. 2016, 695. [Google Scholar] [CrossRef]
  17. Tudela, I.; Zhang, Y.; Pal, M.; Kerr, I.; Cobley, A.J. Ultrasound-assisted electrodeposition of thin nickel-based composite coatings with lubricant particles. Surf. Coat. Technol. 2015, 276, 89–105. [Google Scholar] [CrossRef]
  18. Cai, F.; Jiang, C.; Zhang, Z.; Ji, V. Synthesis and characterization of Ni-Al-Y2O3 composite coatings with different Y2O3 particle content. Ceram. Int. 2014, 40, 15105–15111. [Google Scholar] [CrossRef]
  19. Tian, L.; Xu, J. Electrodeposition and characterization of Ni-Y2O3 composite. Appl. Surf. Sci. 2011, 257, 7615–7620. [Google Scholar] [CrossRef]
  20. Ghaziof, S.; Kilmartin, P.A.; Gao, W. Electrochemical studies of sol-enhanced Zn-Ni-Al2O3 composite and Zn-Ni alloy coatings. J. Electroanal. Chem. 2015, 755, 63–70. [Google Scholar] [CrossRef]
  21. Guglielmi, N. Codeposition of inert particles in a metallic matrix. J. Electrochem. Soc. 1972, 119, 1009. [Google Scholar] [CrossRef]
  22. Zhou, X.Y.; Wang, Y.Y.; Liang, Z.P.; Jin, H. Electrochemical Deposition and Nucleation/Growth Mechanism of Ni-Co-Y2O3 Multiple Coatings. Materials 2018, 11, 1124. [Google Scholar] [CrossRef] [PubMed]
  23. Scharifker, B.; Hills, G. Theoretical and experimental studies of multiple nucleation. Electrochim. Acta 1983, 28, 879–889. [Google Scholar] [CrossRef]
  24. Díaz-Morales, O.; Mostany, J.; Borrás, C.; Scharifker, B.R. Current transient study of the kinetics of nucleation and diffusion-controlled growth of bimetallic phases. J. Solid State Electrochem. 2013, 17, 345–351. [Google Scholar] [CrossRef]
  25. Palomar-Pardavé, M.; Scharifker, B.R.; Arce, E.M.; Romero-Romo, M. Nucleation and diffusion-controlled growth of electroactive centers: Reduction of protons during cobalt electrodeposition. Electrochim. Acta 2005, 50, 4736–4745. [Google Scholar] [CrossRef]
  26. Nowak, P.; Socha, R.P.; Kaisheva, M.; Fransaer, J.; Celis, J.P.; Stoinov, Z. Electrochemical investigation of the codeposition of SiC and SiO2 particles with nickel. J. Appl. Electrochem. 2004, 21, 429–437. [Google Scholar]
  27. Bapu, G.N.K.R.; Jayakrishnan, S. Oxidation characteristics of electrodeposited nickel-zirconia composites at high temperature. Mater. Chem. Phys. 2006, 96, 321–325. [Google Scholar] [CrossRef]
  28. Beltowska-Lehman, E.; Indyka, P.; Bigos, A.; Szczerba, M.J.; Kot, M. Ni-W/ZrO2 nanocomposites obtained by ultrasonic DC electrodeposition. Mater. Des. 2015, 80, 1–11. [Google Scholar] [CrossRef] [Green Version]
  29. Monshi, A.; Foroughi, M.R.; Monshi, M.R. Modified scherrer equation to estimate more accurately nano-crystallite size using XRD. World J. Nano Sci. Eng. 2012, 2, 154–160. [Google Scholar] [CrossRef]
Figure 1. Transmission electron microscope picture of Y2O3 particles used in the electrodeposition.
Metals 08 00669 g001
Figure 2. Linear sweep voltammetry (LSV) curves of nickel and composite deposits measured from sulfamate solutions with a scan rate of 20 mV/s, a temperature (T) of 40 °C, and a pH of 4.
Metals 08 00669 g002
Figure 3. Open circuit potential (OPC) plots of nickel and composite deposits measured from sulfamate solutions.
Metals 08 00669 g003
Figure 4. Chronoamperometry plots of both deposits measured under different potentials: (a) Ni; and (b) Ni-Y2O3, T = 40 °C, and pH = 4.
Metals 08 00669 g004
Figure 5. Non-dimensional curves for nickel and composite deposits: (a) Ni; and (b) Ni-Y2O3.
Metals 08 00669 g005
Figure 6. Experimental chronoamperometry curves and non-linear fitted theoretical plots: (a) Ni; and (b) Ni-Y2O3, T = 40 °C, and pH = 4.
Metals 08 00669 g006
Figure 7. AFM images and mean grain sizes of both deposits obtained at −1.15 V for 60 s: (a) Ni; and (b) Ni-Y2O3.
Metals 08 00669 g007
Figure 8. (a) Nyquist plots and calculated curves of both deposits measured at −1.10 V, 40 °C, and pH 4; and (b) schematic diagram of the equivalent circuit.
Metals 08 00669 g008
Figure 9. XRD patterns of nickel and composite.
Metals 08 00669 g009
Table 1. The values of the maximum cathodic current densities (Im) and nucleation relaxation times (tm) of both films according to Figure 4.
Potential/VNiRelaxation TimeNi-Y2O3Relaxation Time
Im (A·cm−2)tm (s)Im (A·cm−2)tm (s)
−1.00 V−0.0022979.2−0.0026035.5
−1.05 V−0.0030729.7−0.0034426.3
−1.10 V−0.0036418.5−0.0040216.5
−1.15 V−0.0042714.9−0.0046313.6
Table 2. The kinetic parameters calculated by Equation (6).
DepositsPotentialP1* (uA·cm−2)P2 (s−1)P3 (s−1)P4 (uA·cm−2)A (s−1)N0 × 106 (cm−2)
Ni−1.00 V−2.340.162.19−1.662.191.21
Ni−1.10 V−3.300.433.13−1.293.133.12
Ni-Y2O3−1.00 V−2.480.272.56−1.472.561.89
Ni-Y2O3−1.10 V−3.390.493.43−1.363.433.36
Table 3. Electrodeposition parameters of both deposits measured at −1.10 V.
DepositsPotential (V)Rs/Ω·cm2CPE1-P/F·cm2Rt/Ω·cm2R1/Ω·cm2L1/H·cm2
Ni−1.1048.364.73 × 10−585.39389.86.56
Ni-Y2O3−1.1043.264.98 × 10−557.74226.85.12

