Article

Deformation Behavior of a β-Solidifying TiAl Alloy within β Phase Field and Its Effect on the β→α Transformation

1
School of Materials and Engineering, Jiangsu University of Technology, Changzhou 213001, China
2
Sunnywell (China) New Material Technology Co., Ltd., Changzhou 213000, China
3
College of Mechanical and Electrical Engineering, Shaanxi University of Science and Technology, Xi’an 710021, Shaanxi, China
4
Max-Planck-Institut für Eisenforschung, Max-Planck-Straße 1, Düsseldorf 40237, Germany
*
Authors to whom correspondence should be addressed.
Metals 2018, 8(8), 605; https://doi.org/10.3390/met8080605
Submission received: 2 July 2018 / Revised: 30 July 2018 / Accepted: 1 August 2018 / Published: 3 August 2018

Abstract

:
In this study, the deformation behavior of a Ti-40Al-10V (at.%) alloy within β single phase field was examined by means of isothermal compression at 1300 °C under strain rates of 2 s−1, 0.2 s−1, and 0.02 s−1, as well as its effect on the subsequent β→α transformation. The results showed that the alloy behaved steady-state flow with dislocation creep as the predominant rate-controlling process. Dynamic recrystallization (DRX) evidently occurred during deformation, and its volume fraction was dramatically increased so that at the lowest strain rate (0.02 s−1), a full-DRX β structure was obtained. The preferentially dynamic migration of grain boundaries with <100> orientation was demonstrated to be the major DRX mechanism. The texture was characterized by a <100> + <111> double-fiber at 2 s−1, but gradually transformed into a simple rotated cube orientationunder 0.02 s−1, accompanied by a decreasing texture intensity. During the subsequent β→α transformation, two types of α morphology wereproduced with evident variant selection, namely, the Widmannstatten colony and martensitic laths. Texture simulation revealed that the α texture was solely determined by parent β texture, despite of the variant selections.

1. Introduction

β→α transformation is a critical phase transition in titanium alloys, which plays an important role in determining the microstructure and mechanical properties. The β→α transformation is governed by the well-known Burger orientation relationship (BOR), i.e., {110}β//{00.1}α and <111>β//<11.0>α, which can theoretically result in twelve α variants, which are crystallographically equivalent. It has been demonstrated that the parent β state has significant effect on the on the product α phase, in terms of textures, variant selections, etc. [1,2,3,4]. For the β-solidifying TiAl alloys, there is also a β→α transformation subsequent to the solidification, but only a few efforts have been paid on this topic to date. This is mainly because the β→α transformation generally occurs at ultra-high temperature, and major attentions have been attracted by the subsequent eutectoid reaction. With the development of β-solidifying TiAl alloys, more β-stabilizer is added, whereas the Al content is decreasing. The β phase field is evidently enlarged and expands toward lower temperatures (see, for instance, the newly developed TNM alloy [5]), and the significance of the β→α transformation is gradually noted. The cooling rate has been demonstrated as a key factor influencing the transition. As that in ordinary dual-phase titanium alloys, in β-solidifying TiAl alloys there is a propensity of β decomposition via Widmannstatten [6] →massive [7,8] →martensitic [8,9] mode with the increasing cooling rates. Boron has been demonstrated as the other important factor affecting the β→α transformation in terms of accelerating the precipitation of non-Burgers α (the so-called Burgers α is that derived from a strict BOR) during cooling from β phase field [10,11]. For instance, it has been found that in a Ti-45Al-8.5Nb-(W,B,Y) alloy, the volume fraction of Burgers αis dramatically decreased from 79.6% to 29.3% as the cooling rates reducing from 22.6 °C/s to 0.1 °C/s, because a lower cooling rateis beneficial for the preferential nucleation of α phase at borides [6].
According to the existing researches concerning the β→α transformation in TiAl alloys, one can note that they were mainly focused on the transformation mechanisms, and the effect of β phase state, such as the microstructure inheritance, requires further investigations. For this purpose, in this study, we intend to analyze the effect of β pre-deformation on the product α phase, which is believed to be of significance in microstructural control and modification. Meanwhile, there are extensive studies concerning the deformation behavior of TiAl alloys, but they are mainly performed in the (α + γ) and (α2 + γ) phase fields corresponding to the general wrought temperatures [12,13], while the deformation behavior within the β phase field remains unclear. Especially, the change of the deformation parameters unquestionably results in the variation of the β microstructure and therefore the transformed α phase. Hence, in this study, a typical β-solidifying TiAl alloy, Ti-40Al-10V (at.%), is adopted to investigate the deformation behavior within β phase field, as well as its effect on the β→α transformation.

2. Materials and Methods

A TiAl ingot with a nominal composition of Ti-40Al-10V was prepared and hot isostatic pressed at 1250 °C/140 MPa for 4 h. Then, cylindrical samples with a dimension of Φ8 × 12 mm were machined from the ingot for hot compression. By using a Gleeble-1500 (Dynamic Systems Inc., New York, NY, USA) thermo-mechanical simulator, the samples were heated to 1300 °C and held for 3 min for obtaining the full β phase according to the TiAl-V phase diagram [8]. After that, the samples were compressed under constant strain rates of 2 s−1, 0.2 s−1, and 0.02 s−1. After a height reduction of 60%, the deformed samples were air-cooled to room temperature allowing for the occurrence of β→α transformation. During compression, the strain rate was constant, and the true strain and stress have been simultaneously recorded by the simulator. For comparison, a sample was directly quenched to room temperature without compression. In order to examine the microstructure regarding the transformed α and retained β phase (actually they are in α2 and β/B2 ordered form, respectively. Hereinafter we only use α and β to denote all of the related phases). After that, all of the samples were sectioned along the compression axis. Electron back-scattered diffraction (EBSD) (Oxford Instruments, Oxford, UK) was conducted at the center region for each sectioned sample after polishing, with step sizes of ~0.3 μm. The EBSD data was analyzed by using the HKL Channel 5 software (Oxford Instruments, Oxford, UK), as well as the JTEX software (Université de Lorraine, Metz, France) [14].

3. Results and Discussion

3.1. Flow Behavior

From the inserted optical image in Figure 1b, one can note that at the compression temperature, the microstructure of the alloy mainly consists of ultra-large β grains with a size of 2–3 mm. The flow curves that are shown in Figure 1a delineate that the alloy exhibits steady-state flow by ignoring the hardening caused by friction at large deformation, which is far from identical with those performed in low temperature phase fields. Numerous studies have demonstrated that, in the latter case, the flow curve is characterized by a sharp peak at the initial stage, followed by dramatic softening, indicating the evident occurrence of discontinuous dynamic recrystallization (DRX), as discussed in Ref. [13] and references therein. In contrast, in the present case, there is no apparent softening as that in β-titanium alloys [15]. Intuitively, it is dynamic recovery (DRV) rather than DRX dominant the deformation of the present alloy within β phase field.
The stress exponent, n, is evaluated based on the flow stress. As shown in Figure 1b, the value is estimated to be 4.5 in the testing range, which is a typical result of power-law creep [13]. Therefore, it can be deduced that, during compression, dislocation creep of the β phase is the major rate-controlling process.

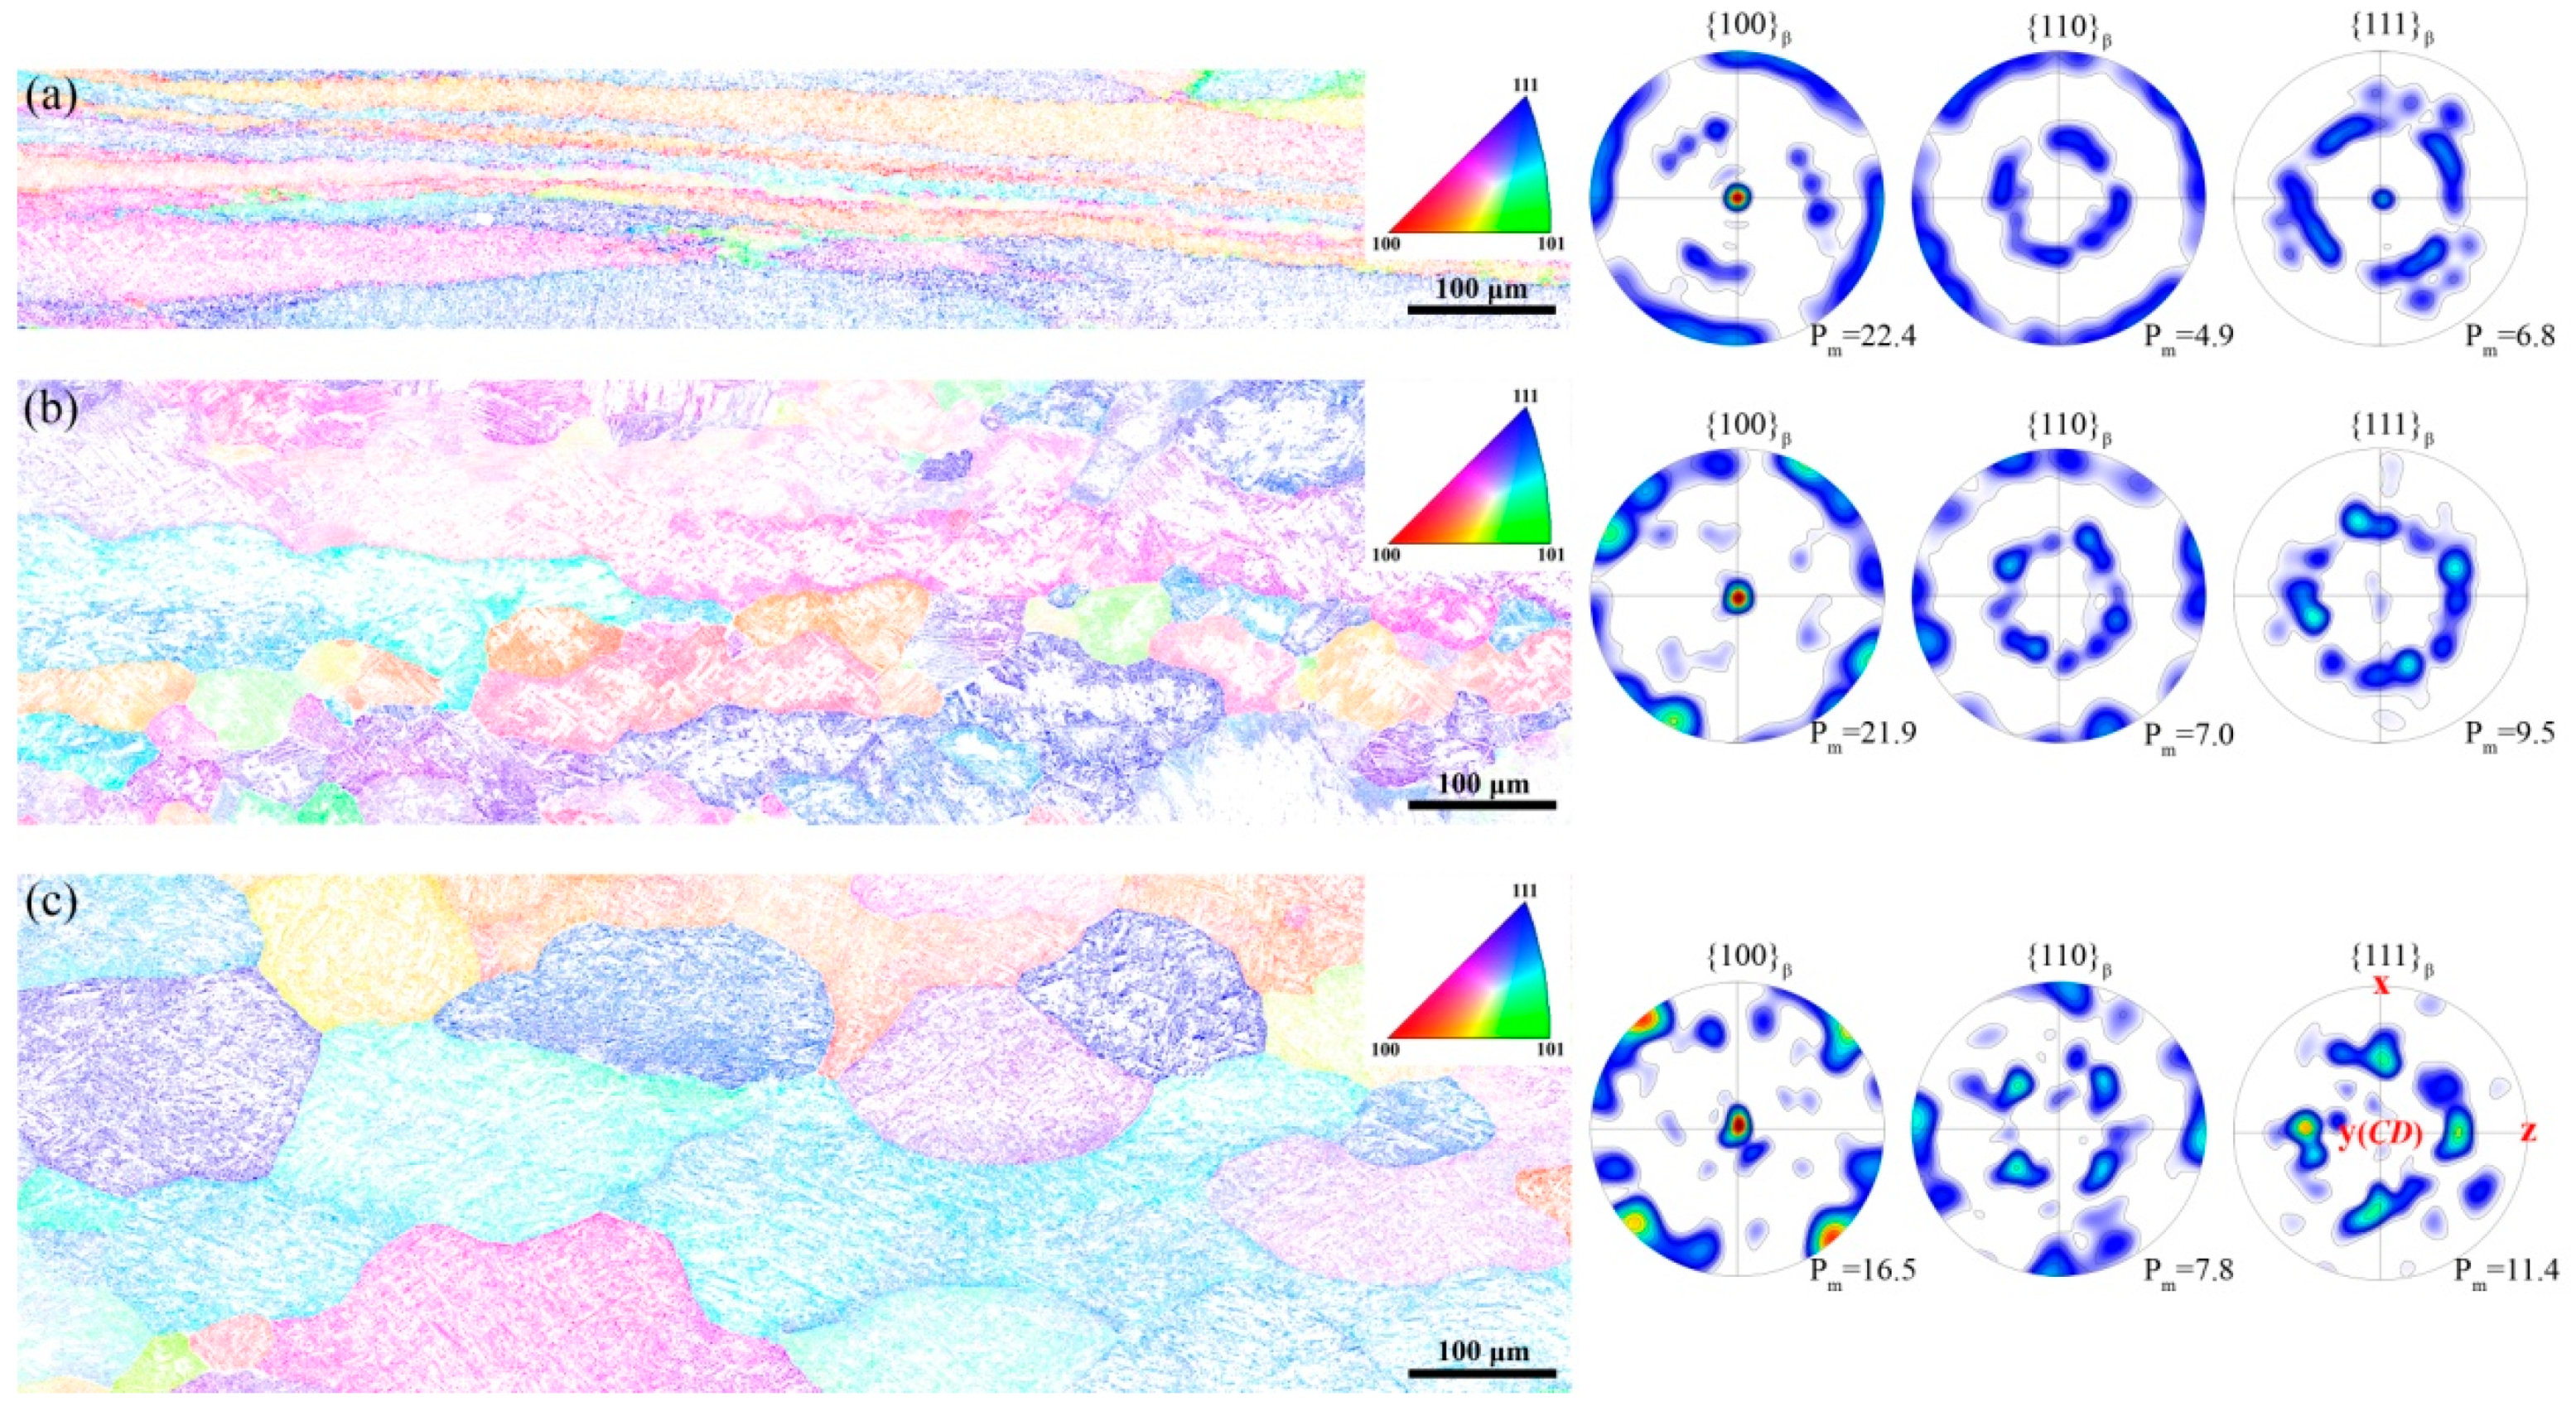
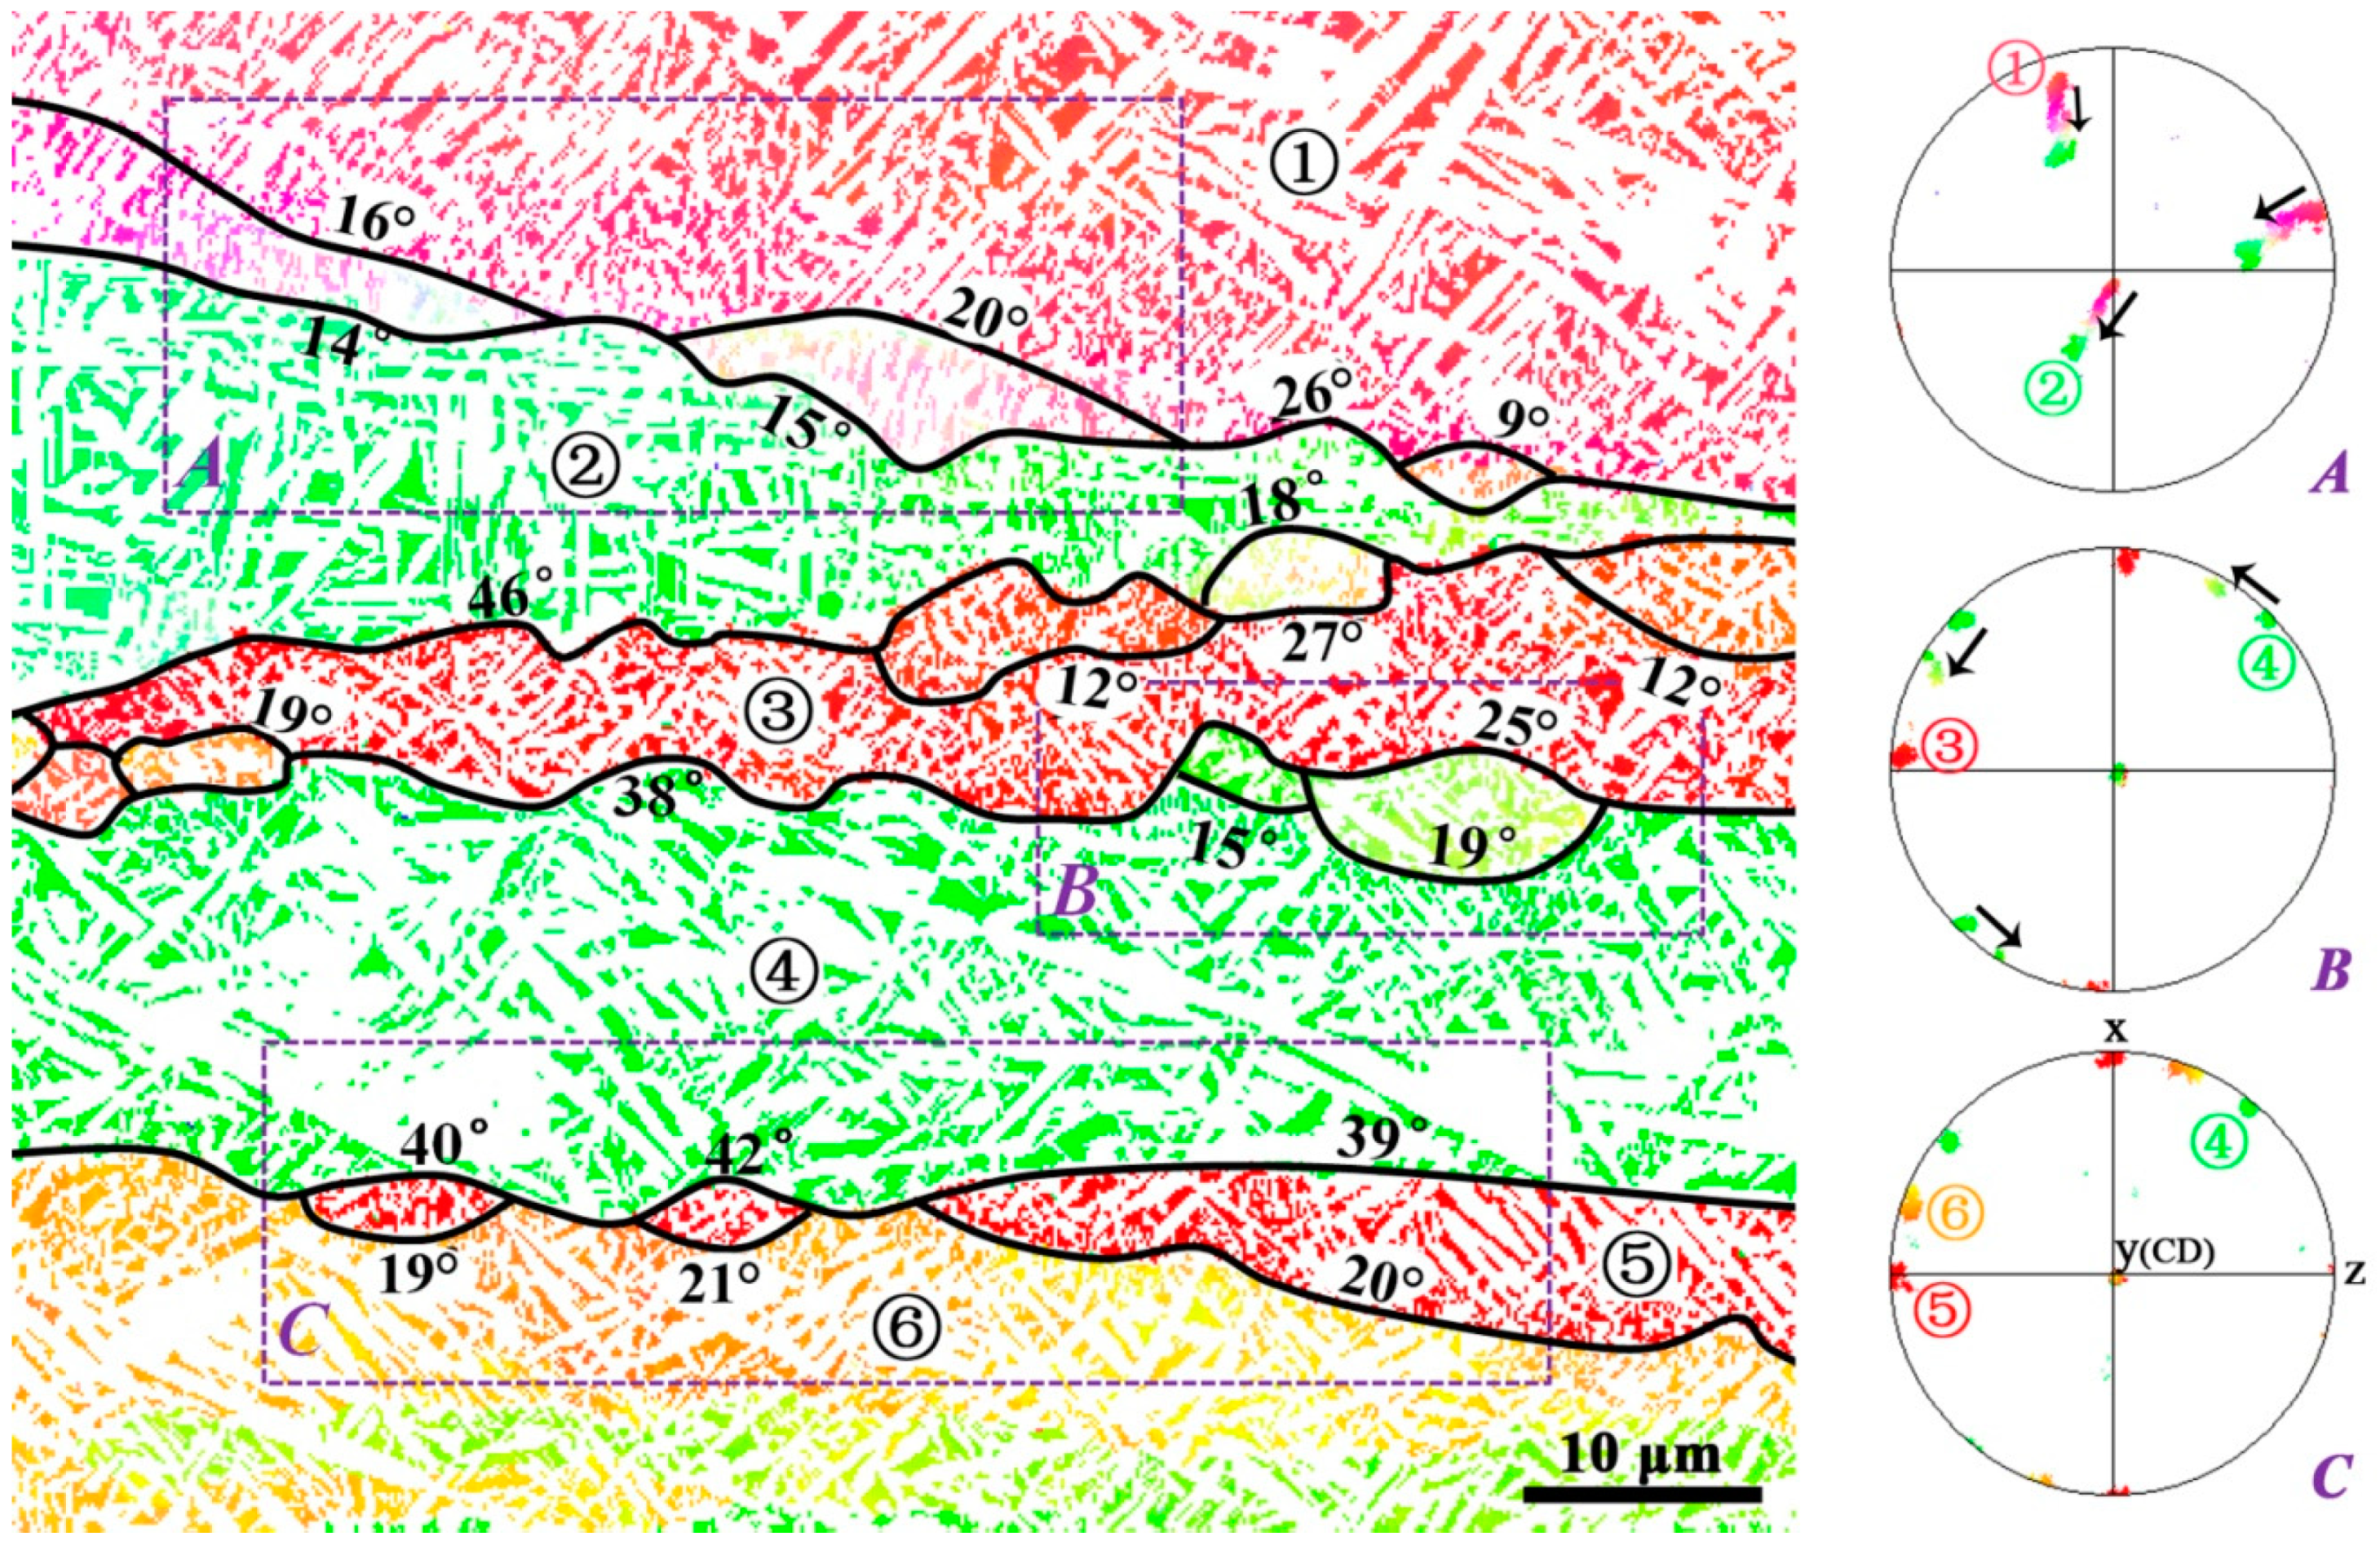
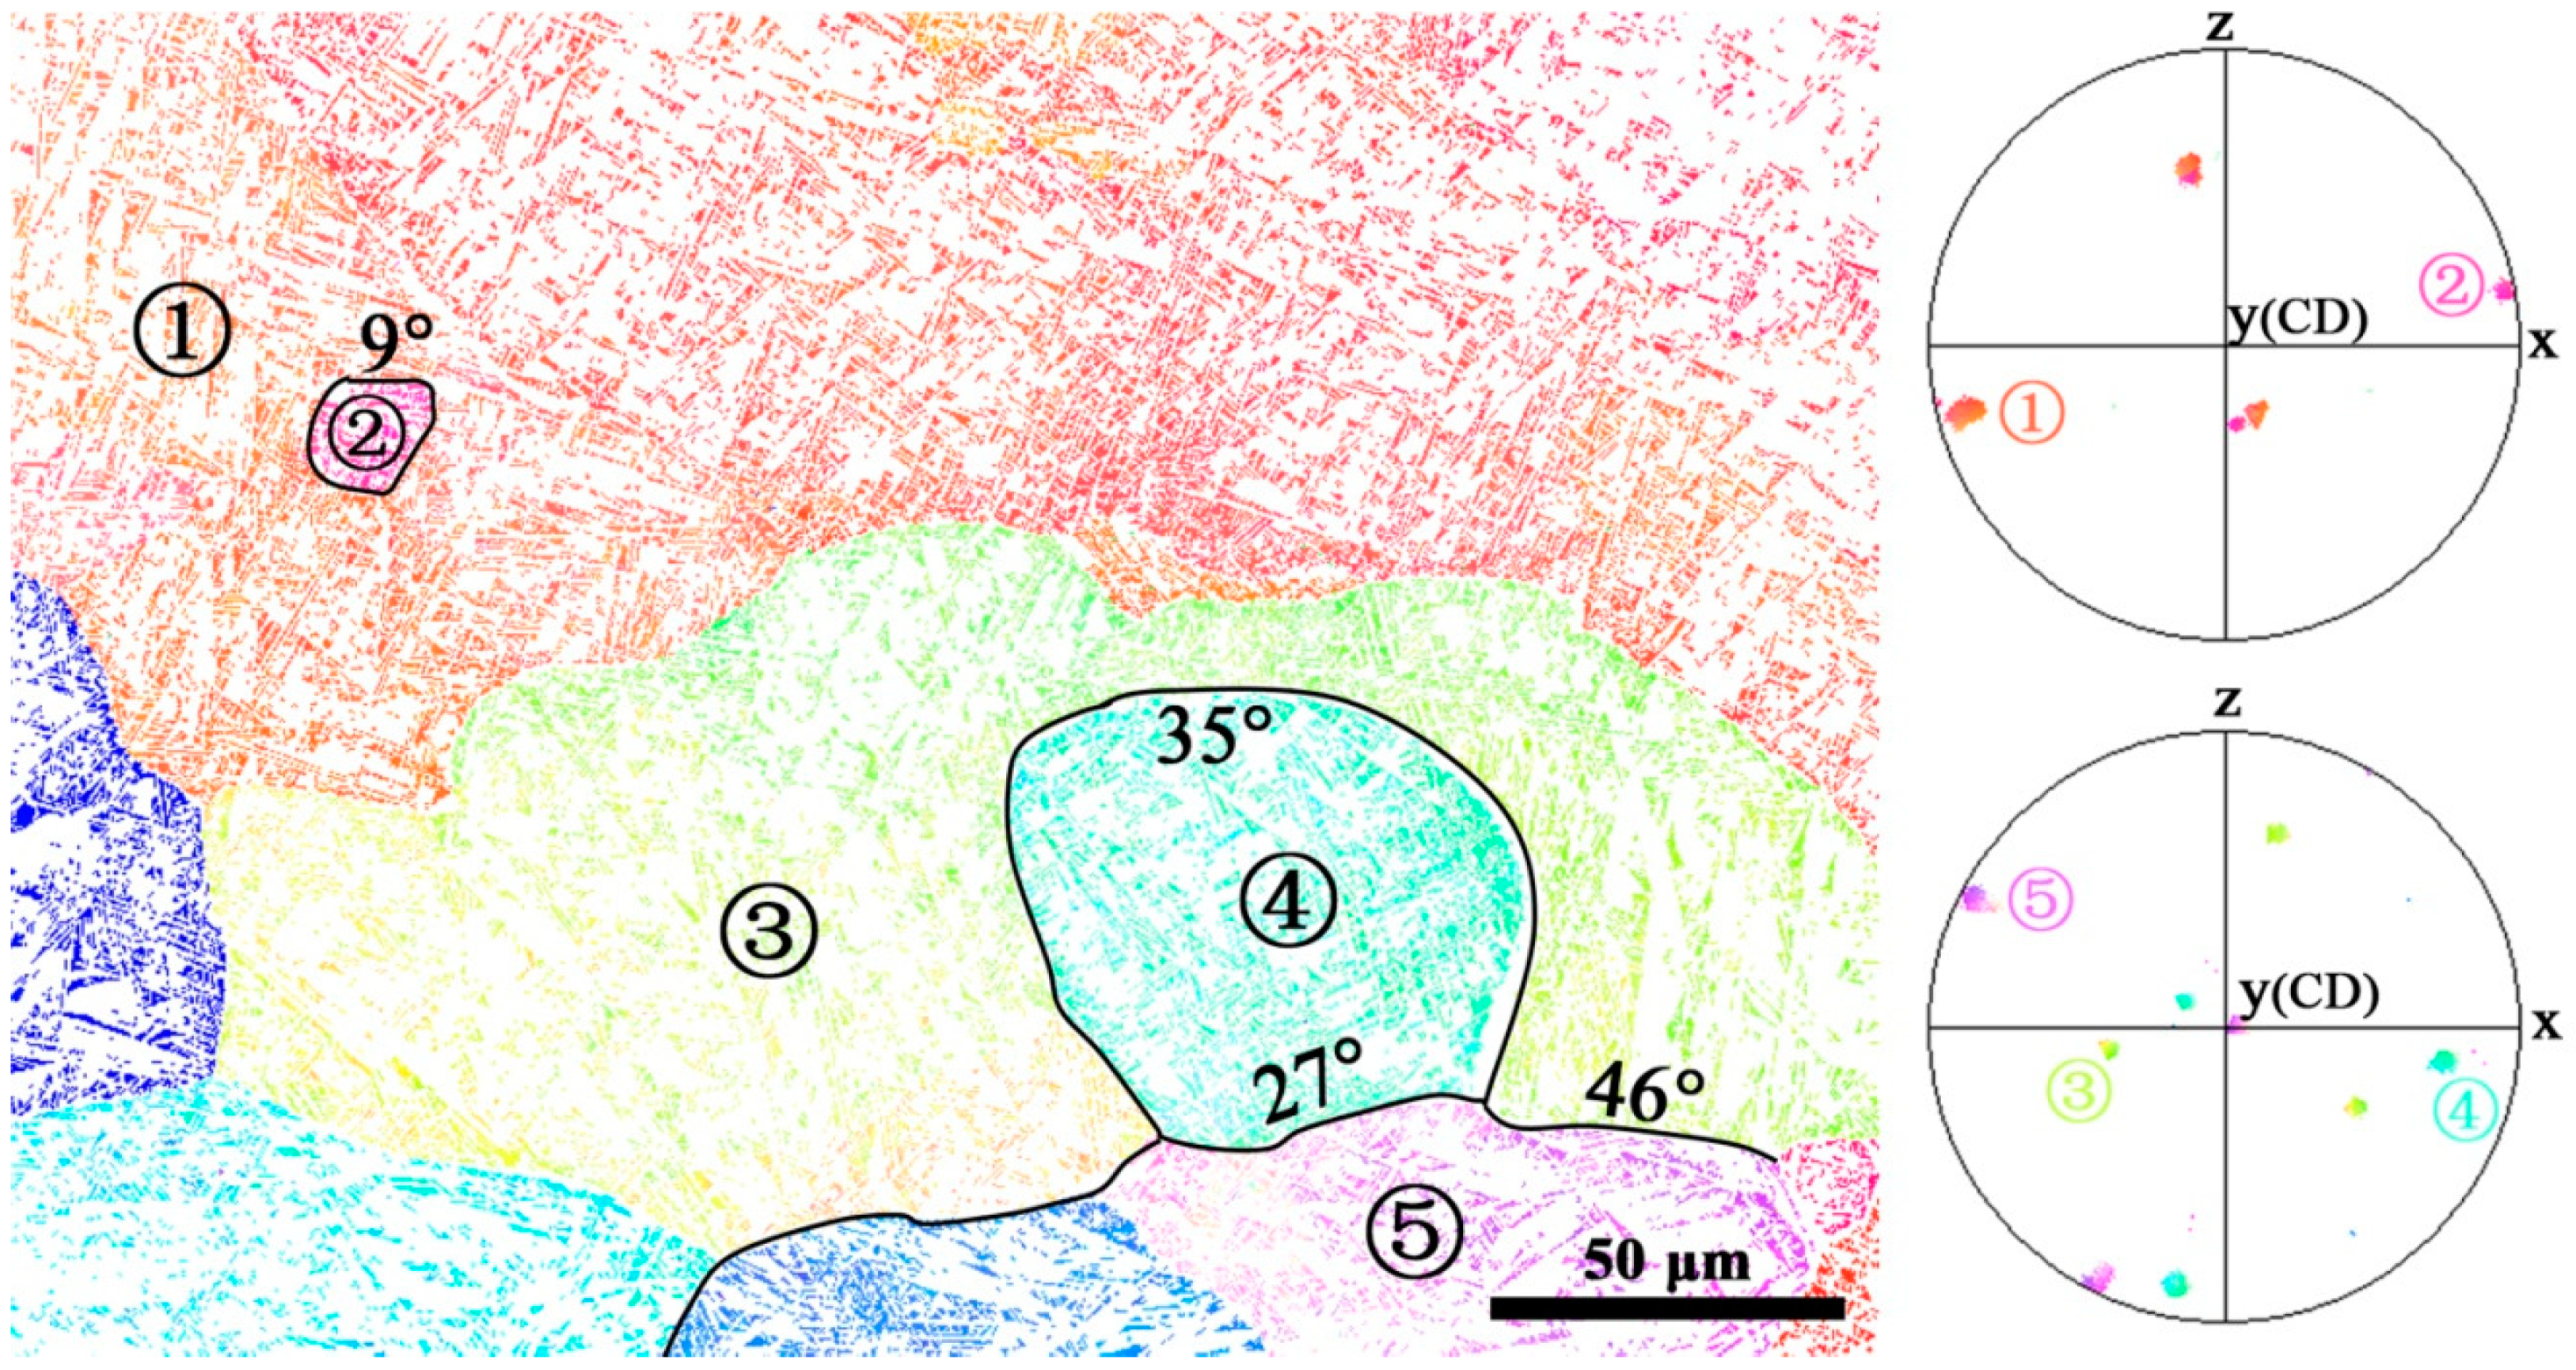
3.2. β Matrix Evolution

The inverse pole figure maps (IPFs) and the corresponding pole figures of the β phase after compression are shown in Figure 2. Note that at 2 s−1, the initially ultra-large β grains are significantly elongated perpendicular to the compression direction (CD), which produces a strong <100>//CD fiber and a weak <111>//CD fiber. Such texture components are quite common in hot-compressed body-centered cubic (BCC) alloys, such as Fe-Si [16] and β-titanium alloys [17]. Detailed IPF map (Figure 3) shows that there are a number of small DRXed grains being produced along the elongated and serrate grain boundaries (GBs), by means of a GB bowing mechanism. These DRXed grains always nucleate from the <100> orientated grains and grow into the adjacent grains. Such a mechanism can be rationalized by the preferential dynamicgrain boundary migration [16,18]. That is, the <100> orientations are relatively stable and have low stored energy relating to low Taylor factor, which result in the preferential growth of <100> orientations. Meanwhile, as demonstrated by the pole figures for local region A and B, the DRXed grains seem to nucleate via a growth-rotation manner, namely, the local orientations surrounded by a bowed GB gradually rotate (black arrows) from the parent grain toward the adjacent grain accompanied by the simultaneous GB migration. This is clearly manifested by the directional dispersing orientations from the parent poles (see the corresponding pole figures). Then, a new high angle grain boundary is formed between the DRXed and parent grains, as outlined by the solid lines in the inverse pole figure map. By this growth-rotation mechanism, other orientations, such as <111>, can be continuously destroyed and consumed.
One should note that DRXed grains can also nucleate at the GBs between two <100> oriented grains. For instance, in region B, there are two deformed grains, i.e., grain 4 with a rotated cube orientation (<100>{110}) and grain 3 with a cube orientation (<100>{100}). Obviously, DRXed grains (15 and 19) are produced by a simple rotation of the local orientations around the common <100> axis, as revealed by the corresponding pole figure. Therefore, one may conclude that the <100> orientation is still unstable, and a more stable orientation is expected with the proceeding of DRX.
Besides, there are two pointed should be stressed regarding the microstructure at 2 s−1. Firstly, there is no substantial substructure that can be noted within the elongated grain, which can be manifested by the uniform orientations in the grain interior. This is contradictory to that in β-titanium alloys where subgrains are extensively formed during deformation [18,19]. Secondly, due to the extreme thinning of the grains, occasionally the GB serration on opposite sides contact with each other, causing the pinching-off phenomenon (region C). This is somewhat analogous to the geometry of DRX [20]. However, it is inconsistent with the ordinary geometry DRX, because, in the present case, there is no extensive formation of substructures inside of the deformed grains. Anyway, the grain pinching-off is not frequently observed, and hence cannot affect the deformation to a large extent.
With the strain rate decreasing, as shown in Figure 2b,c, the DRXed volume fraction is dramatically increased and it results in a full DRXed microstructure at the lowest strain rate (0.02 s−1). Simultaneously, the <111> fiber is gradually vanishing as expectation, while in the meantime, the <100> orientations align to the rotated cube orientation so that at the lowest strain rate, a simple rotated cube orientation is produced. This may indicate that the rotated cube is the most stable orientation in the present case. Meanwhile, another interesting phenomenon should be noted, namely, the maximum intensity of the <100> component is continuously reduced with the decreasing strain rates. This is contradictory to the studies by Onuki et al. [21], who found that the decreasing strain rates sharpen the rotated cube component. This is, probably, because in their study, the initially small grain size is excessively increased during deformation. Therefore, the opposite trend in the present study is caused by the grain refinement, which leads to the orientation subdivision of the initially ultra-large grains.
Dynamic grain boundary migration still extensively occurs in the full-DRXed microstructure (0.02 s−1). As demonstrated by Figure 4, both grain 3 and 5 are DRXed grains, but a new grain 4 is formed by the migration of the GB predecessor into grain 3 with unfavorable orientation (<111> orientated, as manifested by the pole figure). This point, when combined with the DRX nucleation mechanism proposed above, implies that the rotated cube orientation is progressively generated. It should be stressed again that only occasionally the subgrains could be observed, even at the lowest strain rate, which isshown as grain 2 in Figure 4. There is no evidence for drastic continuous reaction, such as extended DRV or in-situ recrystallization, which is the major DRX mechanism in other alloys with high stacking-fault energy [20].
In conclusion, DRX via preferential dynamic GB migration is the major restoration process for the present alloy deformed within β phase field, rather than DRV. With the strain rate decrease, the <100> + <111> double-fiber is gradually replaced by a simple rotated cube orientation.

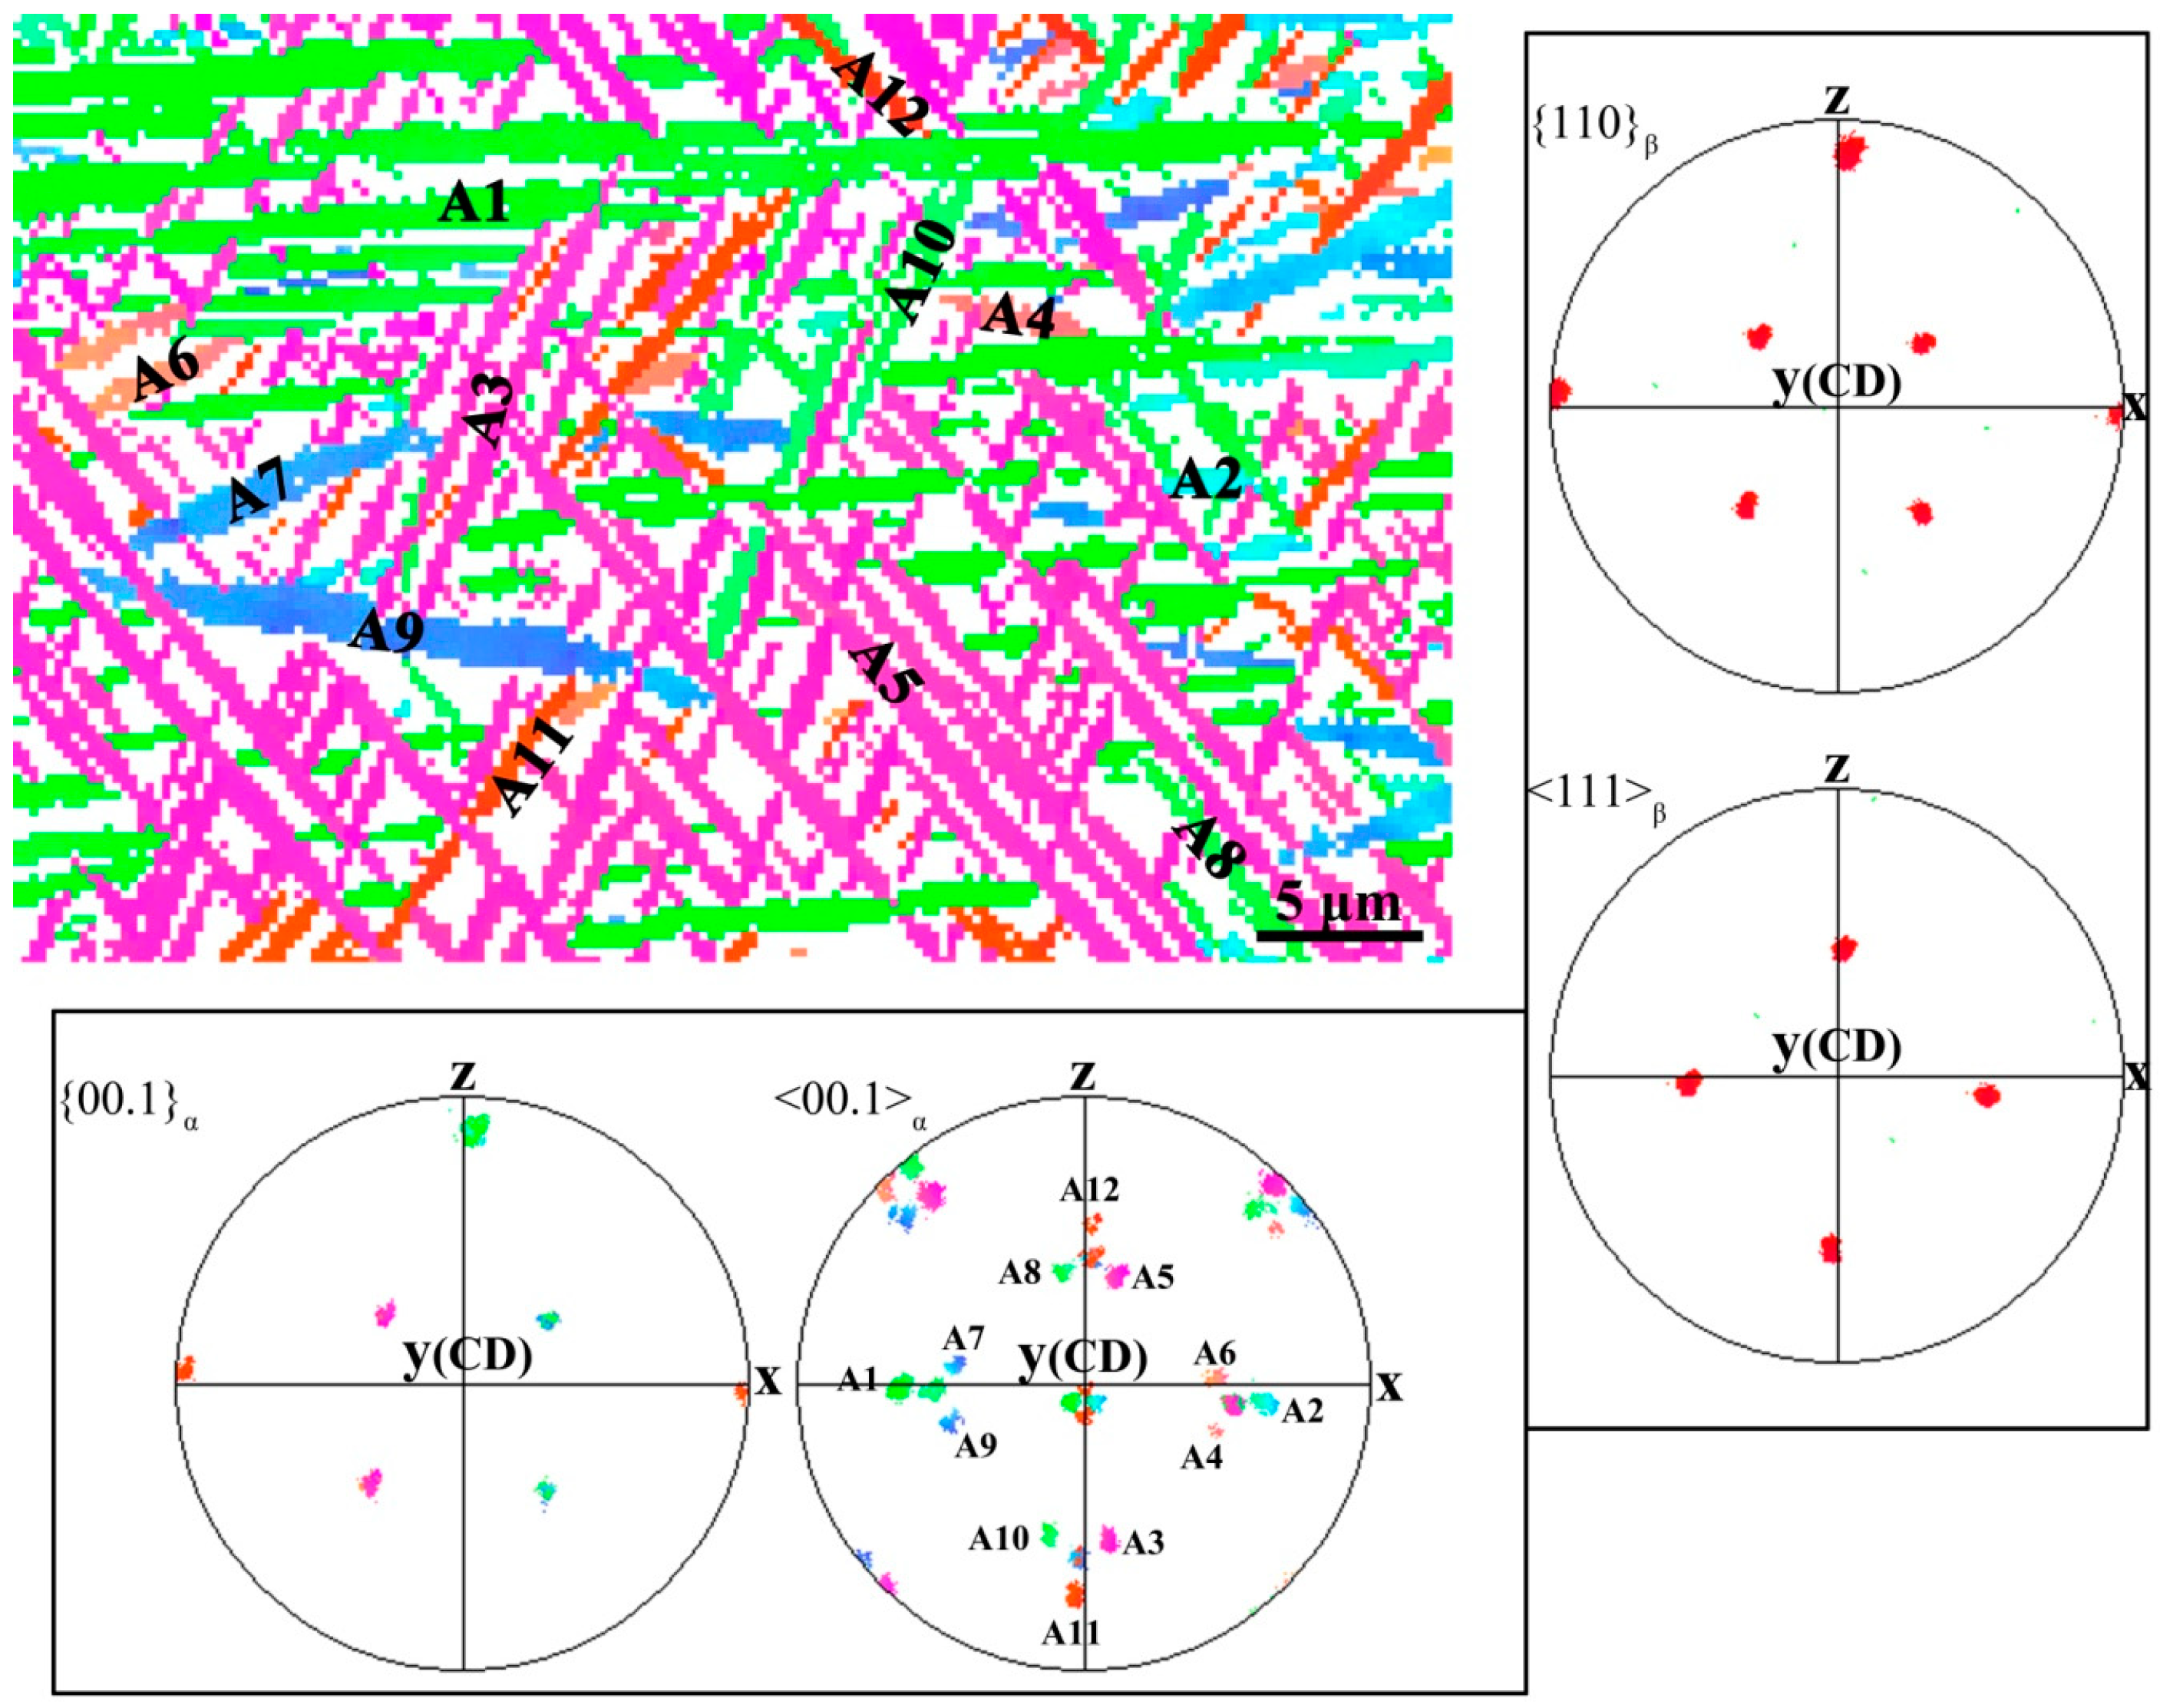
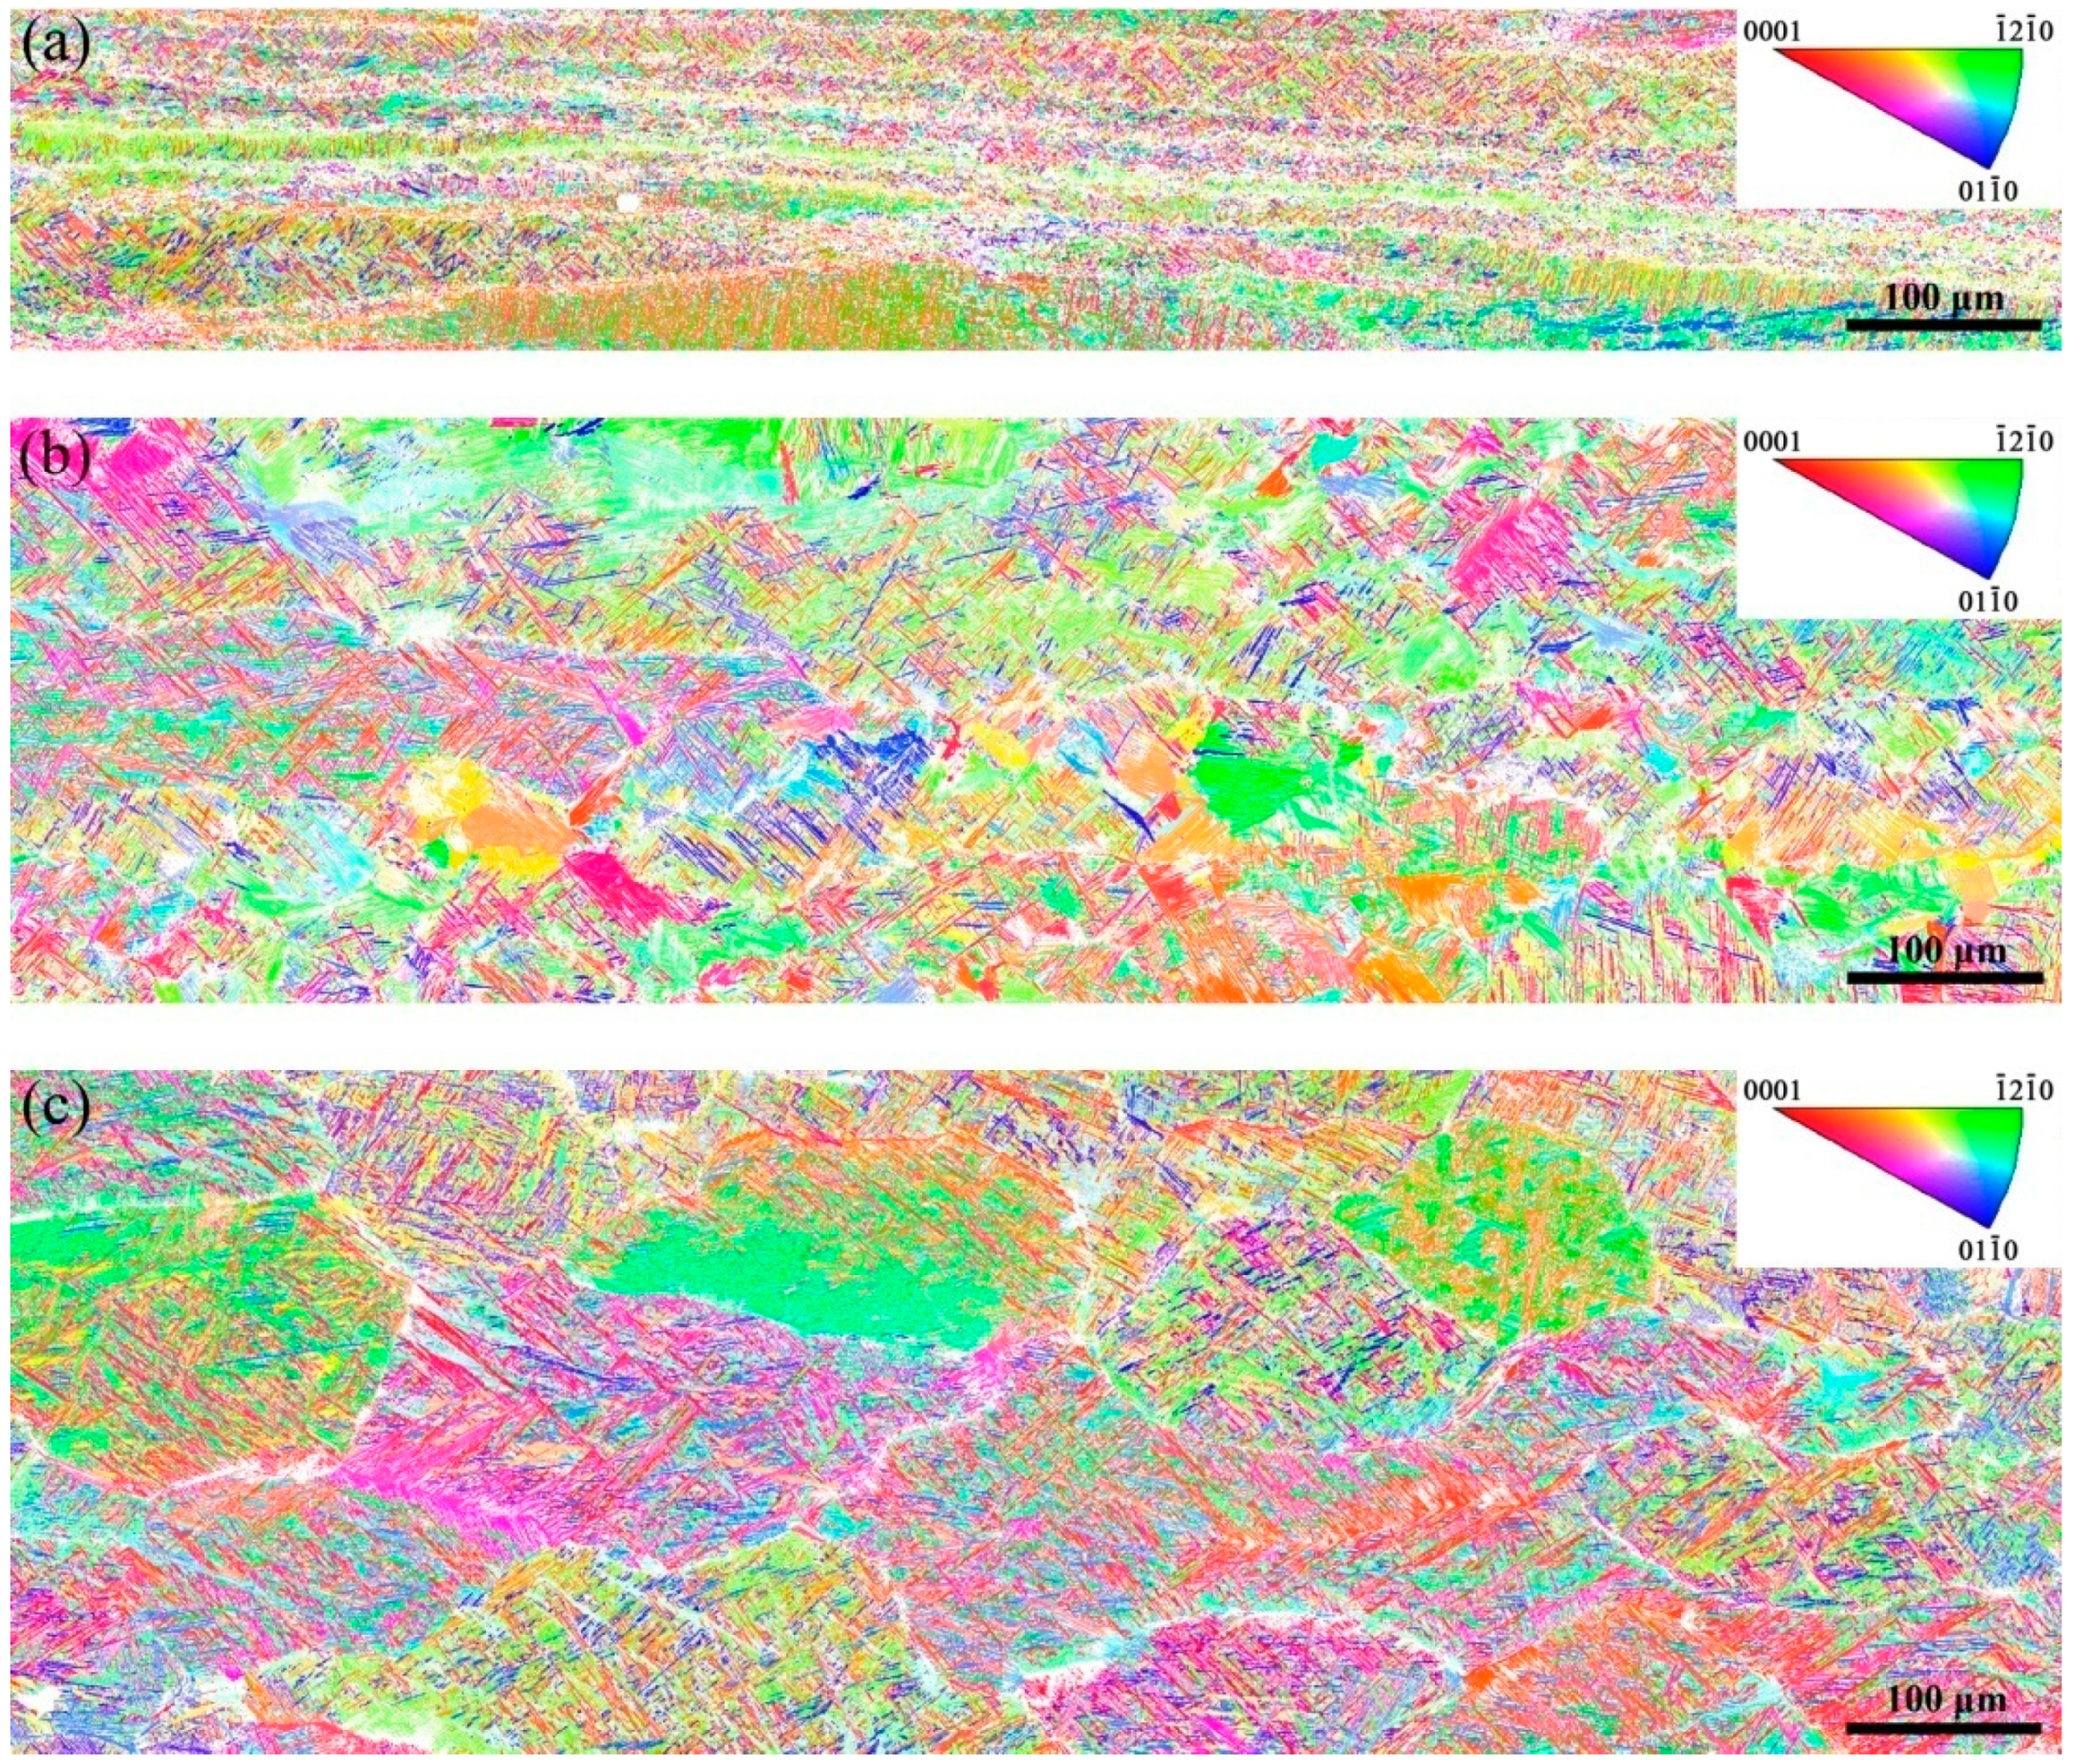
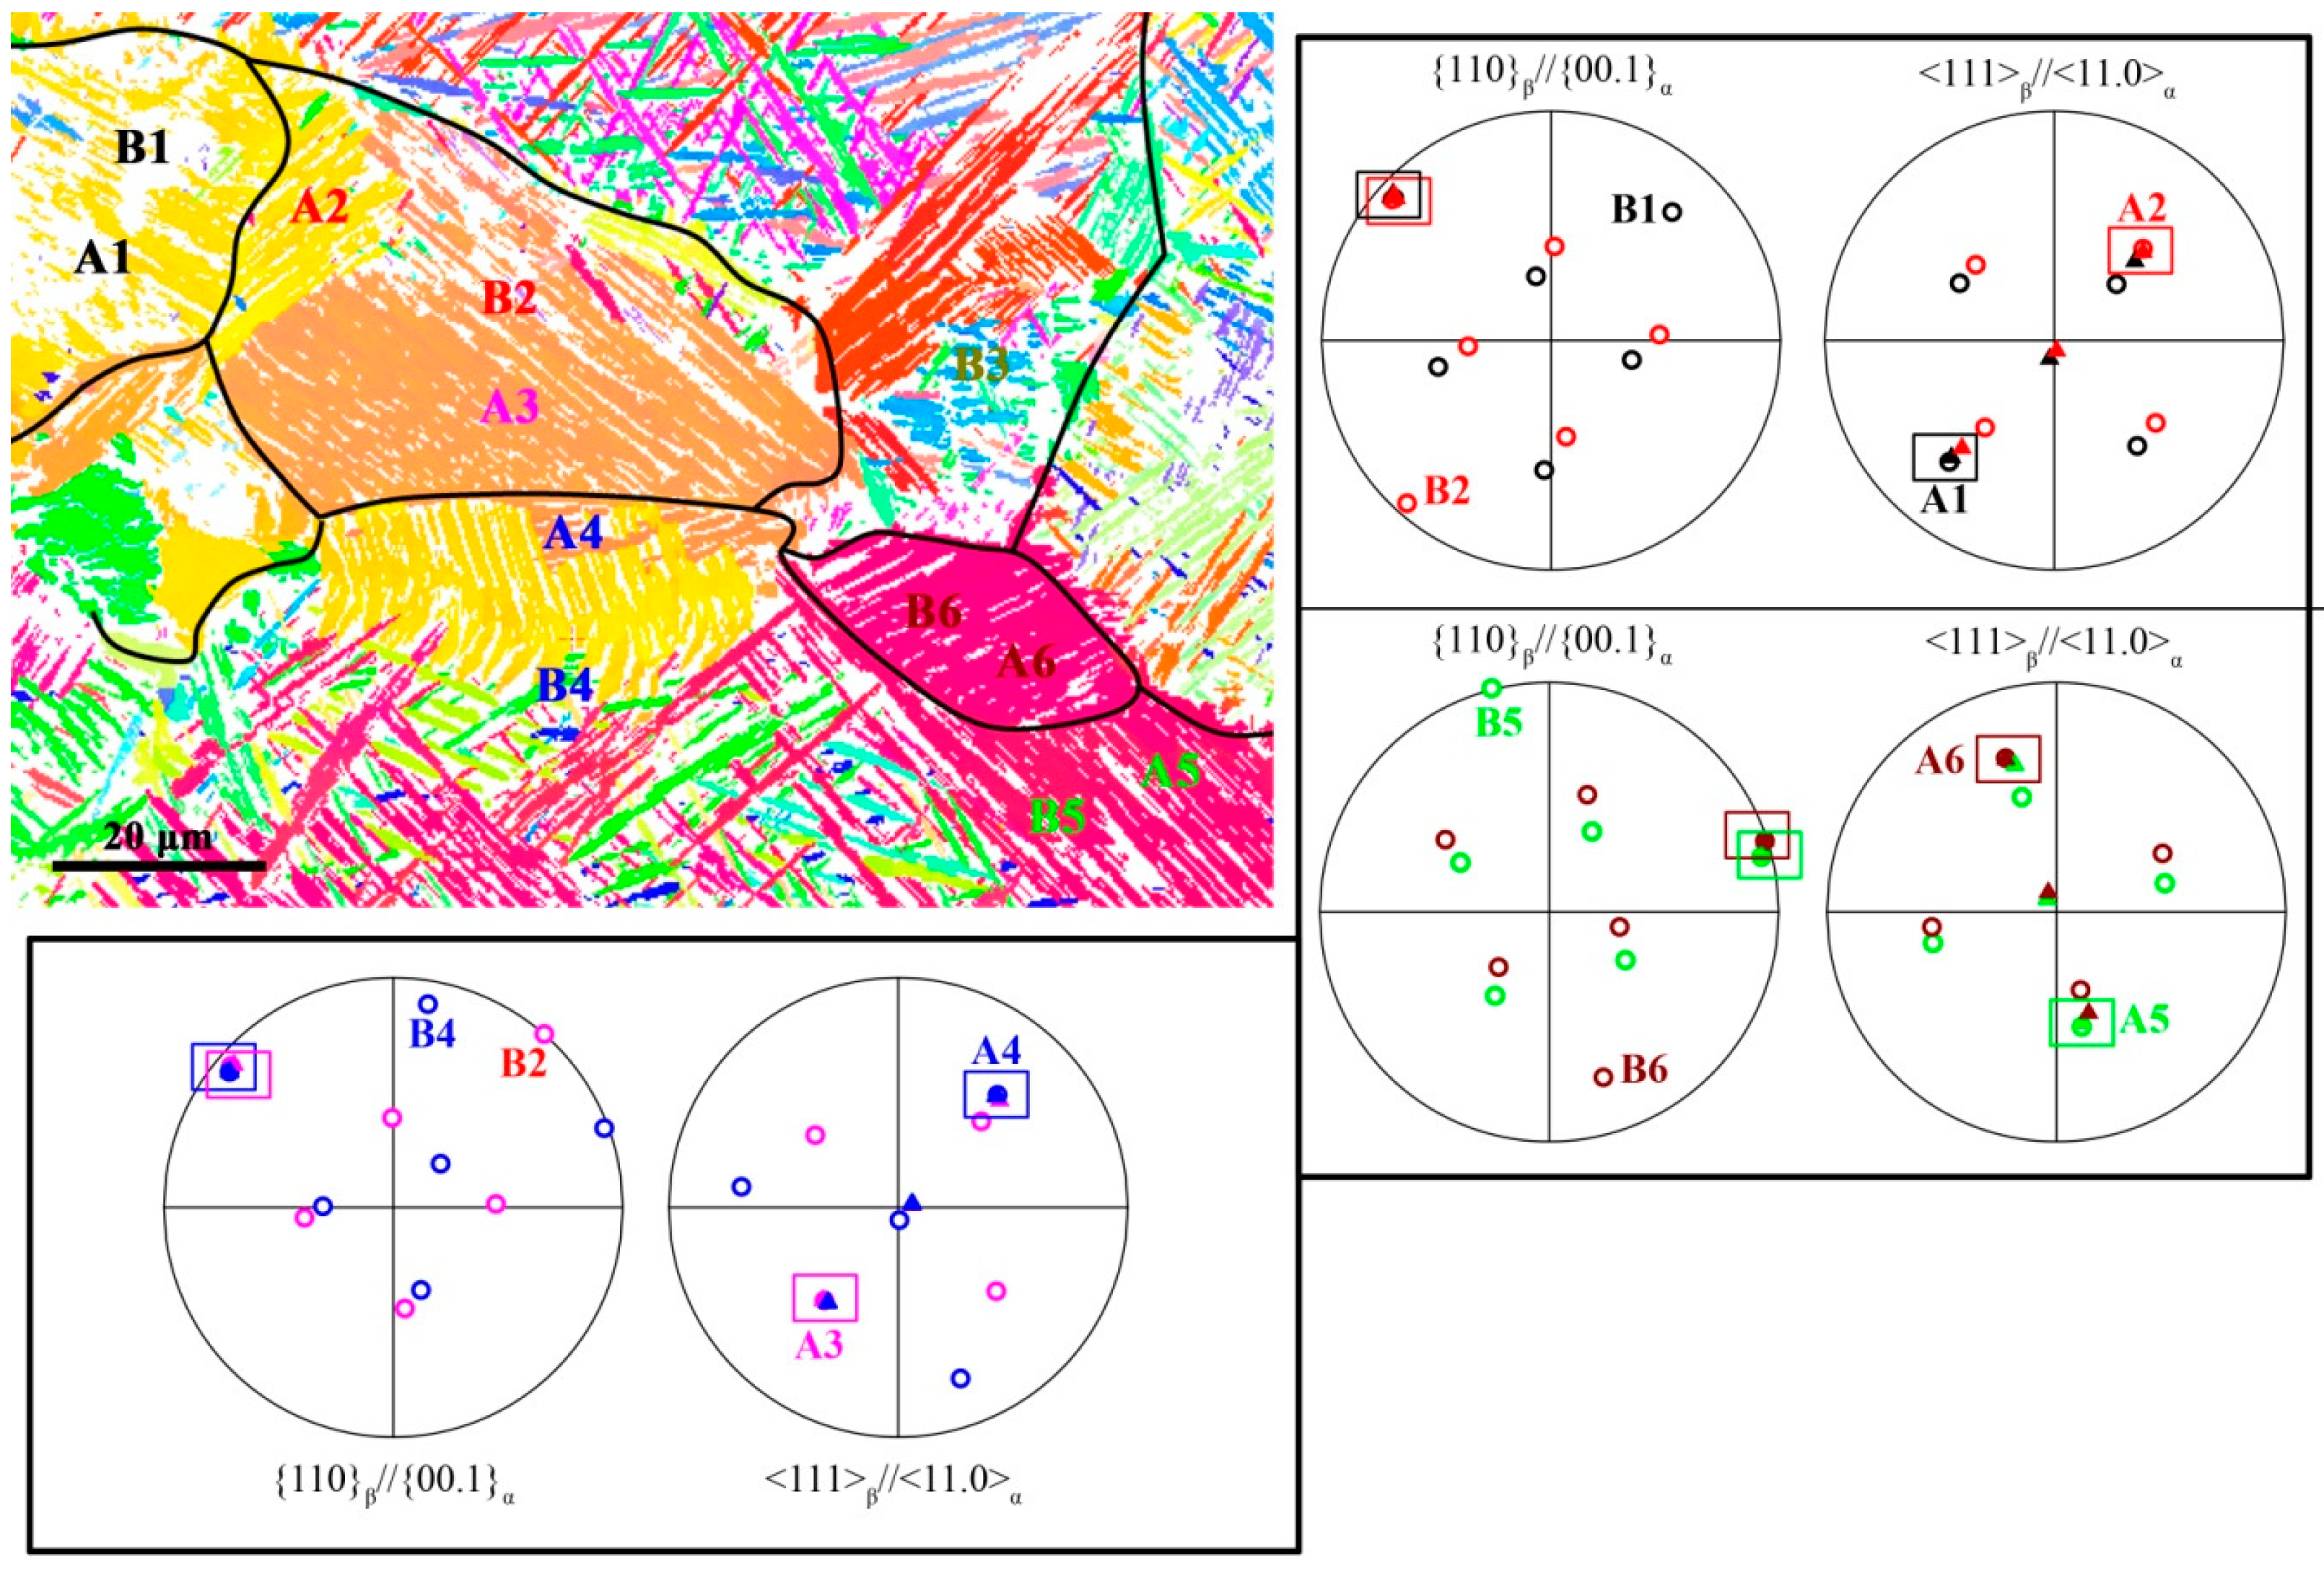
3.3. β→α Transformation

The β→α transformation pathway in titanium or TiAl alloys is fairly sensitive to cooling rate. Accordingly, various α morphology can be produced, such as martensitic α, massive α, and Widmanstatten α [22]. As for the present alloy, after air-cooling from the β phase field, martensitic transformation is predominant, according to our previous study [23]. This is confirmed by the extensive formation of martensitic laths as shown in a local IPF map (Figure 5) which is performed inside of one single β grain. The corresponding pole figures manifest a definite BOR between β and α. Note that all the twelve variants, which are labeled by A1-A12 on the map and the <11.0> pole figure emerge in such a small map. According to the previous study [22], local variant selection is exists, so that, in general, three variants sharing one common <11.0> axis is predominant in a local region. In this study, for instance, A1, A3, A5 are the major variants in Figure 5.
Except the martensitic laths, Widmanstatten α colonies are also noted in Figure 6, which is characterized by long parallel α plates. It is well-recognized that during Widmanstatten transformation in dual-phase titanium alloys, α layers heterogeneously nucleate along β GBs firstly, and then grow into the β grain interior in either side, according to strict BOR, resulting in large α colonies [22]. Meanwhile, apparent variant selection is existed, which is a result of preferential nucleation of certain GB α variant between two β grains sharing a nearly common <110>. The c-axis of this GB α adopts this direction [2,24]. Such a variant selection has significant effect on the transformation microstructure/texture and mechanical properties [25].
The IPF map in Figure 7 shows a group of Widmanstatten colonies in the sample deformed at 0.2 s−1. In comparison with the martensitic laths, the Widmanstatten plates are much thicker and closely stacked. Further examination reveals that most detected Widmanstatten colonies grow across the prior β GBs, and exhibit very similar crystallography on both sides, though the growth directions differ by large angles. For instance, A3 and A4 are crystallographically the same, and simultaneously form BOR with B2 and B4. This is because, according to BOR, there is a 60°/[11.0] relationship between a given α variant and one of its crystallographically equivalent variants, where [11.0] and 60° are the rotated axis and angle, respectively. Coincidently, in the present case, grain B2 and B4 are inter-related by a ~60°/[111]. As for B2 or B4, there is one and only one α variant that can simultaneously satisfy the BOR for both β grains. This α variant will be preferentially precipitated for minimizing the interfacial energy. An analogous conclusion can be deduced if the neighboring β grains are inter-related by 10.53°/[110], because there is a 10.53°/[00.1] relationship between an α variant and one of its equivalent variants. This is confirmed by A1 and A2 in Figure 7. However, because the misorientation between B1 and B2 is lightly deviated from the ideal (10.53°/[110]), hence A1 and A2 are not exactly the same in terms of crystallography.
Another interesting example is for A5 and A6 whose host β grains do not share a common [110] axis but deviate by ~5°. In this case, either A5 or A6 still form rough BOR with β grain on the other side. This, as well as the above-mentioned examples, implies that the nature of variant selection for Widmanstatten α in the present alloy is the preferential nucleation of a certain variant (relative to a certain β grain), which can simultaneously form (rough) BOR with the adjacent β grain. From this point of view, the cases of “10.53°/[00.1]” and “60°/[111]” mentioned above are particular exhibitions of the variant selection. Besides, when considering that the martensitic transformation is predominant in the present alloy, as well as its competitive character relative to diffusional transformation, only the Widmanstatten α nuclei meet such a variant selection criterion can substantially develop owing to the minimum energy required. This is consistent with the limited Widmanstatten colony number in the deformed samples (see Figure 5). Nevertheless, in some small DRXed grains, such as B2 and B6 in Figure 7, Widmanstatten α is predominant with only a few (or even one) variants.

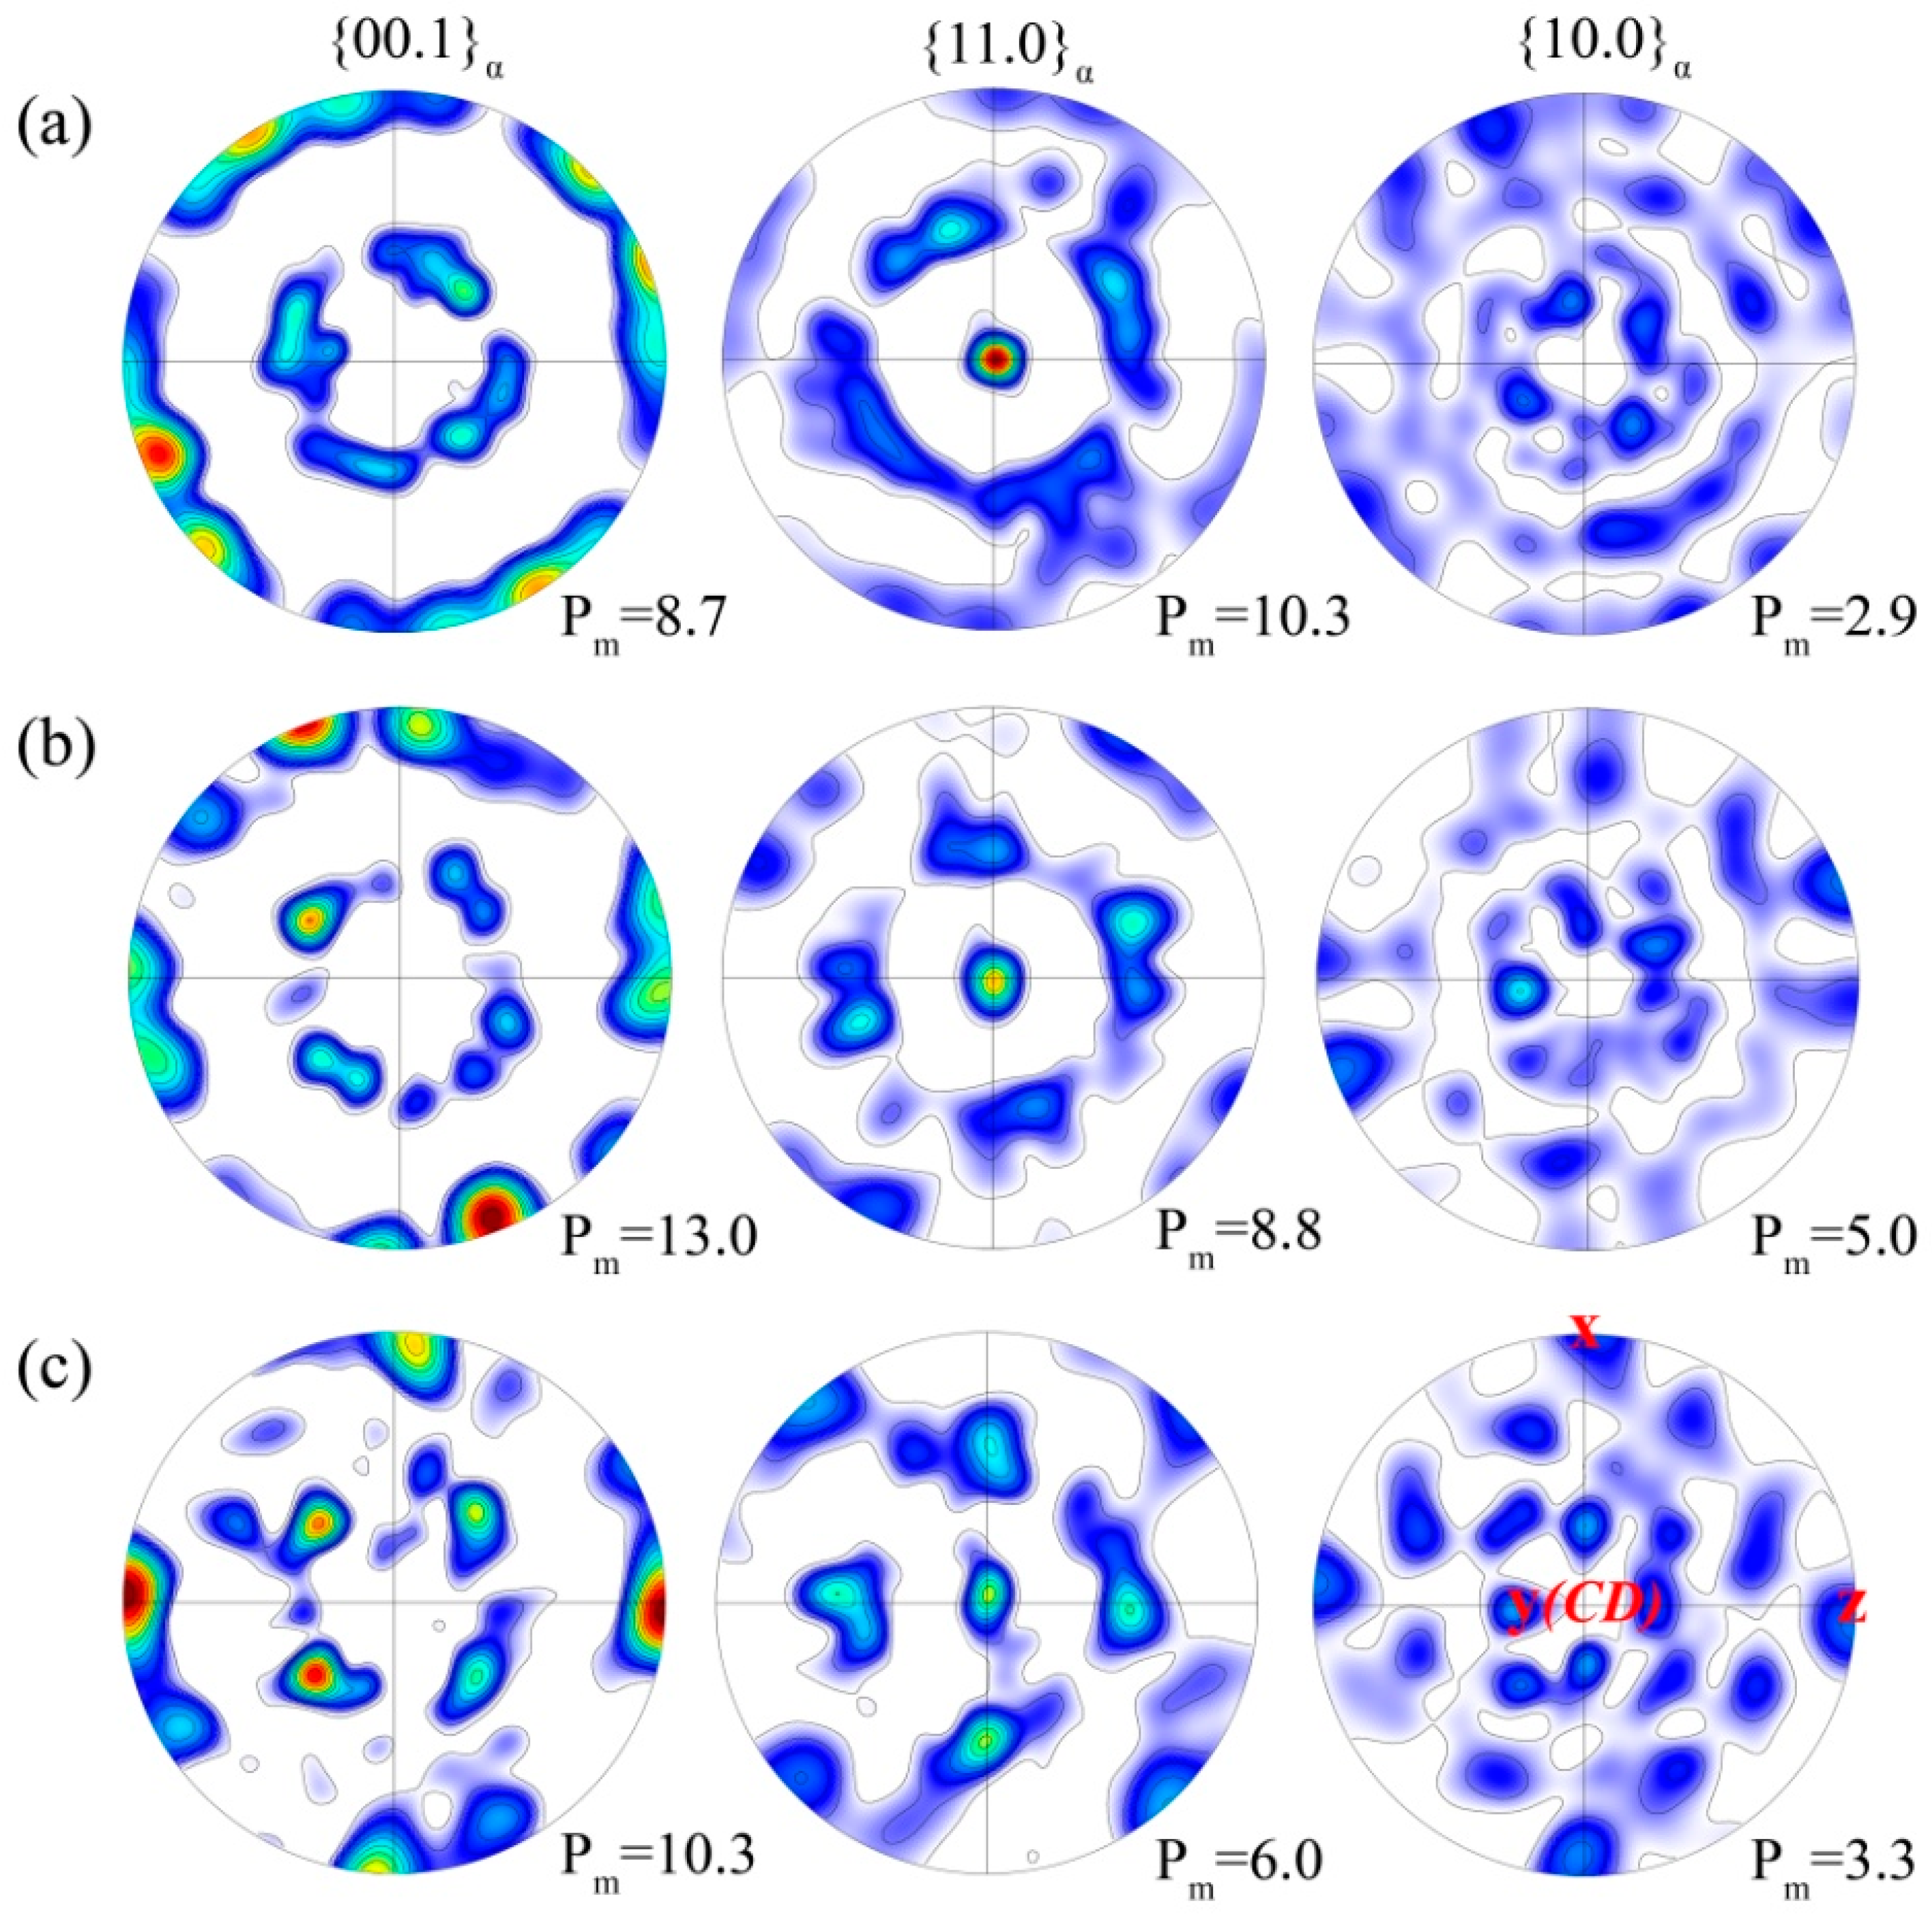
3.4. Transformation Texture

Pole figures in Figure 8 illustrate the texture evolution of the transformed α phase. At the strain rate of 2 s−1, the <11.0> pole figure exhibit strong<11.0>//CD fiber, and the corresponding <00.1> pole figure displays an additional fiber, which is ∼45°rotated with respect to the compression axis. With the decreasing strain rate, the fibers gradually align to several discrete orientations, as indicated by the pole figures in Figure 8c. By comparison of the texture between Figure 2 and Figure 8, one can note that the BOR is evident and the transformation texture seems to be a pure consequence of BOR. However, it is mentioned above that there are apparent variant selection both for Widmanstatten α and martensite. In order to reveal the role of variant selection on the transformation texture, simulations are performed that are based on the β texture (Figure 2) under the assumption that all twelve variants occur with the same probability. The calculated transformation textures for the highest (2 s−1) and lowest (0.02 s−1) strain rates are shown in Figure 9. As can be seen, in comparison with the experimental results shown in Figure 8, the textures are basically the same, both in the qualitative and quantitative form, which manifests that the variant selections have slight effect on the transformation texture. This is because, as mentioned above, the Widmanstatten α2 colonies are in a fairly small volume fraction, and hence, the α texture is mainly determined by the martensite, which shows no global variant selection.
In conclusion, the transformation texture of the present alloy is directly related to the parent β texture. As mentioned above, a chaotic distribution (minimized texture, more variants) of transformed α phase is beneficial for mechanical properties. Hence, regarding the β processing of the TiAl alloys, one of the key steps is a careful selection of processing parameters (e.g., strain rate) to control the β texture, as well as an appropriate cooling rate to suppress the excessive development of Widmannstatten α.

4. Conclusions

In this study, we have investigated the deformation behavior of a β-solidifying TiAl alloys within the β phase field and its effect on the transformation microstructures. The main conclusions are drawn below.
(1)
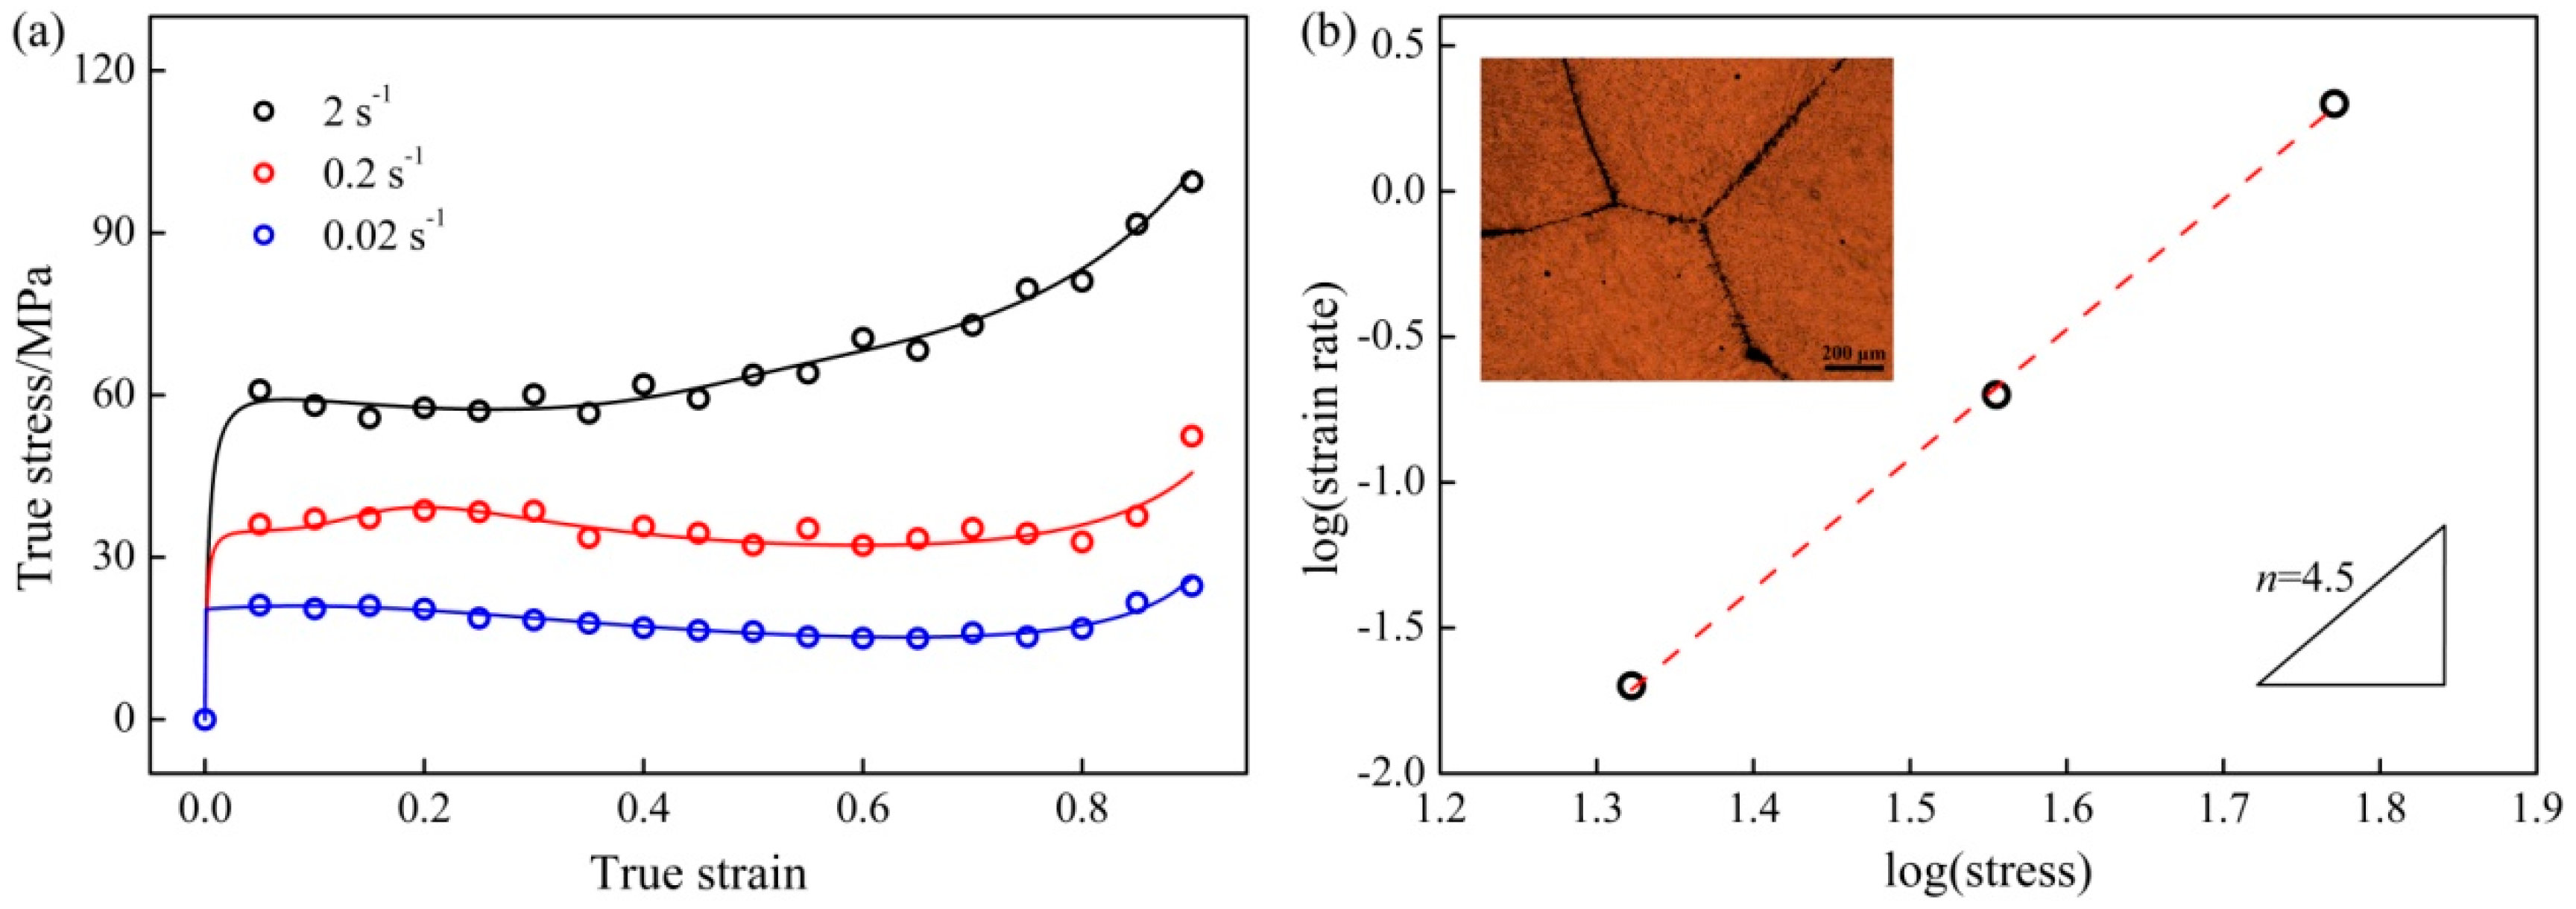
The alloy behaved steady-state flow at β phase field under various strain rates. The stress exponent was estimated to be 4.5, indicating dislocation creep as the major deformation mechanism.
(2)
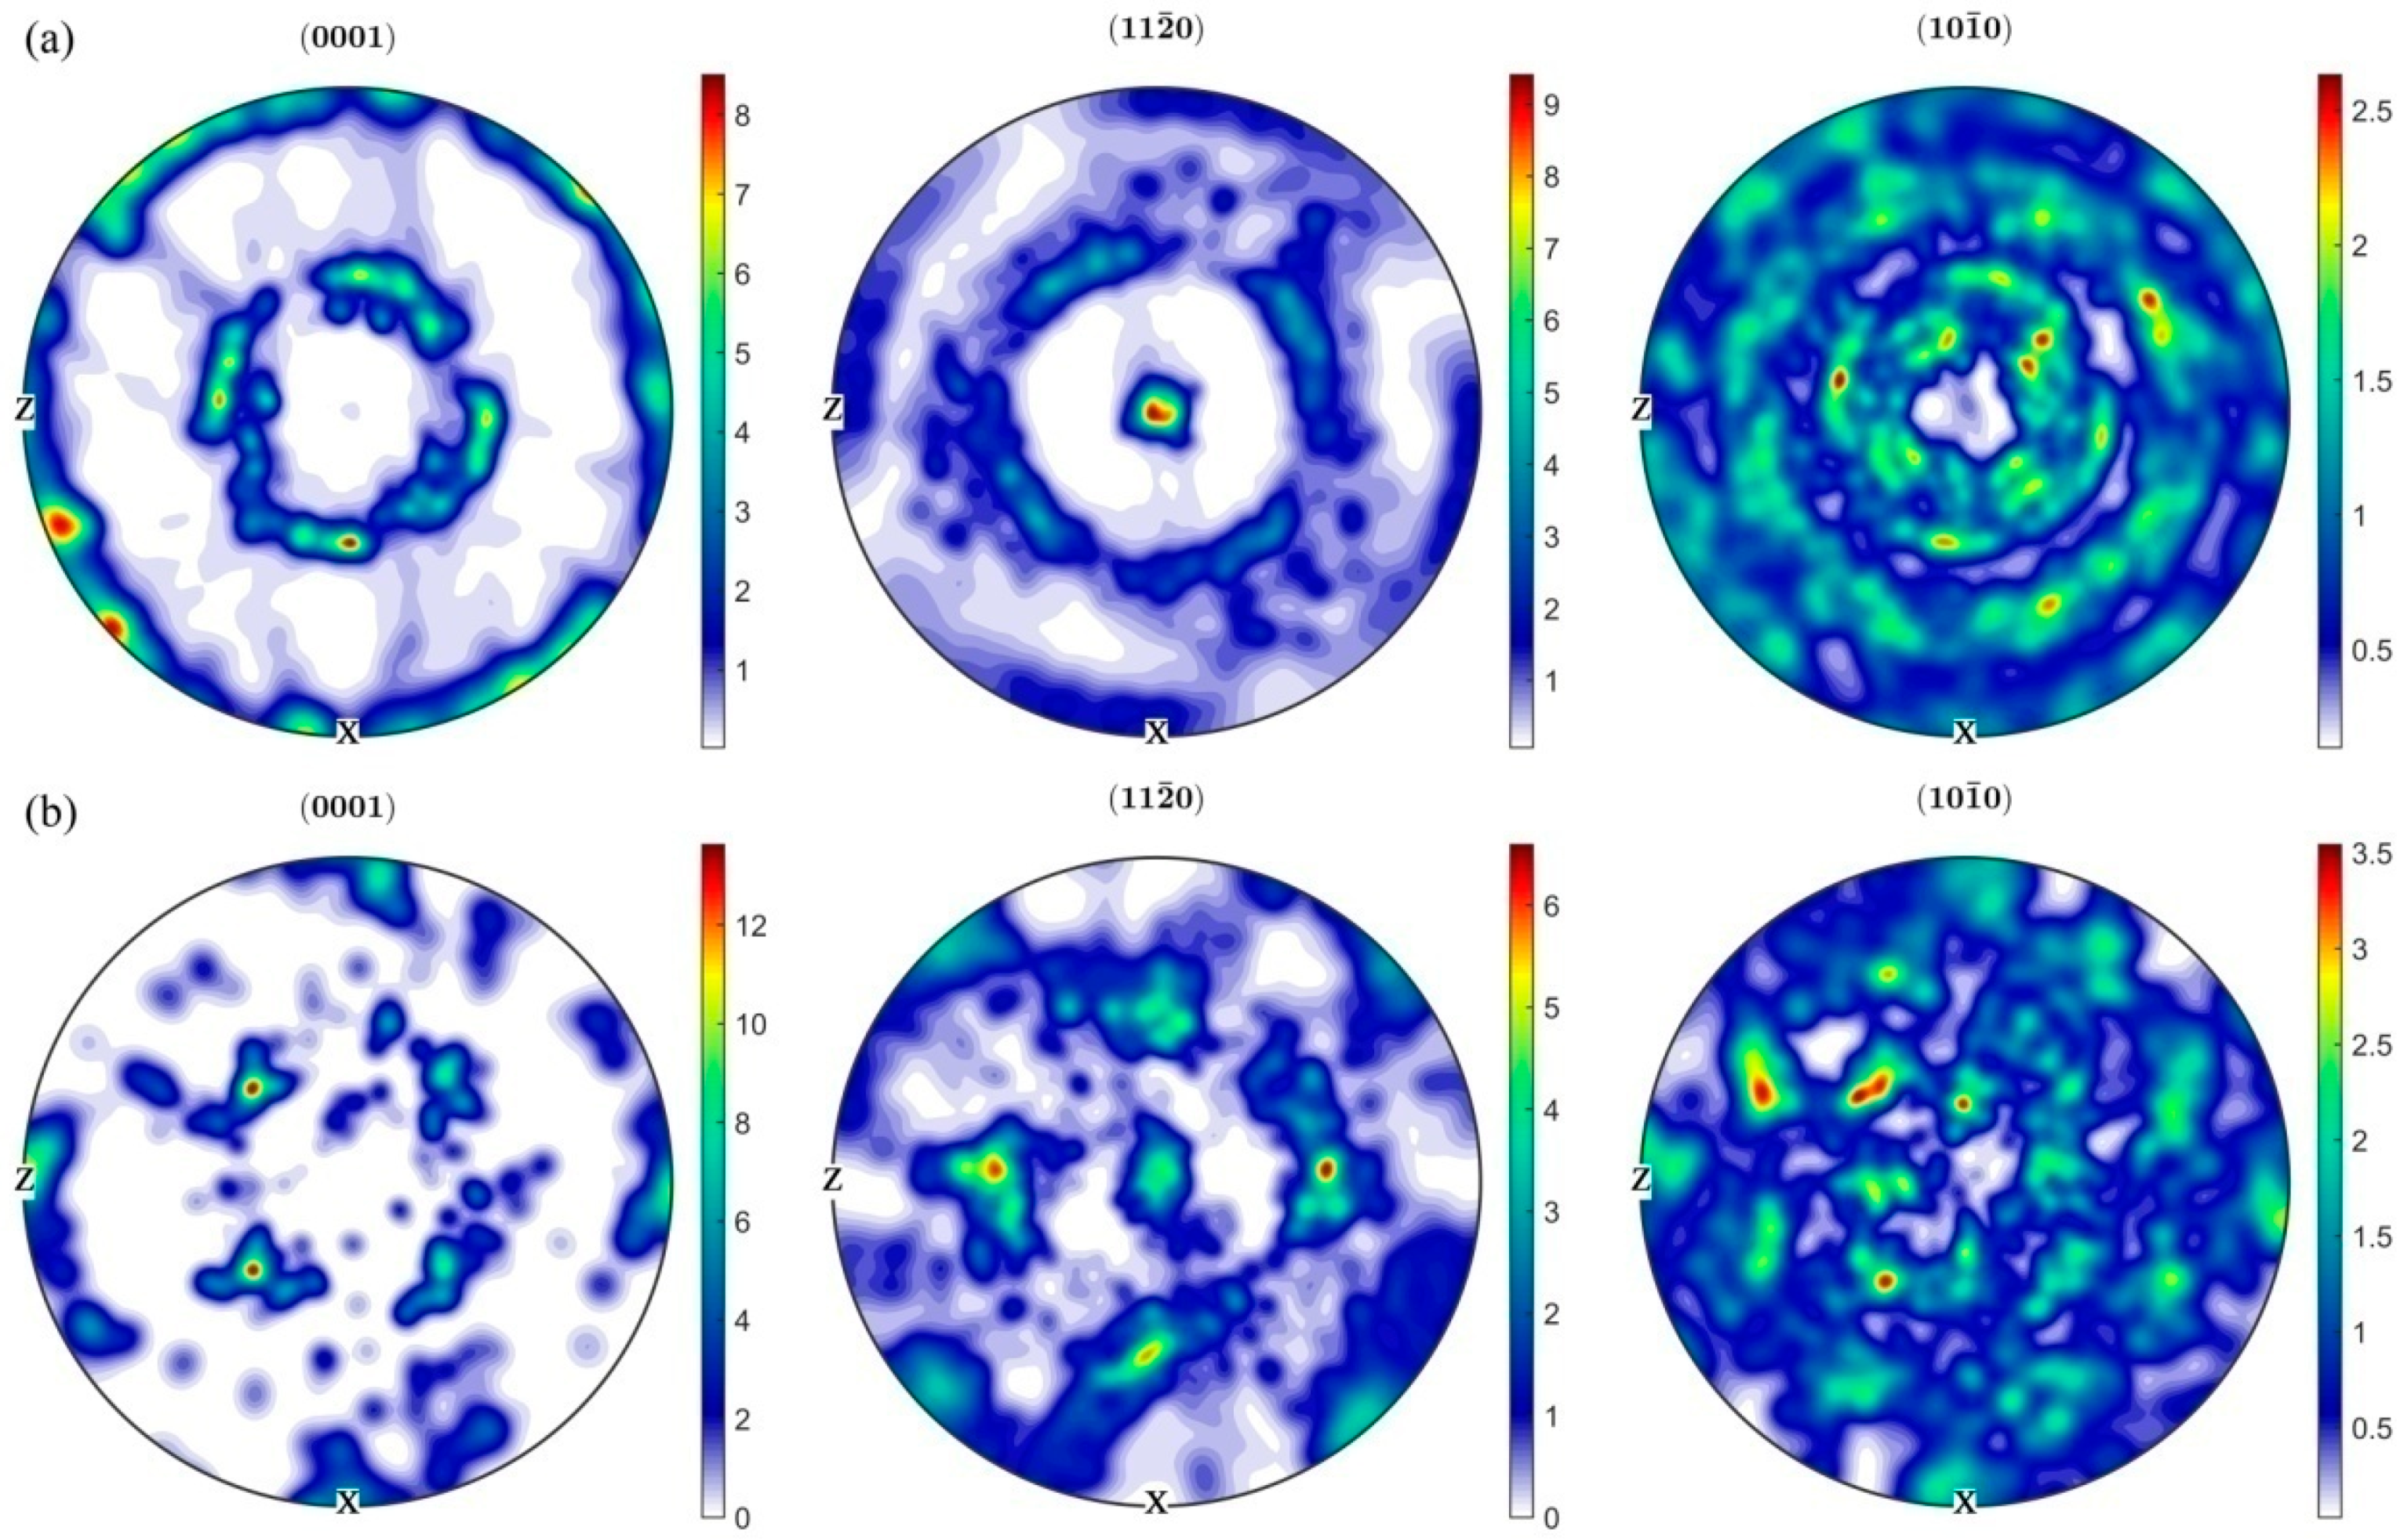
Dramatic DRX of the β matrix occurred during deformation, and the major nucleation mechanism was the preferential dynamic migration of grain boundaries with <100> orientation. As the strain rate decreased, the DRXed volume fraction was significantly increased. Meanwhile, the texture was gradually changed from a <100> + <111> double-fiber to a simple rotated cube orientation.
(3)
During air-cooling from the deformation temperature, two types of α morphologies have been produced. The first is Widmannstatten α colonies, which preferentially nucleated when this variant was BOR-related with β grains on both sides. The second is martensitic α laths where three variants shared a common <11.0> axis was predominant in local region. The transformation texture was demonstrated to be a simple result of BOR, and hence it was directly determined by the parent β texture.

Author Contributions

Y.C. conceived and designed the experiments, analyzed the experimental data, wrote and revised the manuscript. L.C. carried out the experiments and wrote the manuscript. G.Y., Y.L. and F.H. discussed the results.

Acknowledgments

This work was financially supported by the National Natural Science Foundation of China (No. 51601077, No. 51701107), the National Natural Science Foundation of Jiangsu province (No. BK20160291), the Natural Science Foundation of the Jiangsu Higher Education Institutions (No. 17KJB430013), and the fund of the State Key Laboratoryof Solidification Processing in NWPU (SKLSP201822). This work was also supported by the Jiangsu Planned Projects for Postdoctoral Research Funds (Grant No. 1701006B).

Conflicts of Interest

The authors declare no conflict of interest.

References

  1. Zhao, Z.B.; Wang, Q.J.; Hu, Q.M.; Liu, J.R.; Yu, B.B.; Yang, R. Effect of β(110) texture intensity on α-variant selection and microstructure morphology during β/α phase transformation in nearαtitanium alloy. Acta Mater. 2017, 126, 372–382. [Google Scholar] [CrossRef]
  2. Stanford, N.; Bate, P.S. Crystallographic variant selection in Ti–6Al–4V. Acta Mater. 2004, 52, 5215–5224. [Google Scholar] [CrossRef]
  3. Qiu, D.; Shi, R.; Zhao, P.; Zhang, D.; Lu, W.; Wang, Y. Effect of low-angle grain boundaries on morphology and variantselection of grain boundary allotriomorphs and Widmanstattenside-plates. Acta Mater. 2016, 112, 347–360. [Google Scholar] [CrossRef]
  4. Shi, R.; Dixit, V.; Viswanathan, G.B.; Fraser, H.L.; Wang, Y. Experimental assessment of variant selection rules for grain boundary α in titanium alloys. Acta Mater. 2016, 102, 197–211. [Google Scholar] [CrossRef]
  5. Clemens, H.; Wallgram, W.; Kremmer, S.; Güther, V.; Otto, A.; Bartels, A. Design of novel β-SolidifyingTiAl alloys with adjustable β/B2-phase fractionand excellent hot-workability. Adv. Eng. Mater. 2008, 10, 707–713. [Google Scholar] [CrossRef]
  6. Yang, G.; Kou, H.C.; Yang, J.R.; Li, J.S.; Fu, H.Z. Microstructure control of Ti45Al8.5Nb(W, B, Y) alloy during the solidification process. Acta Mater. 2016, 112, 121–131. [Google Scholar] [CrossRef]
  7. Hu, D.; Jiang, H. Martensite in a TiAl alloy quenched from beta phase field. Intermetallics 2015, 56, 87–95. [Google Scholar] [CrossRef]
  8. Takeyama, M.; Kobayashi, S. Physical metallurgy for wrought gamma titanium aluminidesmicrostructure control through phase transformations. Intermetallics 2005, 13, 993–999. [Google Scholar] [CrossRef]
  9. Mayer, S.; Petersmann, M.; Fischer, F.D.; Clemens, H.; Waitz, T.; Antretter, T. Experimental and theoretical evidence of displacive martensite in an intermetallic Mo-containing γ-TiAl based alloy. Acta Mater. 2016, 115, 242–249. [Google Scholar] [CrossRef]
  10. Hu, D.; Yang, C.; Huang, A.; Dixon, M.; Hecht, U. Solidification and grain refinement in Ti45Al2Mn2Nb1B. Intermetallics 2012, 22, 68–76. [Google Scholar] [CrossRef]
  11. Yang, C.; Jiang, H.; Hu, D.; Huang, A.; Dixon, M. Effect of boron concentration on phase transformation texture in as-solidified Ti44Al8NbxB. Scr. Mater. 2012, 67, 85–88. [Google Scholar] [CrossRef]
  12. Appel, F.; Paul, J.D.H.; Oehring, M. Gamma Titanium Aluminide Alloys: Science and Technology; Wiley-VCH Verlag & Co.: Weinheim, Germany, 2011; ISBN 9783527636204. [Google Scholar]
  13. Cheng, L.; Li, J.S.; Xue, X.Y.; Tang, B.; Kou, H.C.; Bouzy, E. General features of high temperature deformation kinetics for γ-TiAl-based alloys with DP/NG microstructures: Part I. A survey of mechanical data and development of unified rate-equations. Mater. Sci. Eng. A 2016, 678, 389–401. [Google Scholar] [CrossRef]
  14. Fundenberger, J.J.; Beausir, B. JTEX-Software for Texture Analysis; Université de Lorraine-Metz: Metz, France, 2015. [Google Scholar]
  15. Jones, N.G.; Dashwood, R.J.; Dye, D.; Jackson, M. Thermomechanical processing of Ti–5Al–5Mo–5V–3Cr. Mater. Sci. Eng. A 2008, 490, 369–377. [Google Scholar] [CrossRef]
  16. Onuki, Y.; Okayasu, K.; Fukutomi, H. Formation of {001} Fiber Texture in Fe-3mass%SiAlloy during Uniaxial Compression Deformation atElevated Temperatures. ISIJ Int. 2011, 51, 1564–1565. [Google Scholar] [CrossRef]
  17. Li, K.; Yang, P. The Formation of Strong {100} Texture by DynamicStrain-Induced Boundary Migration in HotCompressed Ti-5Al-5Mo-5V-1Cr-1Fe Alloy. Metals 2017, 7, 412. [Google Scholar] [CrossRef]
  18. Dong, R.F.; Li, J.S.; Kou, H.C.; Tang, B.; Hua, K.; Liu, S.B. Characteristics of a hot-rolled near β titanium alloy Ti-7333. Mater. Charact. 2017, 129, 135–142. [Google Scholar] [CrossRef]
  19. Fan, X.G.; Zhang, Y.; Gao, P.F.; Lei, Z.N.; Zhan, M. Deformation behavior and microstructure evolution during hot working of acoarse-grained Ti-5Al-5Mo-5V-3Cr-1Zr titanium alloy in beta phase field. Mater. Sci. Eng. A 2017, 694, 24–32. [Google Scholar] [CrossRef]
  20. Doherty, R.D.; Hughes, D.A.; Humphreys, F.J.; Jonas, J.J.; Jensen, D.J.; Kassner, M.E.; King, W.E.; McNelley, T.R.; McQueen, H.J.; Rollett, A.D. Current issues in recrystallization: A review. Mater. Sci. Eng. A 1997, 238, 219–274. [Google Scholar] [CrossRef]
  21. Onuki, Y.; Hongo, R.; Okayasu, K.; Fukutomi, H. Texture development in Fe–3.0 mass% Si duringhigh-temperature deformation: Examination of the preferentialdynamic grain growth mechanism. Acta Mater. 2013, 61, 1294–1302. [Google Scholar] [CrossRef]
  22. Ahmed, T.; Rack, H.J. Phase transformations during cooling in α+β titanium alloys. Mater. Sci. Eng. A 1998, 243, 206–211. [Google Scholar] [CrossRef]
  23. Chen, Y.; Cheng, L.; Sun, L.Y.; Lu, Y.L.; Yang, G.; Kou, K.C.; Bouzy, E. Characterization of a new microstructure in aβ-Solidifying TiAl alloy after air-cooling from β phase field and subsequent tempering. Metals 2018, 8, 156. [Google Scholar] [CrossRef]
  24. Bhattacharyya, D.; Viswanathan, G.B.; Fraser, H.L. Crystallographic and morphological relationships between β phase and the Widmanstätten and allotriomorphic α phase at special β grain boundaries in an α/β titanium alloy. Acta Mater. 2007, 55, 6765–6778. [Google Scholar] [CrossRef]
  25. Wilson, R.J.; Randle, V.; Evans, W.J. The influence of the Burgers relation on crack propagation in a near α-titanium alloy. Philos. Mag. 1997, 76, 471–480. [Google Scholar] [CrossRef]
Figure 1. (a) Flow curves of the Ti-40Al-10V alloy at 1300 °C under various strain rates. (b) The relationship between strain rates and flow stresses corresponding to a true strain of 0.1. The inserted optical image is the microstructure of the alloy after heat treatment at 1300 °C for 3 min, followed by quenching.
Metals 08 00605 g001
Figure 2. Inverse pole figure maps and the corresponding pole figures for the retained β phase in the samples after deformation at (a) 2 s−1, (b) 0.2 s−1, and (c) 0.02 s−1. The scanning step size is 0.3 μm. The compression axis is vertical. Note that the coordinate system for the pole figures are indicated, where y denotes the compression direction, x and z are the radial direction of the deformed samples.
Metals 08 00605 g002
Figure 3. Local inverse pole figure map for the β phase after deformation at 2 s−1, by using a step size of 0.15 μm. Some grain boundaries are outlined by solid lines to show the dynamic recrystallized (DRXed) grains, and the corresponding grain boundary misorientations are also indicated. For the micrograph, the compression direction is vertical. {100} pole figures for three local regions are presented to show the rotation tendency of local orientations. Note that the coordinate system for the pole figures are indicated, where y denotes the compression direction, x and z are the radial direction of the deformed samples.
Metals 08 00605 g003
Figure 4. Local inverse pole figure map for the β phase after deformation at 0.02 s−1, by using a step size of 0.3 μm. Some grain boundaries are outlined by solid lines to show the DRXed grains, and the corresponding grain boundary misorientations are also indicated. For the micrograph, the compression direction is vertical. {100} pole figures are presented to show the crystallographic relationship of neighboring grains, where y denotes the compression direction, x and z are the radial direction of the deformed samples.
Metals 08 00605 g004
Figure 5. Local pole figure map and the corresponding pole figures in a β grain interior of the sample deformed at 0.2 s−1. The compression direction is vertical. All twelve variants are labeled. Note that the Burgers orientation is evident by comparison of the pole figures.
Metals 08 00605 g005
Figure 6. Inverse pole figure maps for the transformed α phase in the samples after deformation at (a) 2 s−1, (b) 0.2 s−1, and (c) 0.02 s−1. These maps are corresponding to those in Figure 2. The compression direction is vertical.
Metals 08 00605 g006
Figure 7. Local inverse pole figure map shows a group of Widmanstatten colonies in the sample deformed at 0.2 s−1. The compression direction is vertical. The prior grain boundaries are outlined on the map. The {00.1} and <11.0>pole figures are superimposing one the corresponding {110} and <111> pole figures, respectively. The coincident poles which manifest the strict Burger orientation relationship (BOR) are indicated by colored boxes.
Metals 08 00605 g007
Figure 8. Pole figures for α phase in the present alloy after deformation at (a) 2 s−1, (b) 0.2 s−1 and (c) 0.02 s−1.Note that the coordinate system for the pole figures are indicated, where y denotes the compression direction, x and z are the radial direction of the deformed samples.
Metals 08 00605 g008
Figure 9. Simulation resulted for the transformation texture based on the parent β texture shown in Figure 2, under the assumption that all the twelve α variants occur with the same probability. (a) 2 s−1, (b) 0.02 s−1.
Metals 08 00605 g009

