Article

Formation of SUS304/Aluminum Alloys Using Wire and Arc Additive Manufacturing

1
School of Materials Science and Engineering, Tianjin University, Tianjin 300350, China
2
Tianjin Key Laboratory of Advanced Joining Technology, Tianjin University, Tianjin 300350, China
*
Author to whom correspondence should be addressed.
Metals 2018, 8(8), 595; https://doi.org/10.3390/met8080595
Submission received: 2 July 2018 / Revised: 24 July 2018 / Accepted: 26 July 2018 / Published: 30 July 2018
(This article belongs to the Special Issue Additive Layer Manufacturing using Metal Deposition)

Abstract

:
In this study, wire and arc additive manufacturing (WAAM) was used to form SUS304/aluminum alloys. The buildup wall was well shaped using a pulse current consisting of a base current of 150 A and peak current of 200 A and a 0.2 m/min travel speed. Metallographic observation revealed that the original grains were columnar grains and transformed into equiaxed grains in the top area. The increased content of alloying elements in the fused layer improved the hardness of the buildup wall. The buildup wall formed using pulsed current exhibited improved anti-electrochemical corrosion performance when compared with that formed using constant current. The tensile strength of the alloy decreased but its elongation increased compared with those of Fe-Al alloys. The tensile fracture along the fusing direction was plastic fracture. However, the tensile fracture perpendicular to the fusing direction consisted of a combination of plastic and brittle fracture.

1. Introduction

Fe-Al alloy has been researched since the early 20th century due to the excellent oxidation and sulfidation resistance, high temperature strength, and creep resistance [1]. These excellent properties make some materials, which require thermal and corrosion resistance, could be replaced by Fe-Al alloy [2].
In recent years, as a new manufacturing method, additive manufacturing (AM) has been applied in many industries because of its excellent advantages, such as high efficiency, simple equipment, low cost, and convenient design [3]. Over the past 15 years, there has been a sharp increase in the demand for AM technology to make complex parts [4]. To date, additive manufacturing is used to make a variety of metals, such as aluminium alloy [5], titanium alloy [6], and steel [7]. For metal additive manufacturing, it can be classified according to the kind of raw materials. They are generally powder based process, such as laser additive manufacturing (LAM) [8] and selective laser melting (SLM) [9]; or, wire based process, such as wire and arc additive manufacturing [10]. Although powder based process has high manufacturing precision, pores are produced in the manufacturing process and high cost [11,12,13], whose defect must be avoided in Fe-Al alloy. On the contrary, the completely dense materials could be manufactured by wire and arc additive manufacturing (WAAM) using appropriate parameters. In addition, with the same composition, the wire is cheaper than powder.
The WAAM process usually uses single feed wire and produces a deposited structure of the same composition as the wire. Recently, the WAAM using gas tungsten arc welding (GTAW) process has been used to manufacturing binary phase intermetallic materials, such as gamma titanium aluminide [14] and Fe3Al based iron aluminide [15]. Chen et al. [15] completed the preparation of Fe-Al alloy by WAAM process, and made an in-depth study of its microstructure, chemical composition, and mechanical properties. However, the elongation of the formed material is only 3.5%. Pan et al. [16] fabricated the Fe-Al functionally graded material while using WAAM with pour elongation of 2.35%.
But, when considering the brittle in room temperature of Fe-Al alloy [17], it is very difficult to manufacture this material, which has caused a sharp increase in the cost of manufacturing [18]. Studied are urgently needed to improve the room temperature ductility of the Fe-Al alloy in order to reduce manufacturing cost. To improve the room temperature ductility of Fe-Al alloy, some alloy elements are often added in the manufacturing process, such as boron [19], chromium [20], cerium [21], carbon, niobium, and titanium [22]. The principle that these alloy elements can improve the room temperature ductility is to enhance the grain boundary strength. In addition, the chromium can change the slip from coarse straight slip to a fine wavy slip. In this study, 304 stainless steel (SUS 304) wire and 4043 aluminum alloy (AA 4043) wire were fused together through WAAM to form a new Fe-Al alloy. The chromium in 403 stainless steel will enhance the grain boundary strength of the alloy, so as to enhance the room temperature ductility.
The main content of this study is the manufacturing of Fe-Al alloy by WAAM using SUS 304 wire and AA 4043 wire for reducing the room temperature brittleness. Meanwhile, the microstructure, micro hardness, tensile properties, and electrochemical corrosion resistance of Fe-Al alloy were further studied.

2. Experimental Section

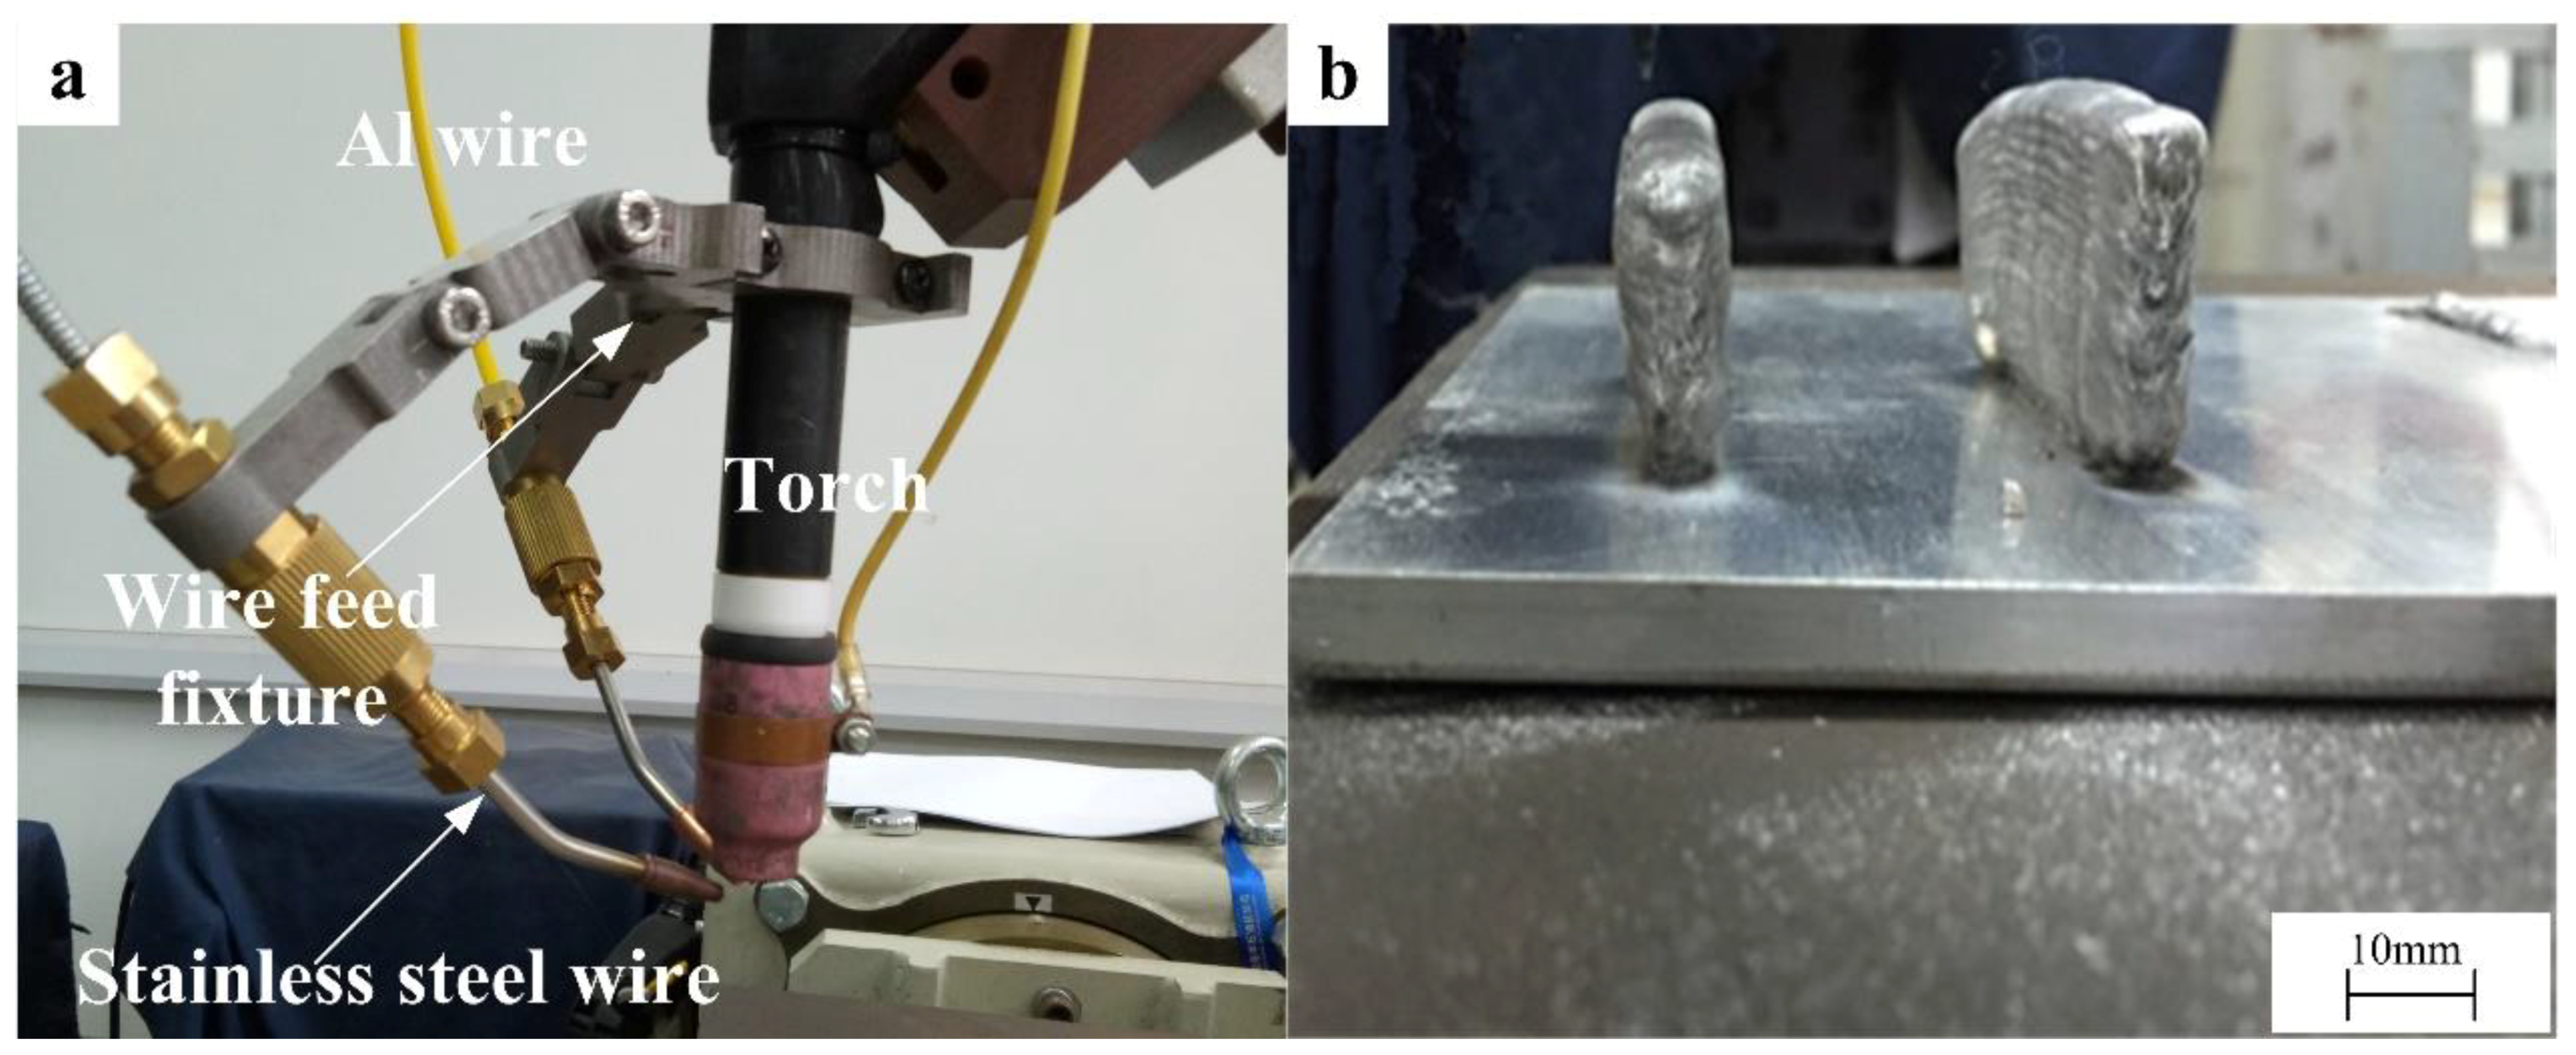
2.1. Materials and Fabrication Process

The robot system that was used during the experiments and a representative molded product are shown in Figure 1a. In order to meet the requirements, a new wire feed fixture adapted to the experimental conditions was designed. The robot system was a Panasonic YC—400TX industrial robots (Panasonic Corporation, Osaka, Japan) with a Panasonic TIG welder (Panasonic Corporation, Osaka, Japan). The tungsten pole with diameter of 4 mm was negative during the manufacturing process (DCSP). Two standard welding wires with diameters of 1.2 mm, 304 stainless steel, and 4043 aluminum alloy wire, were simultaneously fed into the welding pool. Low carbon steel (250 mm × 150 mm × 8 mm) was selected as the base metal because of its excellent welding performance, and the base metal was preheated to 300 °C before the start of the experiment to improve the wettability [23]. The chemical constituents of the three materials that were used in the experiment are listed in Table 1. Pure argon (99.99%) was used as the inert gas for the WAAM process and the gas flow was 20 L/min. Figure 1b shows the as-fabricated wall after completion of the entire welding process. The width and height of the wall with 10 layers were approximately 8 and 31 mm, respectively, with some substrate distortion being present. The heights of both ends were lower than that of the middle position. To overcome this issue, more precise control of the inter-layer temperature would be required.
The experimental parameters are listed in Table 2. Two currents were used in the experiment, a constant current (CC) of 150 A, and a 2 Hz pulse current (PC) with a base current of 150 A, and peak current of 200 A. The objective of these experiments was to explore the effect of the experimental parameters on the quality of the formation. The inter-layer temperature in the experiment was controlled at 400 °C by automatic temperature measuring device in order to prevent the generation of cold cracking. The FLIR T420 infrared thermal imager (FLIR Systems, Inc., Wilsonville, AL, USA) monitored the temperature of the deposited layer. When the temperature is below 400 °C, a subsequent deposit was made. This method has been shown to improve the room-temperature ductility of Fe3Al-based iron aluminides [16].

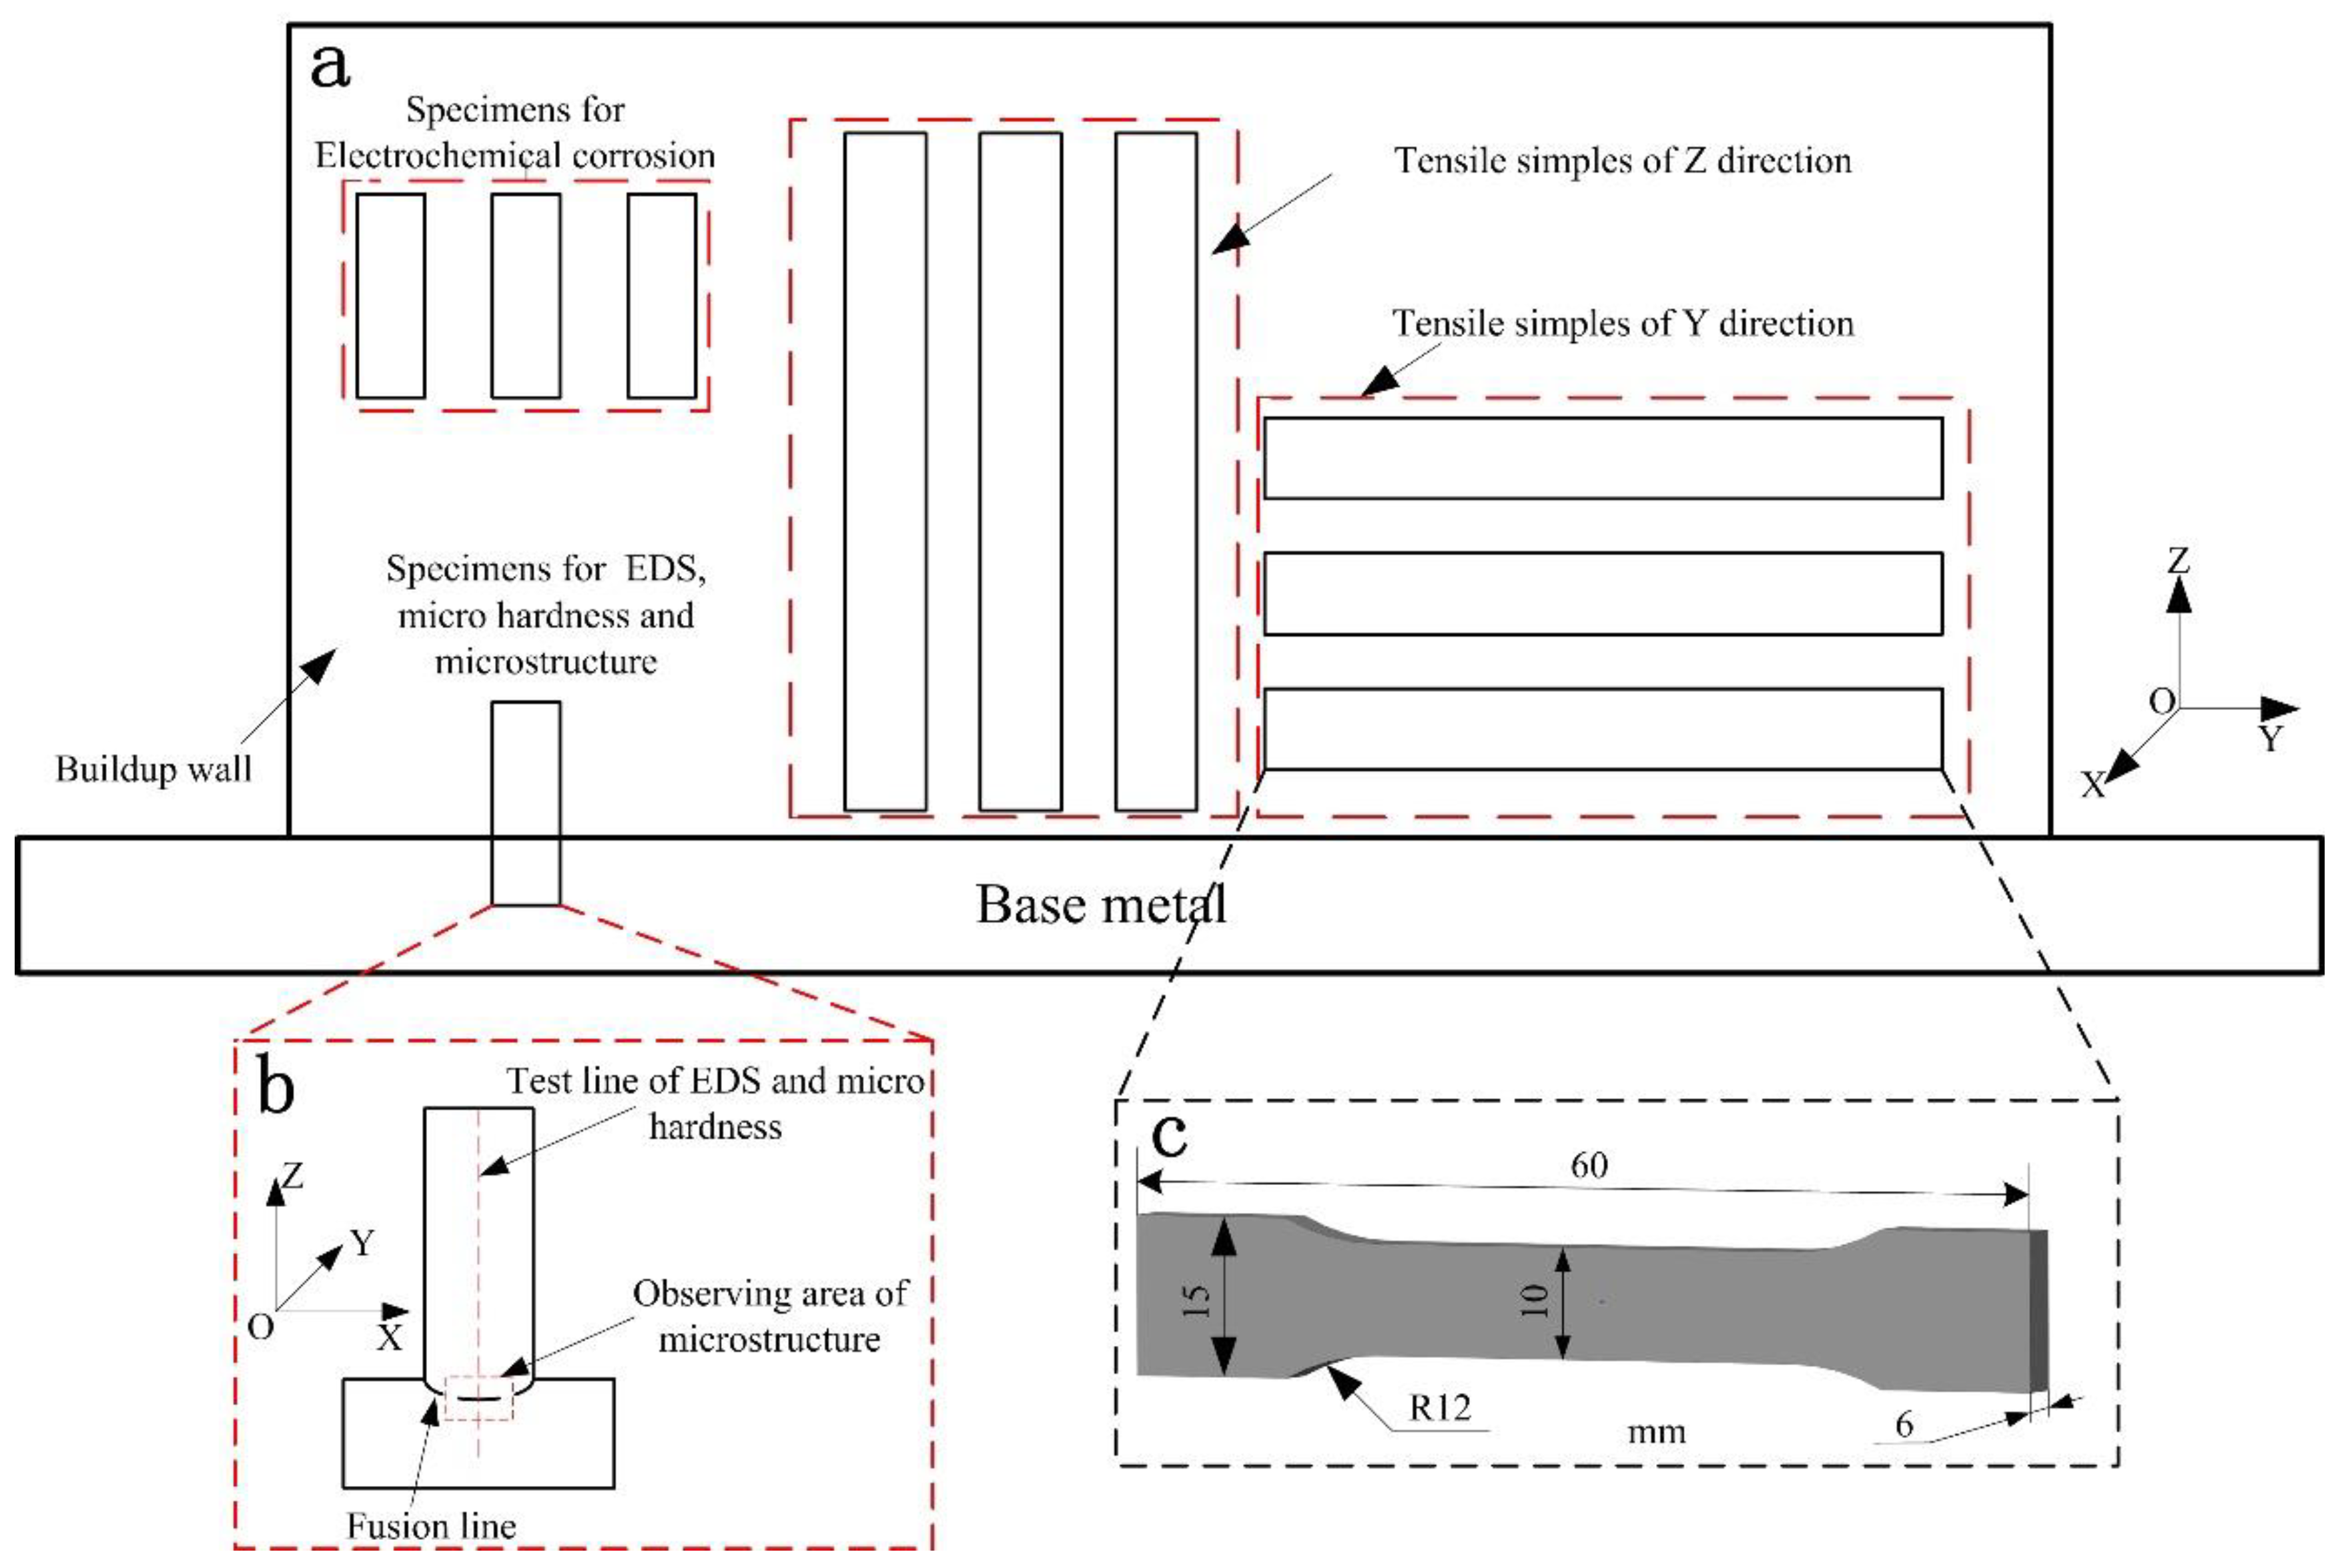
2.2. Material Characterization

The extraction locations for various material samples are shown in Figure 2a. The metallographic specimens were prepared using wire cutting and then sanded using sandpaper from 400# to 2000#. For the etchant, 50% aqua regia was used because of the excellent corrosion resistance of the alloy, and the etching time was approximately 5 s. The microstructure was examined using the Olympus optical microscope (Olympus, Tokyo, Japan), and the macro chart of the fused layer was obtained using a stereoscopic microscope VHX-5000 (Keyence, Osaka, Japan). The grain size was measured according to the ASTM E112-10 standard to show the effect of grain size on properties. Vickers micro hardness measurements were performed across the fusion line using a MHV-10Z hardness tester (Changzhou Sanfeng Instrument Technology Co., Ltd., Changzhou, China) at a load of 300 N and 0.2 mm intervals while using a 15s hold time. The element distribution across the fusion line was measured using scanning electron microscopy SEM Hitachi SU1510 (Hitachi, Tokyo, Japan) coupled with energy-dispersive X-ray spectrometry (EDAX Inc., Draper, UT, USA). Specific detection location of hardness, EDS and microstructure are shown in Figure 2b.
A cross section of the XOZ plane was examined to determine the electrochemical corrosion with area of 1 cm2. The electrochemical corrosion property was studied using LK3200A electrochemical detection system (Lanlike Chemical Electronic High-Tech Co. Ltd., Tianjin, China). The test was conducted in 3.5 wt% NaCl solution at room temperature. To stabilize the potential, the test was started after the specimen was soaked in the 3.5 wt% NaCl solution for about 10 min. The scanned area of the potential was from −1.0 V to 1.0 V, and the scanning speed was 0.01 V/s.
The tensile simple size is shown Figure 2c, according to ASTM E8. The tensile tests were conducted thrice at each parameter before taking the average value as the final test magnitude. Scanning electron microscope was used to observe the micro-morphology of impact fractures after tensile test.

3. Results and Discussion

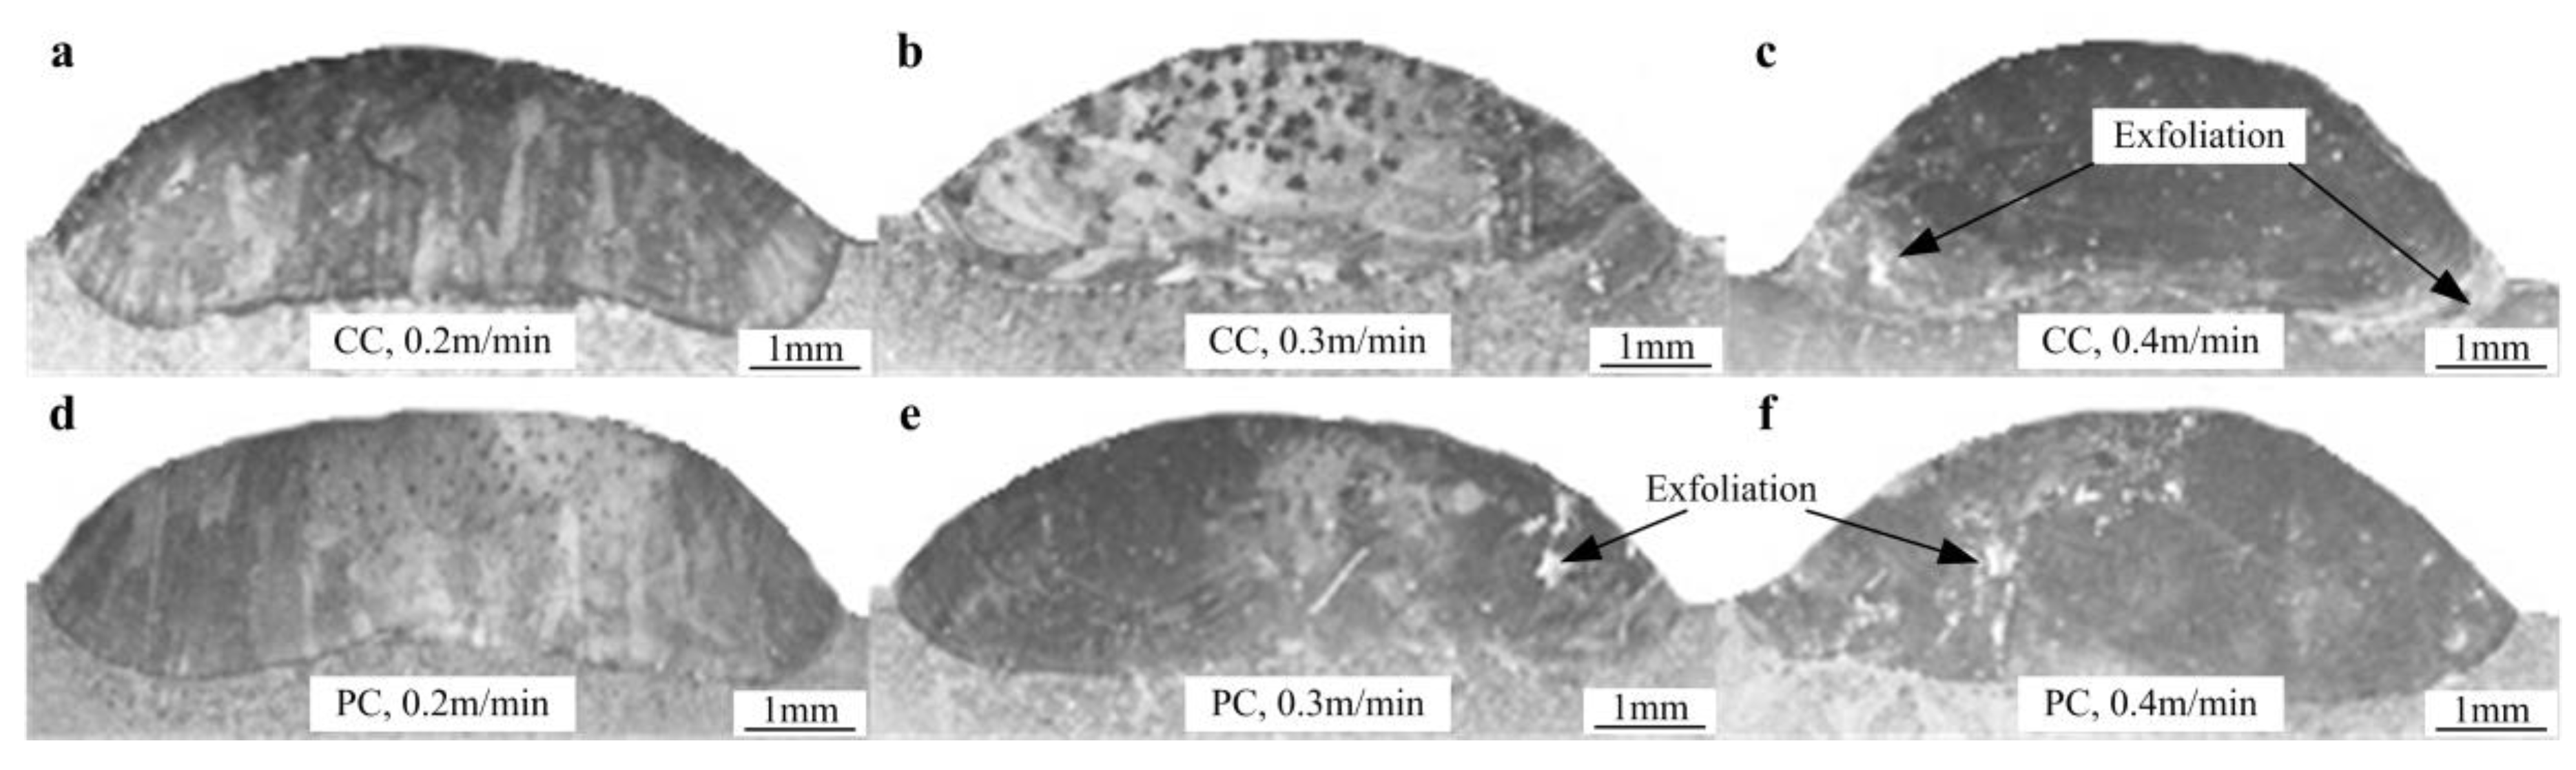
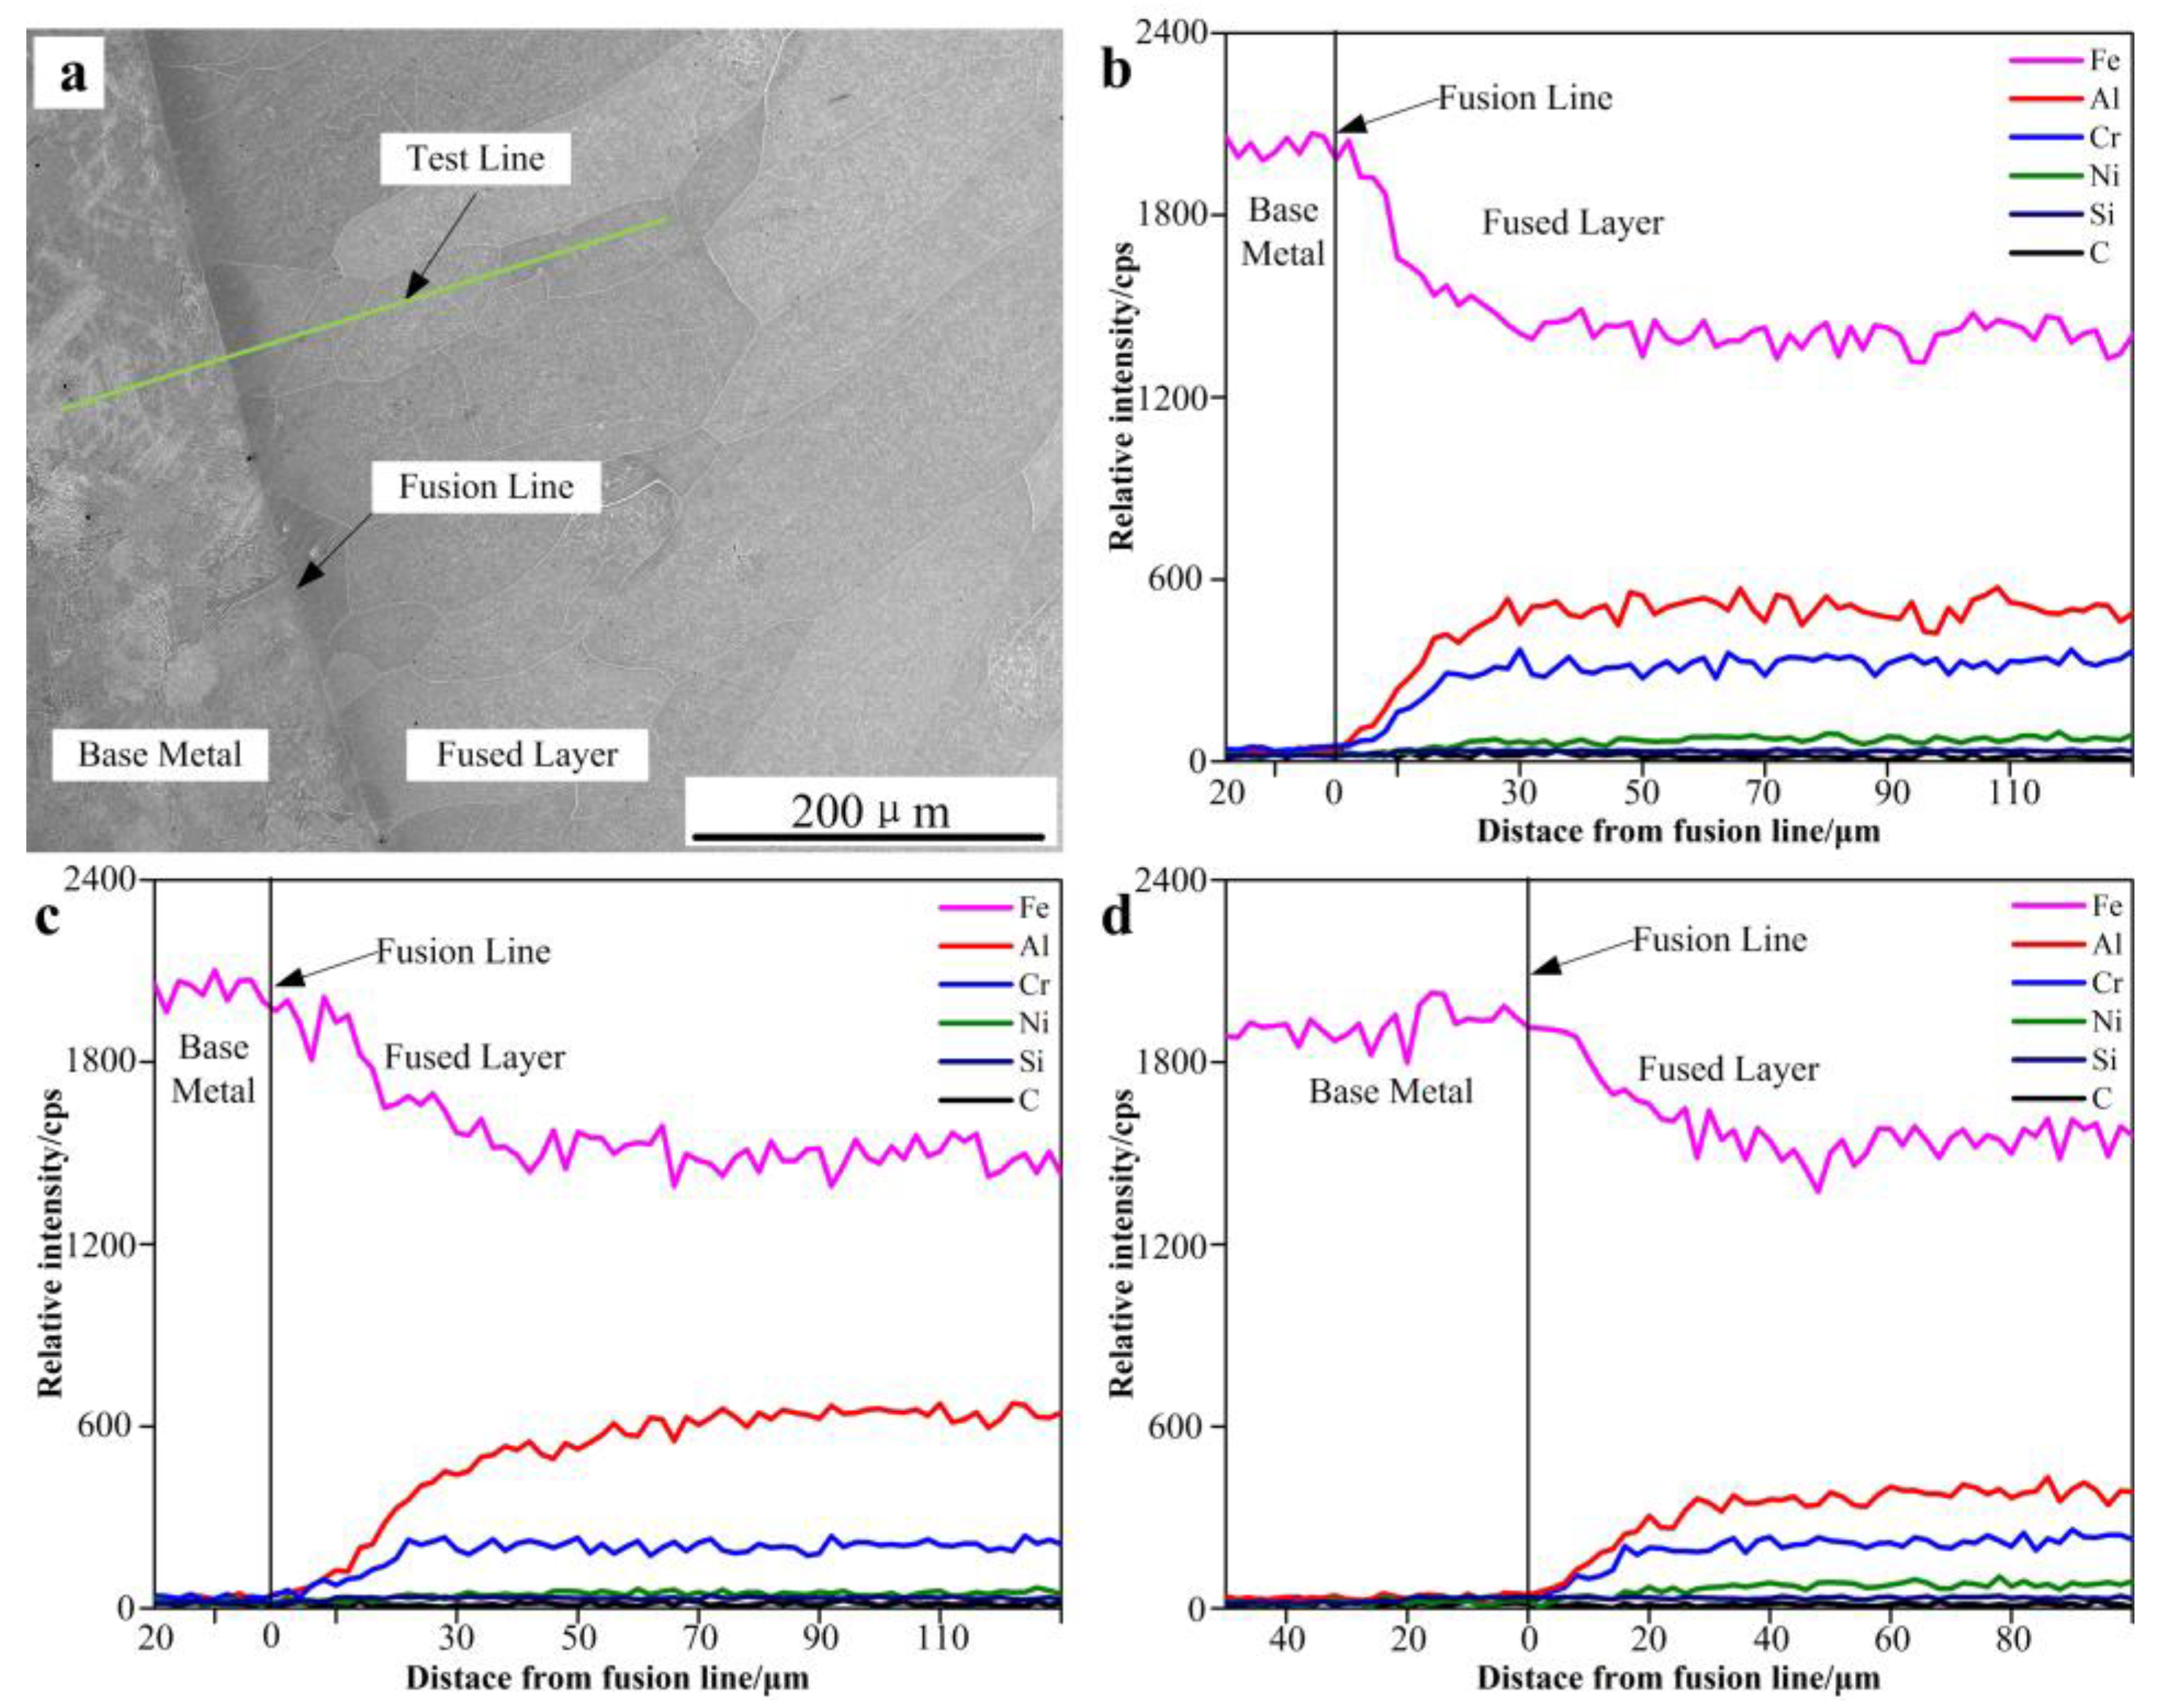
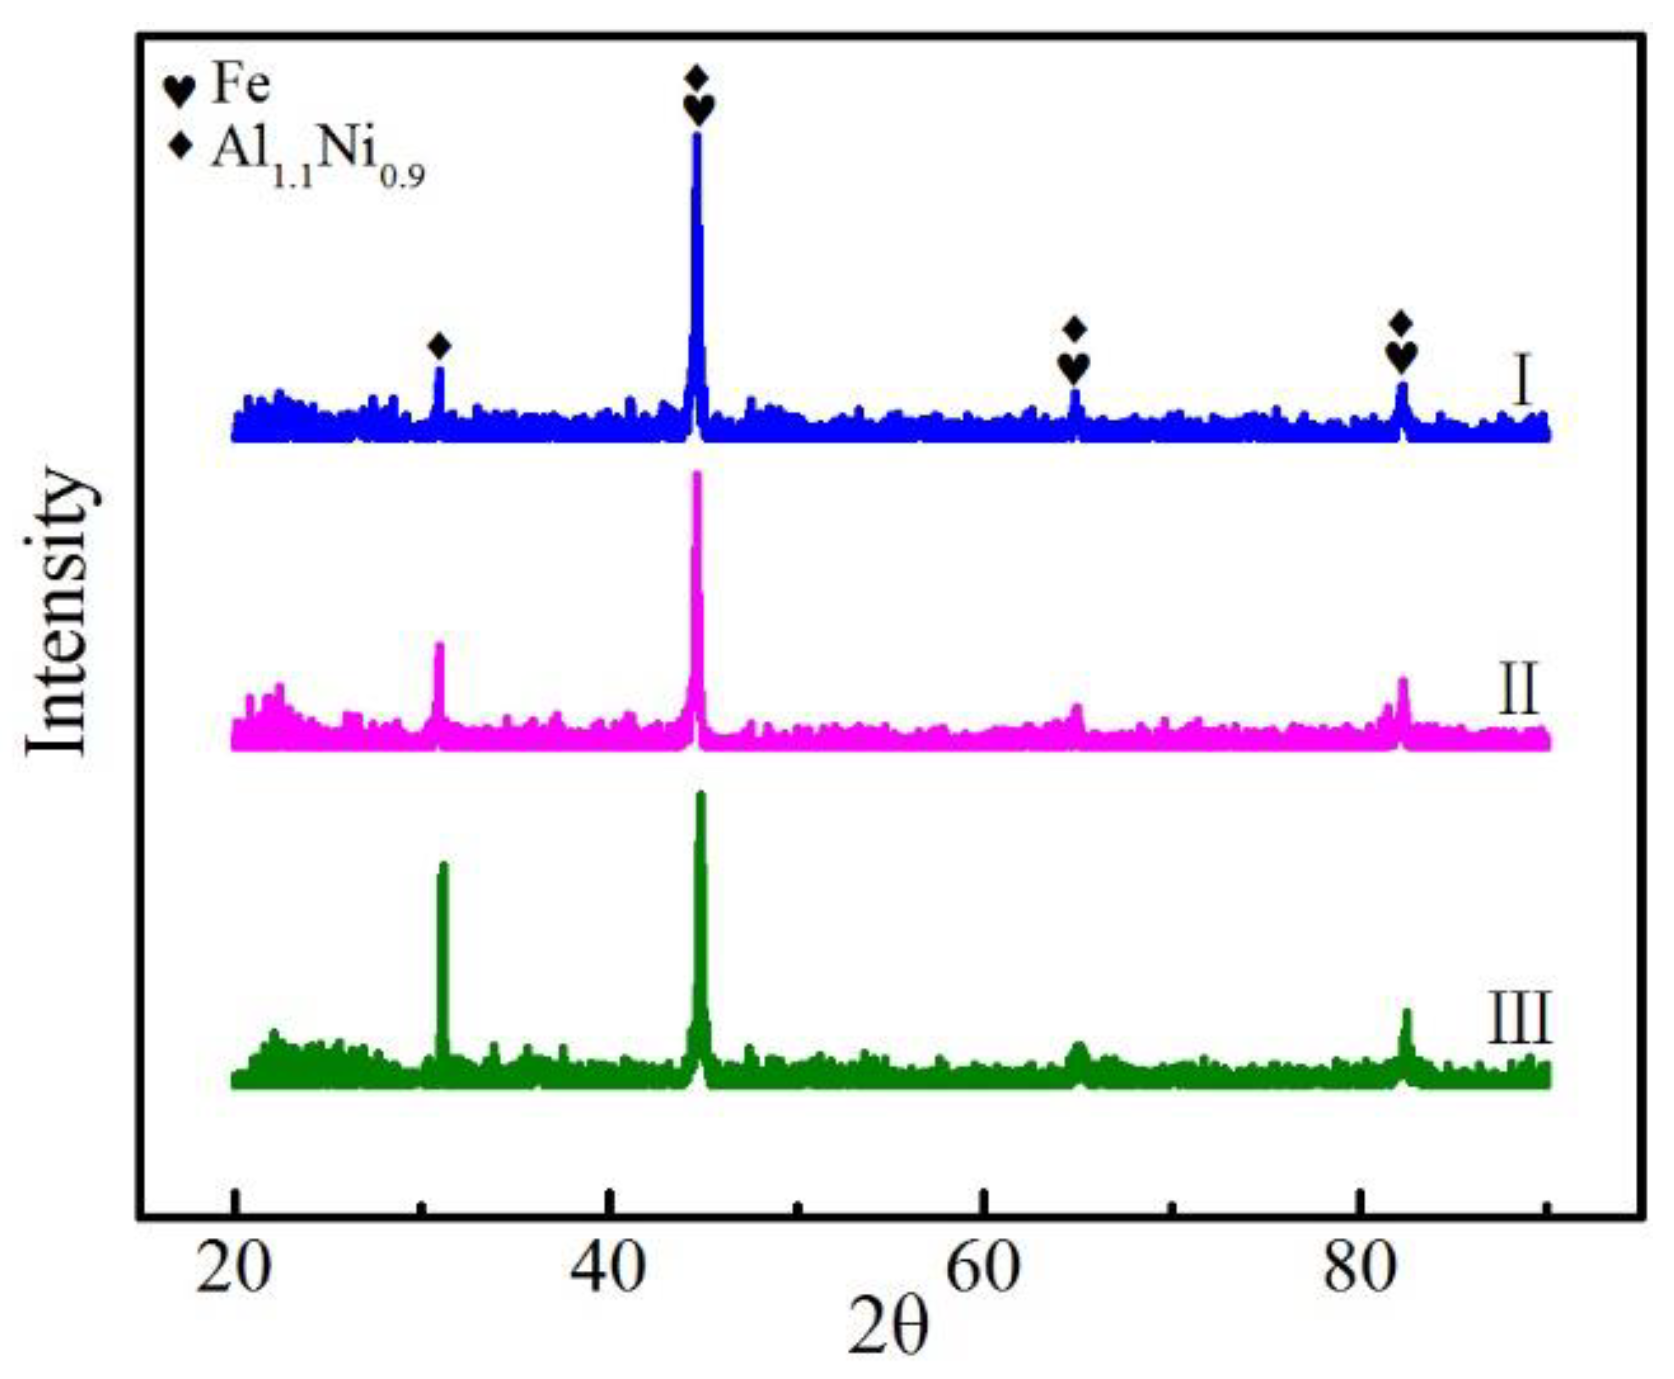
3.1. Quality of Fabrication and Phase Characterization
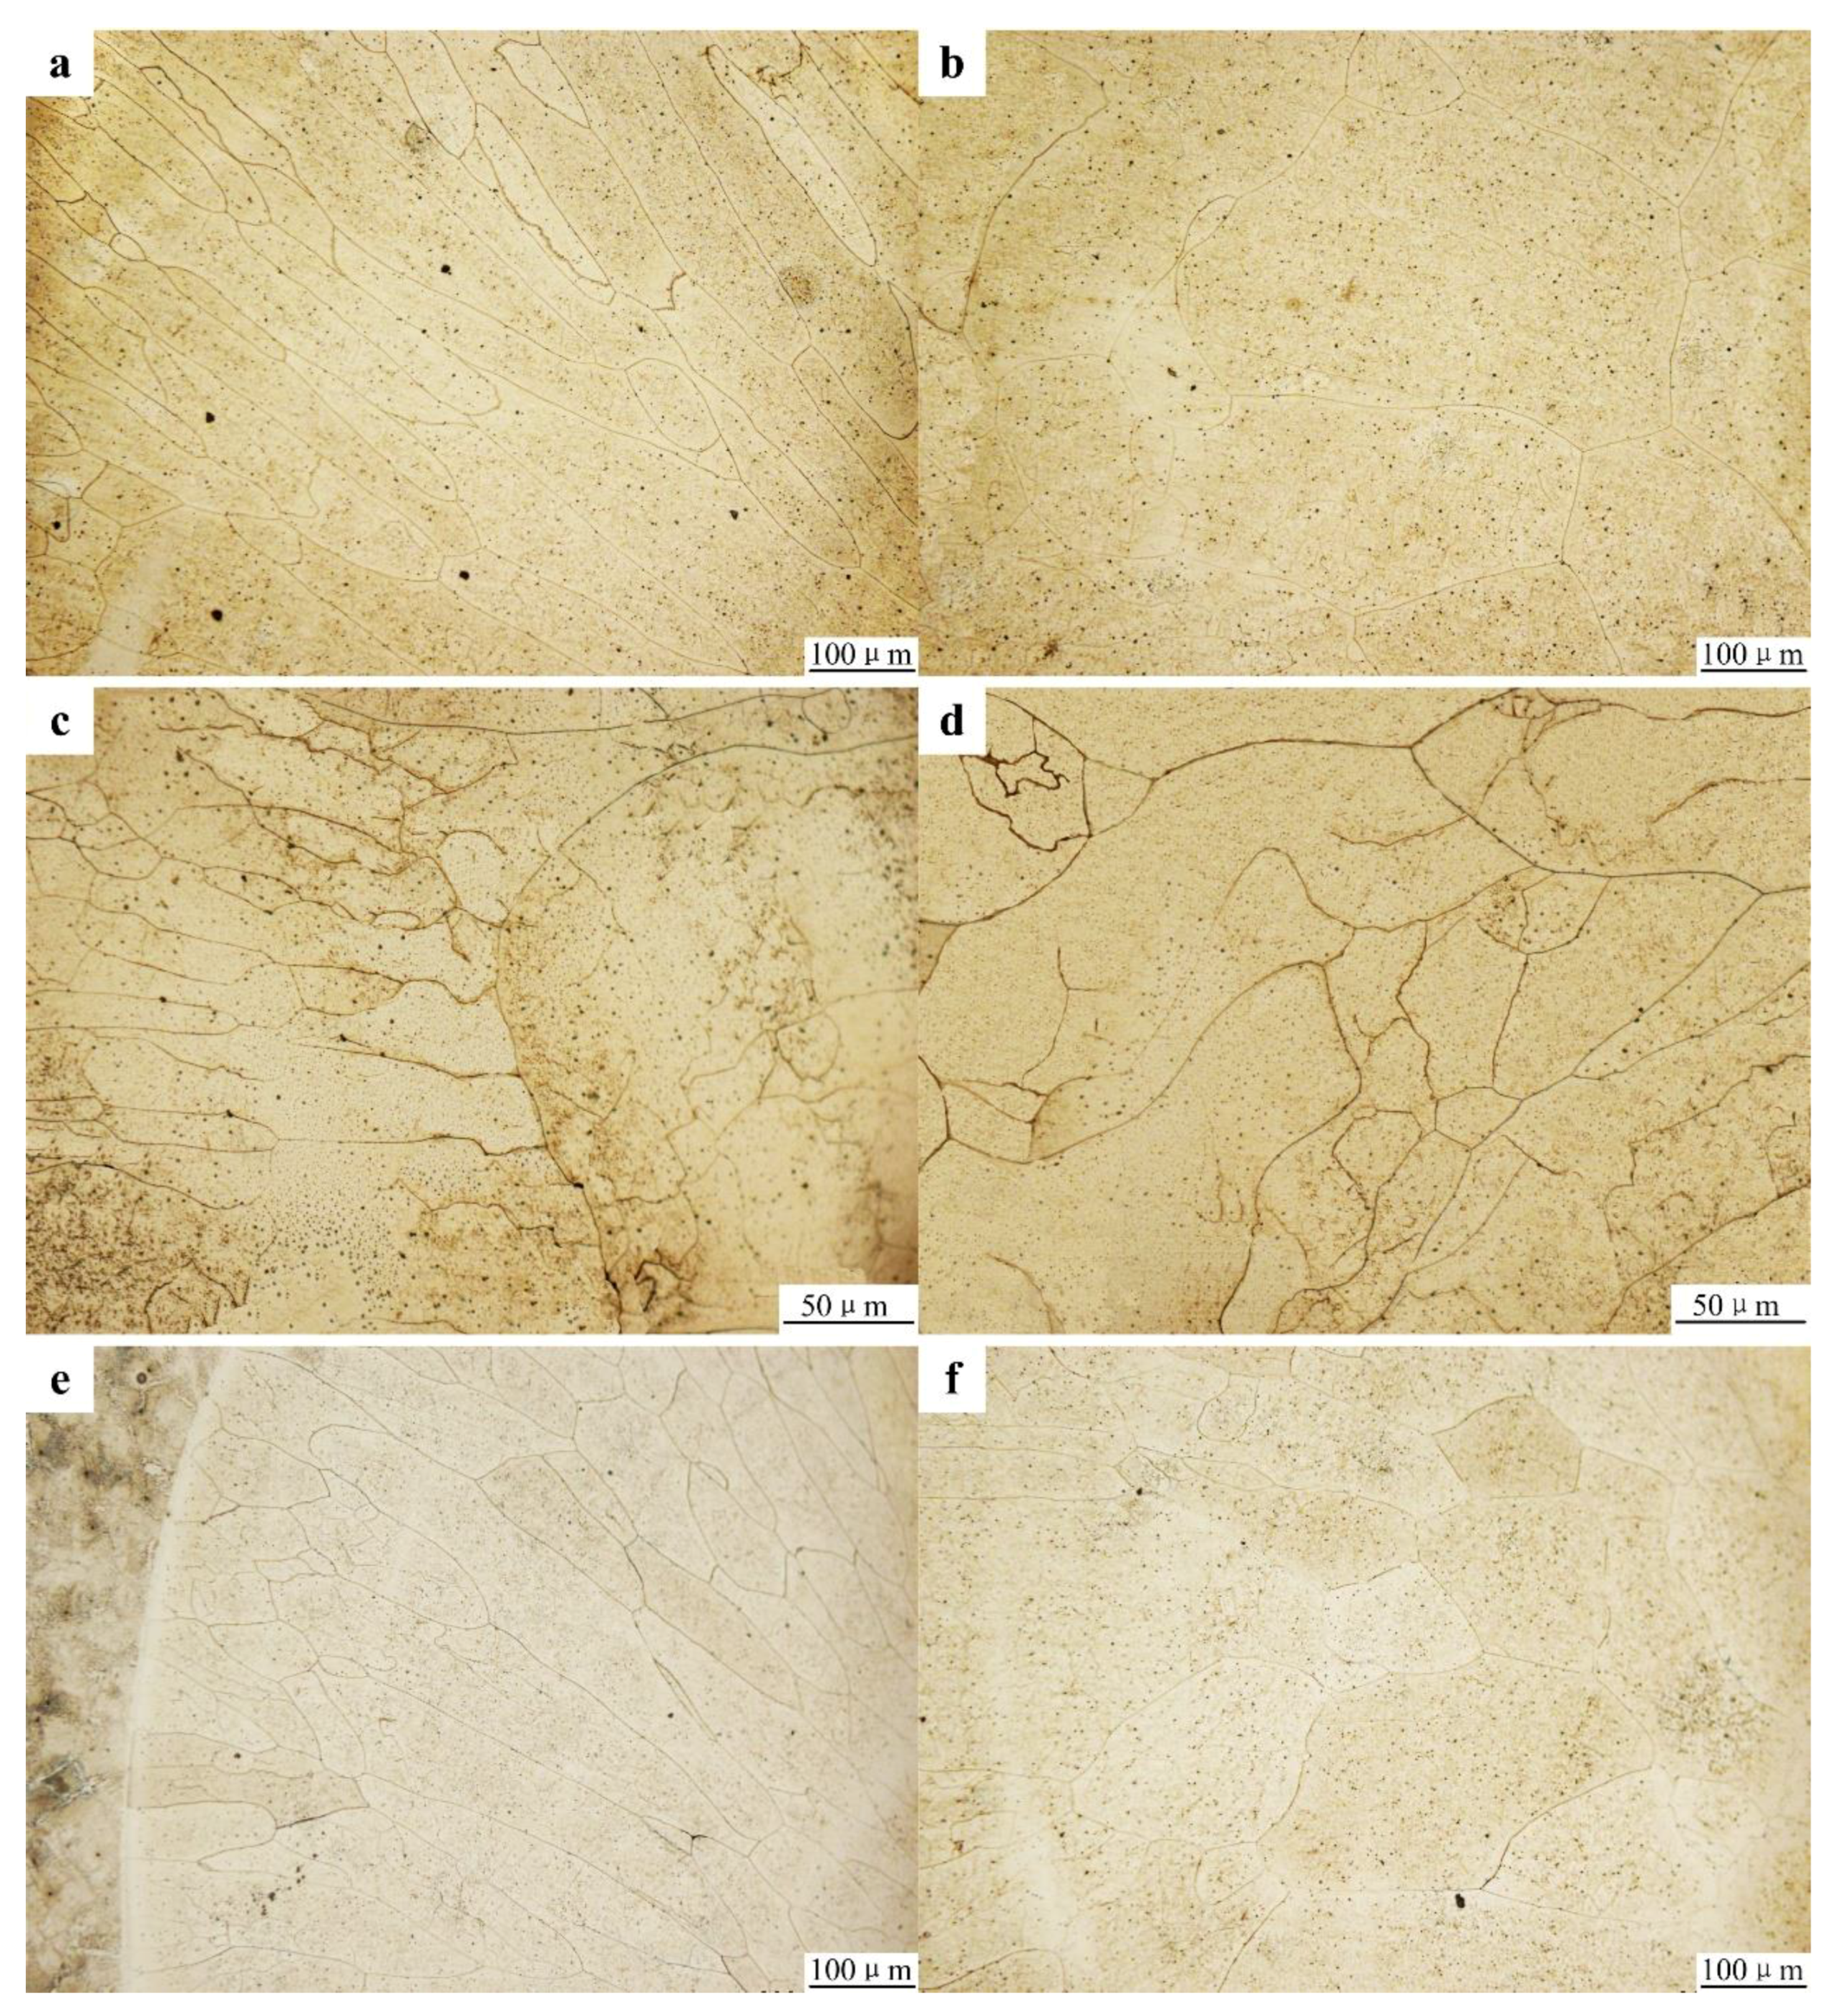
A macro chart of a several weld cross-section for all the welding parameters is presented in Figure 3. Metallic exfoliation was observed in Figure 3c,e,f, and the area of exfoliation increasing with increasing travel speed. Especially near the fusion line, the difference between the base metal and cladding layer compositions results in a high stress concentration. Therefore, metal exfoliation was mainly detected near the fusion line. This finding is most likely related to the compositional changes that are near the fused line. In Figure 4, the elemental contents changed faster with increasing travel speed near the fused line. Therefore, the composition changed substantially near the fused line, and the internal stress correspondingly increased. A slower travel speed results in a slower cooling rate, which most likely reduces the stress in the material. Therefore, with increasing travel speed, the area of exfoliation increased, and exfoliation was even observed in areas that are away from the fused line (Figure 3f). Considering the existence of exfoliation under several parameters, the remaining parameters are used in subsequent experiments of CC 0.2 m/min, CC 0.3 m/min, and PC 0.2 m/min. In the following paper, CC 0.2 m/min, CC 0.3 m/min, and PC 0.2 m/min are, respectively, represented by I, II, and III.
The EDS results obtained are presented in Figure 4. For all of the specimens, the left side of the fusion line was the base metal, and the right side of the fusion line was the fused layer. The content of all the elements changed across the fusion line. The relative Fe content was reduced upon crossing the fusion line from the base metal to the fused layer. On the contrary, the relative Al, Cr, and Ni contents increased upon crossing the fusion line from the base metal to the fused layer. The relative C content negligibly changed upon crossing the fusion line, and the C content was very low.
The C content of low carbon steel (~0.2%) and 304 stainless steel is lower than the content of the other elements, which explains the low C content in all of the specimens. Al, Cr, and Ni were only present in two types of wire. Therefore, the Al, Cr, and Ni contents were low in the base metal. Additionally, in the fused layer, with increasing distance from the fusion line, the content of these three elements first increased and then tended to remain constant. The Fe content is lower in 304 stainless steel than in low carbon steel. Therefore, the Fe content decreases upon crossing the fusion line from the base metal into the fused layer. The specific content of all elements is shown in Table 3.
XRD detection is used to study the phases that appear in the manufacturing process and the results are shown in Figure 5. The main phases is the intermetallic compound Al1.1Ni0.9. The positions of the peaks in the XRD results of all samples are the same. This indicates that with the different parameters, the types of phase in the deposit have not changed.

3.2. Microstructure

The microstructures of the specimens are shown in Figure 6. Near the substrate, the growth of columnar grains along the direction perpendicular to the substrate was observed because of the maximum temperature gradient, as shown in the Figure 6a,c,e. As observed in the Figure 4b,d,f, the grains were transformed into equiaxed grains in the top regions. In the area near the fusion line, the temperature gradient along the Z direction was maximum; therefore, the driving force for the growth of columnar grains was the maximum along the Z direction. On the top of the cladding layer, the temperature gradients in each direction were similar, and equiaxed grains thus began to form.
The sizes of the columnar and equiaxed grains are listed in Table 4, and for the columnar, the largest size of single grain was measured. The difference in grain size between first and subsequent layers was assumed to be small enough to be neglected, thus allowing for considering them as a valuable factor to explain variations in mechanical resistance. Grain sizes decrease with increasing travel speed (I and II), which is related to less heat accumulation. The same area will produce less heat for a faster travel speed. For an identical travel speed, the size of two grains is larger when a constant current is applied (I and III), which is also related to the less heat input during welding. In pulsed welding, the peak current dwell time is shorter, and the cooling time will be shortened. Therefore, the nucleation of equiaxed grains began before the columnar grains grew too large. The size of the equiaxed grains also decreased because of the shorter cooling time. Grain refinement will have an impact on mechanical properties and relevant analysis is given below.

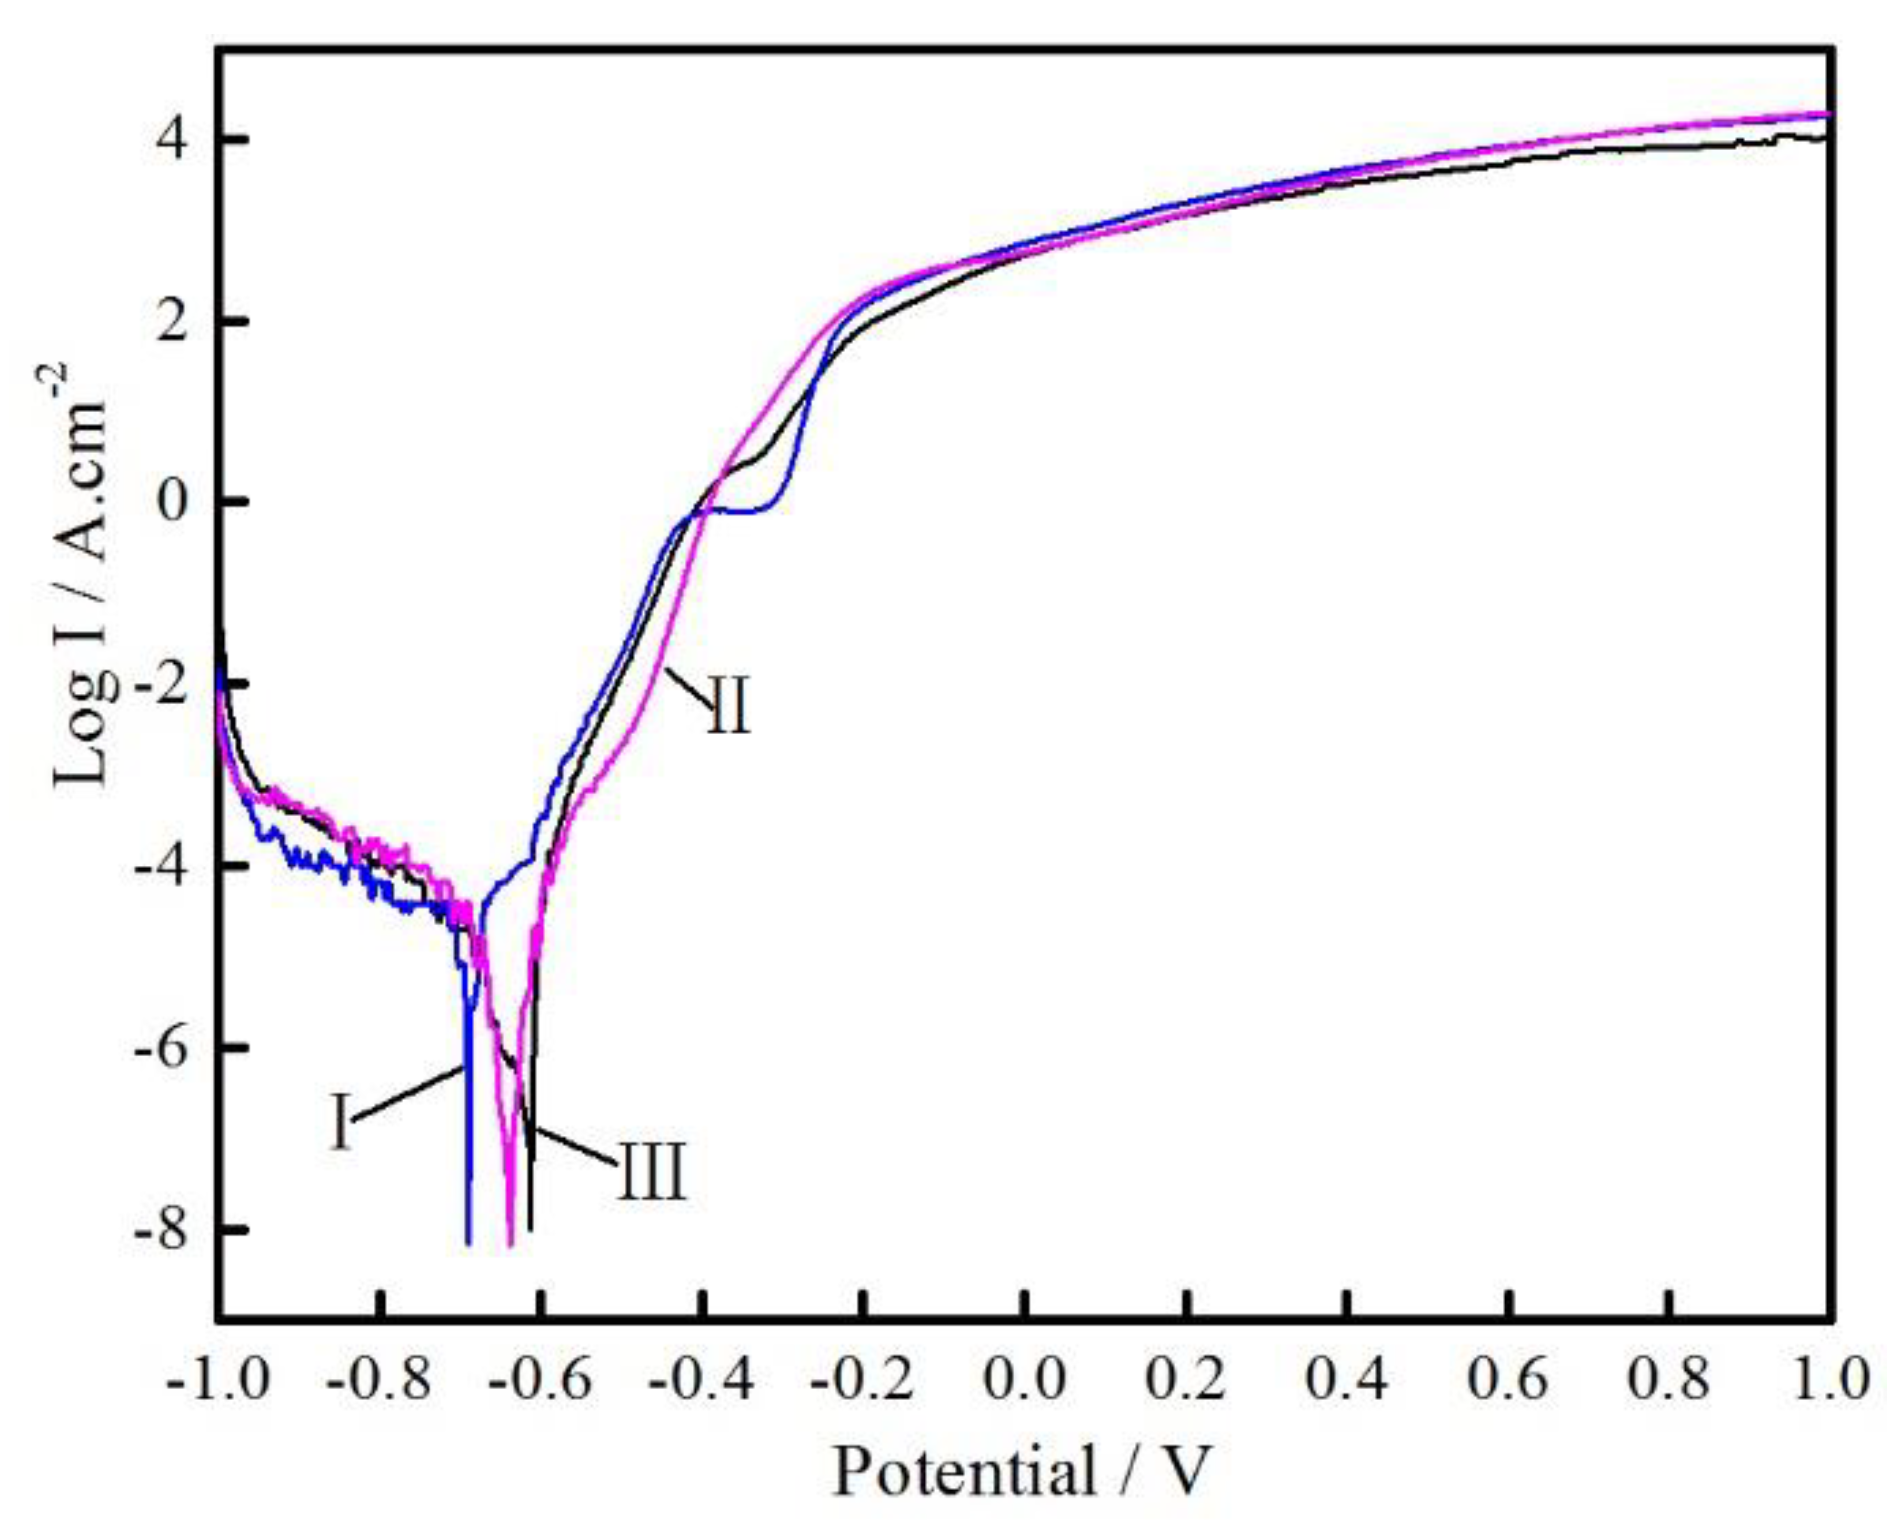
3.3. Electrochemical Corrosion
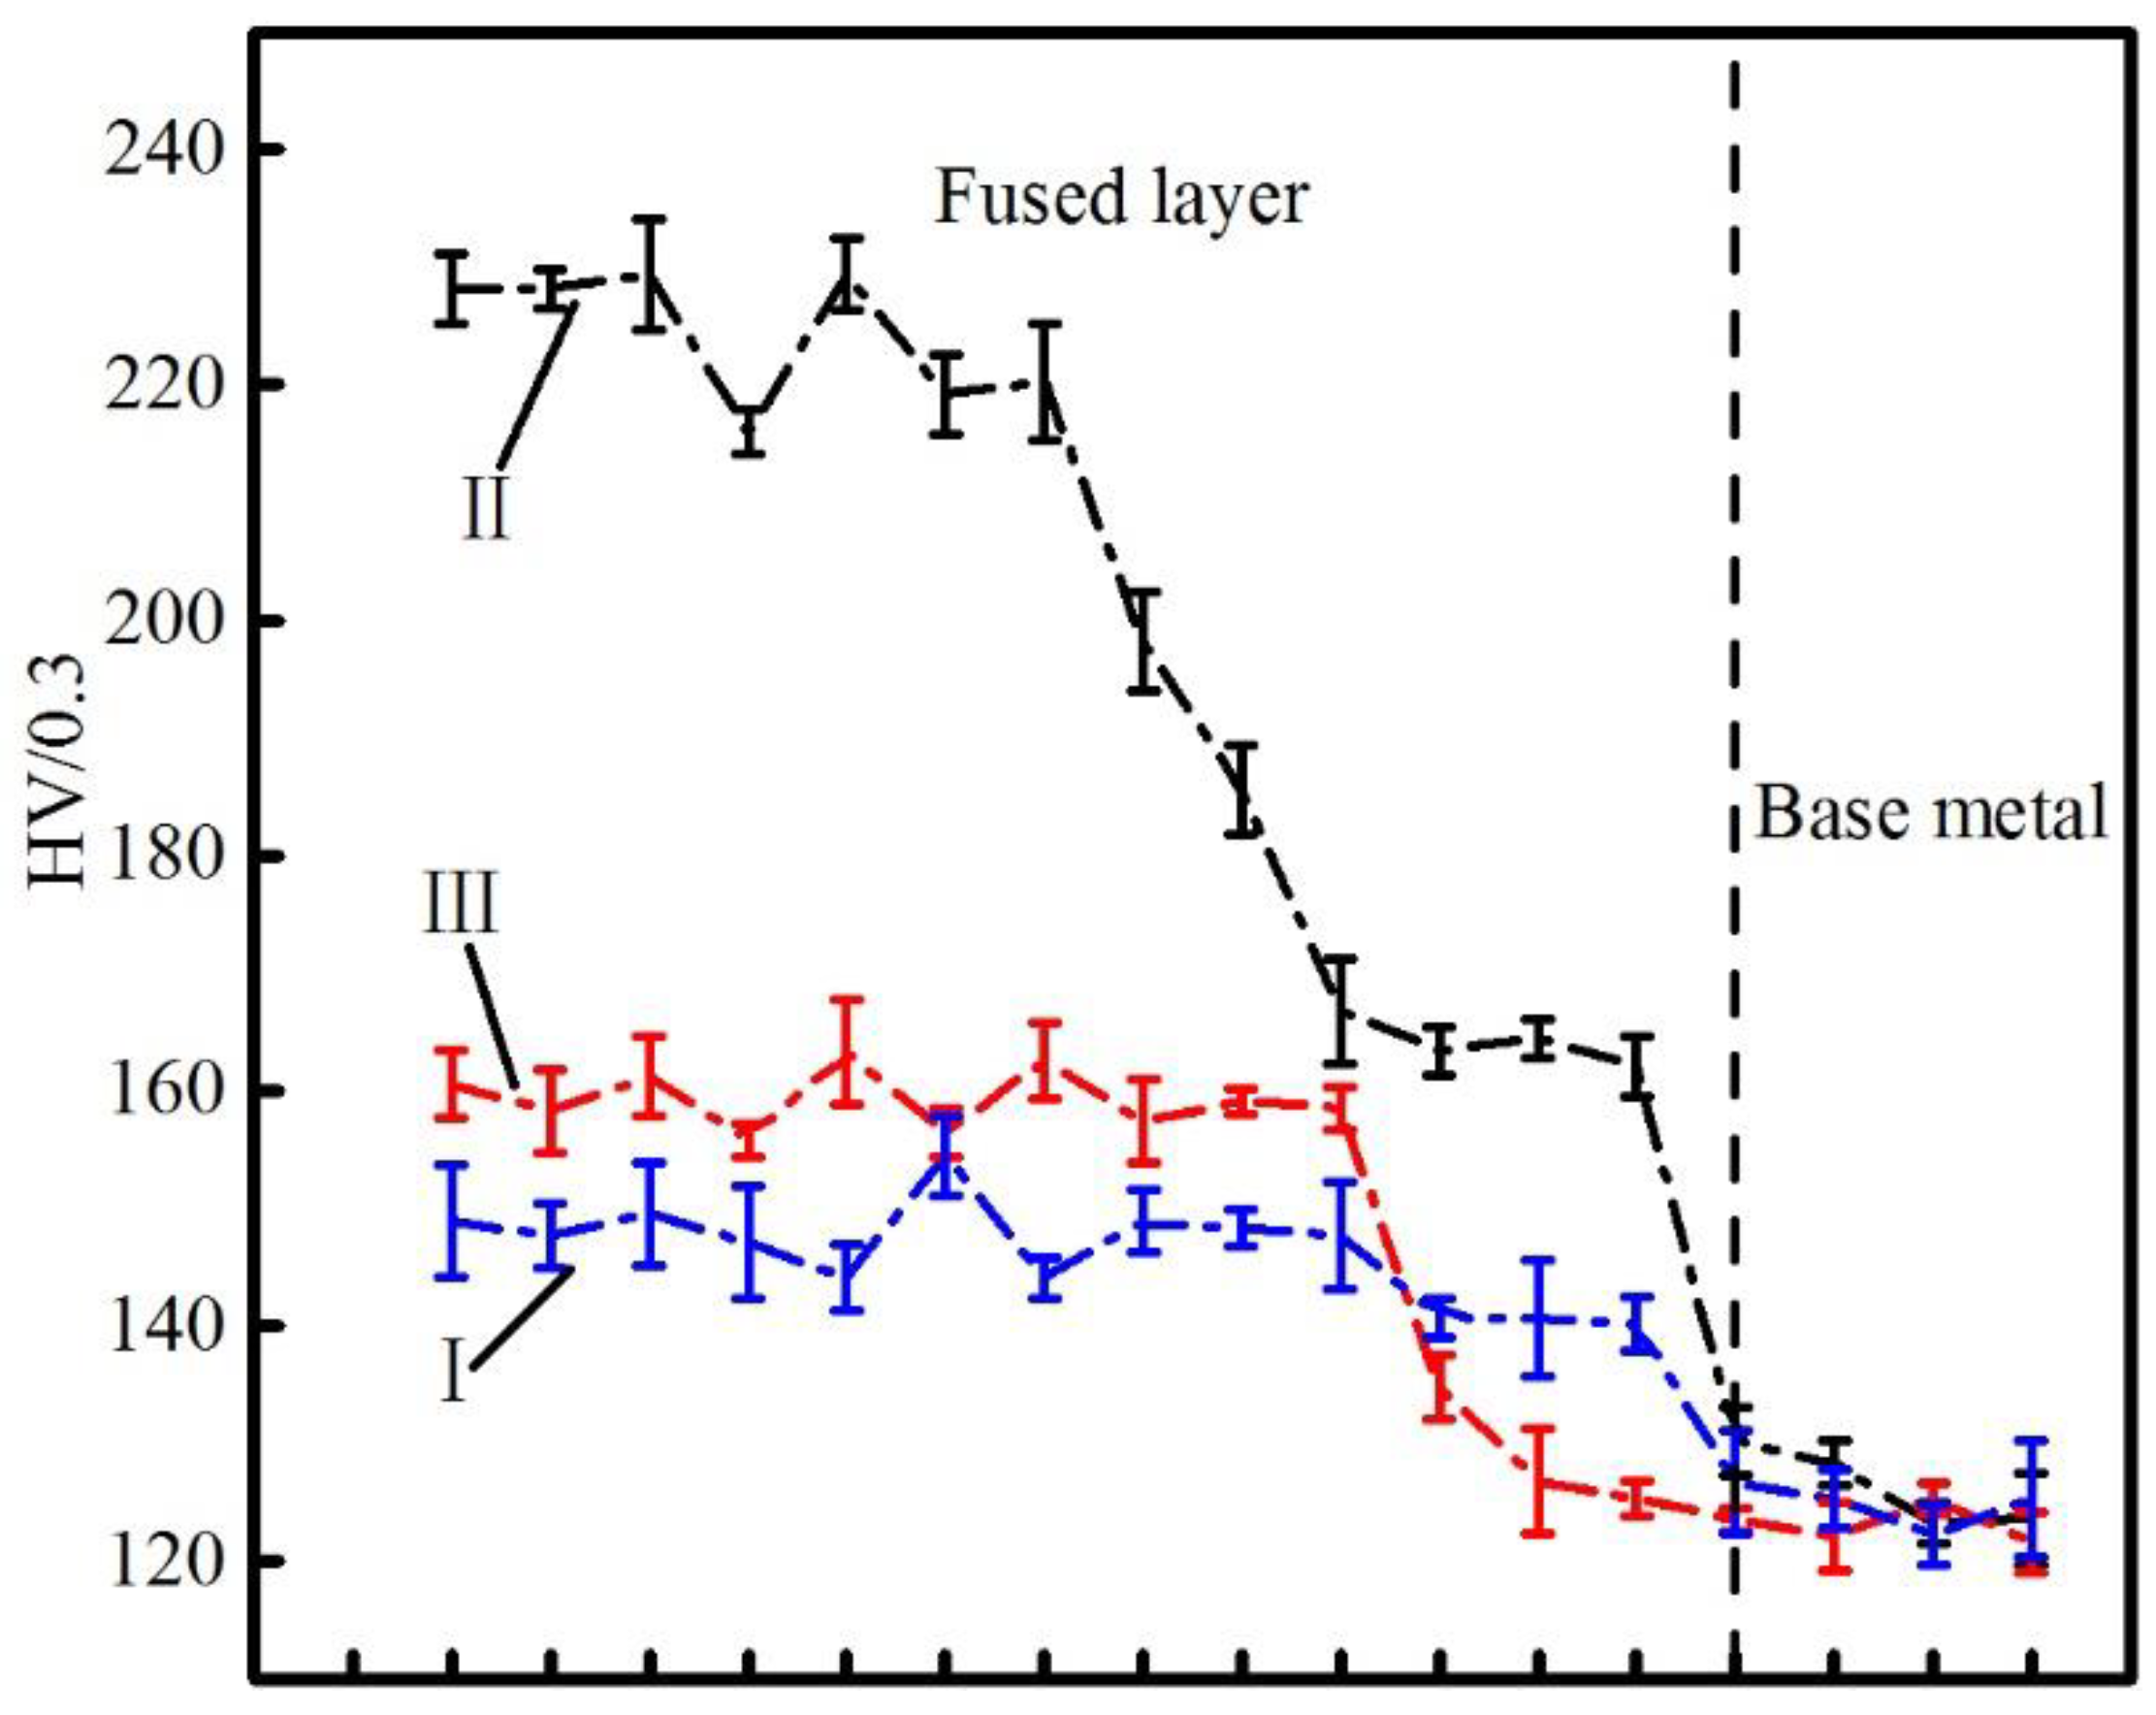
Polarization curves of the specimens are presented in Figure 7. The electrolyte solution for the electrochemical corrosion experiments was 3.5% NaCl solution. The type of current greatly affected the electrochemical corrosion of the fusion layer. The corrosion potential of the curve I and II was closer to the negative direction than curve III, which indicates that specimens prepared using a pulse current are less susceptible to corrosion than those that were prepared using a constant current [24]. In terms of corrosion current, the specimen prepared using a pulse current was smaller than that prepared using a constant current, indicating that the using of the pulse current resulted in a slower corrosion rate. This finding is related to the relative content of the alloying elements. The relative Ni and Cr contents were higher in the specimens that were fabricated using pulse current than constant current. Ni and Cr exhibit excellent electrochemical corrosion in the natural environment. Therefore, the improved electrochemical corrosion of the buildup wall fabricated using pulse current may be attributed to the high Ni and Cr contents. In summary, the molded products that were manufactured while using a pulse current exhibited improved resistance to electrochemical corrosion.

3.4. Micro Hardness

The hardness curves measured along the centerline of a single weld are presented in Figure 8. The direction of measurement was from the top of the cladding layer to the base material, and the distance between measurements was 0.2 mm. The hardness of the deposited layer was higher than that of the base metal. The increasing of the hardness values is related to the increasing alloying element contents. The relative Cr, Ni, and Al contents were greater in the cladding layer. It is related to the generation of phase, such as Al1.1Ni0.9. The dispersion of these phases in the material resulted in precipitation strengthening of the buildup wall. However, according to reports in the references [1] and [15,16], the main strengthening mode of this material is solid solution strengthening, mainly the entry of aluminum atoms into the crystal of iron. As a whole, the hardness of the three samples is II > III > I, which is related to the difference in grain size. As shown in Table 3, grain size in sample II is smallest in all three samples. The smaller the grain size, the higher the mechanical properties of the material will be. Therefore, the hardness of sample II is the highest.

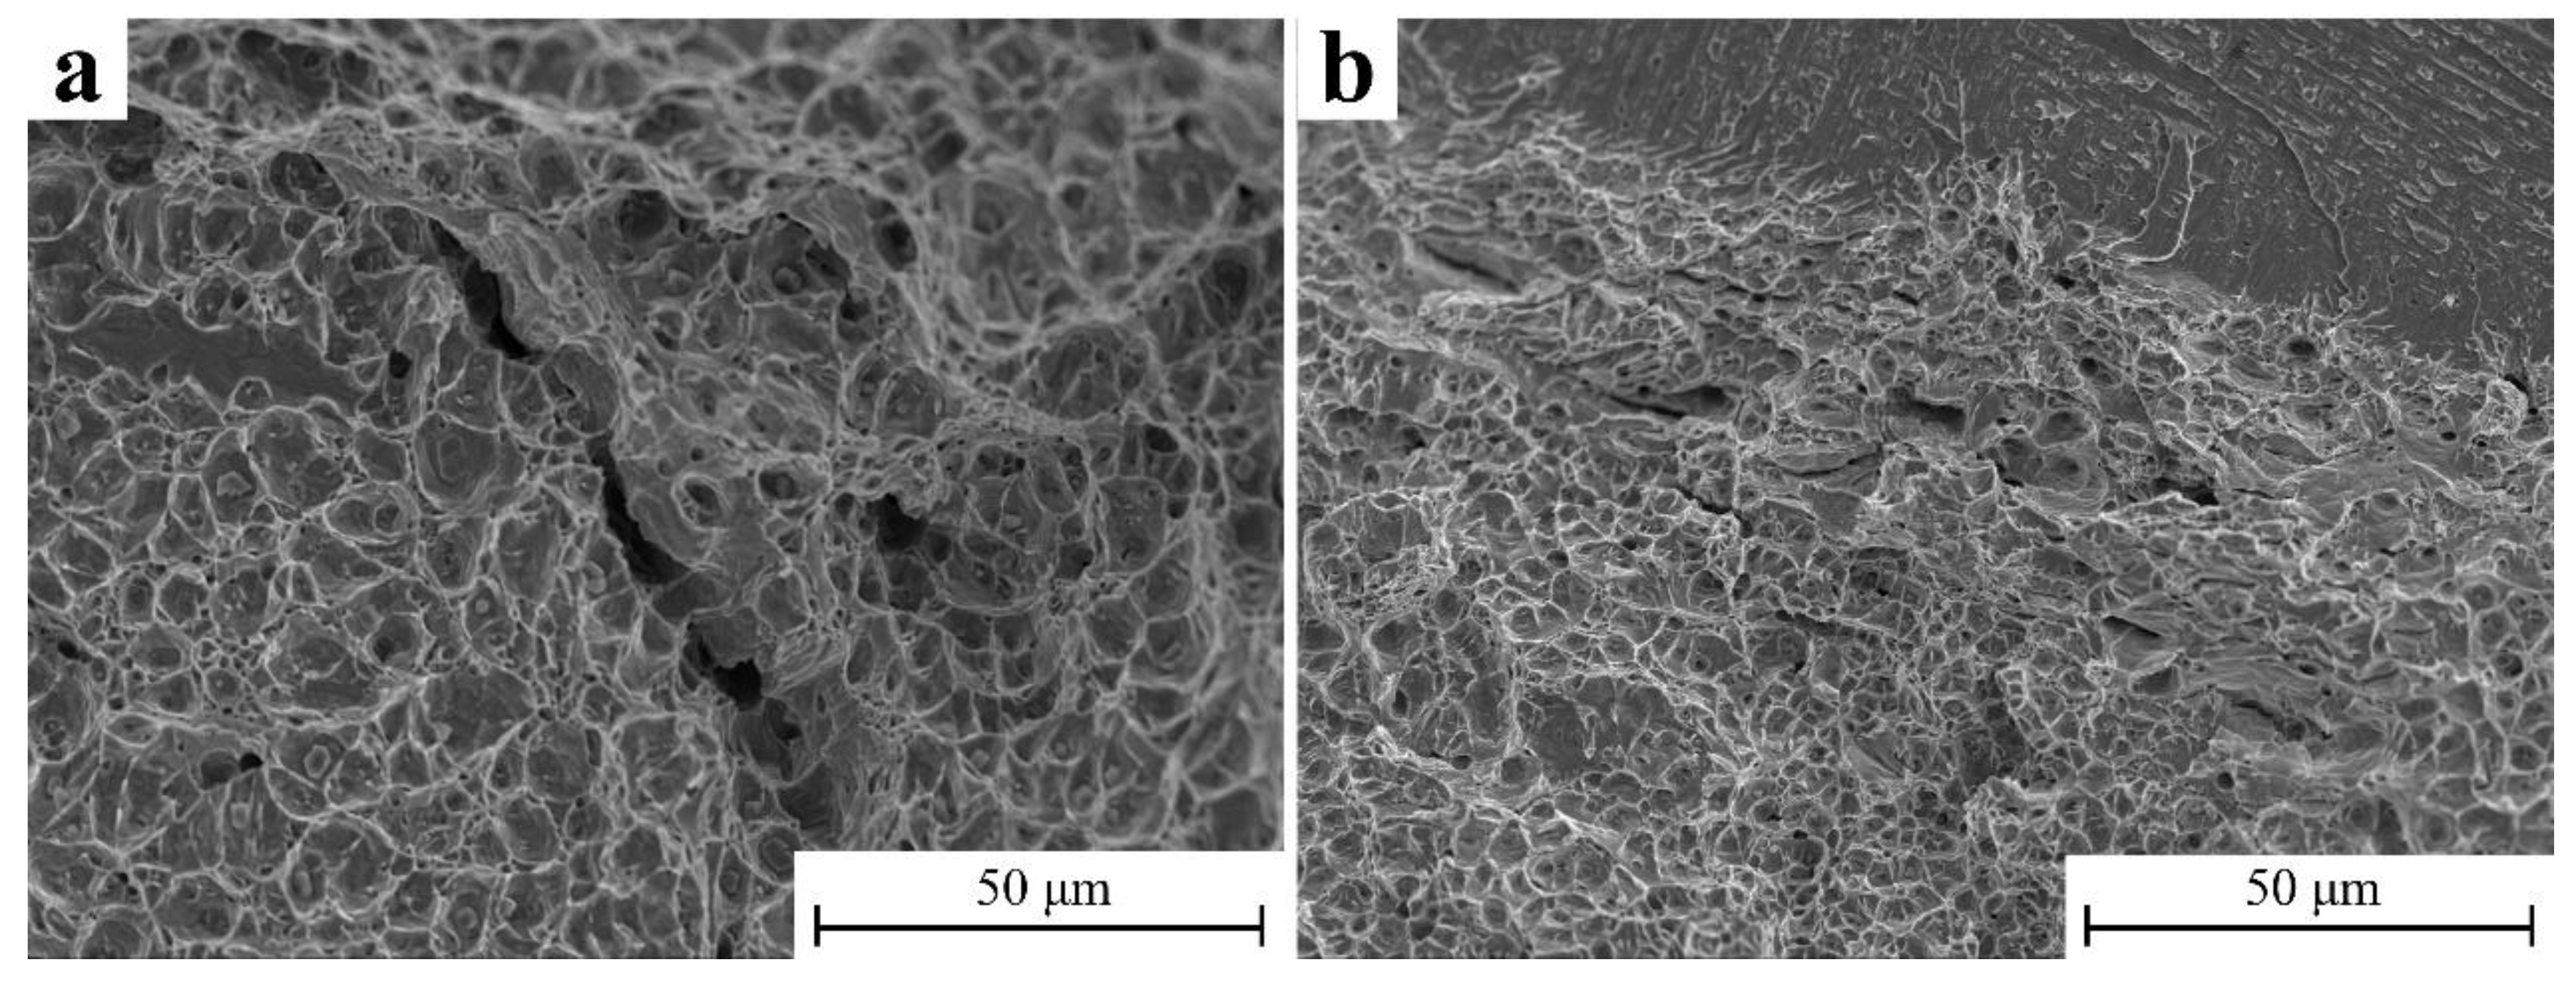
3.5. Tensile Properties

The room-temperature tensile properties of three samples are summarized in Table 5. Tensile testing was applied in both the Y and Z directions to demonstrate the connection between the orientation and tensile properties. The results indicate that the tensile strength in the Z direction was always less than that in the Y direction. The main reason for this phenomenon is that the stretching along the Z direction has more interfaces between the adjacent layers, which are weak positions during tensile [25,26]. Each data point represents the average of three samples to reduce the experimental error. The tensile strength only slightly decreased when compared with that of 304 stainless steel (520 MPa), which indicates that this molded product could be applied in some areas. However, the mechanical properties in the Z direction were worse than those in the Y direction, which requires adjustment of the process parameters and is the subject of an on-going investigation. In terms of elongation, the elongation of the obtained Fe-Al alloy has been improved when compared to that made from pure iron wire and pure aluminum wire using WAAM [16]. The results show that the room temperature brittleness of Fe-Al alloy can be improved by adding alloy elements. The main reason for the difference in tensile strength of different samples is that the grain size is different. The grain size of sample II is the smallest, so the tensile strength is the largest. As can be seen from Figure 8 and Table 5, the hardness varies by about 50%, and the strength varies by about 5%. The reason for this phenomenon can be attributed to the difference in measurement scale. For hardness testing, it is only done in a local area. For the tensile testing, it shows the overall performance of the sample.
SEM images of the tensile fracture in sample II along both the Y and Z direction are presented in Figure 9. The presence of cracks was observed in both directions; however, the size of the cracks differed. The size of the crack in the Y direction was larger than that in the Z direction and the number of cracks in the Y direction was smaller. The presence of cracks is related to the presence of brittle metal compounds [17] and it indicates that the expansion of cracks during the deposition process mainly occurs along the Y direction. The Y direction fracture was mainly plastic fracture, as indicated by the numerous dimples in Figure 9a. However, the fracture in the Z direction was not a single plastic or brittle fracture, but the combination of two fracture modes. In Figure 9b, both dimples and fractures with lamellar stream patterns are observed. This phenomenon indicates that the fusing direction greatly affects the plasticity; however, further investigation is needed to reduce the brittleness in the Z direction. For samples I and III, the fracture morphology is similar to sample II, which will not be repeated here.

4. Conclusions

This study demonstrates the feasibility of manufacturing 304 stainless steel/AA 4043 using WAAM. The main experimental conclusions are as follows:
(1)
Columnar grains begin to grow from the area near the fusion line and transforms into equiaxed grains at the top of the buildup wall, and the grain size decreases with increasing travel speed.
(2)
The specimen deposited using pulse current shows the better resistance to electrochemical corrosion.
(3)
The hardness of the cladding layer is significantly greater than that of the base metal, which is related to the formation of intermetallic compounds, such as Al1.1Ni0.9.
(4)
This manufacturing method has little effect on the tensile strength of the material. The elongation in the Y direction and Z direction reach 10.25% and 9.94%, respectively.
(5)
The best parameters for fabricating SUS 304/AA 4043 alloy with WAAM are constant current of 150 A and scanning speed of 0.3 m/min.

Author Contributions

Conceptualization, S.A. and Z.L.; Methodology, Z.H.; Writing-Original Draft Preparation, Z.H.; Writing-Review & Editing, Y.C. and W.Z.

Funding

This research was funded by the Natural Science Foundation of China grant number [51575383] and Natural Science Foundation of Tianjin, China [18JCQNJC04100].

Acknowledgments

Thanks to the supports of experimental equipment from the School of Materials Science and Engineering, Tianjin University.

Conflicts of Interest

The authors declare no conflict of interest.

References

  1. Mckamey, C.G.; DeVan, J.H.; Tortorelli, P.F.; Sikka, V.K. A review of recent developments in Fe3Al-based alloys. J. Mater. Res. 1991, 6, 1779–1805. [Google Scholar] [CrossRef] [Green Version]
  2. Natesan, K. Corrosion Performance of Iron Aluminides; Argonne National Lab.: DuPage County, IL, USA, 1993.
  3. Herzog, D.; Seyda, V.; Wycisk, E.; Emmelmann, C. Additive manufacturing of metals. Acta Mater. 2016, 117, 371–392. [Google Scholar] [CrossRef]
  4. Wohlers, T. Developments in additive manufacturing. Manuf. Eng. 2010, 144, 54–59. [Google Scholar]
  5. Martin, J.H.; Yahata, B.D.; Hundley, J.M.; Mayer, J.A.; Schaedler, T.A.; Pollock, T.M. 3D printing of high-strength aluminium alloys. Nature 2017, 549, 365–369. [Google Scholar] [CrossRef] [PubMed]
  6. Lin, J.; Lv, Y.; Liu, Y.; Sun, Z.; Wang, K.; Li, Z.; Wu, Y.; Xu, B. Microstructural evolution and mechanical property of Ti-6Al-4V wall deposited by continuous plasma arc additive manufacturing without post heat treatment. J. Mech. Behav. Biomed. Mater. 2017, 69, 19–29. [Google Scholar] [CrossRef] [PubMed]
  7. Wang, Y.; Chen, M.; Zhou, F.; Ma, E. High tensile ductility in a nanostructured metal. Nature 2002, 419, 912–915. [Google Scholar] [CrossRef] [PubMed]
  8. Gu, D.D.; Meiners, W.; Wissenbach, K.; Poprawe, R. Laser additive manufacturing of metallic components: Materials, processes and mechanisms. Int. Mater. Rev. 2012, 57, 133–164. [Google Scholar] [CrossRef]
  9. Kruth, J.P.; Froyen, L.; Vaerenbergh, J.V.; Mercelis, P.; Rombouts, M.; Lauwers, B. Selective laser melting of iron-based powder. J. Mater. Process. Technol. 2004, 149, 616–622. [Google Scholar] [CrossRef]
  10. Ding, D.; Pan, Z.; Cuiuri, D.; Li, H. A multi-bead overlapping model for robotic wire and arc additive manufacturing (WAAM). Robot. Comput. Integr. Manuf. 2015, 31, 101–110. [Google Scholar] [CrossRef] [Green Version]
  11. Stallybrass, C.; Sauthoff, G. Ferritic Fe–Al–Ni–Cr alloys with coherent precipitates for high-temperature applications. Mater. Sci. Eng. A 2004, 387–389, 985–990. [Google Scholar] [CrossRef]
  12. Hadef, F.; Otmani, A.; Djekoun, A.; Grenèche, J.M. Nanocrystalline feal intermetallics obtained in mechanically alloyed Fe50Al40Ni10, powder. Superlattices Microstruct. 2011, 49, 654–665. [Google Scholar] [CrossRef]
  13. Ma, Y.; Cuiuri, D.; Hoye, N.; Li, H.; Pan, Z. The effect of location on the microstructure and mechanical properties of titanium aluminides produced by additive layer manufacturing using in-situ alloying and gas tungsten arc welding. Mater. Sci. Eng. A 2015, 631, 230–240. [Google Scholar] [CrossRef]
  14. Ma, Y.; Cuiuri, D.; Hoye, N.; Li, H.; Pan, Z. Effects of wire feed conditions on in situ alloying and additive layer manufacturing of titanium aluminides using gas tungsten arc welding. J. Mater. Res. 2014, 29, 2066–2071. [Google Scholar] [CrossRef]
  15. Shen, C.; Pan, Z.; Cuiuri, D.; Roberts, J.; Li, H. Fabrication of Fe-FeAl functionally graded material using the wire-arc additive manufacturing process. Metall. Mater. Transact. B 2016, 47, 763–772. [Google Scholar] [CrossRef]
  16. Shen, C.; Pan, Z.; Cuiuri, D.; Dong, B.; Li, H. In-depth study of the mechanical properties for Fe3Al based iron aluminide fabricated using the wire-arc additive manufacturing process. Mater. Sci. Eng. A 2016, 669, 118–126. [Google Scholar] [CrossRef]
  17. Lin, S.; Song, J.; Yang, C.; Ma, G. Microstructure analysis of interfacial layer with tungsten inert gas welding-brazing joint of aluminum alloy/stainless steel. Acta Metall. Sin. 2009, 45, 1211–1216. [Google Scholar]
  18. Liu, C.T.; George, E.P.; Maziasz, P.J.; Schneibel, J.H. Recent advances in B2 iron aluminide alloys: Deformation, fracture and alloy design. Mater. Sci. Eng. A 1998, 258, 84–98. [Google Scholar] [CrossRef]
  19. Crimp, M.A.; Vedula, K. Effect of boron on the tensile properties of B2 FeAl. Mater. Sci. Eng. 1986, 78, 193–200. [Google Scholar] [CrossRef]
  20. Mckamey, C.G.; Horton, J.A.; Liu, C.T. Effect of chromium on properties of Fe3Al. J. Mater. Res. 1989, 4, 1156–1163. [Google Scholar] [CrossRef]
  21. Sun, Y.; Yao, Z.; Zhang, Z.; Huang, H. Mechanical properties of Fe3Al-based alloys with cerium addition. Scr. Metall. Mater. 1995, 33, 811–817. [Google Scholar]
  22. Mckamey, C.G.; Maziasz, P.J.; Goodwin, G.M.; Zacharia, T. Effects of alloying additions on the microstructures, mechanical properties and weldability of Fe3Al-based alloys. Mater. Sci. Eng. A 1994, 174, 59–70. [Google Scholar] [CrossRef]
  23. Ding, D.; Pan, Z.; Cuiuri, D.; Li, H. Wire-feed additive manufacturing of metal components: Technologies, developments and future interests. Int. J. Adv. Manuf. Technol. 2015, 81, 465–481. [Google Scholar] [CrossRef]
  24. Feng, Y.P.; Gaztelumendi, N.; Fornell, J.; Zhang, H.Y.; Solsona, P.; Baró, M.D.; Suriñach, S.; Ibáñez, E.; Barrios, L.; Pellicer, E.; et al. Mechanical properties, corrosion performance and cell viability studies on newly developed porous Fe-Mn-Si-Pd alloys. J. Alloy. Compd. 2017, 724, 1046–1056. [Google Scholar] [CrossRef]
  25. Martina, F.; Mehnen, J.; Williams, S.W.; Colegrove, P.; Wang, F. Investigation of the benefits of plasma deposition for the additive layer manufacture of Ti–6Al–4V. J. Mater. Process. Technol. 2012, 212, 1377–1386. [Google Scholar] [CrossRef] [Green Version]
  26. Ahn, J.; Chen, L.; He, E.; Davies, C.M.; Dear, J.P. Effect of filler metal feed rate and composition on microstructure and mechanical properties of fibre laser welded AA 2024-T3. J. Manuf. Process. 2017, 25, 26–36. [Google Scholar] [CrossRef] [Green Version]
Figure 1. (a) Robot system and (b) representative molded product.
Metals 08 00595 g001
Figure 2. (a) Specimen extraction locations for analyses of the elemental distribution, hardness, microstructure, electrochemical corrosion, and tensile properties; (b) the test location for hardness and microstructure in plane XOZ; and, (c) specific dimensions of tensile samples.
Metals 08 00595 g002
Figure 3. Macro morphology of single bead in different experimental parameters: (a) CC 0.2 m/min; (b) CC 0.3 m/min; (c) CC 0.4 m/min; (d) PC 0.2 m/min; (e) PC 0.3 m/min; and (f) PC 0.4 m/min.
Metals 08 00595 g003
Figure 4. Energy-dispersive X-ray spectrometry (EDS) results: (a) the scanning positon; (b) I: CC 0.2 m/min; (c) II: CC 0.3 m/min; and, (d) III: PC 0.2 m/min.
Metals 08 00595 g004
Figure 5. XRD results: I (CC 0.2 m/min), II (CC 0.3 m/min) and III (PC 0.2 m/min).
Metals 08 00595 g005
Figure 6. Microstructures of specimens I (a,b: CC 0.2 m/min), II (c,d: CC 0.3 m/min), and III (e,f: PC 0.2 m/min).
Metals 08 00595 g006
Figure 7. Polarization curves of specimens: I (CC 0.2 m/min), II (CC 0.3 m/min), and III (PC 0.2 m/min).
Metals 08 00595 g007
Figure 8. Hardness curves measured along the centerline: I (CC 0.2 m/min), II (CC 0.3 m/min), and III (PC 0.2 m/min).
Metals 08 00595 g008
Figure 9. Scanning electron microscopy (SEM) images of the tensile fracture in the (a) Y and (b) Z direction.
Metals 08 00595 g009
Table 1. Chemical constituents of two wires and base metal.
wt.%CMnPSSiCrNiCuAlFe
SUS 304≤0.08≤2.0≤0.045≤0.03≤1.00≤18.0≤8.0--Balance
AA 4043-≤0.05--≤6.0--≤0.3Balance≤0.8
Low carbon steel≤0.22≤1.4≤0.045≤0.05≤0.35---Balance-
Table 2. Experimental parameters.
NumberWire Feed Speed (mm/s−1)Current TypeWelding Speed
(m/min−1)
Arc Length
(mm)
SUS 304AA 4043
11010PC0.25
21010PC0.35
31010PC0.45
41010CC0.25
51010CC0.35
61010CC0.45
Table 3. Content of all elements: I (CC 0.2 m/min), II (CC 0.3 m/min) and III (PC 0.2 m/min).
wt.%IIIIII
Base MetalFused LayerBase MetalFused LayerBase MetalFused Layer
Cr1.8613.912.098.921.6510.14
Ni0.933.371.162.640.943.17
Fe94.1258.9693.4659.1794.1660.65
Al1.4721.161.6426.411.6123.33
C0.630.510.670.540.600.50
Si0.992.090.982.321.042.21
Table 4. Size of columnar and equiaxed grains: I (CC 0.2 m/min), II (CC 0.3 m/min), and III (PC 0.2 m/min).
SamplesGrain Size (μm)
Equiaxed GrainsColumnar Grains
I239.1267.8
II114.8105.5
III192256.7
Table 5. Room-temperature tensile properties: I (CC 0.2 m/min), II (CC 0.3 m/min), and III (PC 0.2 m/min).
NumberTensile DirectionY directionZ direction
IUltimate tensile strength (MPa)488 ± 21458 ± 15
0.2% yield strength (MPa)440 ± 12392 ± 10
Elongation (%)10.2 ± 0.19.9 ± 0.1
IIUltimate tensile strength (MPa)515 ± 15485 ± 14
0.2% yield strength (MPa)465 ± 11429 ± 9
Elongation (%)9.9 ± 0.29.4 ± 0.1
IIIUltimate tensile strength (MPa)503 ± 14470 ± 12
0.2% yield strength (MPa)453 ± 10405 ± 9
Elongation (%)10.0 ± 0.19.5 ± 0.1

