Article

Surface Nitridation of Aluminum Nanoparticles by Off-Line Operation and Its Kinetics Analysis

1
School of Materials Science and Engineering, Southwest University of Science and Technology, Mianyang 621010, China
2
Analytical & Testing Center, Sichuan University, Chengdu 610064, China
3
College of Materials Science and Engineering, Sichuan University, Chengdu 610064, China
4
Technical Institute of Physics and Chemistry, Chinese Academy of Sciences, Beijing 100190, China
*
Author to whom correspondence should be addressed.
Metals 2018, 8(4), 289; https://doi.org/10.3390/met8040289
Submission received: 15 March 2018 / Revised: 19 April 2018 / Accepted: 20 April 2018 / Published: 23 April 2018

Abstract

:
To improve combustion efficiency and anti-oxidation property of aluminum nanoparticles (ANs), surface nitridation of ANs was performed in a pipe furnace under the protection of nitrogen gas in a glove-operation hermetic box via an off-line nitridation process. The product was characterized by transmission electron microscopy (TEM), X-ray diffraction (XRD), and X-ray photoelectron spectroscopy (XPS) analysis. A core-shell nanostructure with an aluminum nitride (AlN) coating on the ANs core was observed. The empirical kinetic triplets (Ea, A, and f(α)) for the nitridation of ANs, for the first time, were calculated and analyzed using five types of iso-conversional methods and a differentiation method. The effects of the kinetics of the reaction were investigated by simultaneous differential scanning calorimetry–thermogravimetry (DSC-TG) and thermal analysis using linear programmed temperature at different heating rates.

1. Introduction

Aluminum nanoparticles (ANs) are currently widely used in solid propellants, explosives and pyrotechnics because of their high combustion enthalpy and low-temperature oxidation ability. As an excellent propellant, ANs show advantages in combustion applications such as high heat, fast energy releasing rate, burning completeness without cluster aggregation in combustion [1,2]. Nowadays, there are various methods to prepare ANs materials mainly including: wire electrical explosive process [3,4], vacuum spray technique [5,6], ball milling [7,8], plasma evaporation [9], inhomogeneous tensile deformation [10,11], and flow-levitation method [12]. Since ANs have a large active surface area and high surface energy, they can be easily oxidized and deactivated in the air, thus, limiting their practical use in propellants. Therefore, it is of high significance to cover inactive layers on ANs as an effective protecting coating to avoid the oxidation of ANs. The popular materials used for ANs coatings include Ni [13], C [14], Fe2O3 [15], AlB2 [16], perfluoroalkyl carboxylic acids [17], polyethylene [18], and other organics [19]. These materials have some limitations in combustion process because they are converted into species without contributions to the energy release. In addition, some coating species are easily oxidized in storage environments and even react with the coated ANs, thus greatly decreasing the combustion efficiency of ANs.
On the other hand, previous research has shown that propellants containing between 42 and 75% of ANs can achieve a very high burning rate [1]. Therefore, it is an ideal strategy to introduce foreign materials serving as the protective layers as well as the additives into ANs to obtain high efficiency in propellent materials. Varieties of species can be used for ANs coatings to improve the combustion efficiency in comparison with the original particles. Aluminum nitride (AlN) materials have excellent stability at low temperature and high resistance to corrosion [20,21]. More importantly, AlN does not react with O2 at room temperature while the AlN-O2 reaction occurs violently at 900 °C [22,23]. In addition, this AlN-O2 reaction is an exothermic reaction, which is a favorable factor like metal additives in terms of energy contribution. Hence, the limitation of the loss of surface activity may be addressed when ANs are coated with AlN layers.
Successful methods to prepare AlN coatings on ANs with fine nanostructures and without impurity incorporation is still a challenge because many preparation methods involve operations in ambient conditions and are affected by ambient air and temperature. In this paper, we propose a novel method for the surface nitridation of ANs. This method is based on flow-levitation (FL) technology using off-line nitridation operation, which can greatly reduce the ambient turbulence and increase product quality. On the other hand, even though the synthesis of AlN materials are extensively studied, it is still of great importance to analyze the nitridation kinetics, as it gives information on the physicochemical characteristics of the products in the reaction [24,25]. Study on the surface nitridation kinetics helps us to find the effect of reaction conditions (such as heating rate, treatment temperature) on the products. However, the available data for the nitridation kinetics of aluminum powder is relatively poorly reported in the current literature. To our knowledge, no accurate studies have been carried out for the ANs nitridation kinetic parameters to date. In this study, we make a detailed account of the surface nitridation of ANs including off-line operation, elemental analysis, morphology characterization, and the kinetic calculation for the first time. The kinetic triplets of the nitridation process were investigated to set up a general mechanistic model for a wide range of treatment temperature. A possible surface nitridation mechanism for ANs was also suggested. It should be noted that in this research, the off-line nitridation processes and kinetics study using DSC-TG were simultaneously carried out, and the former was guided by the results of the latter.

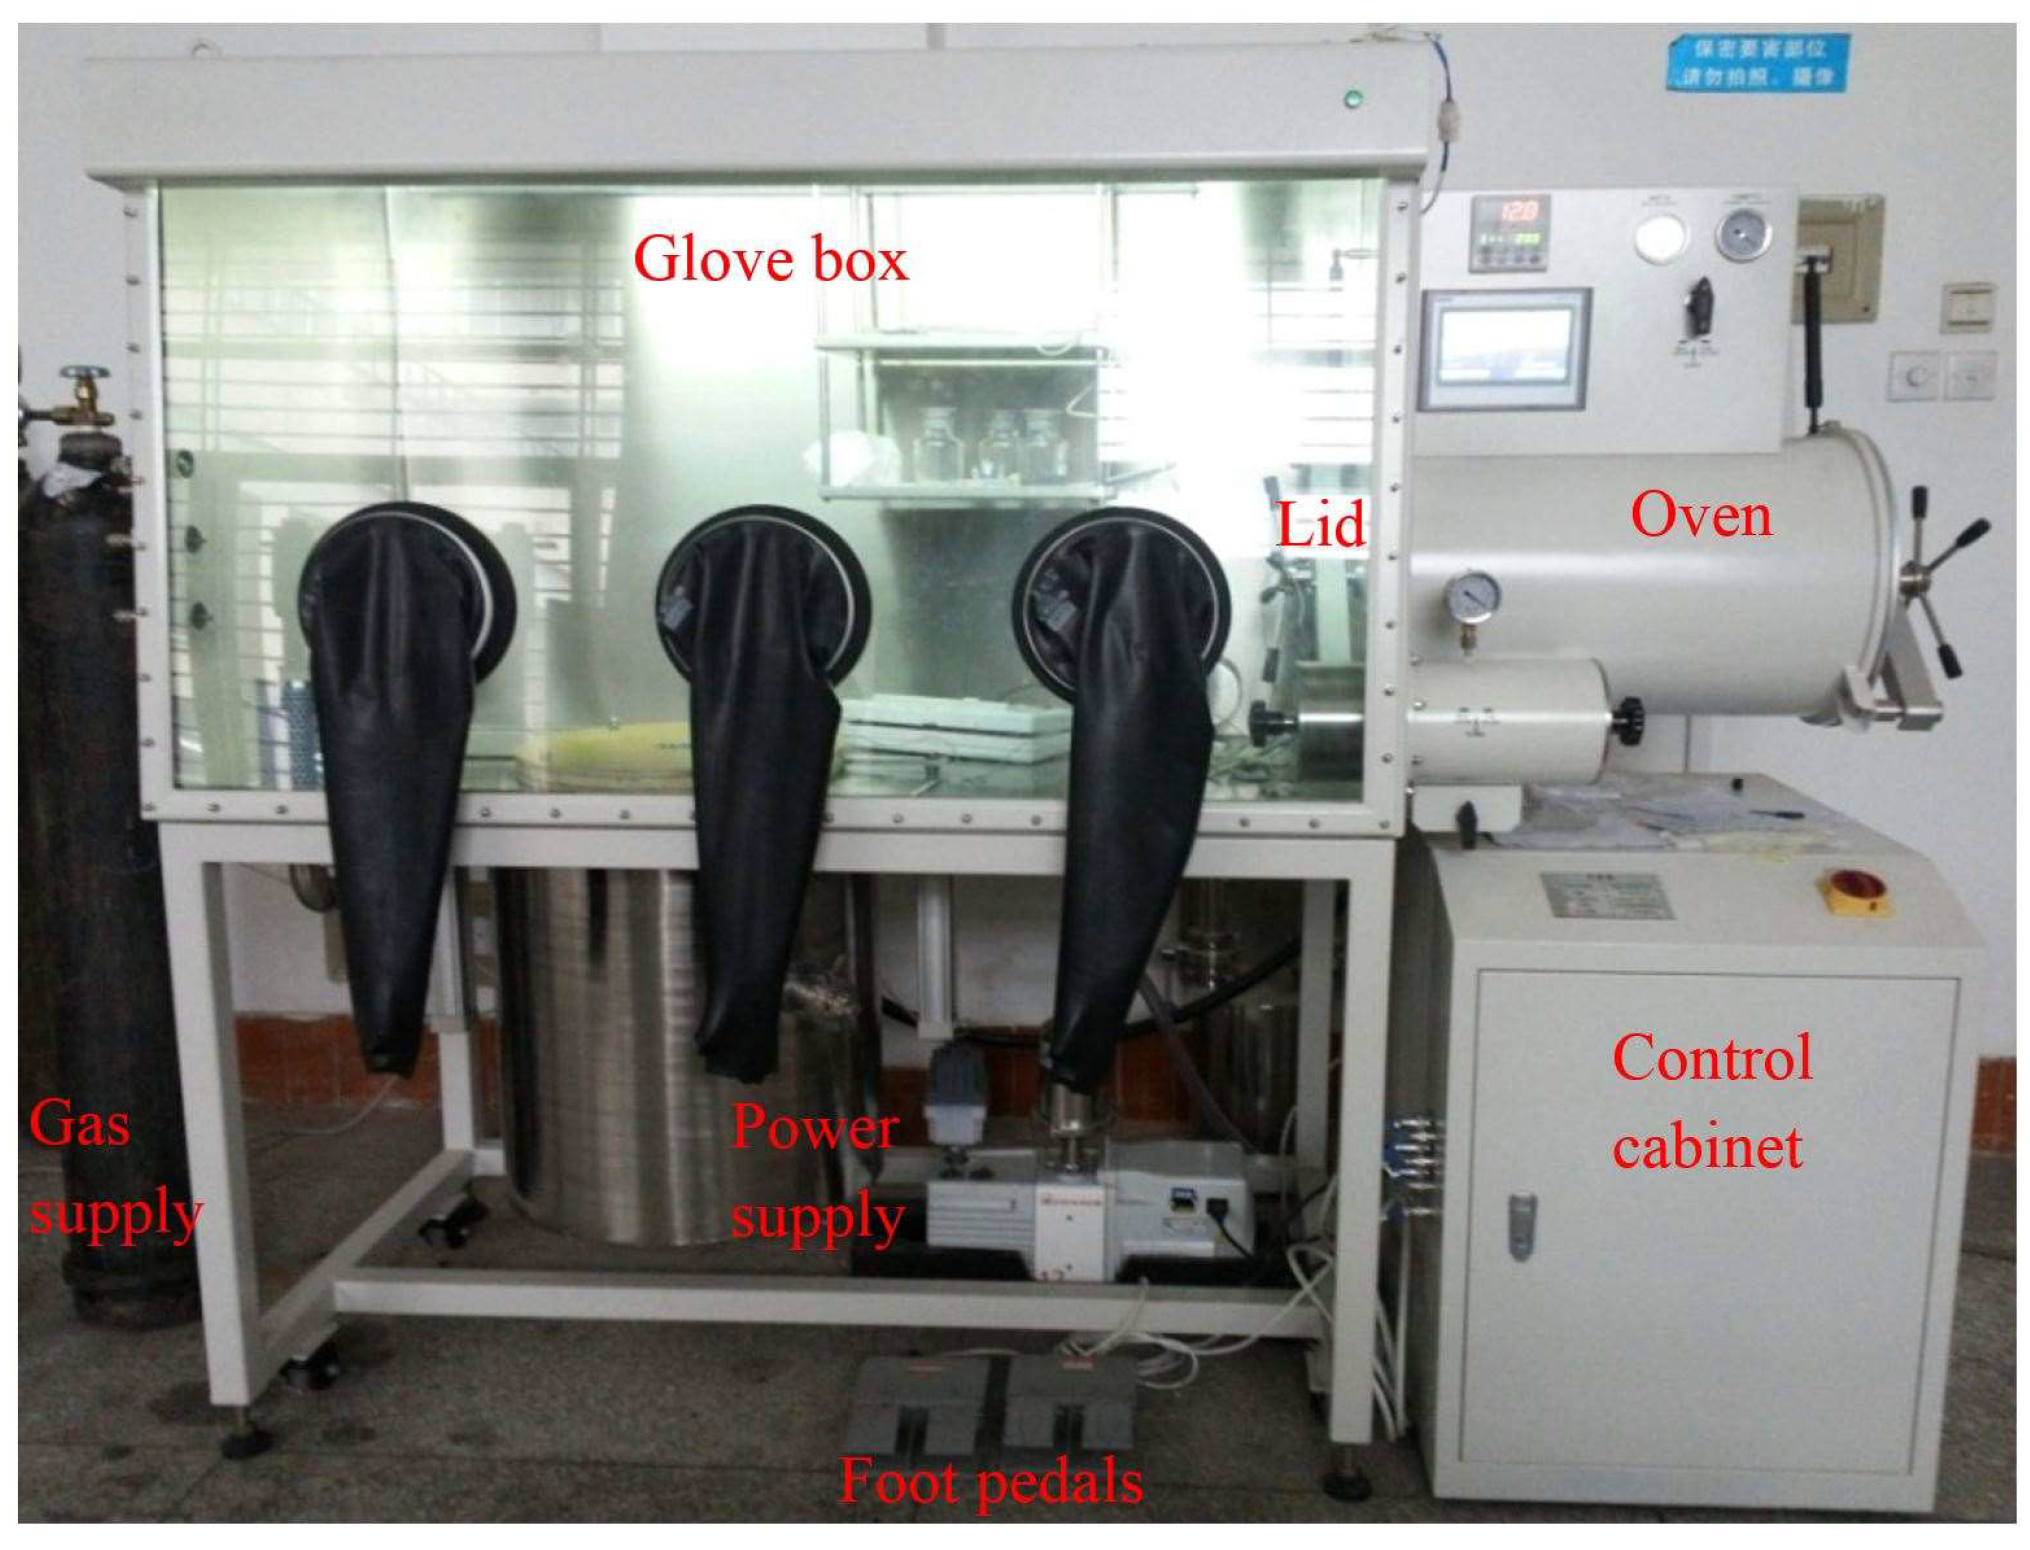
2. Experimental Section

ANs were prepared by FL method according to the standard operational manual. The surface nitridation of ANs was suggested by off-line nitridation method. The phase, surface morphology, and microstructure of the products were characterized by X-ray diffraction (XRD, X Pert PRO, CuKα, 40 kV, 250 mA, Almelo Holland, The Netherlands), transmission electron microscopy (TEM, Libra 200FE, Jena, Germany) with electron energy loss spectroscopy (EELS) analysis, and X-ray photoelectron spectroscopy (XPS, XASM 800, Kratos, Manchester, UK). Relative Intensity Ratio (RIR) method was employed to calculate the mass or volume fractions of the particles, which was used to speculate the thickness of the AlN layer. Differential scanning calorimetry–thermogravimetry (DSC-TG) measurements were carried out by a SDT Q600 (TA Instruments, New Castle, 19720 DE, USA) simultaneous thermal analysis device to examine the weight variation of the ANs in nitrogen flow gas.
FL system for ANs preparation: The FL system includes a dual frequency induction power supply (SPG400K2-20, Shuangping Power Technologies Co., Ltd., Dongguan, China), a powder preparation device, and a water recirculating machine. The power supply generates alternating magnetic field under high voltage, which can make the metal balls melt and suspended at a certain position. The powder preparation device includes the wire-silk system, powder classification system, collecting system, and pipe connection system. The water recirculating the machine supplies cooling water to keep the temperature of the system.
Surface nitridation system for ANs: The nitridation system was customized with an oven and glove box sections combined into one unit (Figure 1). They were separated by the oven lid. The open and close status of the lid could be controlled by foot pedals. The lid was closed when the oven was working. After the heating treatment, the oven and the glove box were connected by opening the lid to have the same atmospheric condition. Four circular holes (2 × Φ12 mm and 2 × Φ15 mm) were drilled in the lid, which could introduce the gas required for heating and let the exhaust gas out through a backup connector. The whole process was performed in the hermetic glove box filled with nitrogen gas to avoid the oxidation of ANs. The heating rate, temperature holding time, and heating stage could be tuned, and the temperature precision was controlled at ±2 °C. A circular tray for the placement of ANs materials that needed heating was set in the heating zone of the oven. Reagents (CaCl2, Na2SO3, analytical grade, Sigma-Aldrich, Shanghai, China) to remove H2O and O2 were placed in the box, and the H2O content was kept below 0.1 ppm while the O2 content was below 1 ppm.
Off-line nitridation operation: The treatment parameters were set referenced to the kinetic calculations. When the vacuum degree achieved −66 KPa by a pump, the atmospheric condition in the oven and the tool transition box was adjusted to the same vacuum. Then the oven lid was promoted to the highest level controlled by the foot plate. A crucible filled with ANs was placed in the center of the circle tray. Then the oven lid was decreased to the lowest position and the heating process was started with respect to the heating program. Each nitridation was performed with a temperature at 550–600 °C for 30, 60 and 90 min under the protection of highly pure N2. Each nitridation at one temperature treatment was carried out at 5, 7, 8, and 9 °C·min−1 heating rate 3 times. The nitridation samples were characterized by XRD, XPS and DSC-TG. AlN coatings were thus formed on the nanoparticle surface through the following reaction (1).
2Al (s) + N2 (g) → 2AlN (s)

3. Results and Discussion

3.1. Structural and Elemental Analysis

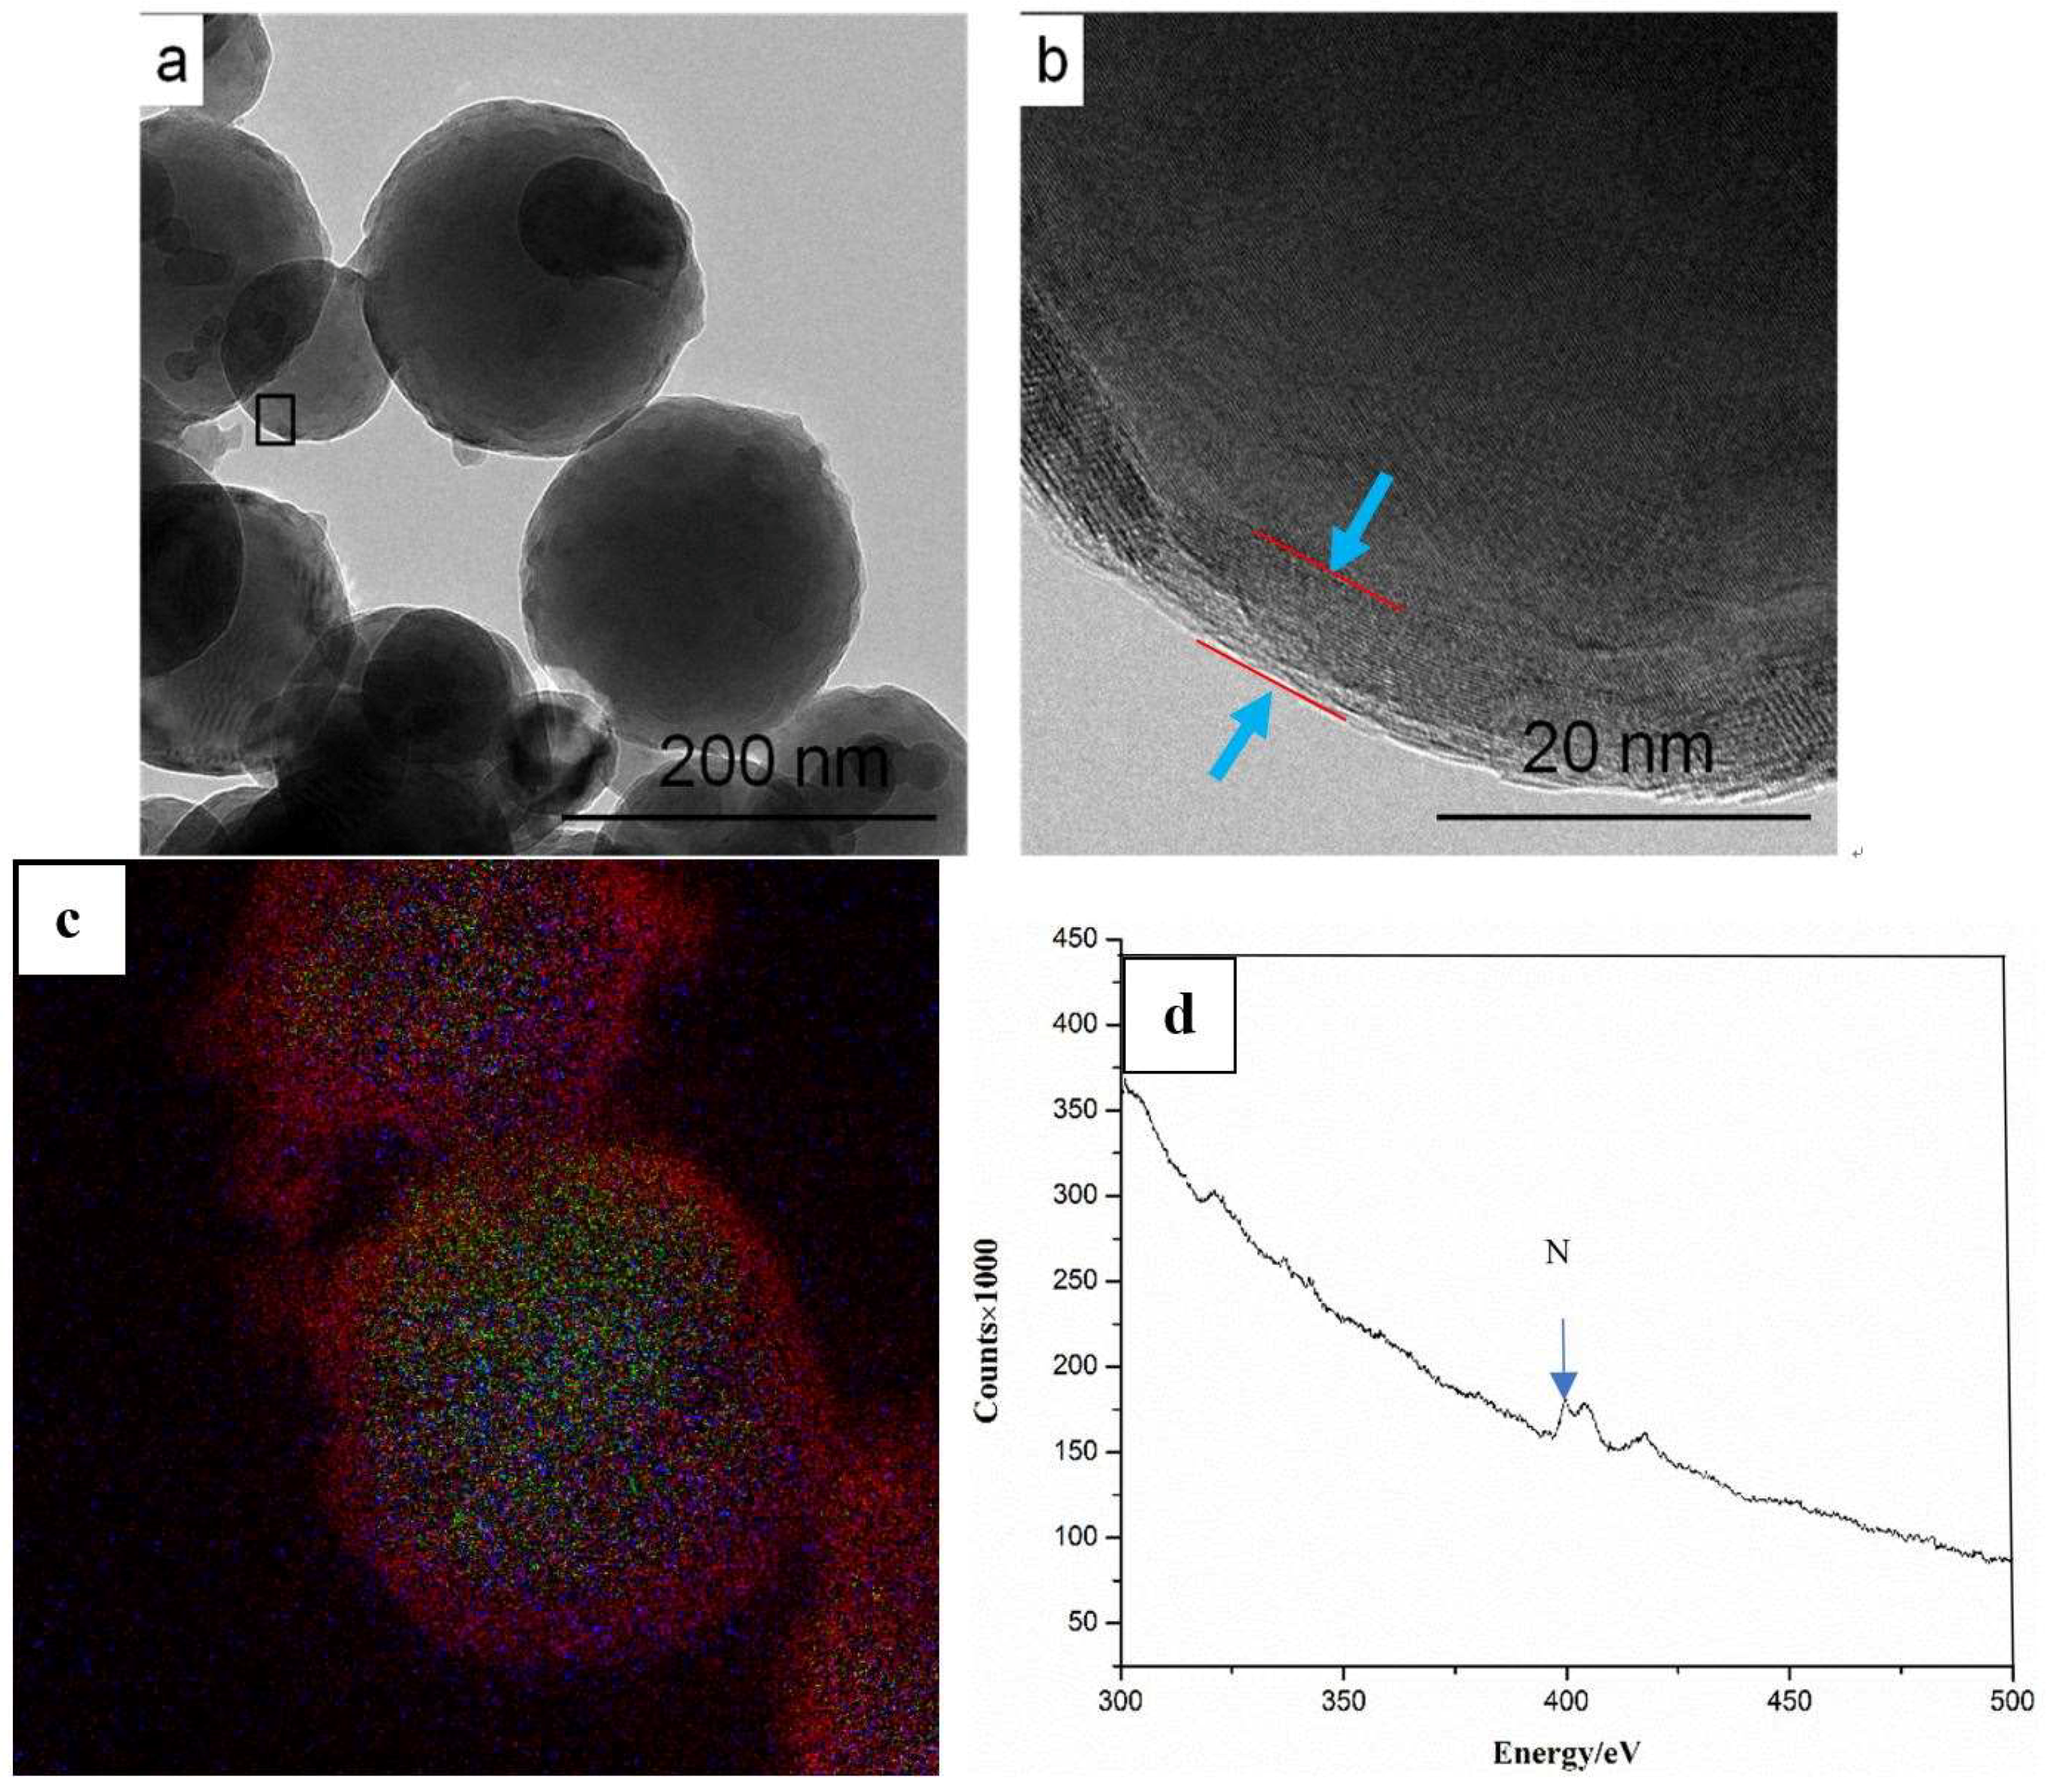
3.1.1. Transmission Electron Microscopy (TEM)

FL technology is one of the gas-phased methods for the preparation of nanomaterials, which can produce ANs in mass production and allows the in-situ coating process. The particle shape was characterized by TEM. Figure 2a shows a TEM image of the ANs after nitridation treatment at 550 °C. Spherical particles can be clearly observed. A single nanoparticle with well circle shape is shown in Figure 2b. After the surface nitridation process, the generated nanoparticles showed a core-shell structure with a shell thickness of 6–7 nm (scaled by the arrows). This nanostructure is favorable for the prevention of self-ignition and increasing the anti-oxidation property. Typical morphology and elemental distribution are illustrated in Figure 2c. Al (red), N (green), and O (blue) elements are found by line scan in the microstructure denoted in a different color, suggesting N element has been successfully introduced into the ANs. The elemental analysis from TEM is useful in vision observation as supplementary information in relationship with other characterization, even though the quantitative level is not high.
EELS was further used for the elemental identification on the nanoparticles. A peak at 401 eV characteristic of nitrogen is clearly observed in Figure 2d, which confirms that AlN coating was successfully formed on the nanoparticle surface. This composite product with a core-shell structure was generated mainly due to the high reactivity and large surface area of ANs. The mass fractions of AlN calculated by RIR are 40.3%, 40.6%, and 41% for the temperature holding time at 30, 60, and 90 min, respectively at the nitridation temperature of 550 °C. The variation of these mass fractions was less than 1%, indicating the formed AlN layer with certain thickness hinders the further nitridation reaction after the temperature holding time is longer than a certain period (i.e., 30 min for this sample). In summary, AlN coatings can effectively prevent the nanoparticles from deep nitridation and most likely from oxidization reaction.

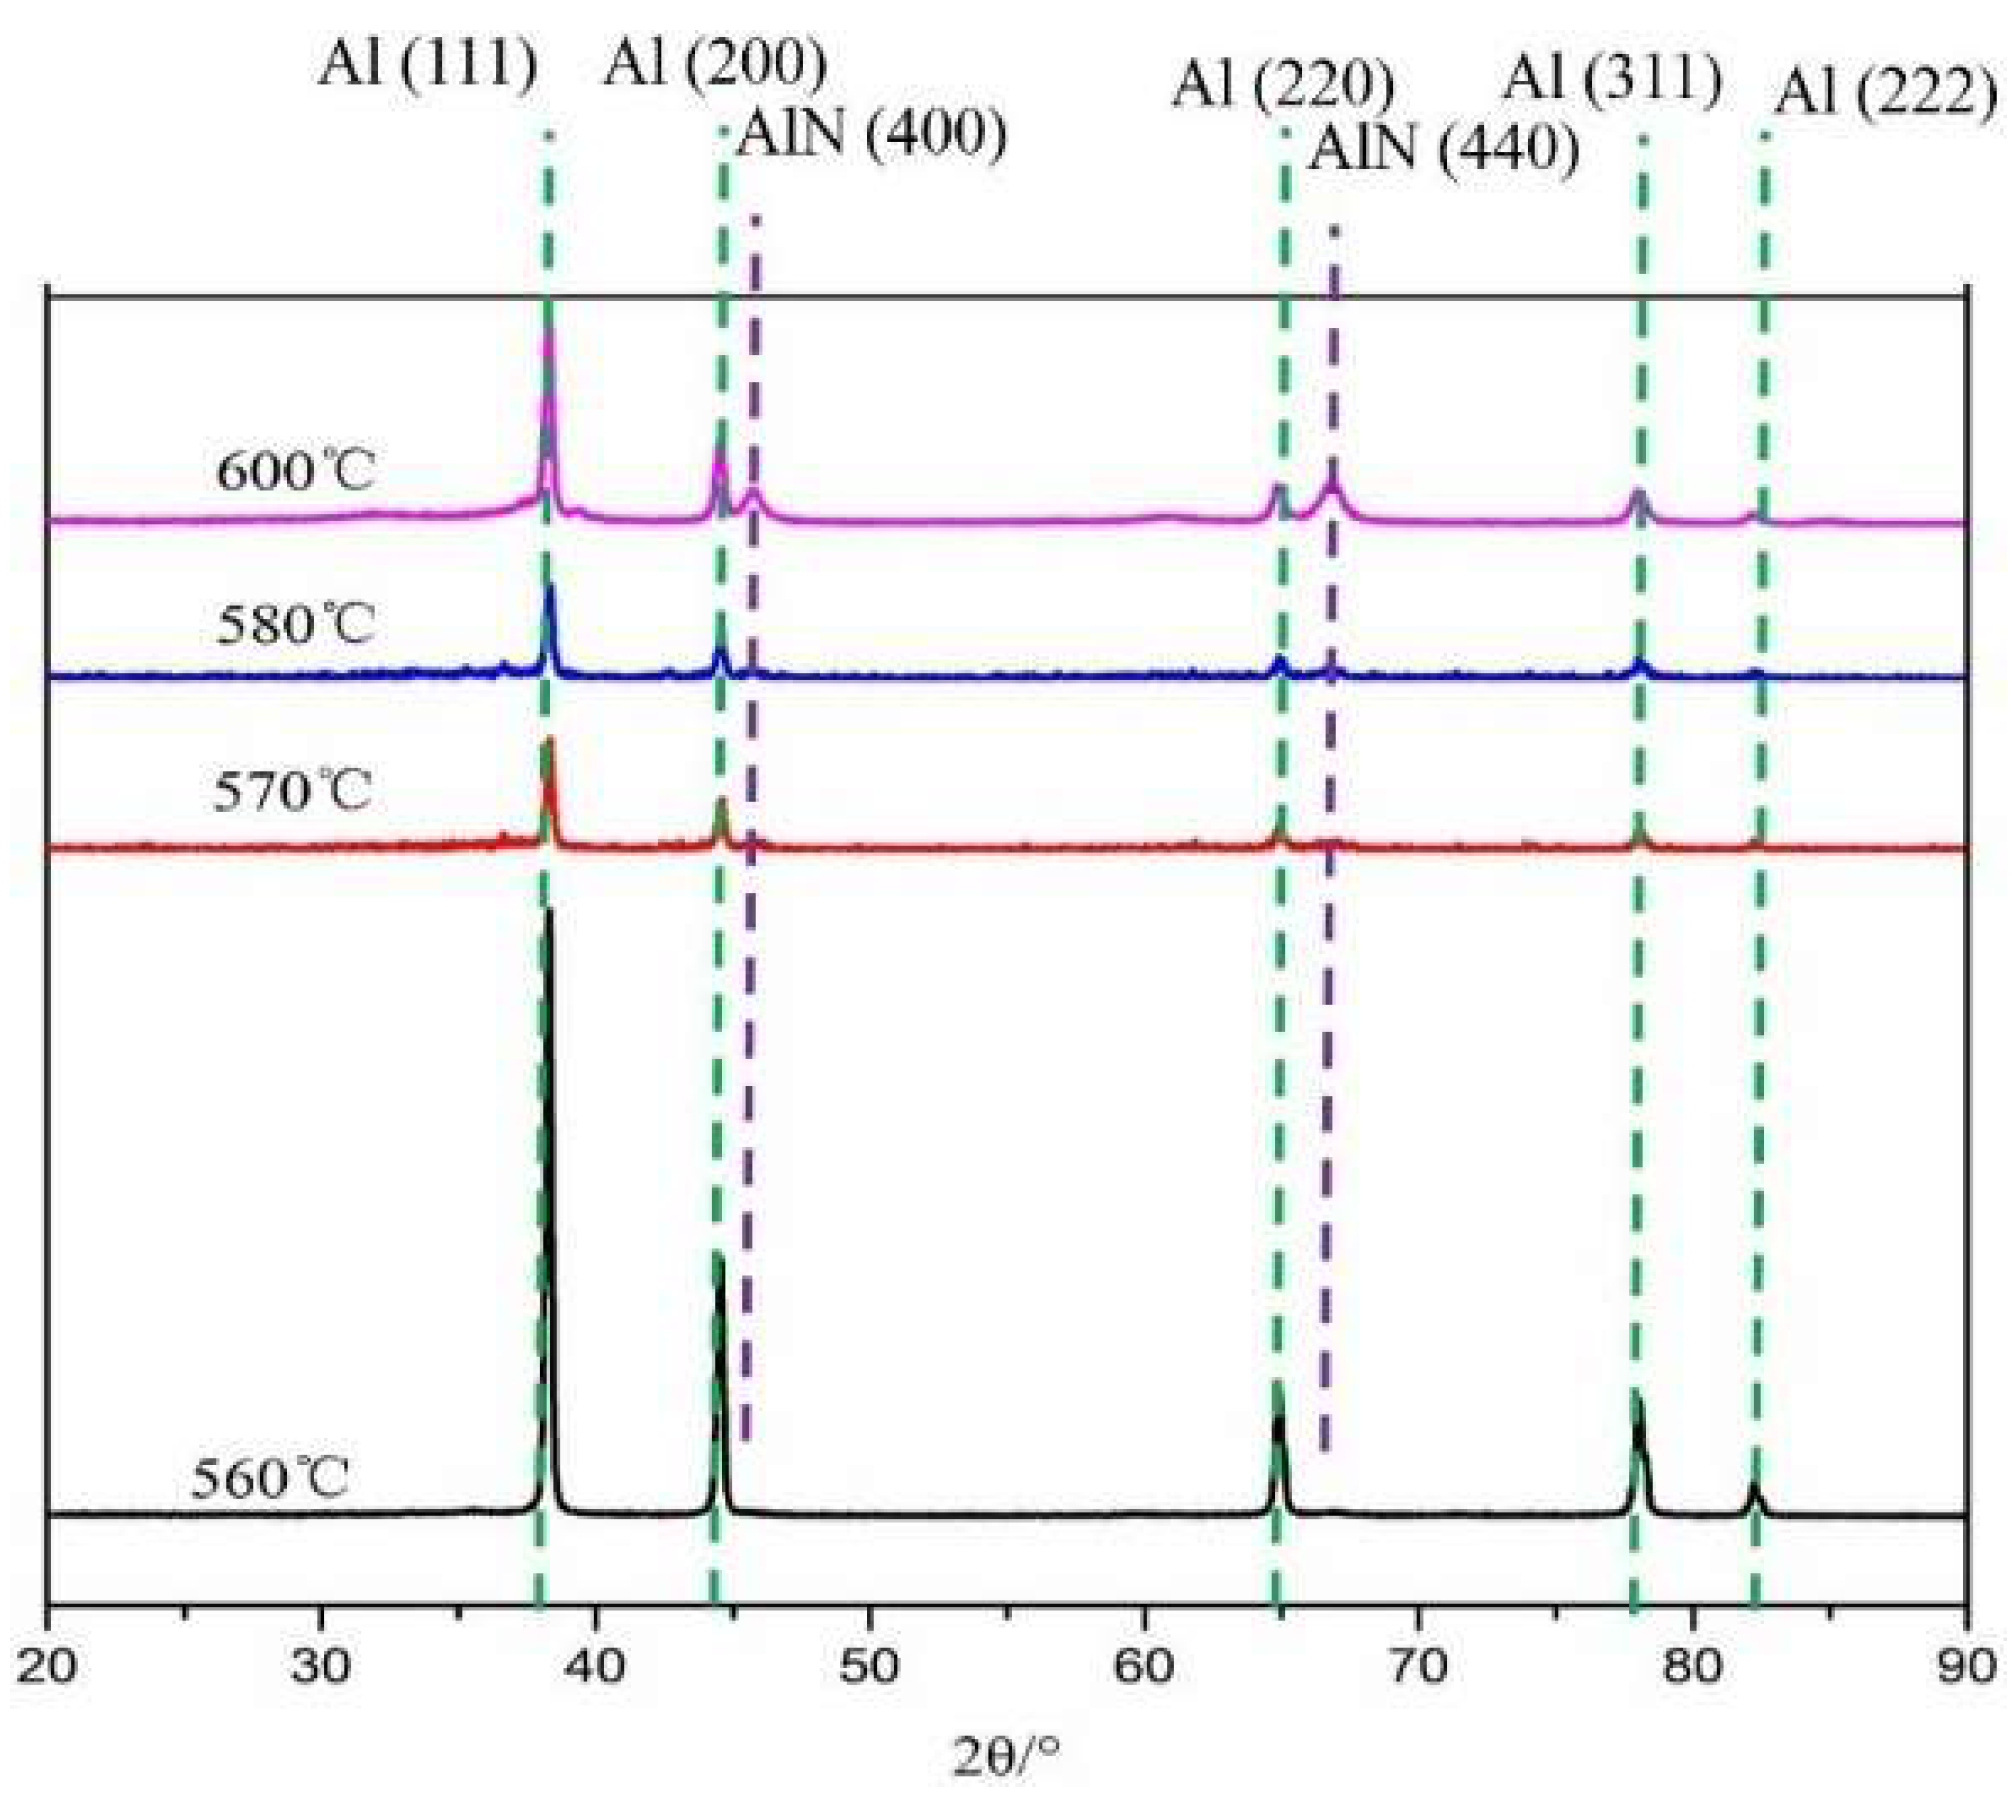
3.1.2. X-ray Diffraction (XRD)

Temperature effect on the nitridation process was studied by XRD analysis. The XRD results of the surface nitridation experiments carried out at 560 °C, 570 °C, 580 °C, and 600 °C with a thermal-insulation time of 30 min are compared in Figure 3. The appearance of AlN peaks at 45.862° and 67.032° at 2θ is observed, which are identified as the (400) and (440) facets of AlN with a hexagonal lattice. The diffraction peaks at 38.4°, 44.6°, 64.9°, 78.0°, and 82.2° are classified to the (111), (200), (220), (311), and (222) facets, respectively, of aluminum.
The stability or resistance to oxidation property of the sample treated at (600 °C) was estimated by XRD characterization after the nanoparticles with AlN coatings were placed in fresh air (room temperature 25 °C) for 1 h. There were almost no changes in the XRD curves since neither new peaks appeared nor old peaks disappeared, which indicate the AlN coatings could prevent the coated metal cores from oxidation in the air with a stable nanostructure (Supplementary Materials: Figure S1).

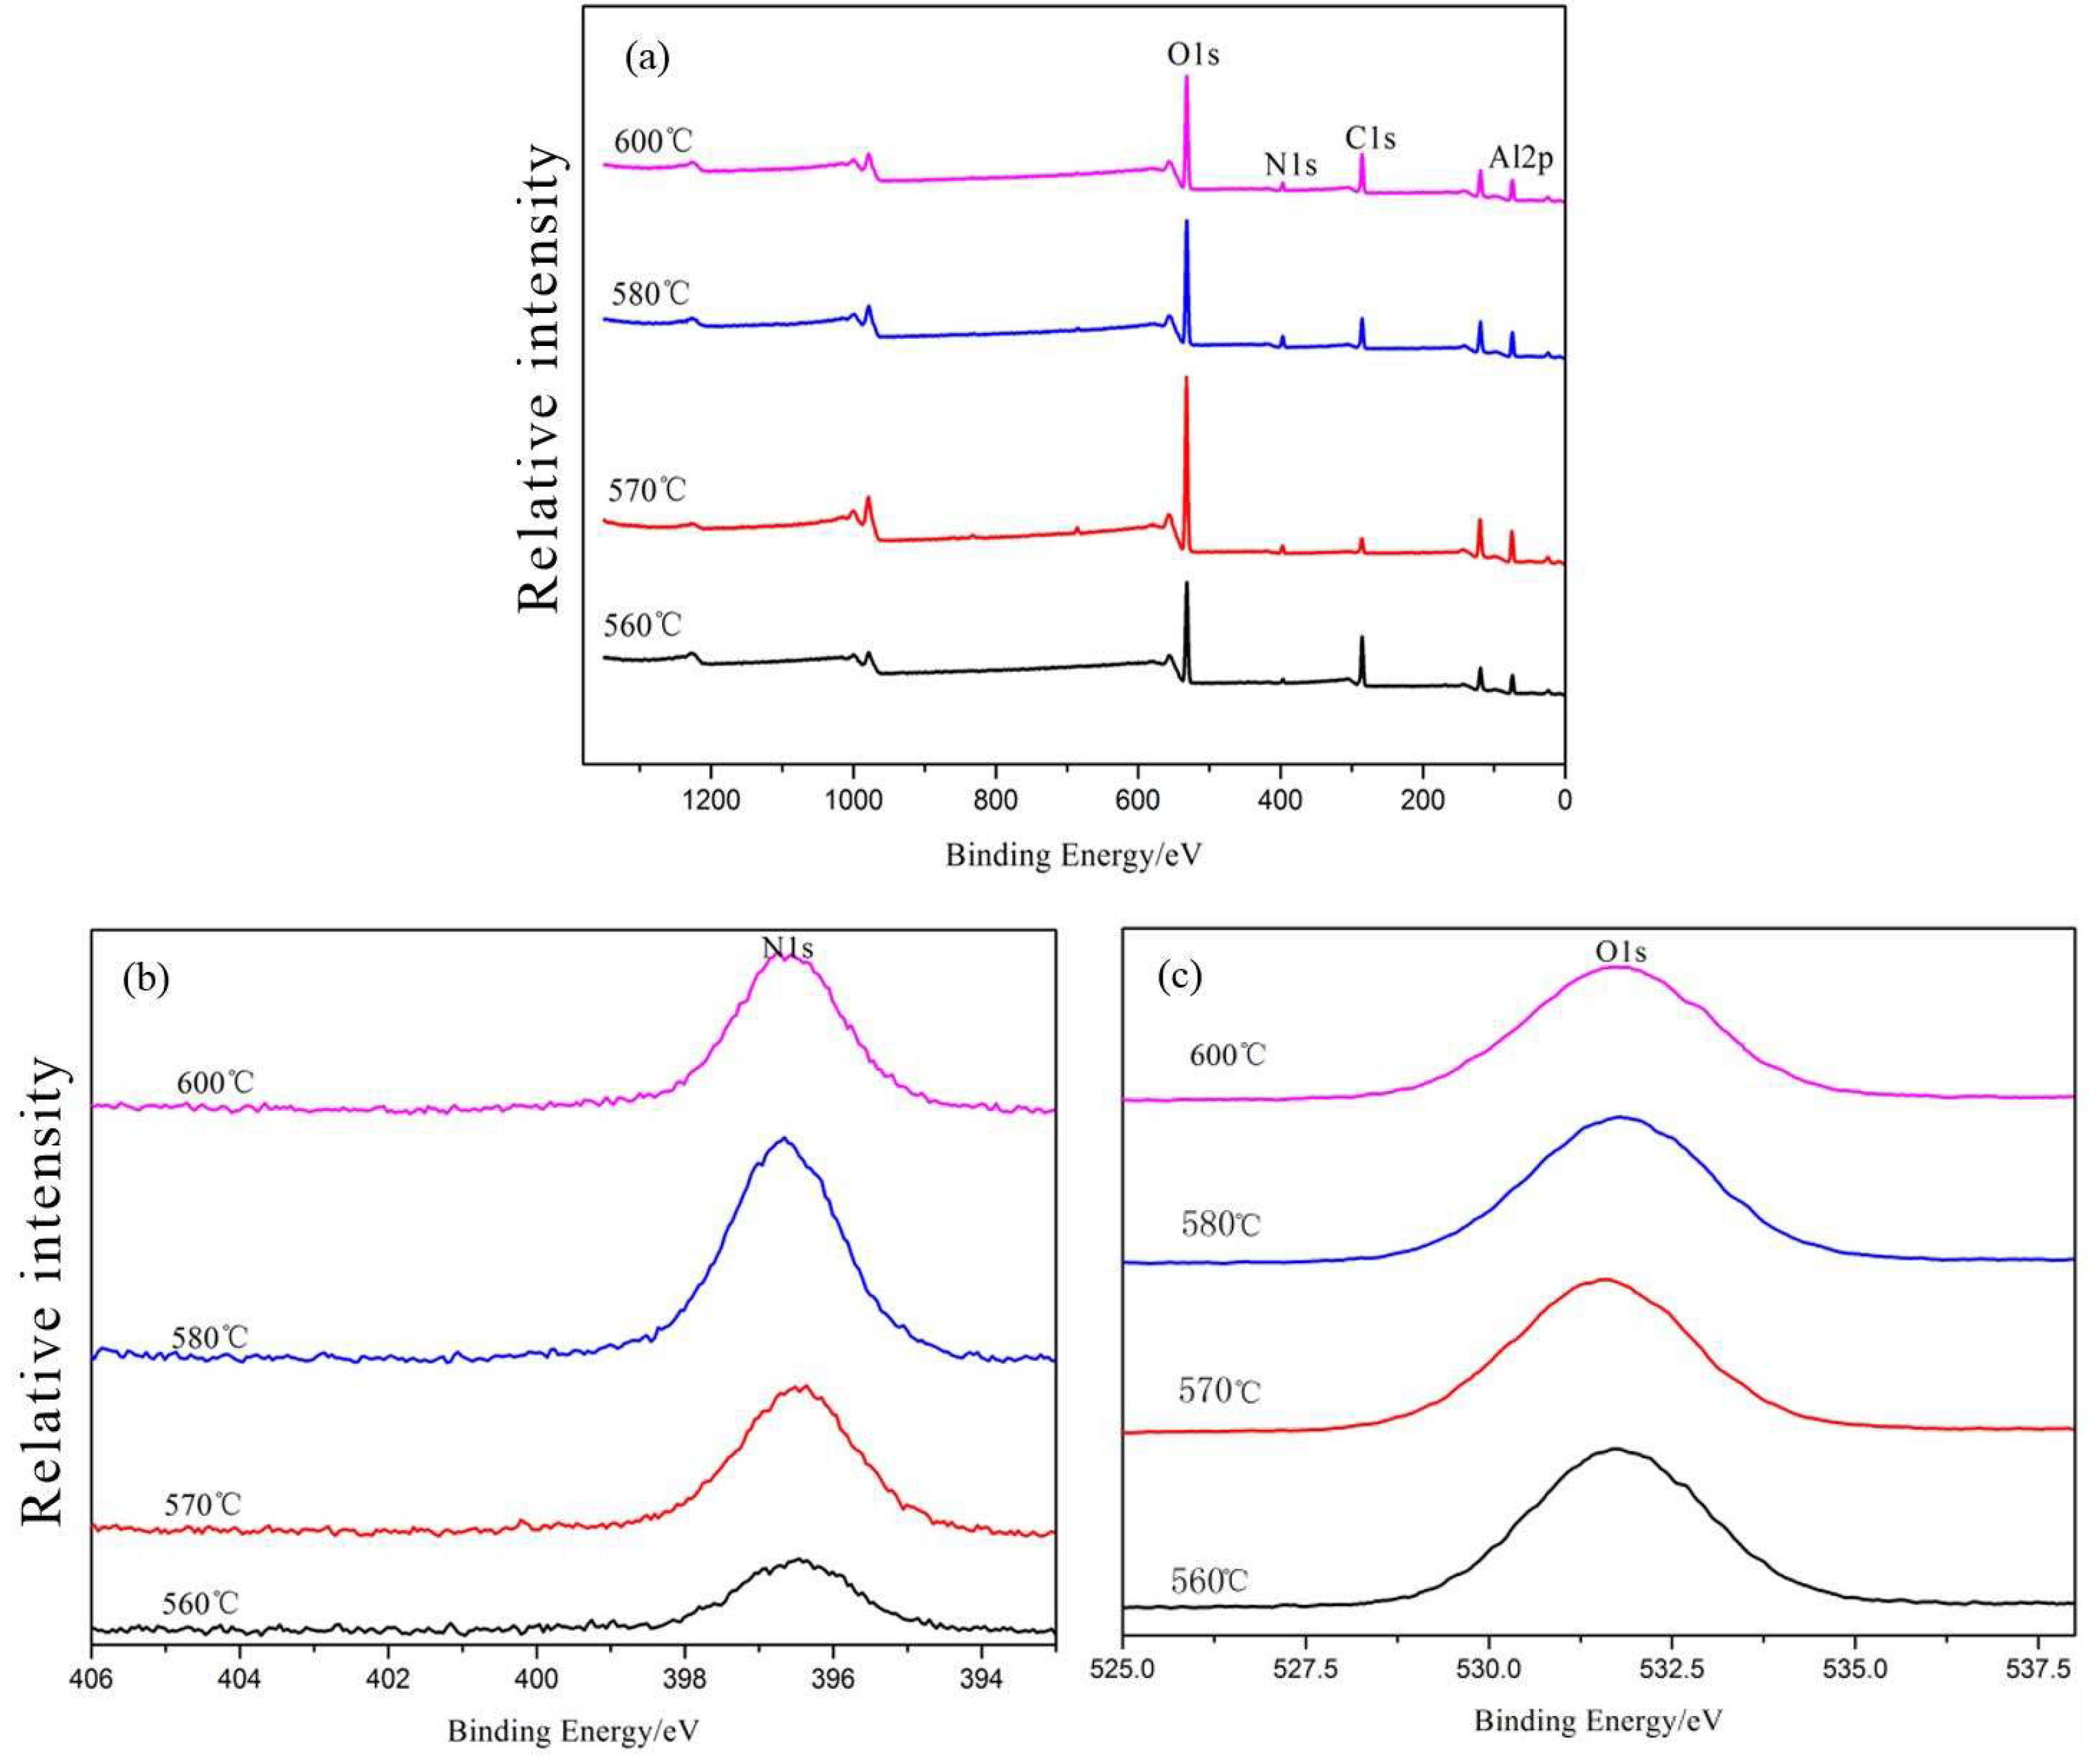
3.1.3. X-ray Photoelectron Spectroscopy (XPS)

The elemental composition of the nanoparticle surface was studied by XPS, and the results are shown in Figure 4. The peak between 394 eV and 398 eV in Figure 4b indicates the presence of nitrogen. The XPS measurements confirm that AlN coatings were successfully formed on the ANs. The peaks due to the presence of oxygen are found in the 527.5–535 eV region demonstrating the presence of Al2O3 as a consequence of the chemical reaction between aluminum and oxygen (Figure 4c). A decrease of Al2O3 content with the increasing of temperature is observed due to the reaction (2).
Al2O3 + 4Al → 3Al2O
It takes place at 500–600 °C where the Al2O is a kind of volatile species easily removed [26]. It was found that the oxidation of ANs takes places very easily in the storage environments [1]. The nitridation treatment at high temperature allows the ANs to lower the oxygen content in comparison with samples treated at low temperature.

3.2. Differential Scanning Calorimetry—Thermogravimetry (DSC-TG) Analysis

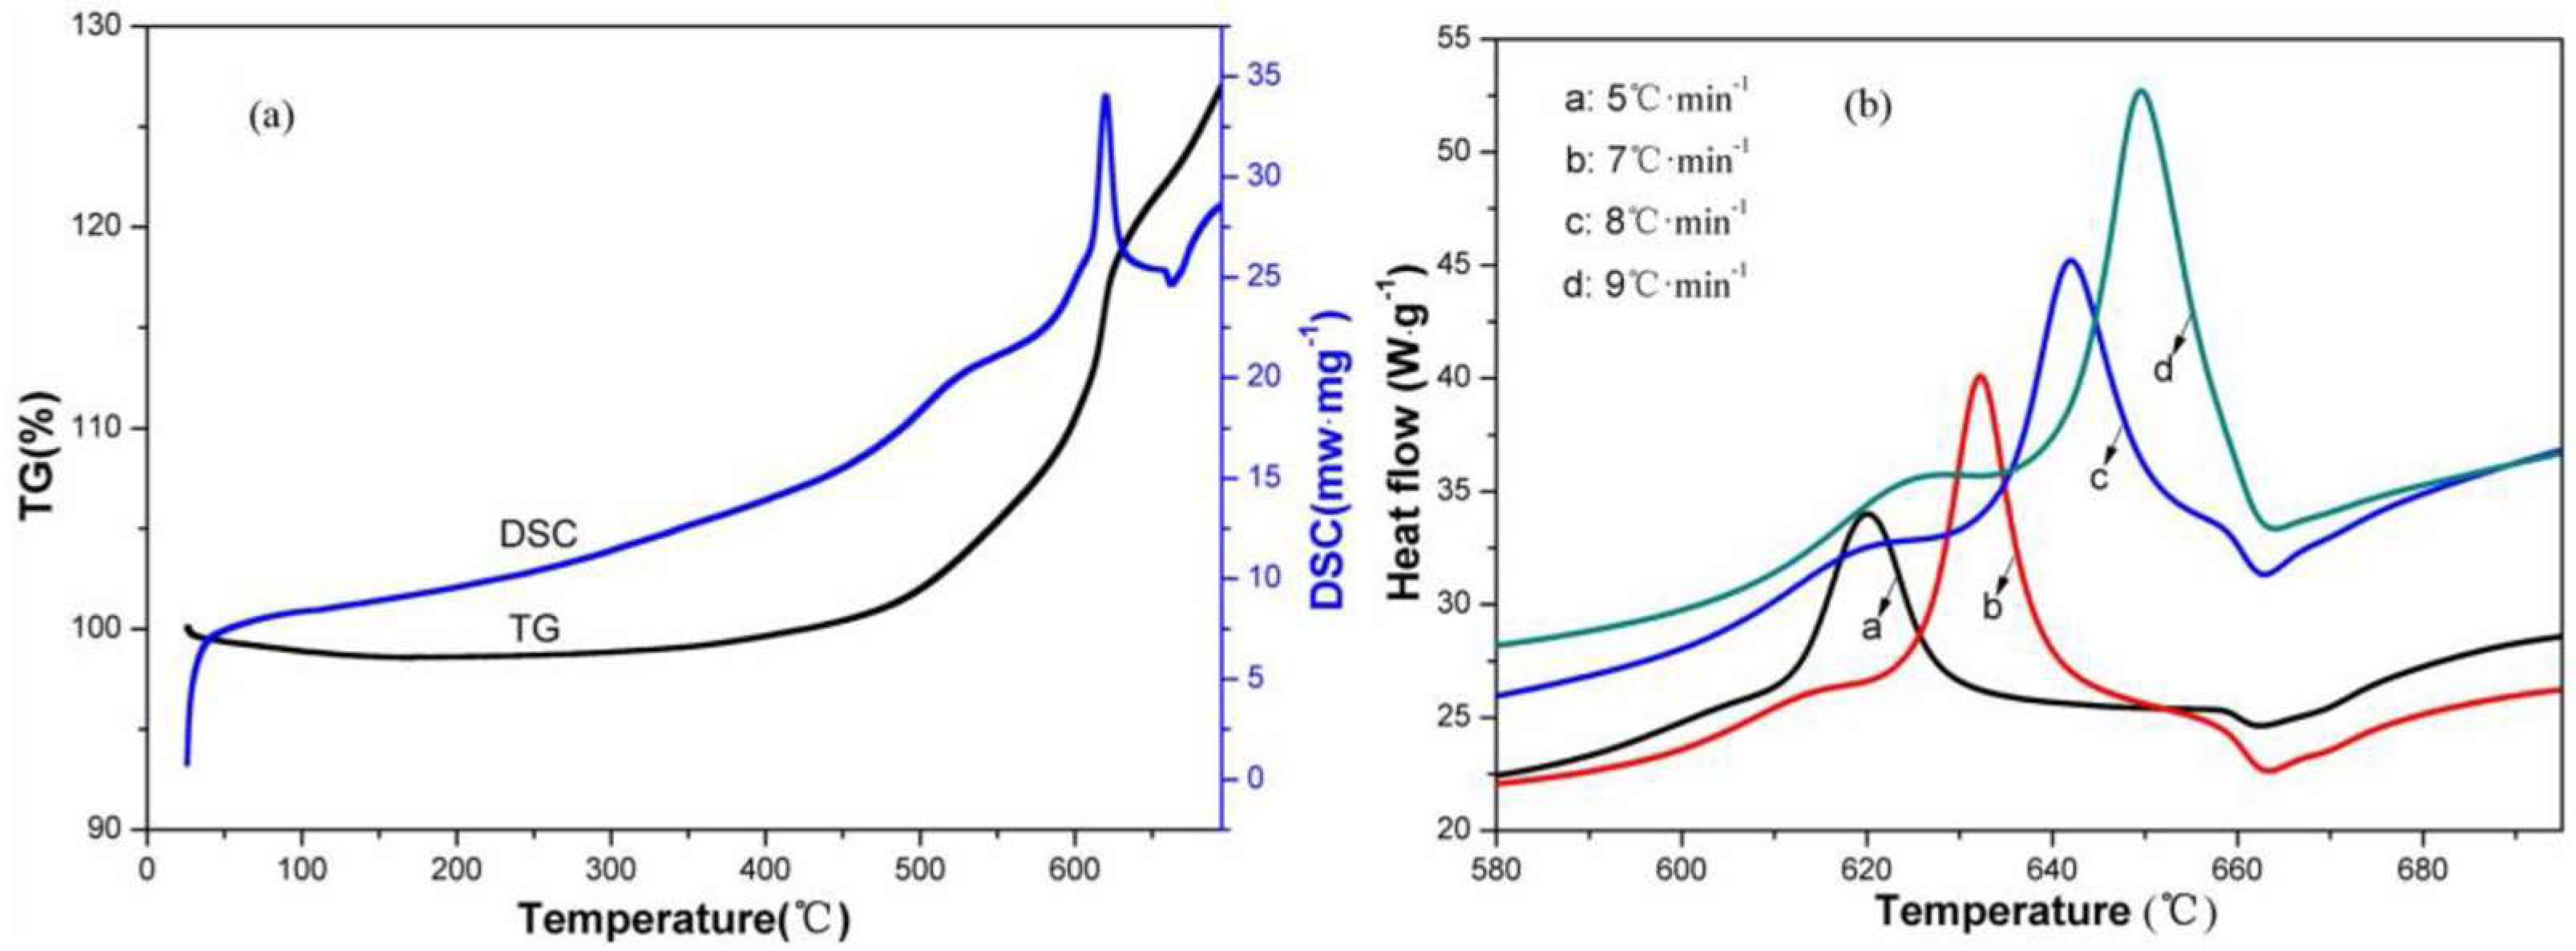
3.2.1. Study Conducted between 25 and 700 °C at Different Heating Rates

The typical DSC-TG and DSC curves under N2 flow (50 mL·min−1) at different heating rates (5, 7, 8, and 9 °C·min−1) are shown in Figure 5. The mass loss from the samples below 200 °C is mainly caused by the desorption of gaseous species and water vapor and other airborne species adsorbed on the ANs surface. As observed from Figure 5b, each DSC curve has an exothermic peak (for nitridation reaction) and an endothermic peak (for sample melting). There are three stages of mass gains (nitrogen introduction) along with the temperature increasing process, and the first stage of the nitridation rate is almost negligible.

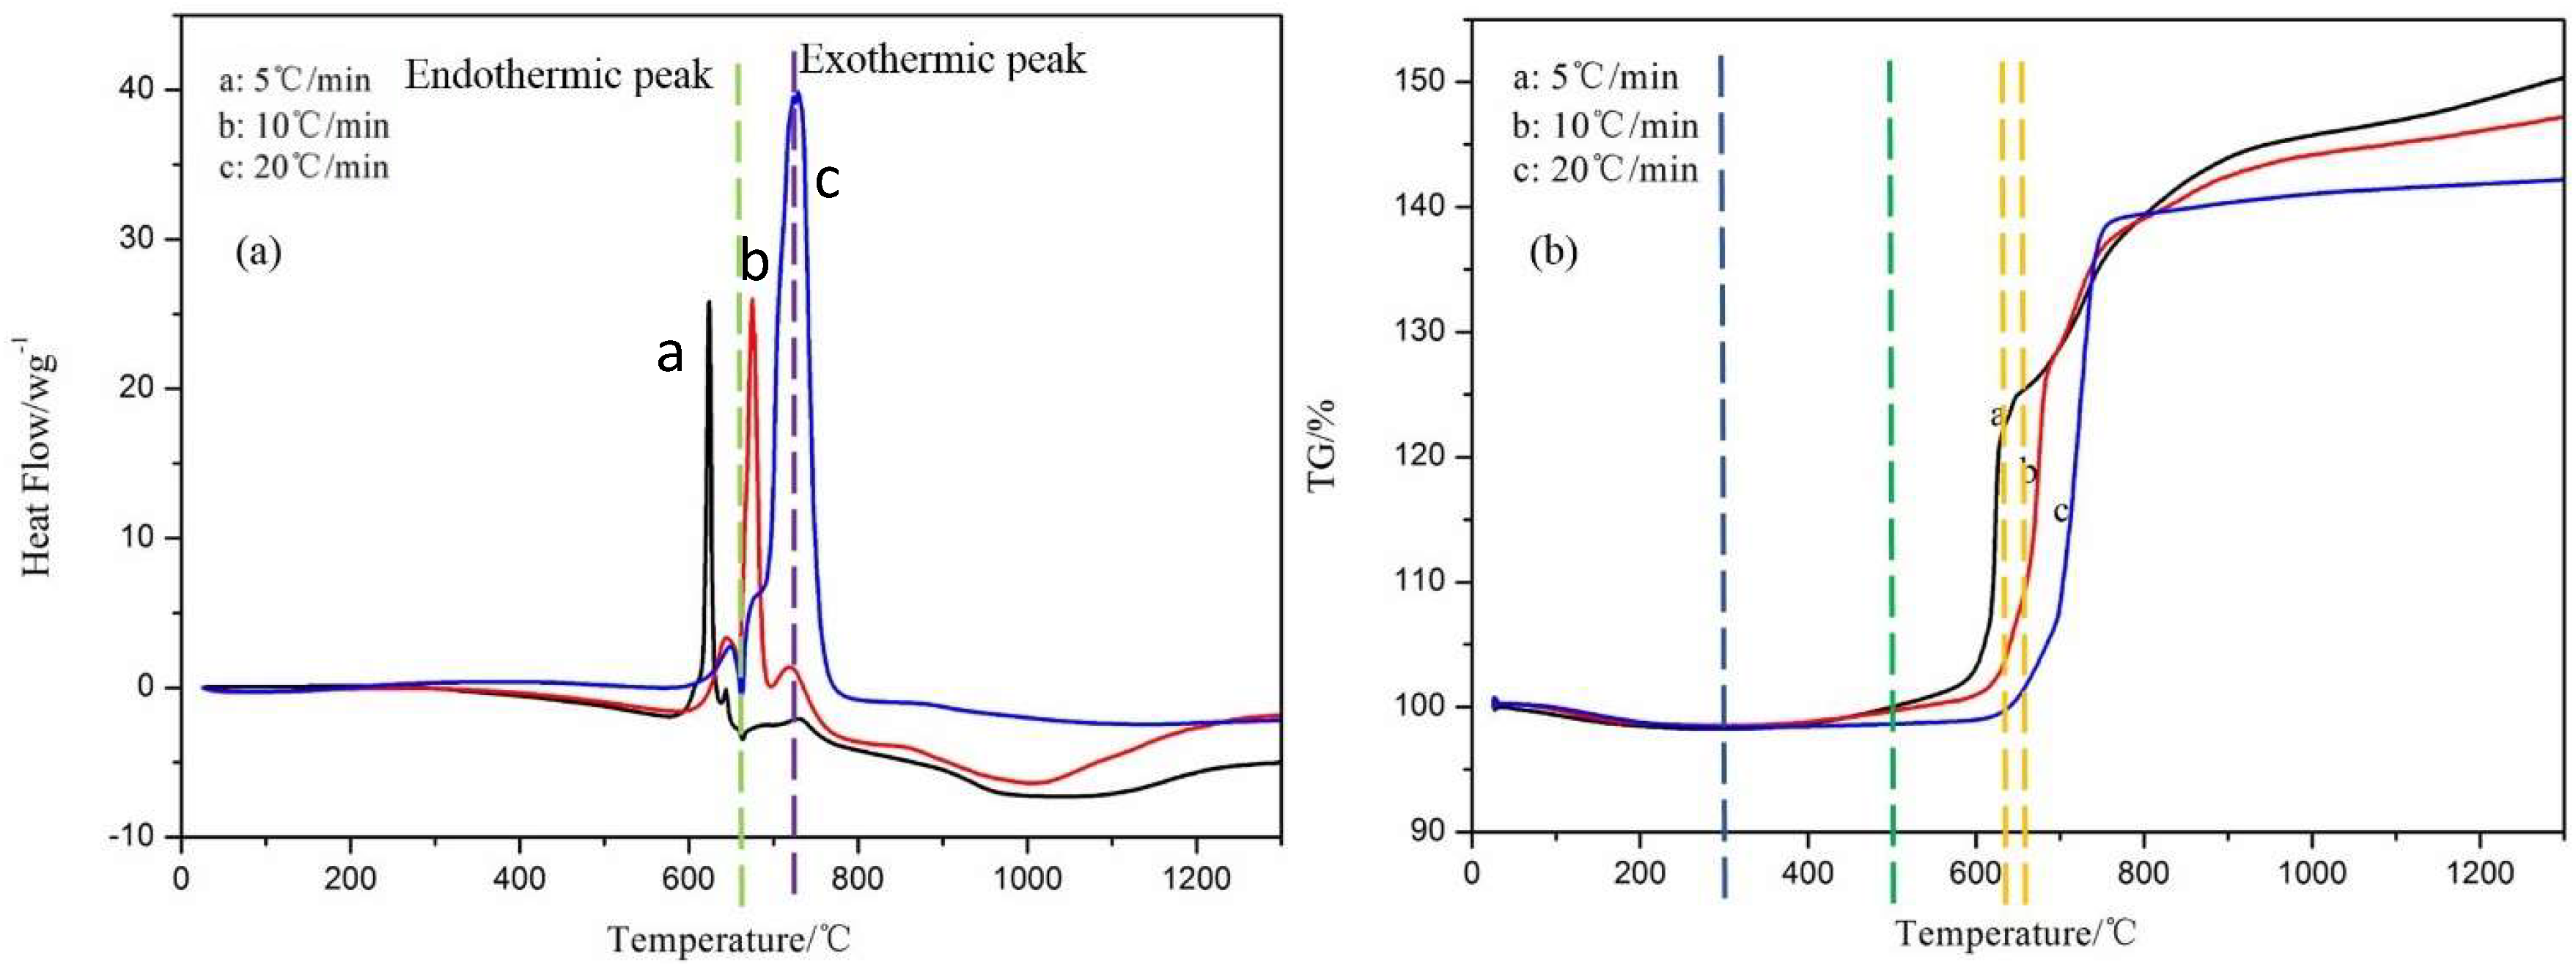
3.2.2. Study Conducted between 25 and 1300 °C

The effect of temperature increase rate on the nitridation of ANs was carried out by the DSC-TG measurements up to 1300 °C as shown in Figure 6. Each DSC-TG curve could be divided into several regions (Figure 6a), which means that the surface nitridation of the ANs took place through several thermal stages [1]. An endothermic peak at around 660 °C is caused by the melting of the ANs at a heating rate of 5 °C·min−1. It can be noted that another exothermic peak at 731 °C is due to the reaction of the remained ANs in the liquid phase with nitrogen. From the TG curves in Figure 6b, a weight loss process was observed from room temperature to 300 °C, which is due to the evolution of the absorbed H2O and other gaseous species on the nanoparticle surface. A sharp increase in the weight gain about 3% is observed in the 300–600 °C region. This is related to the introduction of nitrogen element in the heterogeneous reaction between N2 and the ANs. In the 600–638 °C range, an obvious increase of the weight (about 21%) can be observed, since the nitridation reaction occurs intensively. Then, around 4% increase of the weight is obtained in the 638~650 °C region, and the total weight gain was about 50% in the whole process, while the maximum value of the total weight gain of the ANs in nitridation is 51.85% referenced to the theoretical calculation. In comparison, the weight gains at 10 and 20 °C·min−1 were less than that at 5 °C·min−1 from the TG measurement.

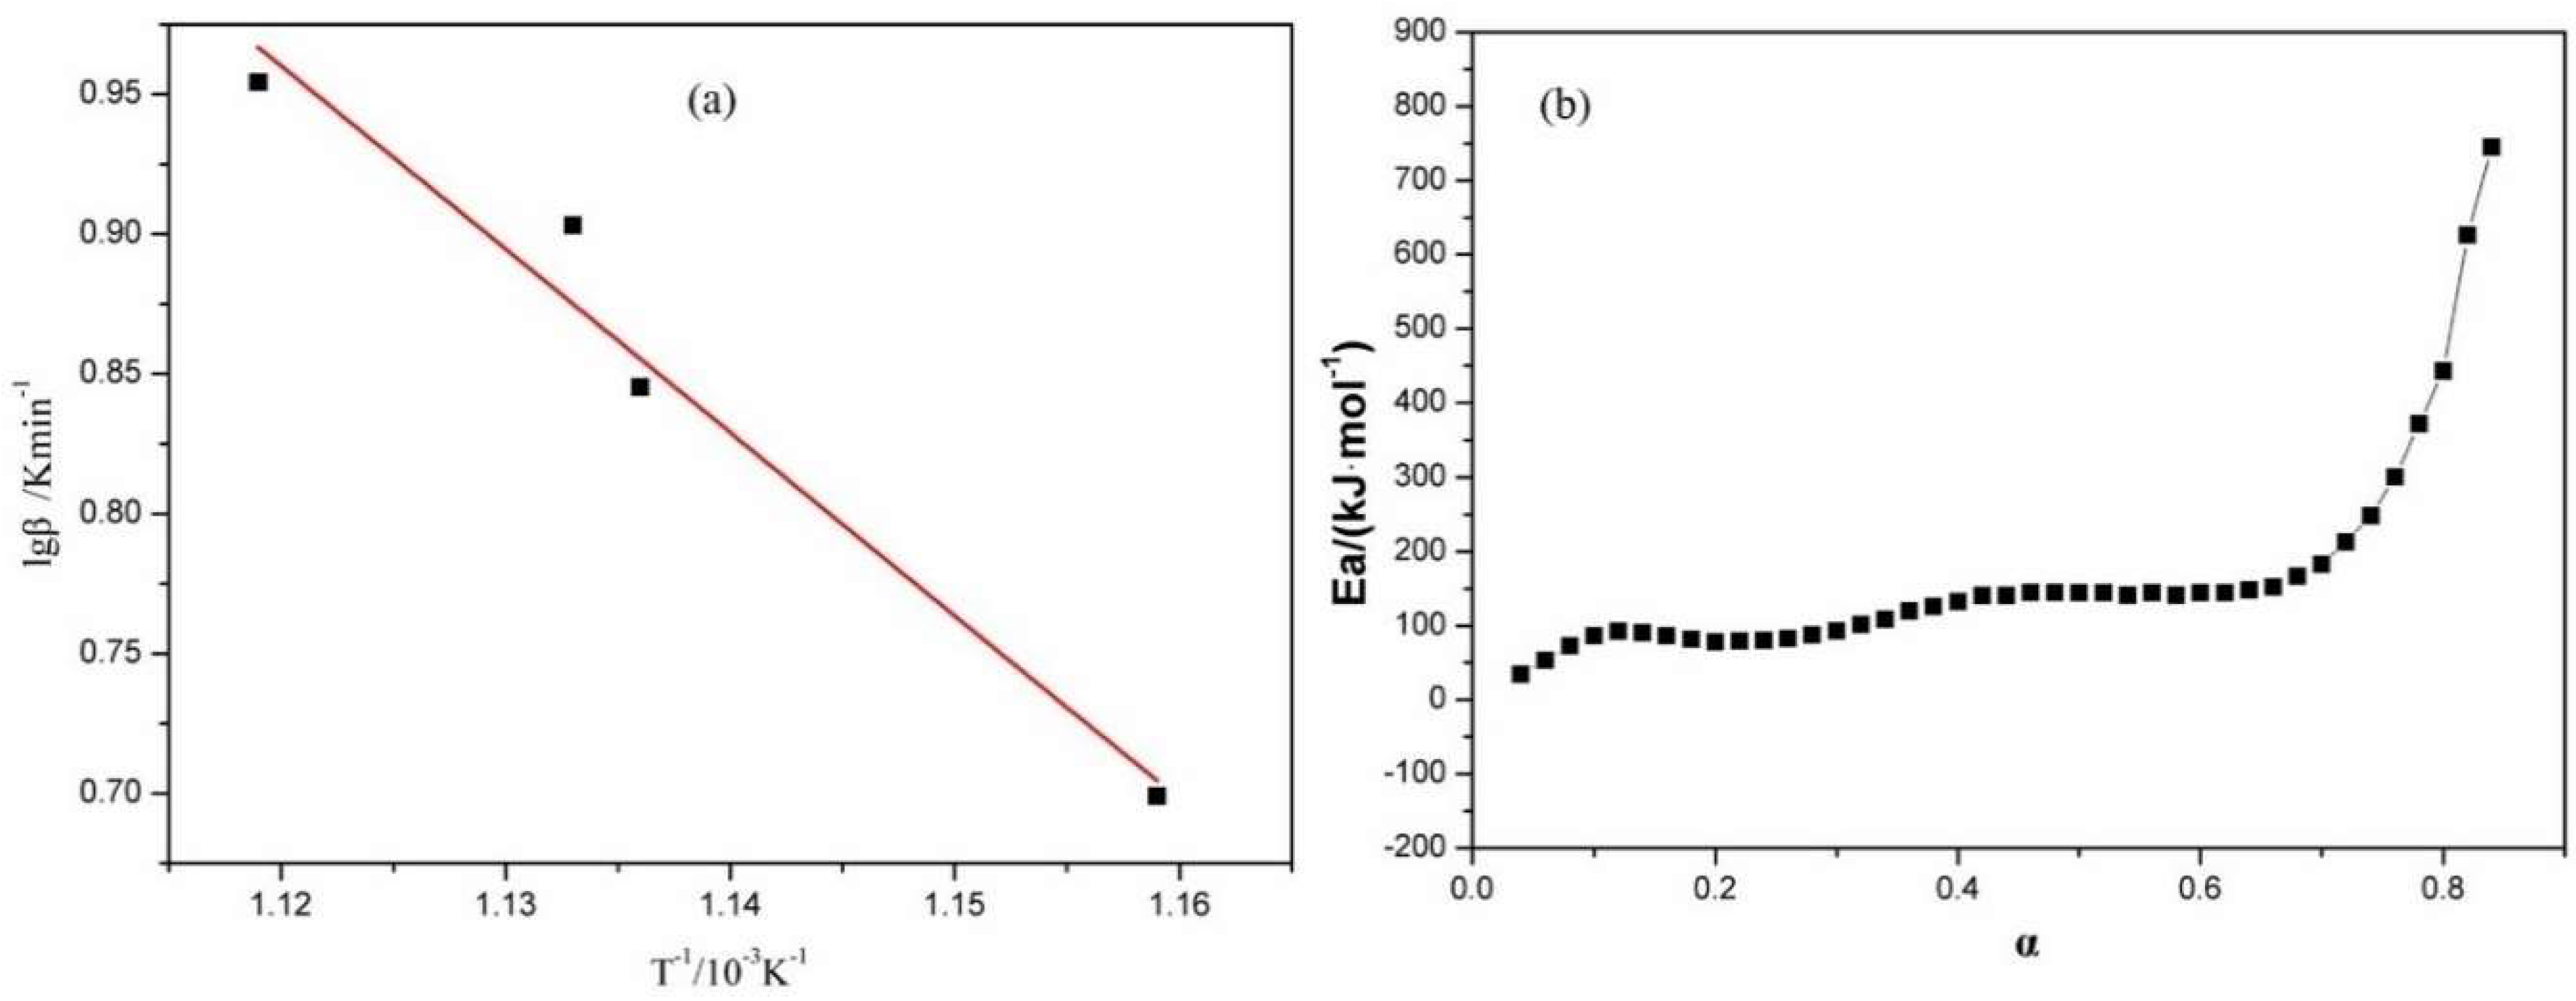
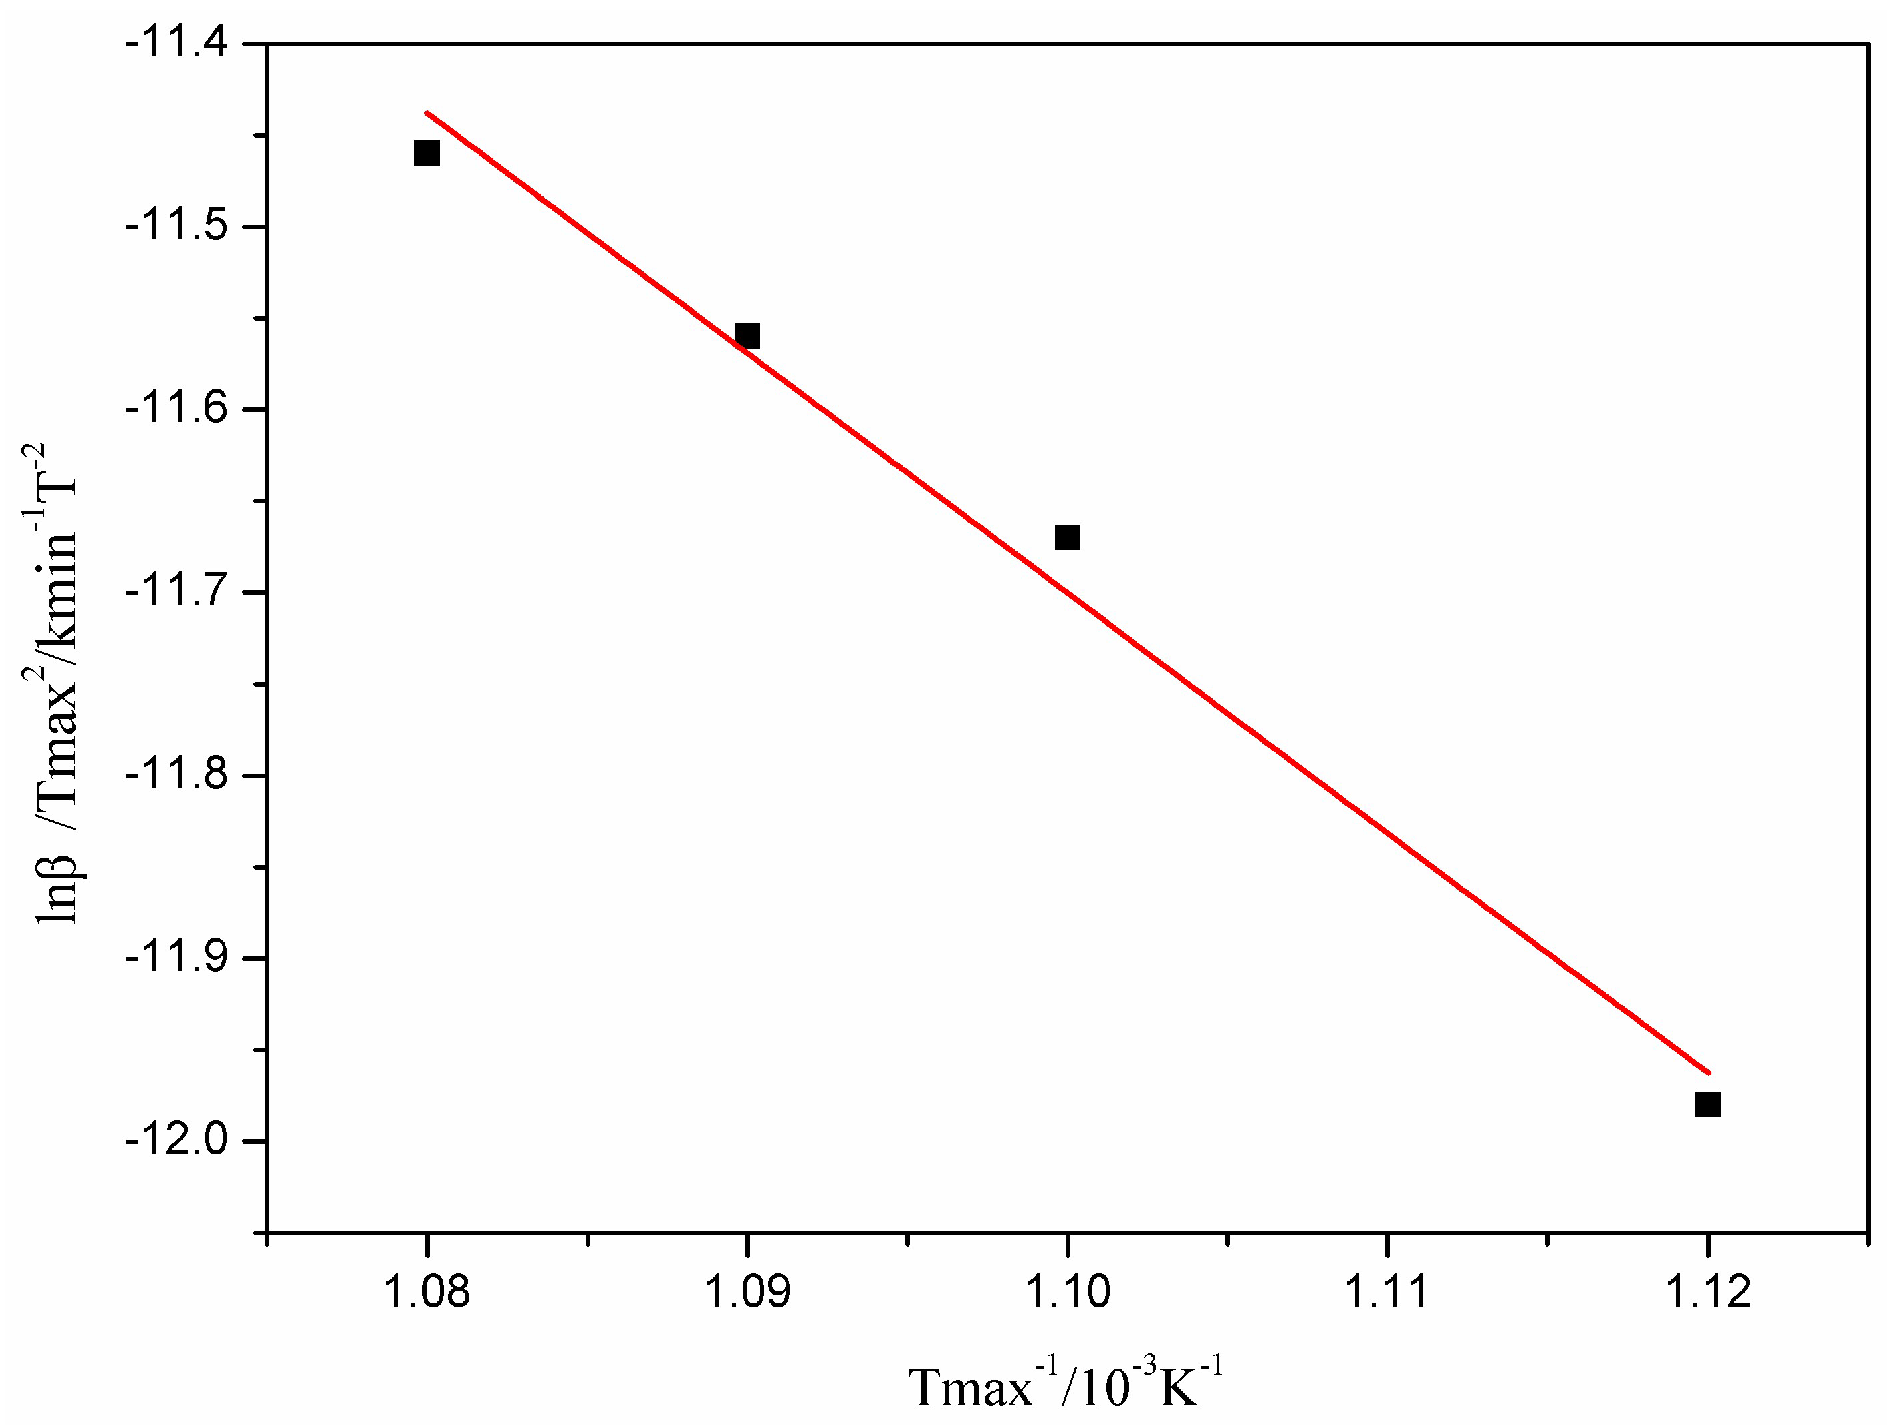
3.3. Non-Isothermal Reaction Kinetics

The non-isothermal reaction kinetics can be obtained via the TG curves. The results showed that the temperature ranging from 600–650 °C was the main stage that was responsible for the surface nitridation process. In order to obtain the kinetic triplets (apparent activation energy (Ea), the pre-exponential constant (A) and the most probable kinetic model function (f(α)), DSC measurements with heating rates at 5, 7, 8 and 9 K·min−1 were performed by five integral methods (Ordinary-Integral, MacCallum-Tanner, Satava-Setak, Agrawal, and Flynn-Wall-Ozawa) and one differential method (Kissinger). The dependence of Ea on α is an important factor, which should be studied by iso-convension methods in the first stage [27]. Table 1 presents the analysis methods for the kinetics calculation. The Ea and A values of the reaction could be obtained by the calculation based on the kinetic equation in differential form:
dα/dt = A·f(α)eEa/(RT)
The fractional reaction (α) can be determined from TG measurements by the following equation:
α = (mtmi)/(mfmi)
Herein, mt, mf, and mi are the initial, final and current sample mass, respectively. The data needed for the Ea calculations were accumulated from the DSC curves and are summarized in Table S1 (See the Supplementary Materials).
The dependence of Ea on α for the non-isothermal nitridation of the ANs is evaluated using the mentioned methods. Taking a typical example, the Ea values were obtained using the Flynn-Wall-Ozawa (F-W-O) method with α values of 0.1–0.9 and the lgβ-T−1 (lg = log10) and Ea-α relationships are shown in Figure 7. The Ea value of the reaction process changes dramatically as α increases, except in the range of α = 0.1–0.7, which is almost constant. It is, therefore, feasible to study the reaction mechanism and kinetics over this range. The T-α dependence is introduced into the following equation:
lgβ = lg[AE/RG(α)] − 2.315 − 0.4567 E/RT
and the fitting result is indicated in Figure 7a as setting the temperature reciprocal (K−1) as the horizontal coordinate and the logarithm of the temperature increasing rate (lgβ) as the Y-axis. The K value of −6.525855 is obtained from the slope value of the fitting result with a linearly dependent coefficient (R) as −0.9994. In this case, the average Ea value is calculated as 118.8 kJ·mol−1 according to −0.4567 E/RT = −6.525855. The dependence of Ea on α is indicated in Figure 7b.
Kissinger method [28], as one differential method, was used for the Ea value calculation. The linear fitting result using Equation (4) with R as −0.9998 and K as −13.11429 is indicated in Figure 8.
ln ( β i / T p i 2 ) = ln ( A R / E ) E / R T p i , i = 1 , 2 , 3 , 4
The plot obtained by ln(βi/Tpi2) versus 1/Tpi could give the Ea value as the slope and the A value as the intercept. Then Ea = 13.11429×8.314 = 109.03 kJ·mol−1 can be directly obtained by −E/RT = −13.11429.
The Ea values calculation by other integral methods (Kissinger, Agrawal, Ordinary-Integral, MacCallum-Tanner, and Satava-Setak) were also performed and the results are summarized in the supplementary information. Forty-one kinds of mechanism functions [28] describing the single non-isothermal DSC curves and the T-α data in Table S1 (Supplementary Materials) were introduced and tested in the equations in Table 1, and the values of the Ea, lgA, r (linearly dependent coefficient), and Q (square error) were obtained by the least square method at different heating rates (5, 7, 8, and 9 °C ·min−1). The calculated kinetic parameters by different methods are listed in Table 2 with further details. The obtained data suggest that the possible kinetic mechanism of the ANs nitridation process could be determined by the Mampel Power Law with n = 3/2, according to the principle of the multiple scanning method (Kissinger) and the iso-conversion method [29]. The relative integral equation is
G(α) = α3/2
with the corresponding differentiation equation given by (Equation (6))
f ( α ) = 2 3 α 1 / 2
Since the reaction mechanism obeys Mampel Power law with n = 3/2, the kinetic equation can be expressed as
d α d t = 10 3.28 α 1 / 2 e 13439.9 / T
Non-isothermal nitridation, instead of isothermal nitridation could be used to determine the activation energy [24]. The combustion properties, such as stability, reactivity, and ignition delay of ANs are greatly changed in comparison with the original ANs [30]. This coating method does not require additional purification treatments. Furthermore, this technique of surface coating by nitrogen protection before they interact with air, could effectively improve the reaction rate. Through this unique study, the mechanism for the surface nitridation of ANs will be deeply disclosed. In this research, the nitridation parameters (such as heating rate, treatment temperature, power and gas supplies) were properly set according to the kinetic study. A summary of the kinetic study shows that (1) the heating rate β may be more reasonable when it was set at 5–9 °C·min−1; (2) A favorable initial reaction temperature (T0) should be quickly reached in the nitridation operation; (3) The nitridation temperature T plays an important role in the generated AlN thickness.
Temperature, treatment time, and additives are key factors for the surface nitridation in the off-line operation. The ANs normally have an aluminum oxide coating at 10−3 μm scale [24] that could be greatly removed from the nitridation process. The heat releasing efficiency of the product in the oxidation process may be higher than that associated with regular Al nanoparticles, thus, promoting the heat flux to the propellant materials.

4. Conclusions

Surface nitridation of ANs was successfully performed by an off-line operation protected by nitrogen gas in a sealed system. A core-shell nanostructure was obtained with an AlN shell of 6–7 nm width. The size and shape of the nitridated nanoparticles are almost as same as the original ones. A correlation of the treatment temperature on the elemental contents of the coating process was observed. The effect of the heating rate on the nitridation was estimated. Thermal and TGA analysis have been performed to investigate the surface nitridation process. A rapid weight gain of ANs in nitrogen gas was found in 600–638 °C range identified as the main stage for the nitridation process. The ANs showed higher weight gain at higher temperatures. Non-isothermal nitridation analysis was carried out at different heating rates under nitrogen protection. The Ea value was obtained through the DSC-TG measurements and calculated using 5 types of integral methods and a differentiation method. The kinetic triplets calculated depending on the DSC-TG data indicated that kinetic mechanism obeys the Mampel Power Law where the nucleation is the rate-determining step. The generated AlN coatings could prevent metal oxidation and increase the combustion efficiency in propellants and prolong the working life of the enclosed metal cores.

Supplementary Materials

The following are available online at https://www.mdpi.com/2075-4701/8/4/289/s1, Figure S1: XRD of the nitridation-treatment sample (600 °C) after placement in air for 1 h, Figure S2: Ea calculations by Ordinary-Integral, MacCallum-Tanner, Satava-Setak methods according to Agrawal method, Table S1: Reactivity parameters obtained from the TG measurements for the surface nitridation calculation.

Acknowledgments

The authors warmly thank the financial supporting from the Experimental Technology Project (20170209) of Sichuan University, and for the financial support from the open project program of key laboratory of photochemical conversion and optoelectronic materials, TIPC, CAS (PCOM201603).

Author Contributions

Yong Yi and Dai Li designed and performed the nitridation experimental details and the kinetic analysis; Daichuan Ma completed the data calculations of the kinetic triplets; Daibing Luo wrote the main article and provided guidance to the whole experimental process; Weizhong Yang and Wangjing Ma revised the paper and gave suggestions and modifications.

Conflicts of Interest

The authors declare no conflicts of interest.

References

  1. Mench, M.M.; Kuo, K.K.; Yeh, C.L.; Lu, Y.C. Comparison of thermal behavior of regular and ultra-fine aluminum powders (Alex) made from plasma explosion process. Combust. Sci. Technol. 1998, 135, 269–292. [Google Scholar] [CrossRef]
  2. Kwon, Y.S.; Gromov, A.A.; llyin, A.P.; Rim, G.H. Passivation process for superfine aluminum powders obtained by electrical explosion of wires. Appl. Surf. Sci. 2003, 211, 57–67. [Google Scholar] [CrossRef]
  3. Sarathi, R.; Sindhu, T.K.; Chakravathy, S.R. Impact of binary gas on nano-aluminium particle formation through wire explosion process. Mater. Lett. 2007, 61, 1823–1826. [Google Scholar] [CrossRef]
  4. Gromov, A.A.; Förter-Barth, U.; Teipel, U. Aluminum nanopowders produced by electrical explosion of wires and passivated by non-inert coatings: Characterisation and reactivity with air and water. Powder Technol. 2006, 164, 111–115. [Google Scholar] [CrossRef]
  5. Farhat, Z.N.; Ding, Y.; Northwood, D.O.; Alpas, A.T. Effect of grain size on friction and wear of nanocrystalline aluminum. Mater. Sci. Eng. A 1996, 206, 302–313. [Google Scholar] [CrossRef]
  6. Laha, T.; Agarwal, A.; Mckechnie, T.; Rea, K.; Seal, S. Synthesis of bulk nanostructured aluminum alloy component through vacuum plasma spray technique. Acta Mater. 2005, 53, 5429–5438. [Google Scholar] [CrossRef]
  7. Abdoli, H.; Ghanbari, M.; Baghshahi, S. Thermal stability of nanostructured aluminum powder synthesized by high-energy milling. Mater. Sci. Eng. A 2011, 528, 6702–6707. [Google Scholar] [CrossRef]
  8. Zhao, K.Y.; Li, C.J.; Tao, J.M.; Ng, D.H.L.; Zhu, X.K. The synthesis, microstructure, hardness and thermal properties of bulk nanocrystalline Al produced by in situ consolidation with low-energy ball milling. J. Alloys Compd. 2010, 504, S306–S310. [Google Scholar] [CrossRef]
  9. Cai, B.; Kong, Q.P.; Cui, P.; Cong, H.T.; Sun, X.K. Internal friction of nanocrystalline aluminum prepared by plasma evaporation and compaction. Scr. Mater. 2001, 44, 1043–1048. [Google Scholar] [CrossRef]
  10. Hung, P.C.; Sun, P.L.; Yu, C.Y.; Kao, P.W.; Chang, C.P. Inhomogeneous tensile deformation in ultrafine-grained aluminum. Scr. Mater. 2005, 53, 647–652. [Google Scholar] [CrossRef]
  11. Alihosseini, H.; Zaeem, M.A.; Dehghani, K.; Shivaee, H.A. Producing ultrafine-grained aluminum rods by cyclic forward-backward extrusion: Study the microstructures and mechanical properties. Mater. Lett. 2012, 74, 147–150. [Google Scholar] [CrossRef]
  12. Lei, H.L.; Tang, Y.J.; Li, J.; Luo, J.S.; Li, X.B. In situ organic coating of metal nanoparticles. Appl. Phys. Lett. 2006, 88, 083111. [Google Scholar] [CrossRef]
  13. Foley, T.J.; And, C.E.J.; Higa, K.T. Inhibition of oxide formation on aluminum nanoparticles by transition metal coating. Chem. Mater. 2005, 17, 4086–4091. [Google Scholar] [CrossRef]
  14. Guo, L.; Song, W.; Xie, C.; Zhang, X.; Hu, M. Characterization and thermal properties of carbon-coated aluminum nanoparticles prepared by laser-induction complex heating in methane. Mater. Lett. 2007, 61, 3211–3214. [Google Scholar] [CrossRef]
  15. Tillotson, T.M.; Gash, A.E.; Simpson, R.L.; Hrubesh, L.W.; Satcher, J.H., Jr.; Poco, J.F. Nanostructured energetic materials using sol–gel methodologies. J. Non-Cryst. Solids 2001, 285, 338–345. [Google Scholar] [CrossRef]
  16. Kwon, Y.S.; Gromov, A.A.; Llyin, A.P. Reactivity of superfine aluminum powders stabilized by aluminum diboride. Combust. Flame 2002, 131, 349–352. [Google Scholar] [CrossRef]
  17. Jouet, R.J.; Warrent, A.D.; Rosenberg, D.M.; Bellitto, V.J.; Park, K.-H.; Zachariah, M.R. Surface passivation of bare aluminum nanoparticles using perfluoroalkyl carboxylic acids. Chem. Mater. 2005, 17, 2987–2996. [Google Scholar] [CrossRef]
  18. Mary, B.; Dubois, C.; Carreau, P.J.; Brousseau, P. Rheological properties of suspensions of polyethylene-coated aluminum nanoparticles. Rheol. Acta 2006, 45, 561–573. [Google Scholar] [CrossRef]
  19. Guo, L.; Song, W.; Hu, M.; Xie, C.; Chen, X. Preparation and reactivity of aluminum nanoparticles coated by hydroxyl-terminated polybutadiene. Appl. Surf. Sci. 2008, 254, 2413–2417. [Google Scholar] [CrossRef]
  20. Lee, S.H.; Yi, J.H.; Kim, J.H.; Ko, Y.N.; Hong, Y.J.; Kang, Y.C. Preparation of nanometer AlN powders by combining spray pyrolysis with carbothermal reduction and nitridation. Ceram. Int. 2011, 37, 1967–1971. [Google Scholar] [CrossRef]
  21. Weimer, A.W.; Cochran, G.A.; Eisman, G.A.; Henley, J.P.; Hook, B.D.; Mills, L.K.; Guiton, T.A.; Knudsen, A.K.; Nichols, N.R.; Volmering, J.E.; et al. Rapid process for manufacturing aluminum nitride powder. J. Am. Ceram. Soc. 1994, 77, 3–8. [Google Scholar] [CrossRef]
  22. Hou, X.; Chou, K.C.; Zhang, X.; Seetharaman, S. Oxidation kinetics of aluminum nitride at different oxidizing atmosphere. J. Alloys Compd. 2008, 465, 90–96. [Google Scholar] [CrossRef]
  23. Hou, X.M.; Yue, C.S.; Singh, A.K.; Zhang, M.; Chou, K.C. Morphological development and oxidation mechanisms of aluminum nitride whiskers. J. Solid State Chem. 2010, 183, 963–968. [Google Scholar] [CrossRef]
  24. Hasani, S.; Panjepour, M.; Shamanian, M. Non-isothermal kinetic analysis of oxidation of pure aluminum powder particles. Oxid. Met. 2014, 81, 299–313. [Google Scholar] [CrossRef]
  25. Fryt, E.M. Application of the Rosenburg kinetic method for determination of the parabolic rate constants for metal oxidation. Oxid. Met. 1978, 12, 139–156. [Google Scholar] [CrossRef]
  26. Linevsky, M.J.; White, D.; Mann, D.E. Infrared spectrum and structure of gaseous Al2O. J. Chem. Phys. 1964, 41, 542–545. [Google Scholar] [CrossRef]
  27. Vyazovkin, S.V.; Lesnikovich, A.I.; Goryachko, V.I. A method of comparing kinetic curves obtained under isothermal and nonisothermal. Thermochim. Acta 1990, 165, 259–264. [Google Scholar] [CrossRef]
  28. Kissinger, H.E. Reaction kinetics in differential thermal analysis. Anal. Chem. 1957, 29, 1702–1706. [Google Scholar] [CrossRef]
  29. Kuo, K.K.; Deluca, L.T. Combustion of Energetic Materials; Begell House Inc.: New York, NY, USA, 2001. [Google Scholar]
  30. Sossi, A.; Duranti, E.; Paravan, C.; Deluca, L.T.; Vorozhtsov, A.B.; Gromov, A.A.; Pautova, Y.I.; Lerner, M.I.; Rodkevich, N.G. Non-isothermal oxidation of aluminum nanopowder coated by hydrocarbons and fluorohydrocarbons. Appl. Surf. Sci. 2013, 271, 337–343. [Google Scholar] [CrossRef]
Figure 1. Photograph of the nitridation setup.
Metals 08 00289 g001
Figure 2. (a) Transmission electron microscopy (TEM) image of the aluminum nanoparticles (ANs) after surface nitridation at 550 °C; (b) TEM with higher resolution for segmental magnification, and (c) Surface elemental distribution with color indication: Al (red), N (green), and O (blue). Noting that a slight color aberration may be observed on a nanosphere structure due to the difference of trap depth energy of the TEM detection; (d) A peak at 401 eV characteristic of nitrogen.
Metals 08 00289 g002
Figure 3. X-ray diffraction (XRD) patterns of the aluminum nanoparticles (ANs) after surface nitridation at different treatment temperature from bottom to top (black: 560 °C), (red: 570 °C), (blue: 580 °C), and (rose: 600 °C) respectively.
Metals 08 00289 g003
Figure 4. (a) X-ray photoelectron spectroscopy (XPS) of the ANs after surface nitridation, and higher resolution recording at (b) 393–406 eV for N observation and (c) 525–538 eV region for O observation.
Metals 08 00289 g004
Figure 5. (a) DSC-TG curves with a heating rate at 5 °C·min−1; (b) DSC curves at different heating rates (5, 7, 8, 9 °C·min−1).
Metals 08 00289 g005
Figure 6. Differential scanning calorimetry—thermogravimetry (DSC-TG) curves for aluminum nanoparticles at different heating rates (i.e., 5, 10, 20 °C·min−1). (a) Differential scanning calorimetry (DSC), (b) Thermogravimetry (TG) curves. The peak characterization and thermal stages are marked with dot line with different colors.
Metals 08 00289 g006
Figure 7. (a) Scatter plots and linear regression curves of lgβ-T−1; (b) Ea-α curve obtained by the F-W-O method with R= −0.9994.
Metals 08 00289 g007
Figure 8. Scatter plots and linear regression curves of 1/Tmax − lnβ/Tmax2.
Metals 08 00289 g008
Table 1. Kinetic analysis methods.
MethodEquation
Ordinary-Integral ln [ G ( α ) / T 2 ] = ln [ ( A R / β ) ( 1 2 R T / E ) ] E / R T (1)
MacCallum-Tanner lg [ G ( α ) ] = lg [ ( A E / β R ) ] 0.4828 E 0.4357 ( 0.449 + 0.217 E ) / ( 0.001 T ) (2)
Satava-Setak lg [ G ( α ) ] = lg ( A E / β R ) 2.315 0.4567 E / R T (3)
Agrawal ln [ G ( α ) / T 2 ] = ln { ( A R / β E ) [ 1 2 ( R T / E ) ] / [ 1 5 ( R T / E ) 2 ] } E / R T (4)
Flynn-Wall-Ozawa lg β = lg { A E / [ R G ( α ) ] } 2.315 0.4567 E / R T (5)
Kissinger ln ( β i / T p i 2 ) = ln ( A R / E ) E / R T p i , i = 1 , 2 , 3 , 4 (6)
Parameters: α: transformation efficiency; T: temperature at time t; R: gas constant; A: pre-exponential factor; E (Ea): apparent activation energy; β: heating rate; G(α): integral model function; Tp: peak temperature in the DSC curve.
Table 2. Kinetic parameters of the surface nitridation of ANs.
Methodβ/(°C·mol−1)Ea/(kJ·mol−1)lg(A·S−1)rQ
Ordinary-Integral5102.182.710.99760.1220
7117.593.710.99810.3198
8102.272.780.99750.1981
9117.623.690.99810.4535
MacCallum-Tanner5103.292.880.99620.0237
7115.613.960.99600.0615
8103.062.900.99610.0385
9114.683.610.99670.0594
Satava-Sestak5110.403.540.99760.0134
7125.284.430.99810.0241
8110.713.860.99750.0202
9125.484.420.99810.0873
Agrawal5102.182.710.99760.1220
7117.593.710.99810.3198
8102.272.780.99750.1981
9117.623.690.99810.4535
Mean-111.743.46--
Flynn-Wall-Ozawa-118.8-0.9994-
Kissinger-109.035.20.9998-

