Abstract
Weld defects such as blowholes and surface pores occur due to zinc vaporization during the gas metal arc welding of lap fillet joints of Zn-coated steel. In this study, the effect of porosity on fatigue behavior was investigated. A Zn-coated steel sheet with the strength of 590 MPa and a thickness of 2.3 mm was used as the base material. Three kinds of specimens with weld pore defects, such as blowholes and surface pores, were prepared and the tensile shear strength, hardness and fatigue behavior were investigated. The pore defects in the welds reduced the tensile shear strength. In the fatigue test, at higher load stresses between 122 and 366 MPa, pore defects reduced the fatigue life of the weld. However, the pore defects in the welds did not significantly affect the fatigue life of the welds at stresses below 92 MPa.
1. Introduction
As Zn-coated steel sheets have excellent corrosion resistance, they are widely applied to automobile chassis and body parts. Chassis and body parts are mainly manufactured via arc welding with a lap fillet joint. In the case of Zn-coated steel sheet, Zn is vaporized using arc heat during arc welding with a lap fillet joint and is trapped in the weld, resulting in weld defects owing to pores [1,2]. If defects such as pores are generated in the weld, it is reported that the mechanical properties such as tensile strength are degraded [3]. Therefore, extensive research has been carried out to understand the cause of pore generation in the arc welding of Zn-coated steel sheet and to reduce the pores in the weld. Tatsui et al. [4] reported that vaporized Zn can easily escape from the molten pool to the outside if the molten pool is vibrated during the arc welding of galvanized steel sheets. Yuan et al. [5] applied a hybrid tandem metal active gas (MAG) process to a primer-coated steel plate to remove the Zn layer by sufficient penetration in the leading MAG and to form a sound weld in the trailing MAG. Using this hybrid tandem MAG process, the pores in the welds were reduced. Izutani et al. [6] developed a new welding wire and designed a pulsed waveform for the arc welding of galvanized steel sheets to reduce the pores in the weld.
Chassis components to which Zn-coated steel sheet is applied are mostly parts supporting the whole load of the car such as the lower arm, cross member and center frame and are subjected to repeated fatigue load when the vehicle is running. This results in fatigue failure in the arc welds of chassis components subjected to repeated fatigue loads. Therefore, extensive research has been carried out on the fatigue behavior of arc welding with a lap fillet joint applied to automobile parts. Lee et al. [7] quantified the fatigue strength of arc-welded joints for 440, 590 and 1470 MPa grade steel sheets to investigate the fatigue behavior and proposed a method to improve the fatigue life of welded parts. Koganti et al. [8] reported the fatigue behavior of the arc weld of dual-phase (DP) 780 MPa grade steel. Chung et al. [9] studied the fatigue behavior of DP 780 MPa grade steel for various weld shapes using lap fillet joint arc welding. Feng et al. [10] studied the fatigue behavior of welding parts via the arc welding of lap fillet joint for DP 600 MPa grade steel. Hwang et al. [11] investigated the fatigue behavior of lap fillet weld joints using three welding processes—tandem MAG, direct current (DC) and DC pulse—for a galvanealed (GA) 590 MPa grade ferrite-bainite (FB) steel sheet. Kim et al. [12] investigated the effect of weld bead shape on weld fatigue strength using the tandem MAG welding process for GA 590 MPa steel sheets. The fatigue strength and life of the weld obtained using tandem MAG were higher than those of the welds obtained using DC and DC pulse welding processes owing to the difference of weld bead shape. In addition, Basak et al. [13] evaluated the effect of process parameters on the high cycle fatigue behavior of a metal inert gas (MIG)-brazed lap joint in a galvanized DP 600 steel sheet using a Cu-Al filler wire.
However, most previous studies on the fatigue behavior of arc welds of lap fillet joints could not elucidate the relationship between weld defects and fatigue behavior. There have been several studies on the correlation between weld defects and fatigue behavior of arc welds with butt joint geometry. Potluri et al. [14] conducted arc welding on a butt joint of Al 7005 alloy and reported the relationship between weld defect and fatigue behavior. Robakowski et al. [15] studied the fatigue behavior according to internal defects of the weld in a butt joint. Lazzarin focused on the theoretical studies of stress fields near notches and the fatigue behavior of materials [16,17]. It was reported that the mode I notch stress intensity factor can be directly used to assess the fatigue strength of fillet-welded joints of different geometries [16]. Further, fatigue stresses were studied for the keyhole notch of a lap fillet joint using finite-element-based modeling [17]. Although there have many studies on the fatigue behavior of welds with the shape of a lap fillet joint, studies investigating the effect of a pore on the fatigue behavior of welds of GA steel sheets with the lap fillet joint shape are scarce.
Therefore, this study focused on investigating the relationship between weld defects, such as blowholes and surface pores and the fatigue behavior of an arc-welded lap fillet joint using GA 590 MPa grade steel sheets. The fatigue test was carried out by classifying the welded specimens according to the presence of surface pores and blowholes in the welds. Fatigue stress was re-calculated by measuring the actual cross-sectional area except for the defect of the weld. Furthermore, the effect of porosity on the fatigue behavior of the lap fillet joint welds was discussed.
2. Experimental Procedures
2.1. Base Materials and Welding Wire
In this study, GA 590 MPa grade FB steel sheets, which are used as a component in the cross-member of chassis, were used as the base material, with thickness 2.3 mm. The coating amount of one side of the base material was 43.8 g/m2. The chemical compositions and mechanical properties of the base material are listed in Table 1. The filler wire for gas metal arc welding (GMAW) was the AWS A5.18 ER70S-3 standard wire with a diameter of 1.2 mm, whose chemical composition and mechanical properties are listed in Table 2.

Table 1.
Chemical composition and mechanical properties of the base material.
Table 2.
Chemical composition and mechanical properties of the filler wire.
2.2. Welding Conditions
The size of the welded specimen used in this study was 300 mm × 150 mm as shown in Figure 1. The weld joint is shaped like a lap fillet joint; the overlap length is 25 mm and is selected perpendicular to the gravity direction. The welding conditions are presented in Table 3. In this study, the welding condition was selected such that the failure of the base material occurred during the tensile test and the burn-through did not occur during welding. The welding process was the DC process, the welding current was 237 A and the welding voltage was 22.7 V. GMAW was performed under the conditions of a wire feeding speed of 7.0 m/min, a welding speed of 80 cm/min, a work angle of 45° and a shielding gas composition of 90% Ar + 10% CO2. To achieve reliable test results, the welding was repeated 10 times and the results were analyzed.
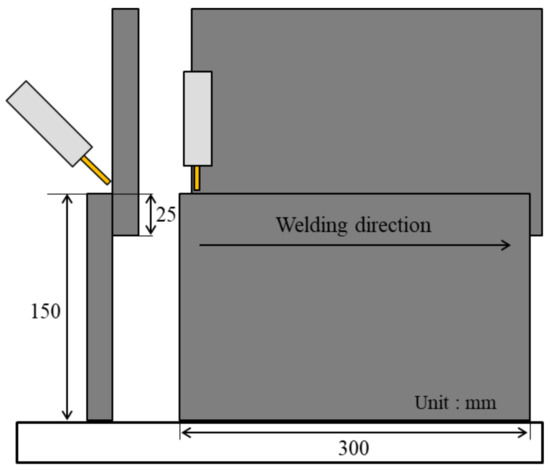
Figure 1.
Welding joint geometry.
Table 3.
Welding conditions applied in this study.
2.3. Preparation of the Fatigue Test Specimen
One hundred fatigue test specimens were prepared in accordance with ASTM E-466 [18] specification using 10 specimens welded at a length of 300 mm. Figure 2 shows the schematic diagram of the fatigue specimen. As shown in Figure 3, the specimens obtained after arc welding were classified into three types according to defect types via the visual and radiography analysis of welds. In the first case, the defect does not occur outside the weld zone but occurs inside (① blowhole); in the second case, the defect is detected from the outside owing to the growth of the pore inside the weld zone (② surface pore); in the third case, the defect occurs neither inside nor outside of the weld zone (③ no defect).
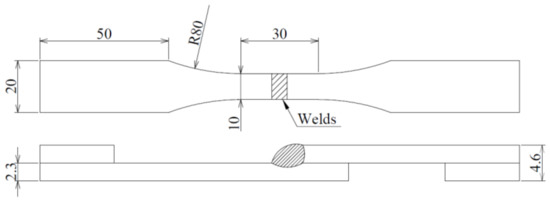
Figure 2.
Schematic diagram of the fatigue specimen (unit: mm).
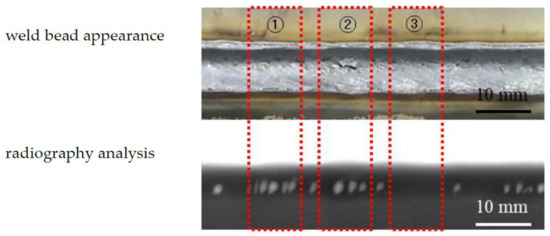
Figure 3.
Weld bead appearance and radiography analysis.
The number of pores with surface area exceeding 1 mm2 was measured via the external appearance analysis of the weld. The porosity of the welds was obtained by measuring the pore area via radiography analysis as shown in Figure 4 and substituting the parameters of weld bead shape into Equation (1).
Porosity (%) = (Area of pores (mm2)/L × W (mm2)) × 100%
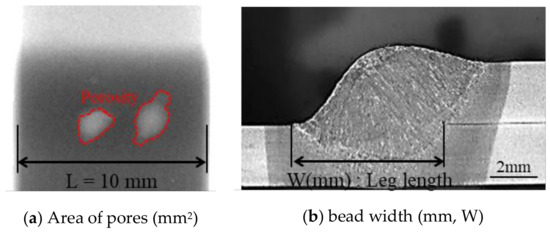
Figure 4.
Measurement of the area of pores and bead width.
Finally, the fatigue specimens were classified as shown in Table 4 via the visual inspection of welds and radiography analysis. Type I refers to welds that do not have pores. Type II refers to welds that do not have surface pores and have an internal porosity of 10 to 20%. Type III refers to fatigue test specimens with approximately 1 to 3 surface pores and 10 to 20% internal porosity. In this study, porosity between 10% and 20% was selected as the criterion to distinguish fatigue specimens. This is because, based on the result of the radiography analysis performed after welding, all the welded specimens except those with no pores and surface pores exhibited porosity between 10% and 20%. Therefore, the specimen classification criteria were selected based on these results and the specimens were classified into three types as shown in Table 4.
Table 4.
Classification conditions of the fatigue test specimens.
2.4. Fatigue Test
The fatigue tests were carried out using an INSTRON 8801 (Instron, Norwood, MA, USA) with 5-ton capacity. To prevent the specimen from twisting during repeated fatigue loading, a 2.3-mm-thick plate was attached to the part to be gripped in the fatigue tester. Figure 5 shows a schematic diagram of the sine waveform used in the fatigue test. The σmax indicates the maximum load applied to the test specimen during the fatigue test, the σmin indicates the minimum load applied to the specimen during the fatigue test and the Δσ is given by σmax − σmin. The mean stress is the mean of the maximum load (σmax) and minimum load (σmin) applied to the specimen. In the fatigue test, the load stress was reduced at intervals of 10% from 60% to 20% with respect to the tensile strength (610 MPa) of the base material and the maximum stress was decreased by 5% at 20% load stress or less. The fatigue test was performed under the condition of the stress ratio of the minimum loading stress to the maximum loading stress (R = σmin/σmax) of 0.1 in the sine waveform. The frequency used in the fatigue test was fixed at 40 Hz. During the fatigue test, the testing was stopped at 2 × 10⁶ cycles and the stress value at this time was recognized as the permanent fatigue limit value [19]. In this study, the Y-axis stress value of the S–N curve is σmax and is designated as nominal stress, which is the applied load divided by the cross-sectional area of the specimen.

Figure 5.
Schematic diagram of stress loading during the fatigue test.
3. Results
3.1. Weld Bead Appearance, Tensile Shear Strength and Hardness
As shown in Figure 6, the type I specimen shows good welds with no defects in the welds. In the type II specimen, pores were observed inside the welds. The type III specimen had surface pores owing to internal blowhole growth. Figure 7 shows the tensile shear strength, which is the applied load divided by the specimen cross-sectional area for the three types of weld specimens. The type I specimen had a tensile shear strength of 611 MPa with base material failure. The type II and III specimens showed tensile shear strengths of 453 MPa and 356 MPa, respectively and weld fracture occurred. Consequently, the presence of pore defects in the welds affected the tensile shear strength.
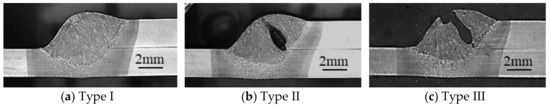
Figure 6.
Weld cross-section according to types.
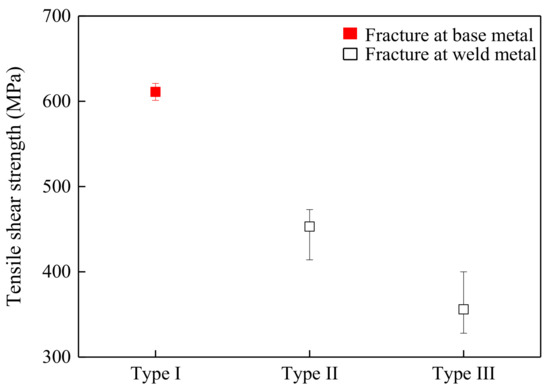
Figure 7.
Comparison of the tensile shear strength of welds according to the specimen types.
Figure 8 and Figure 9 show the measured hardness of the weld. The red line in Figure 8 indicates the position at which the microhardness of the weld specimen is measured. The hardness of the base material in the three types of specimens ranged from 197 to 200 HV and the hardness of the heat-affected zone (HAZ) was 200 to 205 HV on average. In the case of the type II and III specimens in Figure 9, the interval where the hardness value is zero in the middle represents the position of the pore. The mean hardness of the fusion zone was 237 to 245 HV and there was no significant difference for the different weld defect types.
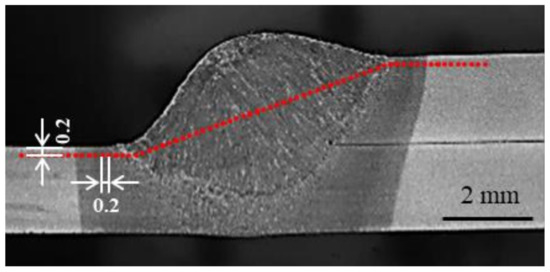
Figure 8.
Hardness measurement position of the weld.
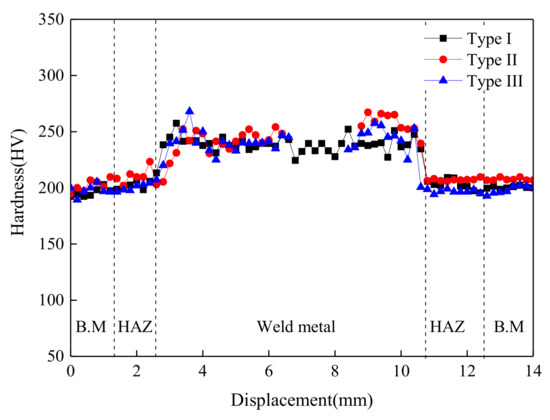
Figure 9.
Measured hardness profiles of weld according to specimen types.
3.2. Fatigue Behavior
The fatigue test was carried out using a specimen with similar weld beads to minimize the effect of weld bead shape on the fatigue test. It was reported that the fatigue behavior varies depending on the bead shape of the weld [11]. The weld bead size was measured using the length parameter shown in Figure 10 according to the types of weld defects. As shown in Figure 11, the shape of the weld beads of the three types of fatigue test specimens is similar with no significant difference.
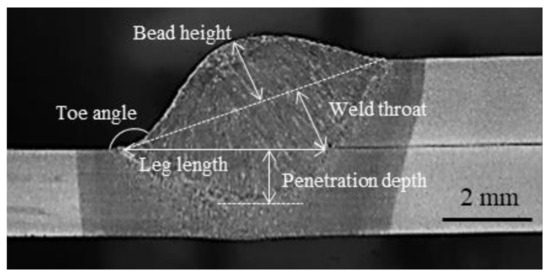
Figure 10.
Measurement of weld size using length parameter.
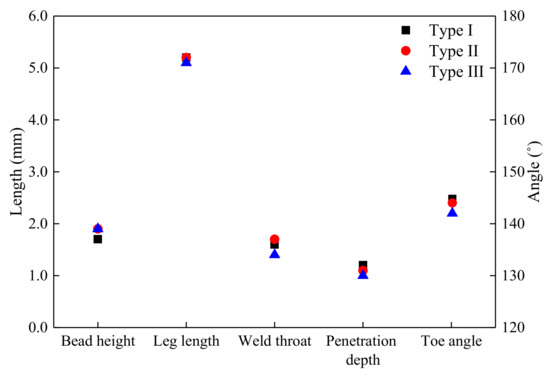
Figure 11.
Comparison of weld bead sizes according to weld types using length parameter.
Figure 12 shows the stress versus number of cycles to failure (S–N) curve of each specimen according to the pore defects in the weld. When the nominal stress was 366 MPa, the fatigue lives of the type I, II and III specimens were 5799 cycles, 3322 cycles and 1337 cycles, respectively. The fatigue life decreased in the order of type I, type II and type III specimens. Even when the nominal stress was between 122 and 305 MPa, fatigue behavior similar to that of the fatigue test was obtained when the nominal stress was 366 MPa. Moreover, fatigue life was similar for each specimen type with the nominal stress of 92 MPa. The permanent fatigue limits satisfying the fatigue life of 2 × 10⁶ cycles were the same with the nominal stress of 62 MPa for all the three types. When the fatigue stress was high, the fatigue life of each weld type was observed to be different. The fatigue life of each weld type showed no difference when the fatigue stress was decreased.
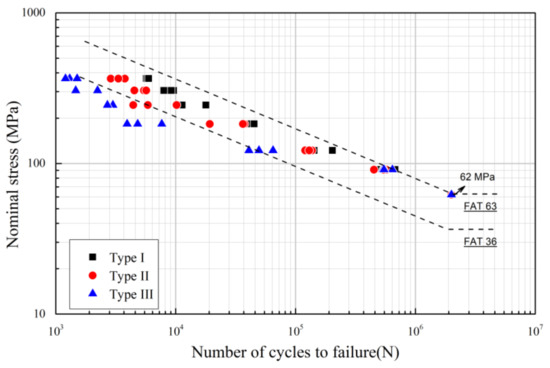
Figure 12.
S–N curves according to weld types (FAT: Fatigue class).
Figure 13 shows the fatigue fracture profile of the welds according to fatigue stress. In the case of nominal stress between 122 and 366 MPa, all three types of fatigue test specimens were broken at the root of the welds. In the case of nominal stress of 92 MPa, all three types of specimens showed fatigue fracture at the weld toe. Fatigue fracture propagates from the root to the top of the plate when fatigue cracking occurs at the root and when fatigue cracking occurs at the weld toe, the fatigue fracture propagates down to the weld toe of the bottom plate. Hwang et al. [11] reported that fatigue fracture propagated from the root to the top of the plate when fatigue cracks occurred at the root and fatigue crack propagated down to the weld toe of the bottom plate when fatigue cracks occurred at the weld toe. The applied load used for the measurement of static and fatigue strength can induce a very complicated distribution of normal and shear stresses in the lap joint [20,21,22]. In the fatigue tests of the lap fillet joint, a secondary bending moment is observed. At higher loads between 122 and 366 MPa, the effect of the secondary bending moment at the weld root increases. At lower loads below 92 MPa, the influence of the secondary bending moment becomes relatively smaller and the location of the stress concentration changes from the weld root to weld toe [7,11].
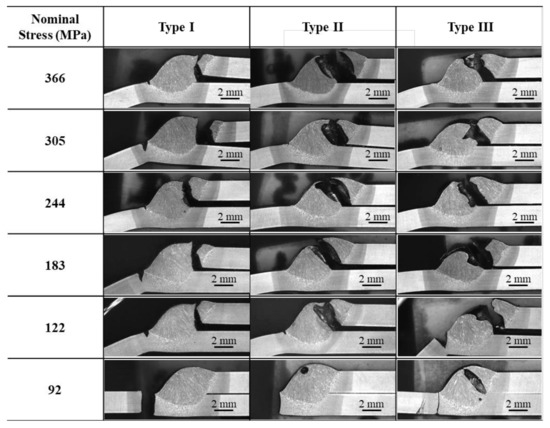
Figure 13.
Fatigue fracture with various nominal stresses and weld types.
In this study, the welds of lap fillet joints were fatigued to two types: weld root and weld toe. In the IIW 2008 specification [23], there is a double lap fillet joint shape similar to the shape of the weld joint in this study. According to the IIW 2008 specification, FAT 36 was satisfied when weld root fracture occurred and FAT 63 was satisfied when weld toe fracture occurred. In this study, FAT 36 was satisfied when weld root fracture occurred in the type I and II specimens but FAT 36 was not satisfied in the type III specimen owing to weld defects. FAT 63 was satisfied when the nominal stress of fatigue failure at the weld toe was 92 MPa.
4. Discussion
Effect of Porosity on the Fatigue Behavior
As shown in the previous S–N curve, fatigue life varies according to the weld type at high nominal stress. However, at a nominal stress of 92 MPa, there is no difference in fatigue life according to the weld type. As mentioned earlier, fatigue fracture occurred at the weld root at high nominal stress between 122 and 366 MPa and at the weld toe at a nominal stress of 92 MPa. It can be expected that the fatigue life at high stress will be different because the actual welded area is reduced owing to welding defects such as porosity (type II specimen) or surface pores (type III specimen). Particularly, at a nominal stress of 92 MPa, fracture occurred at the weld toe. As there is no pore at the weld toe, it is considered that the fatigue life is similar owing to the similarity of all three types of area under actual stress. In order to prove this result, the fatigue fracture surface of the weld was analyzed.
Figure 14 shows the fatigue fracture surface of type III welds (a) at the weld toe at a nominal stress of 92 MPa and (b) at the weld root at a nominal stress of 366 MPa. In the case of fracture at the weld toe, fatigue fracture occurred in the HAZ and weld pores were not observed. However, in the case of the fatigue fracture at the weld root, as shown in Figure 14b, there were pores in the weld. Figure 15 shows the fatigue fracture surface for each specimen according to nominal stress. As shown in the figure, in the case of the type I specimen, there were no pore defects on the fracture surface. However, in the type II and III specimens, pore defects were observed up to 122 MPa, where weld root fatigue fracture occurred and no pore defects were observed at 92 MPa where weld toe fracture occurred.
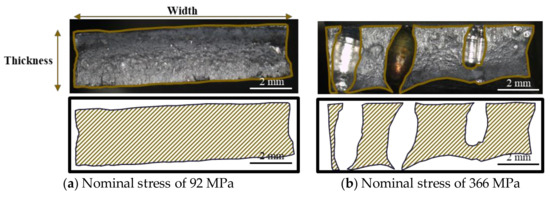
Figure 14.
Fatigue fracture surfaces of the type III specimen after fatigue test at the nominal stresses of 92 MPa and 366 MPa.
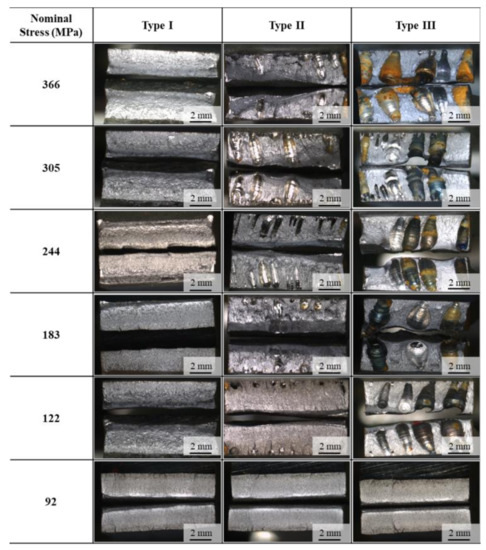
Figure 15.
Fatigue fracture surfaces of the type I, II and III welds after fatigue test according to nominal stress.
Thus, the influence of the pore on the fatigue life should be analyzed when the pore size is different, although the specimens have the same porosity. Lu et al. [24] reported the effect of pore size on fatigue strength and lifetime for electron-beam-welded aluminum alloy joints. It was confirmed that the fatigue life decreases as the size of the pore increases beyond the critical value and the pore is closer to the bead surface as in the type III specimen. However, as in the type II specimen, the fatigue life is not significantly reduced if the pore size is below the critical value. Rudy et al. [25] also reported the relationship between the pore size and strength of the weld. If the size of the pores is large but the number of pores is insufficient, there is no loss of strength. However, if small pores are present in sufficient numbers to cause area loss, a reduction in strength will occur. In this study, to clarify the correlation between porosity and fatigue life, the results obtained under the condition of same fatigue stress were compared. In the case of the type III specimen with surface pores, a notch effect was observed on the surface. Therefore, the relationship between porosity and fatigue life is investigated and compared with that of the type II specimen. The porosity did not affect the fatigue life at fatigue stress below 122 MPa as shown in Figure 12. Furthermore, it was difficult to determine the correlation between porosity and fatigue life at a stress of 305 MPa or more. When the fatigue lives were 5848 and 4423 cycles at 244 MPa for the type II specimen, the pore area was 10% of the weld area. However, when the fatigue life was 10,195 cycles at 244 MPa, the pore area was approximately 6% of the weld area. Similarly, when the pore area was 12.2% of the weld area at a stress of 188 MPa, the fatigue life of 19,265 cycles was observed. However, when the pore area was between 5.6% and 7.4% of the welded area, the fatigue lives were 37,567 and 36,384 cycles, respectively. In other words, in the case of fatigue stress of 244 MPa and 183 MPa, fatigue lives were significantly reduced when the pore areas in the weld were more than 10% and 12.2% of the weld area, respectively.
As mentioned above, the effect of the pore area within the weld area on the fatigue life is significant. In addition, the correlation between the actual contact area and fatigue life is investigated. The area under actual stress in the fatigue test was recalculated using Equation (2). Further, the actual fatigue stress applied to the specimen was calculated according to Equation (3).
Actual area (mm2) = Thickness (2.3 mm) × Width (10 mm) − area of porosity (mm2)
Actual stress (MPa) = Nominal stress(N)/Actual area (mm2)
Figure 16 shows the S–N curve derived using the actual stress obtained from Equation (3). In the case of nominal stress of 92 MPa, even if it is converted to actual stress, no significant difference can be observed as shown in Figure 14 because there are only a few pore defects in the weld. However, at the nominal stress of 122 to 366 MPa, where fracture occurs at the weld root, the area of fatigue load is reduced owing to the pore defects in the weld, which increases the actual stress. In the high-fatigue-load region where fatigue fracture occurs at the weld root, defects such as porosity and surface pores reduce the sectional area under load and have a significant influence on fatigue life. However, in the region of fatigue load where fatigue fracture occurs at the weld toe, pore defects do not significantly affect fatigue life. Further, as shown in Figure 16, the S–N curves after conversion from nominal stress to actual stress for the type II and III specimens show that the actual stress values of these types are linearly correlated to the nominal stress values of the type I specimen. This indicates that, if the reduction of the contact area owing to pore defects is corrected by measuring the actual contact area, a similar fatigue strength result can be obtained as the fatigue strength in the absence of defects such as in the type I specimen. In other words, the fatigue strength is proportional to the contact area of the weld.
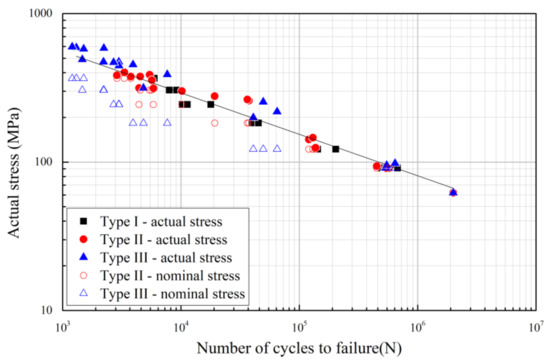
Figure 16.
S–N curve derived using the actual stress from Equations (2) and (3).
5. Conclusions
In this study, the effect of porosity on the fatigue behavior of lap fillet joints with GA590 FB material using GMAW was investigated. The conclusions are as follows.
- (1)
- In the absence of pores in the weld, a tensile shear strength of 677 MPa was observed and base material fracture occurred. In the presence of defects such as blowholes and surface pores, the tensile shear strength decreased to 453 and 356 MPa and weld failure occurred.
- (2)
- The fatigue limit was determined to be 60 MPa regardless of the presence of defects. The fatigue life in the load stress range 122–366 MPa was the highest when there were no defects and the fatigue life decreased in the presence of blowhole defects and surface pores.
- (3)
- The analysis of stress for fatigue fracture showed that weld root fracture occurred in the load stress range 122–366 MPa and weld toe fracture occurred at the load stress of 92 MPa.
- (4)
- At load stresses between 122 and 366 MPa, where fatigue fractures occurred at the weld root, weld pore defects affected the fatigue life. However, the pore defects in the welds were independent of the fatigue life at a stress of 92 MPa, which caused fatigue fracture at the weld toe and at the stress of 62 MPa, which satisfied the stress of fatigue limit. Pore defects in the weld reduce the actual contact area of the weld. This can be corrected through the calculation of the actual stresses by measuring the actual contact area.
Acknowledgments
This work was supported by the Ministry of Trade, Industry and Energy (MOTIE, Korea).
Author Contributions
D.-Y.K., G.J. and J.S. performed the fatigue tests; I.H. performed the welding experiments; D.K. and M.K. analyzed the experimental results; D.-Y.K. and Y.-M.K. wrote the paper.
Conflicts of Interest
The authors declare no conflict of interest.
References
- Nishikawa, Y.; Suga, T.; Nakano, T. Gas pocket generation in MAG welding of galvanized steel sheet. ISIJ Int. 1995, 35, 1213–1221. [Google Scholar] [CrossRef][Green Version]
- Matsui, H.; Suzuki, H.; Yamada, M. Reduction of blowholes in high-speed arc welding of hot-dip galvanised steel sheets. Weld. Int. 1998, 12, 432–439. [Google Scholar] [CrossRef]
- Lee, J.-B.; An, Y.-H.; Park, H.-S. CO2 Weldability of Zn Coated Steel Sheet (3)—Effect of Process Condition on the Generation of Weld Defects. J. Korean Weld. Soc. 2000, 18, 69–76. [Google Scholar]
- Matsui, H.; Shionoya, S. Reduction of blowholes by vibration of the molten pool in arc welding of galvanised carbon steel sheet. Weld. Int. 1998, 12, 959–965. [Google Scholar] [CrossRef]
- Yuan, Y.; Yamazaki, K.; Suzuki, R. Relationship between penetration and porosity in horizontal fillet welding by a new process “hybrid tandem MAG welding process”. Weld. World 2016, 60, 515–524. [Google Scholar] [CrossRef]
- Izutani, S.; Yamazaki, K.; Suzuki, R. New welding process, “J-SolutionTM Zn”, suitable for galvanized steel in the automotive industry. Kobelco Technol. Rev. 2013, 32, 16–23. [Google Scholar]
- Lee, K.B.; Oh, S.T. Development of durability enhancement technology for arc weldings in advanced high strength steel (AHSS) chassis parts. J. Weld. Join. 2015, 33, 50–56. [Google Scholar] [CrossRef]
- Koganti, R.; Angotti, S.; Joaquin, A.; Jiang, C.C. Effect of Weld Geometry and HAZ Softening on Fatigue Performance of DP780 GMAW Lap Joint; SAE Technical Paper 2007-01-0632; Society of Automotive Engineers Inc.: Warrendale, PA, USA, 2007. [Google Scholar]
- Chung, Y.; Kwon, H. A Study on weld fatigue life improvement of automotive chassis components. In Proceedings of the KSME 2011 Autumn Annual Meeting, Daegu, Korea, 2–4 November 2011; The Korean Society of Mechanical Engineers: Seoul, Korea, 2011; pp. 129–132. [Google Scholar]
- Feng, Z.; Sang, Y.; Jiang, C.; Chiang, J.; Kuo, M. Fatigue Performance of Advanced High-Strength Steels (AHSS) GMAW Joints; SAE Technical Paper 2009-01-0256; Society of Automotive Engineers Inc.: Warrendale, PA, USA, 2009. [Google Scholar]
- Hwang, I.; Kim, D.-Y.; Jeong, G.; Kang, M.; Kim, D.; Kim, Y.-M. Effect of weld bead shape on the fatigue behavior of GMAW lap fillet joint in GA 590 MPa steel sheets. Metals 2017, 7, 399. [Google Scholar] [CrossRef]
- Kim, D.-Y.; Kim, D.; Kang, M.; Kim, Y.-M. Improvement of fatigue strength of lap fillet joints by using tandem MAG welding in a 590-MPa-grade galvannealed steel sheet. Int. J. Adv. Manuf. Technol. 2017, 93, 4379–4387. [Google Scholar] [CrossRef]
- Basak, S.; Pal, T.K.; Shome, M. High-cycle fatigue behavior of MIG brazed galvanized DP600 steel sheet joint—Effect of process parameters. Int. J. Adv. Manuf. Technol. 2016, 82, 1197–1211. [Google Scholar] [CrossRef]
- Potluri, N.; Ghosh, P.; Gupta, P.; Reddy, Y. Studies on weld metal characteristics and their influence on tensile and fatigue properties of pulsed-current GMA welded Al-Zn-Mg alloy. Weld. J. 1996, 75, 62–70. [Google Scholar]
- Robakowski, T. Effect of height of reinforcement bead on fatigue strengths of butt joints with internal defects. Weld. Int. 1989, 3, 301–304. [Google Scholar] [CrossRef]
- Lazzarin, P.; Tovo, R. A notch intensity factor approach to the stress analysis of welds. Fatigue Fract. Eng. Mater. Struct. 1998, 21, 1089–1104. [Google Scholar] [CrossRef]
- Lazzarin, P.; Berto, F.; Radaj, D. Fatigue-relevant stress field parameters of welded lap joints: Pointed slit tip compared with keyhole notch. Fatigue Fract. Eng. Mater. Struct. 2009, 32, 713–735. [Google Scholar] [CrossRef]
- ASTM. Standard Practice for Conduction Force Controlled Constant Amplitude Axial Fatigue Tests of Metallic Materials; E 466-96; ASTM: West Conshohocken, PA, USA, 2002. [Google Scholar]
- Maddox, S.J. Fatigue Strength of Welded Structures, 2nd ed.; Woodhead Publishing: Abington, UK, 1991; pp. 3–18. [Google Scholar]
- Nordberg, H. Fatigue properties of stainless steel lap joints; SAE Trans. J. Mater. Manuf. 2006, 114, 675–690. [Google Scholar]
- Newman, J.A.; Dowling, N.E. A crack growth approach to life prediction of spot-welded lap joints. Fatigue Fract. Eng. Mater. Struct. 1998, 21, 1123–1132. [Google Scholar] [CrossRef]
- Miyazaki, Y.; Furusako, S. Tensile shear strength of laser welded lap joints. Nippon Steel Tech. Rep. 2007, 95, 28–34. [Google Scholar]
- Hobbacher, A. Recommendations for Fatigue Design of Welded Joints and Components; Springer: New York, NY, USA, 2009; pp. 42–76. [Google Scholar]
- Lu, L.; Zhao, H.; Cai, Z.; Cui, X. Influences of size and position of defects on the fatigue life of electron beam welded-aluminum alloy joints. Front. Mater. Sci. China 2007, 1, 130–133. [Google Scholar] [CrossRef]
- Rudy, J.F.; Rupert, E.J. Effect of porosity on mechanical properties of aluminum welds. Weld. J. 1970, 49, 322s–336s. [Google Scholar]


© 2018 by the authors. Licensee MDPI, Basel, Switzerland. This article is an open access article distributed under the terms and conditions of the Creative Commons Attribution (CC BY) license (http://creativecommons.org/licenses/by/4.0/).