Article

A Fragmentation Criterion for the Interface of a Hydrostatic Extruded Al-Mg-Compound

Institute of Mechanics and Thermodynamics, Chemnitz University of Technology, D-09126 Chemnitz, Germany
*
Author to whom correspondence should be addressed.
Metals 2018, 8(3), 157; https://doi.org/10.3390/met8030157
Submission received: 15 December 2017 / Revised: 8 February 2018 / Accepted: 21 February 2018 / Published: 2 March 2018

Abstract

:
Due to the higher demand for energy efficient products, light-weight constructions have become more important in recent years. An innovative, hydrostatic extruded Al-Mg-compound used here combines the corrosion resistance of aluminium with the outstanding lightweight properties of magnesium. During the production process, a thin boundary layer is built between the two basic materials. Investigations on further hot forming processing revealed a good formability of these compounds despite the fact that the boundary layer splits into fragments during forging and a new secondary boundary layer is built when the basic materials between the fragments come into contact again during the continuous deformation. The aim of the research is now to investigate fragmentation depending on the deformation rate and boundary layer thickness, which increases during the heat-up process in preparation of forging. For this purpose, a channel compression test is used in conjunction with a special newly developed specimen shape. The metallographic evaluation of the boundary layer reveals a strong dependency of fragmentation on the deformation rate and the boundary layer thickness. With the aid of a numerical simulation, an individual critical stretch could be determined at which fragmentation starts, and provide guidance for an optimal forging process design.

1. Introduction

Within the Collaborative Research Center 692, the potential of aluminium-based light-weight materials is utilized under the consideration of many influencing factors during processing. In one field, the research focuses on Al-based hybrid structures that combine magnesium and aluminium. Such an Al-Mg-compound connects the corrosion resistance of aluminium with the outstanding lightweight properties of magnesium, having a 35% lower density. This offers the potential to comply with the requirement of weight saving in several fields of industry, e.g., automotive [1] and aeronautical. Therefore, several investigations have been done since the early 1970s on the co-extrusion process with different material combinations [2,3,4].
Through the production process of these compounds, a 1–2 μ m thin interface develops everywhere between the two basic materials. The compound together with the interface was under examination regarding production process and resulting bonding quality, strength of the basic materials, interfacial strength, residual stresses, fracture mechanical properties and formability [5,6,7,8,9] as described below. The formability of such hybrid structures including their interface are rarely investigated. There are only publications from Kosch [10,11], Foydl [12] and Feuerhack [5], who made two main findings during further forging processes, evaluating the formability of the compounds. Firstly, the heat-up process in preparation of forging leads to an enormous growth of the boundary layer up to a thickness of at least 25 μ m . Secondly, the boundary layer splits into fragments during forging and a new thin secondary boundary layer is built when the basic materials between the fragments come into contact again during continuous deformation. Continuing these investigations, the fragmentation process is analysed closer in this paper regarding the dependency on the deformation rate and boundary layer thickness due its importance for the bearing capacity of the whole hybrid structure.
The compound presented here is produced by hydrostatic co-extrusion at CEP GmbH, Freiberg, Germany. The principle production process is shown in Figure 1. Hydrostatic co-extrusion is characterized by a force transmission through a pressure medium that surrounds the bi-material bolt and leads to good lubrication between bolt and container or die during pressing. The materials used were the lightweight alloys AZ31 and AA6082. The outer diameter of the manufactured compound amounts to 20 m m and the inner diameter to 14 . 5 m m . Further information about the process and optimisation possibilities can be found in [5,7,13,14].
After the manufacturing process at 300 C , the compound cools down to room temperature causing residual stresses due to differences in the thermal expansion coefficient. Nevertheless, the residual stresses stay at a low level of 16 N / mm 2 [6,15,16] and do not have to be considered during stress analysis in subsequent loading tests.
Investigations with bending tests regarding the determination of the interfacial strength were performed in a wide temperature range from room temperature up to 400 C [6,17,18,19]. The loading condition and the specimen shape are designed such that failure occurs under a tensile normal stress. At room temperature, the bending specimens failed with a brittle fracture and revealed a high interfacial strength of about 140–250 N / mm 2 . The brittle material behavior of the boundary layer under bending at room temperature correlates with the results of the fracture mechanical tests [6,20]. An increase of the temperature leads to a massive reduction of the interfacial strength (400 C : 10–60 N / mm 2 ). Furthermore, a good formability of the compound at high temperatures could be shown, which resulted partly in failure through large plastic deformation under bending. In these cases, the bending strength of the boundary layer is higher than the yield stress of the basic materials, which is important for further forging processes [21].
The rotationally symmetric compound has be further processed by forging, utilizing it for various purposes. Investigations regarding the forging processes upsetting, spreading and rising showed a good formability of the compound at 300 C [5,7,9]. During the heat-up process in preparation of forging, the boundary layer grows up to a thickness of at least 25 μ m due to diffusion based processes [22]. Depending on the load direction during forging, the boundary layer stays intact or splits into fragments. The reason can be found in the elongated bar-shaped microstructure (Figure 2a,b). In the case of a load in the transverse direction of the grains or under a hydrostatic pressure, the boundary layer exhibits a high formability. A load in the direction of the grains leads to a fragmentation following a damage mechanism. At first, the boundary layer splits (step 1). After fracture, the fragments drift apart and, depending on the further deformation, potentially rotate (step 2). In the case of a new contact of the two basic materials between the fragments, a new secondary boundary layer is built as shown in Figure 2c (step 3). The newly developed damage model from Feuerhack already enables determining critical areas regarding fragmentation. The missing differentiation between areas with stretching and compression makes a critical check for plausibility necessary. Due to the also missing influence of the grain structure and specific material properties, the damage model cannot show a load-dependent deformability of the boundary layer either. The quantification of the critical stretch regarding the onset of the fragmentation is part of the presented work and continues the work of Feuerhack.
Quantifying the critical stretch regarding the onset of fragmentation requires an experiment that causes a stretch of the boundary layer. In addition, different load states have to be investigated to detect the starting time of fragmentation. Furthermore, the metallographic analysis of the fragmentation state is only possible in a cutting plane. Therefore, the fragmentation state should be homogeneous in one direction, making the evaluation independent from the position of the normal cutting plane along that direction.
Tensile tests cause a stretch of the boundary layer under a known stress state. Due to a limited degree of deformation and the necessary amount of tests to cover different load states, tensile tests are not suitable for this purpose.
The channel compression test [23] together with a newly developed specimen shape causes an unequal distribution of the boundary layer stretch. Such a test is very well-suited due to the possibility to examine different deformation states of the boundary layer in one specimen. As the name of the channel compression test suggests, the deformation is limited to a compression of the height and a stretching along the channel. The sample width stays steady under ideal circumstances, leading to a plain strain state, which is another main advantage of such a test.

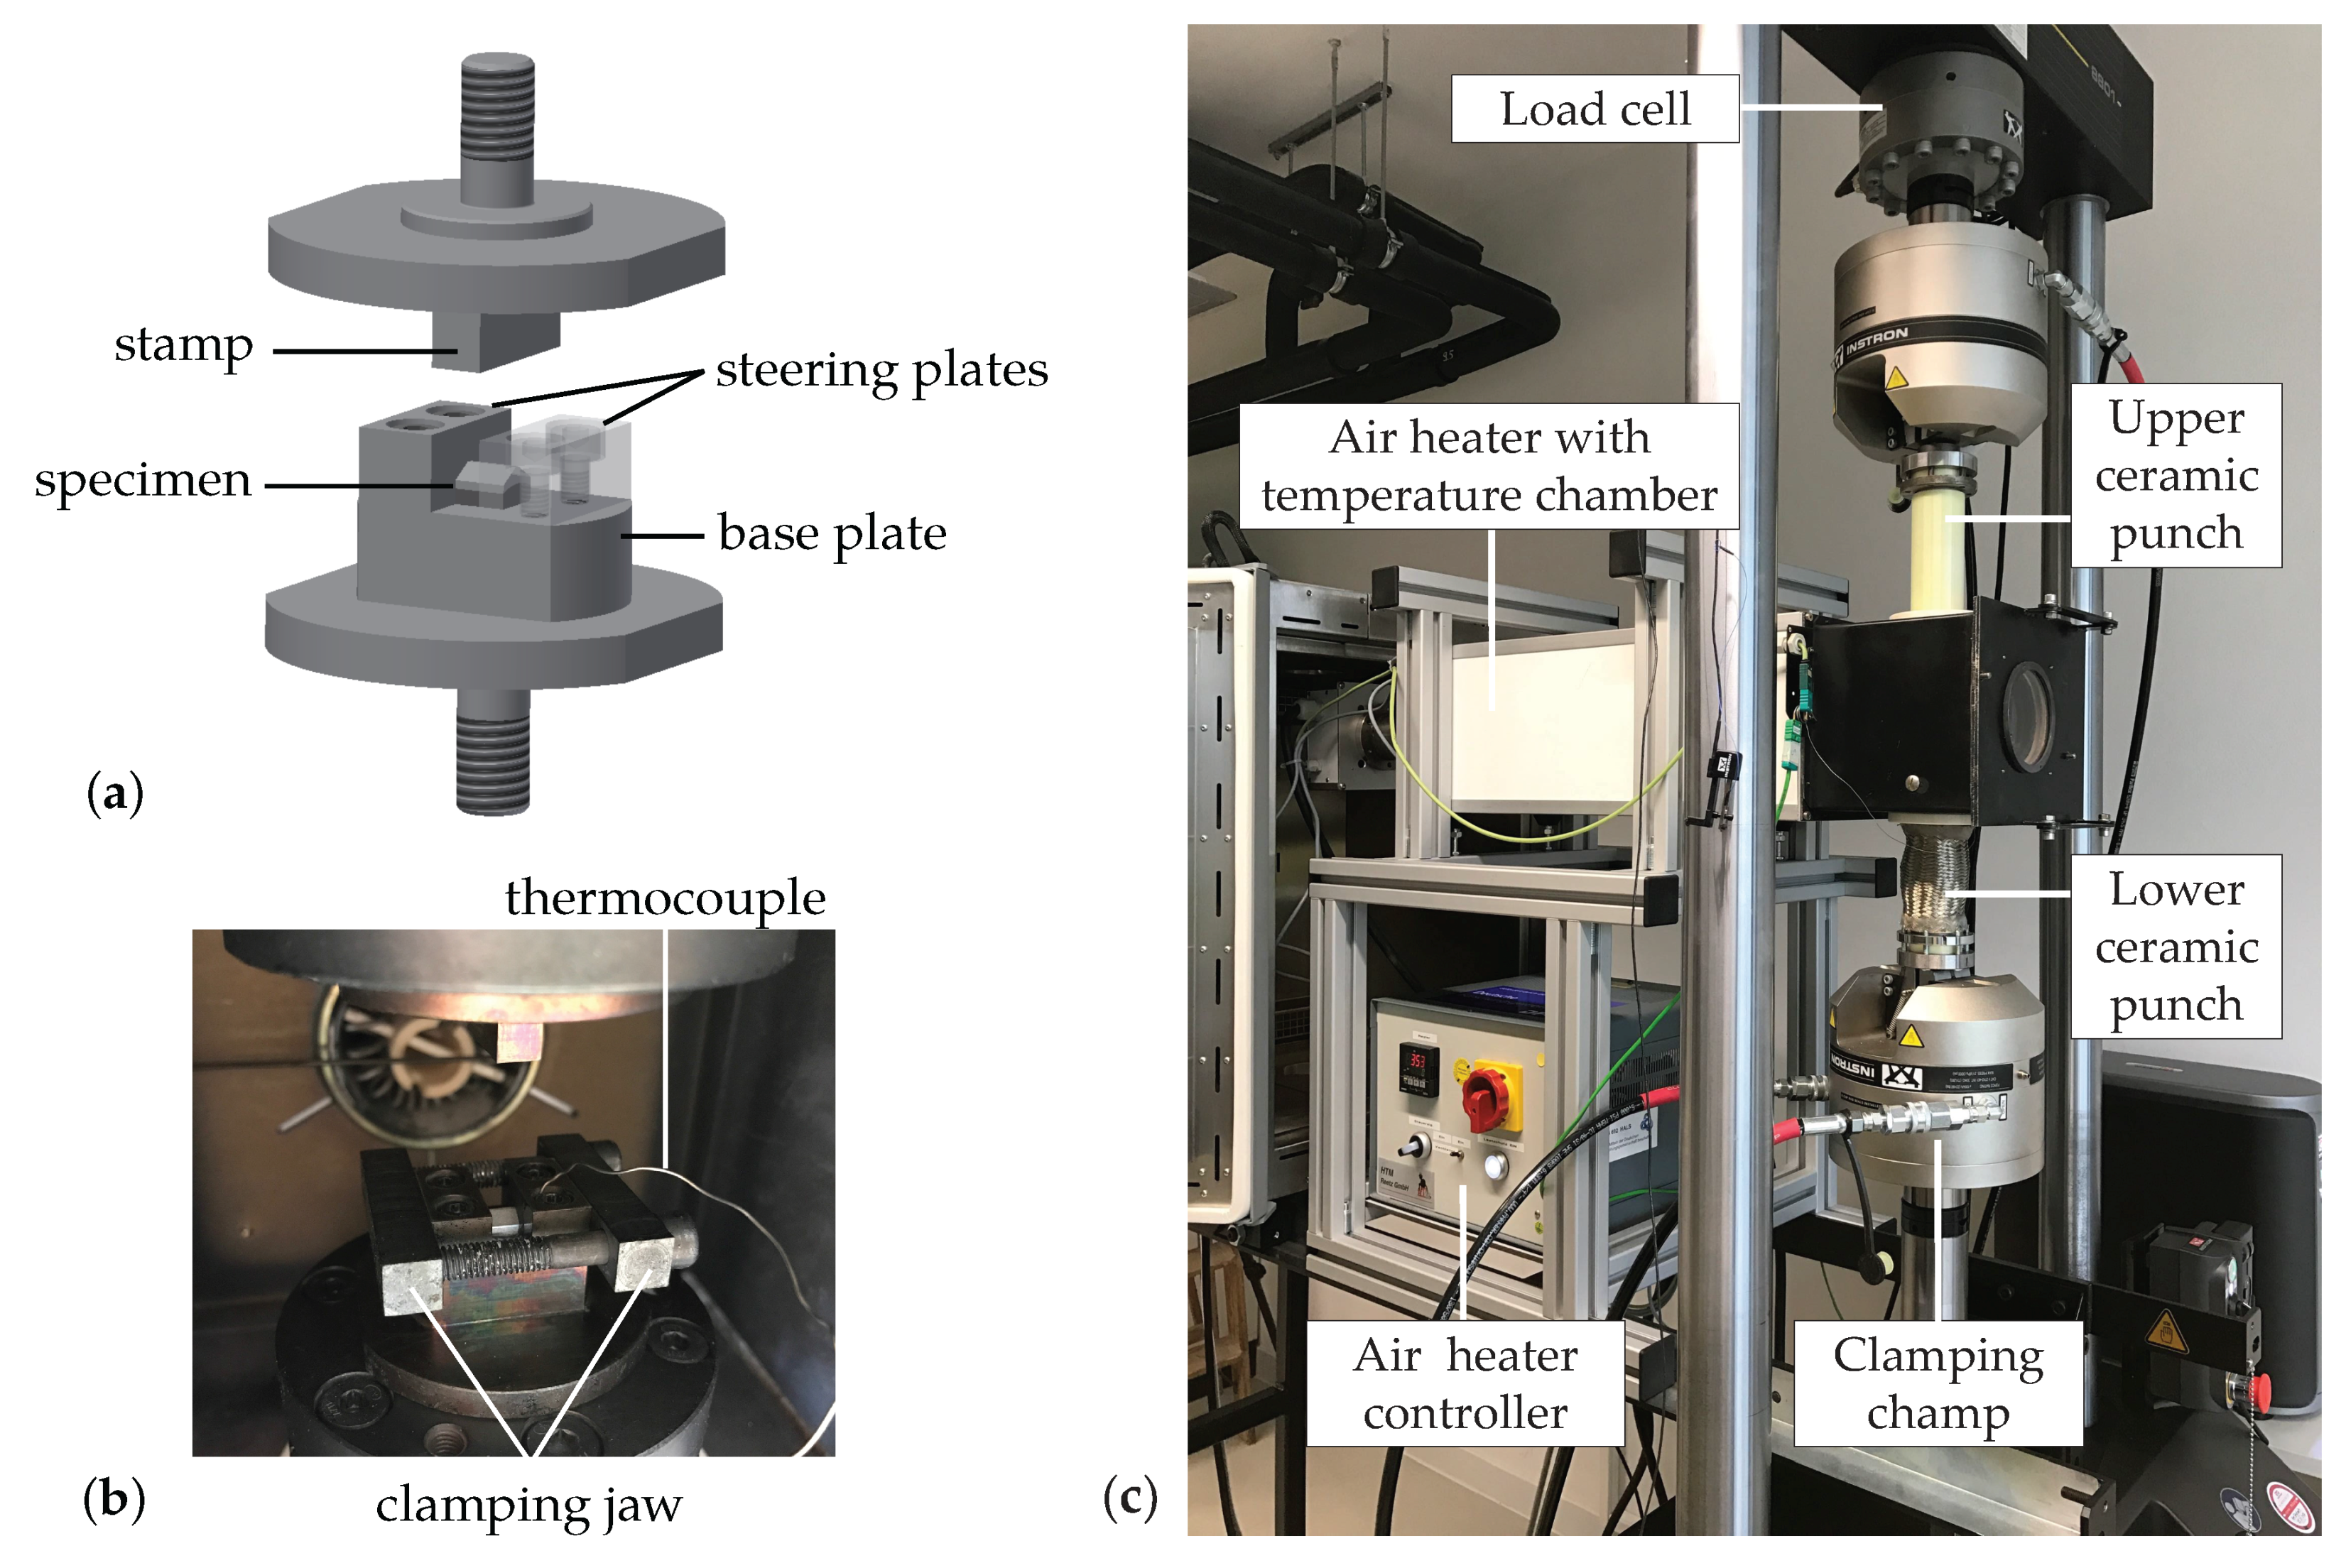
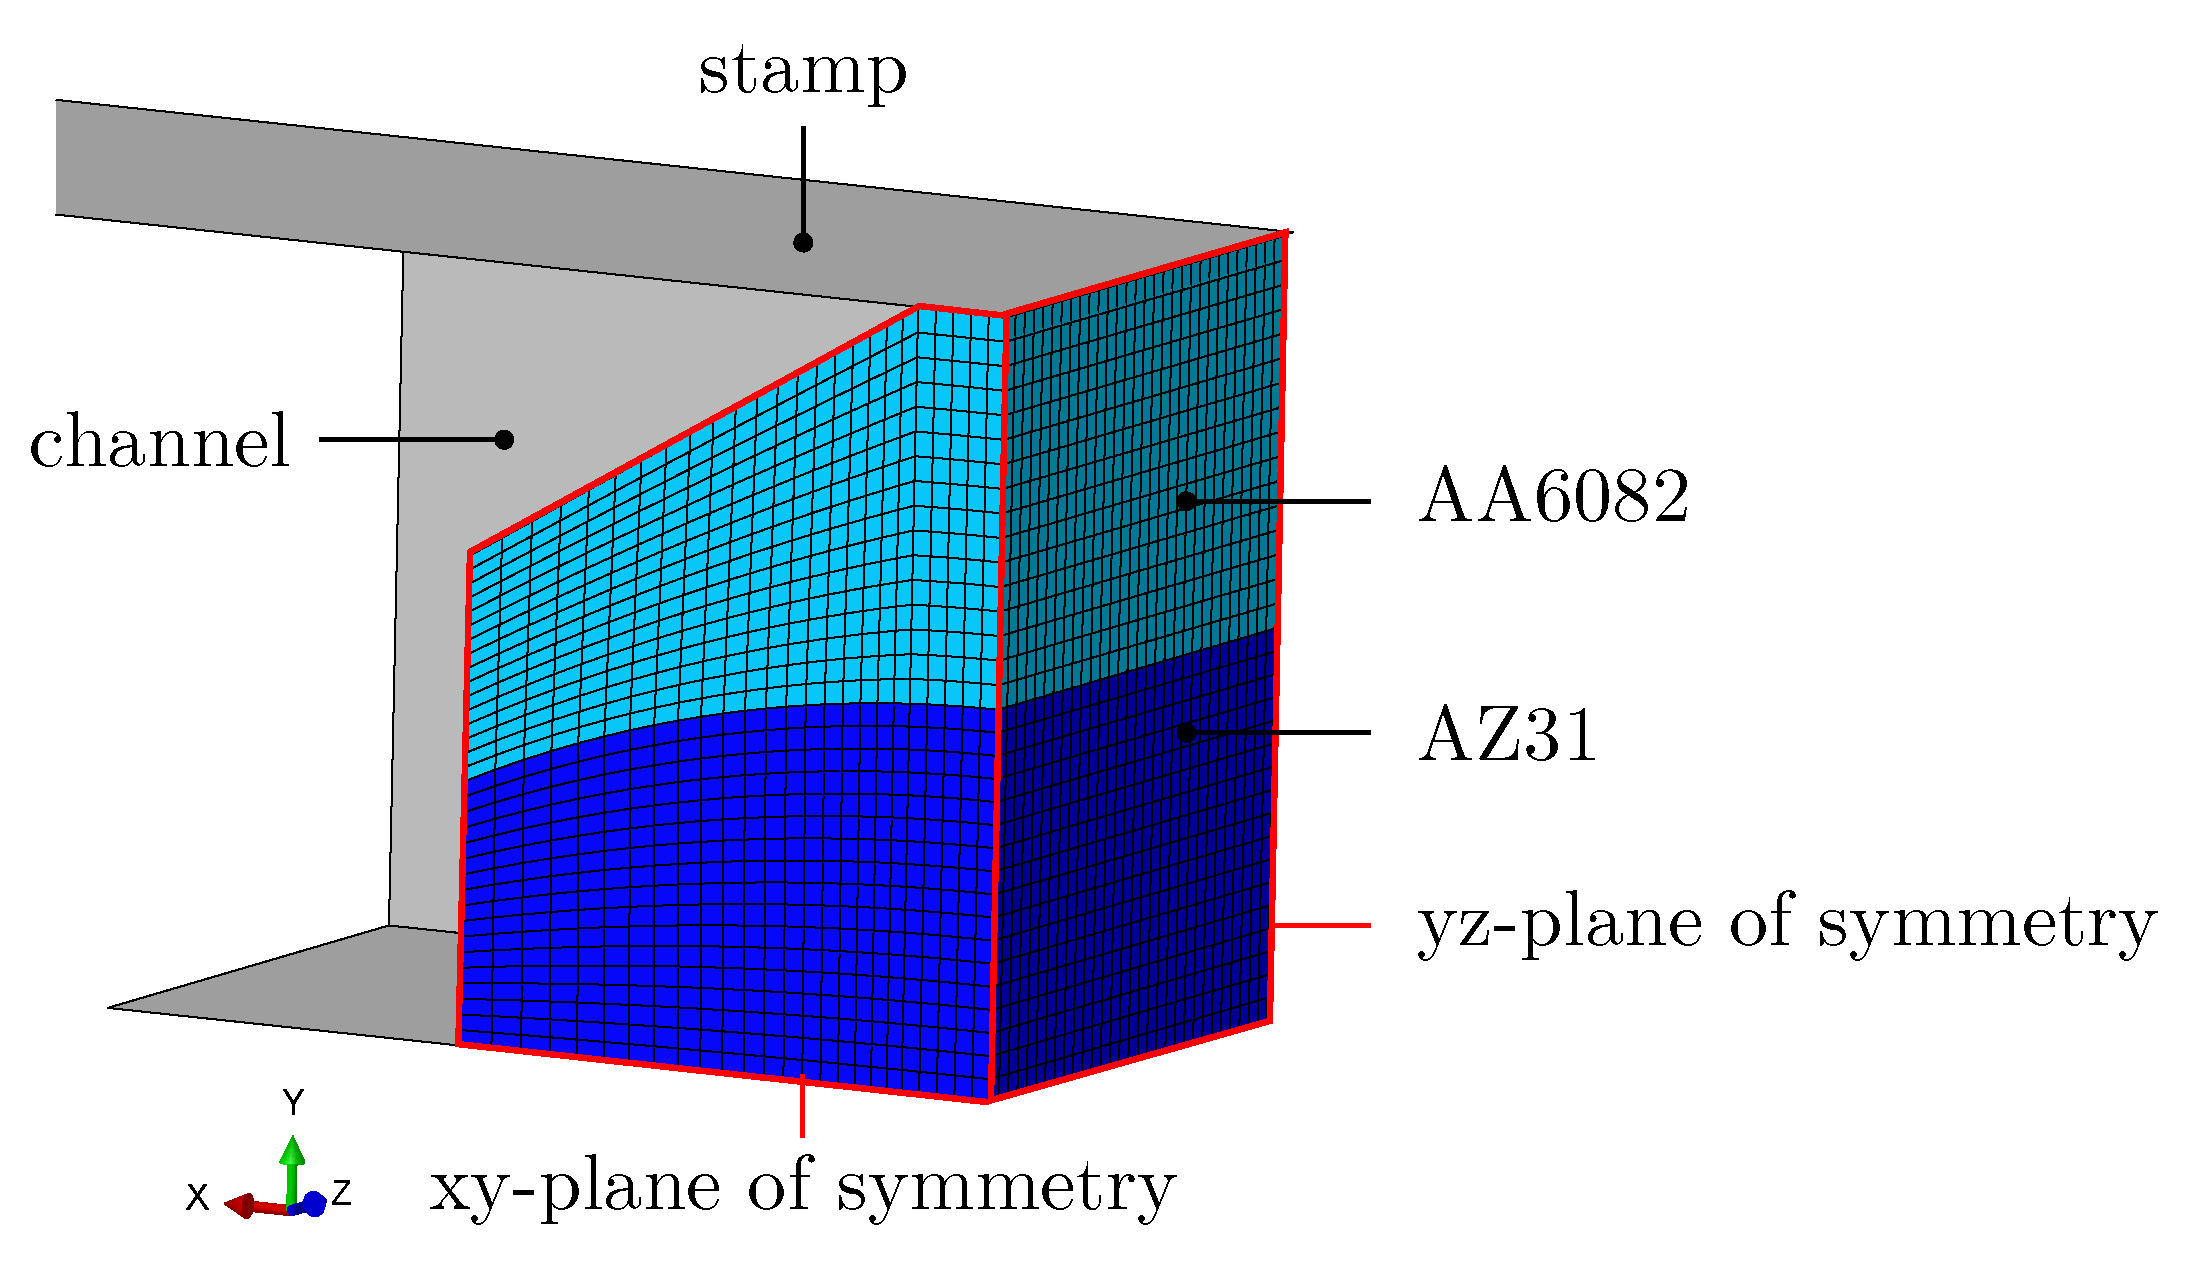
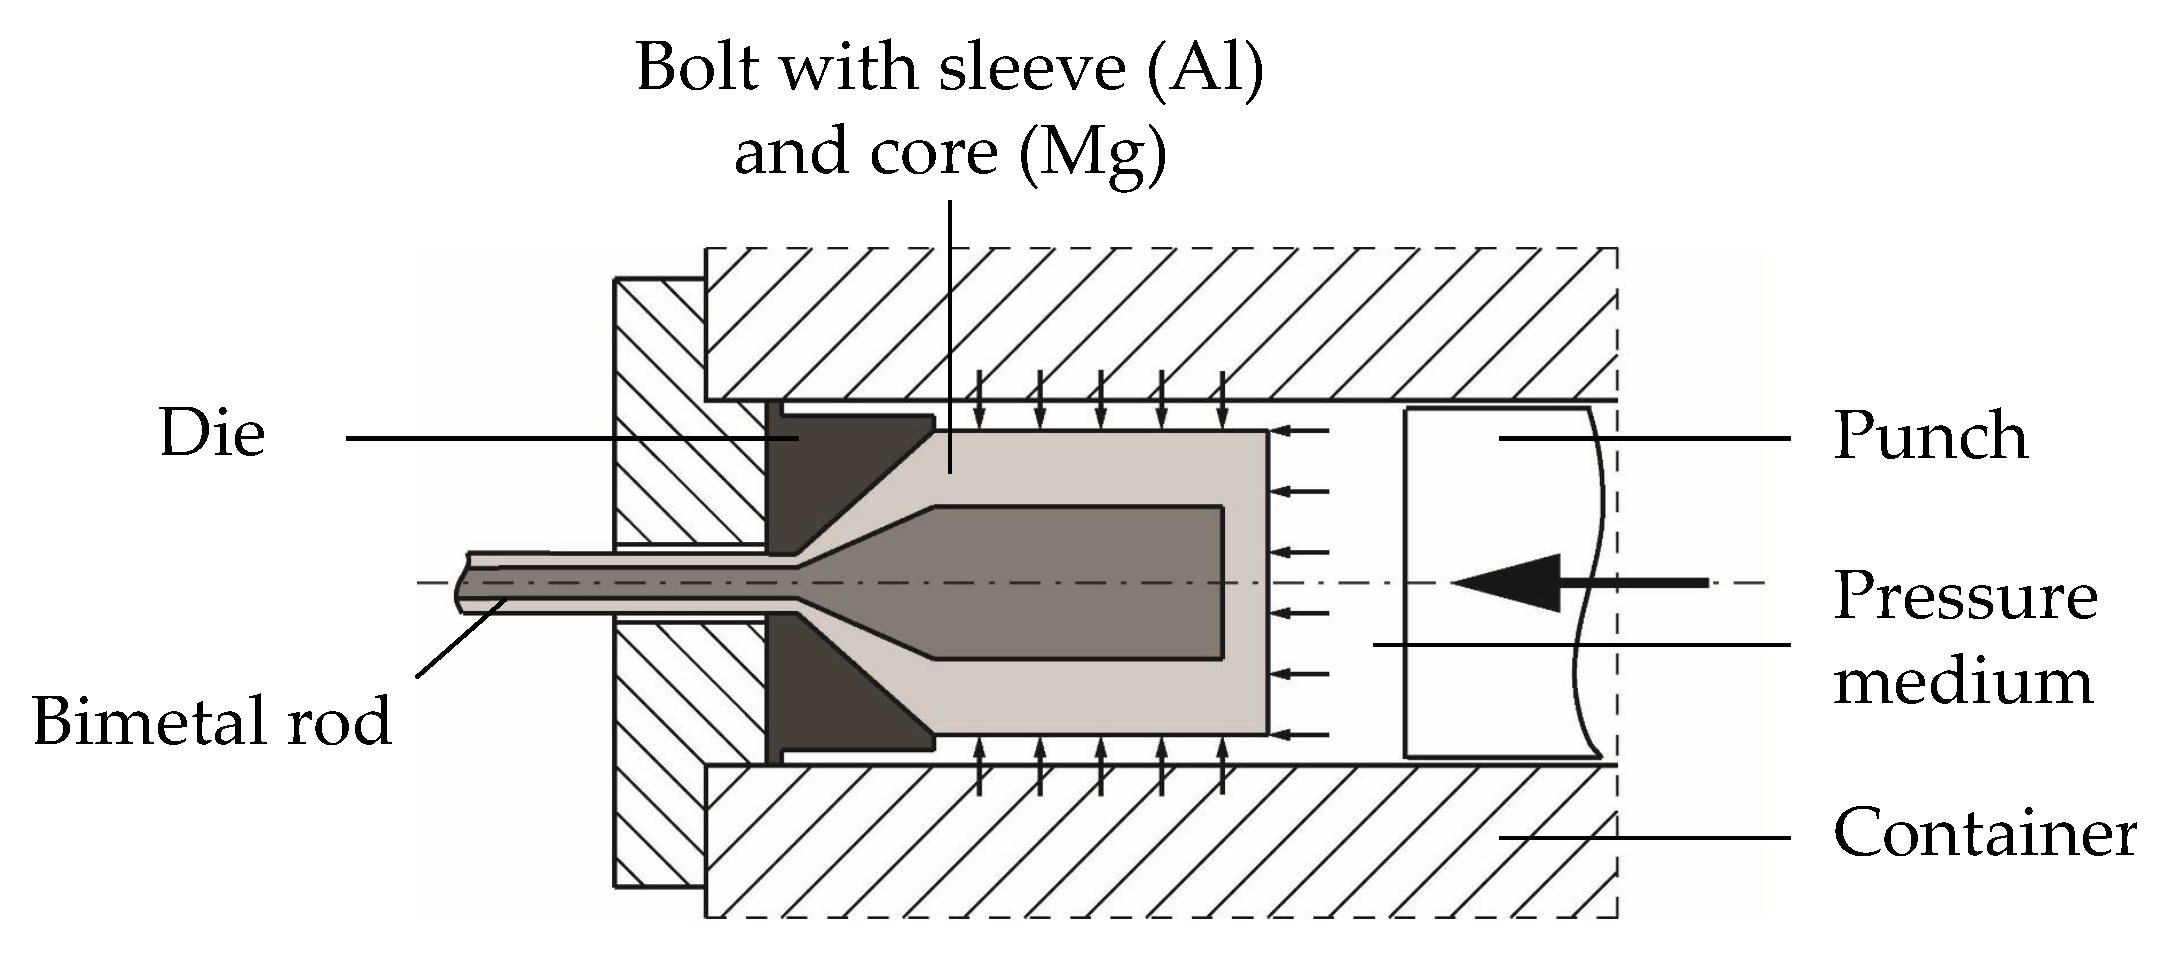
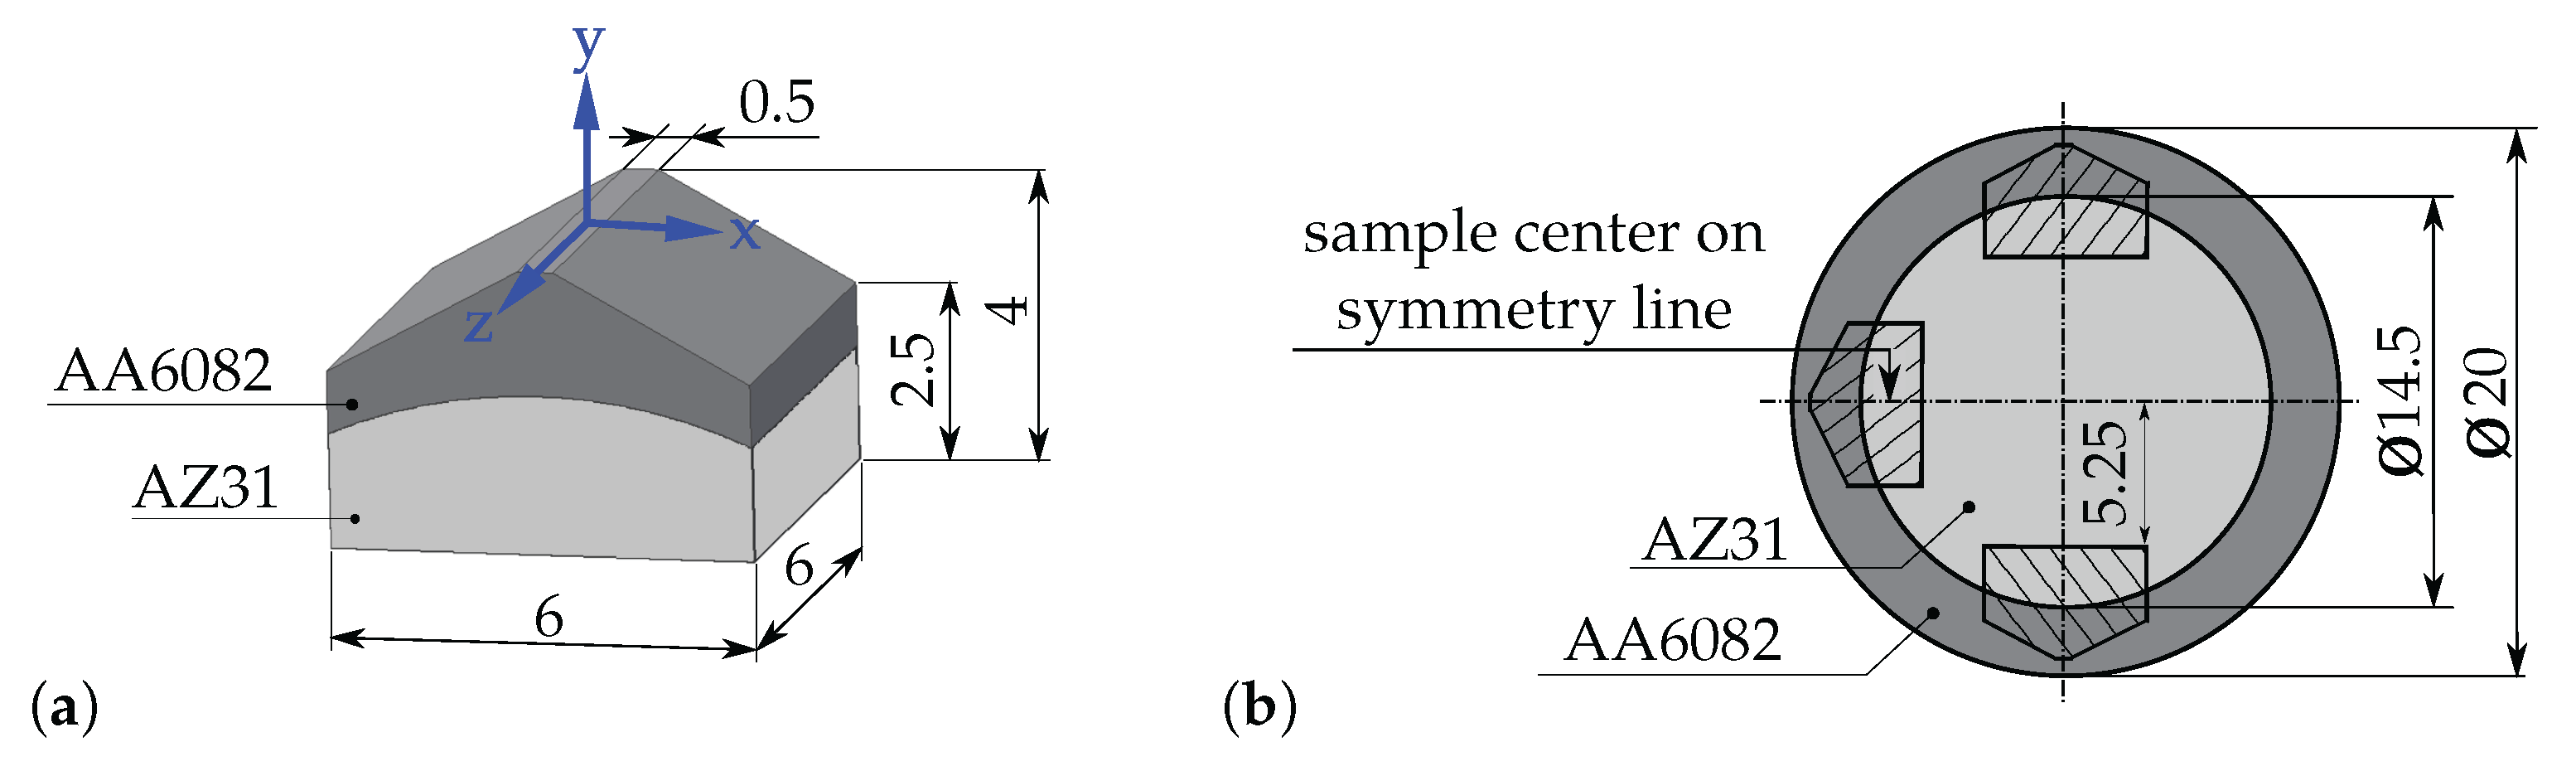
2. Materials and Methods

The lateral sample guiding is realised by two steering plates screwed onto a base plate (Figure 3a,b). By the through bores, they can be adjusted to the present stamp position and the width of the actual specimen. To prevent sliding of the steering plates during compression, additional clamping jaws are used. All areas that are in contact with the specimen are polished and lubricated with a MoS 2 -paste. The loading device can be implemented into different testing machines together with a temperature chamber. All compression tests performed with a stamp velocity of 2 m m / s are realised in an 100 k N ZWICK/ROELL universal testing machine (Zwick GmbH & Co. KG, Ulm, Germany) with an additional 5 k N force transducer. For all other tests, a 50 k N INSTRON hydraulic testing machine (Instron GmbH, Darmstadt, Germany) is used (Figure 3c). The air heater is controlled by the specimen temperature that is about 300 C during testing. The thermal isolation of the loading device is attained by ceramic punches, serving also as an universal base for different loading devices and connecting parts for different testing machines.
The dimensions of the specimen used for the channel compression test are shown in Figure 4 together with the associated coordinate system. The reduction of the height (y-direction) during testing correlates with a radial compression, taking the point of withdrawal in the compound into account. The specimen elongation parallel to the channel is equivalent to an elongation in the x-direction of the specimen and respectively the tangential direction in the compound. A deformation in the z-direction of the specimen that conforms to the extrusion direction is negligible through the steering plates.
All channel compression tests are summarized in Table 1. Every set of parameters is represented by three specimens extracted from the same rope section. The boundary layer thickness can be adjusted by a previous thermal treatment as shown in [22]. This growth is based on the diffusion of atoms across the interface at a temperature below the eutectic temperature. The lowest thickness of 7 . 5 μ m emerges already through the loading device heat-up process to 300 C , lasting 120 min , while the specimen is already located in the channel. The specimen temperature complies with the billet temperature during the former hot mass forming processes carried out by Feuerhack [5]. Boundary layer thicknesses of 10 μ m and 12 . 5 μ m are reached by an additional dwell time before compression for 15 min and 30 min respectively. To achieve a thickness of 25 μ m without a longer dwell time, the specimen is heated up to a temperature of 350 C for 10 min and then quickly cooled down to test temperature of 300 C by opening the oven door.
To ensure the, in some cases, very high stamp velocities from the beginning of the compression, a run-up is included in the test procedure. A run-up distance of 1 m m is sufficient to reach the required stamp velocities. Due to the elasticity of the experimental setup, the traverse stroke differs from the sample height reduction and has to be adjusted to ensure a compression of 1 m m . Immediately after the compression, the sample is removed from the channel and cools down to room temperature. This step prevents a subsequent thermal treatment and accordingly an additional boundary layer growth.

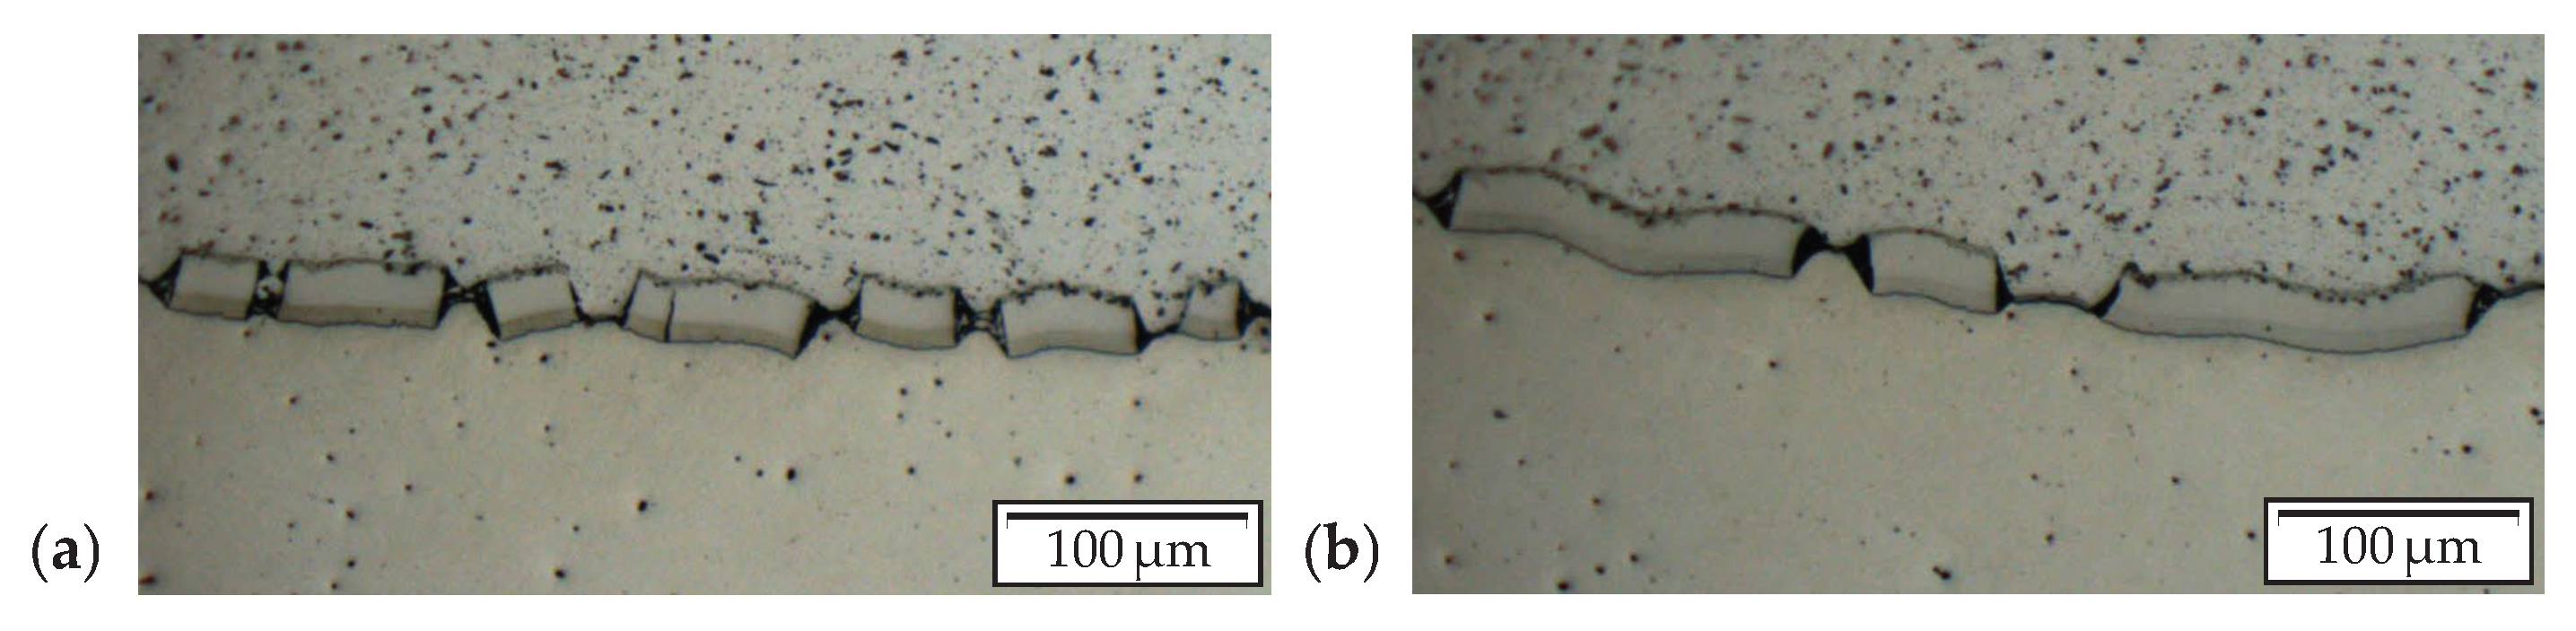
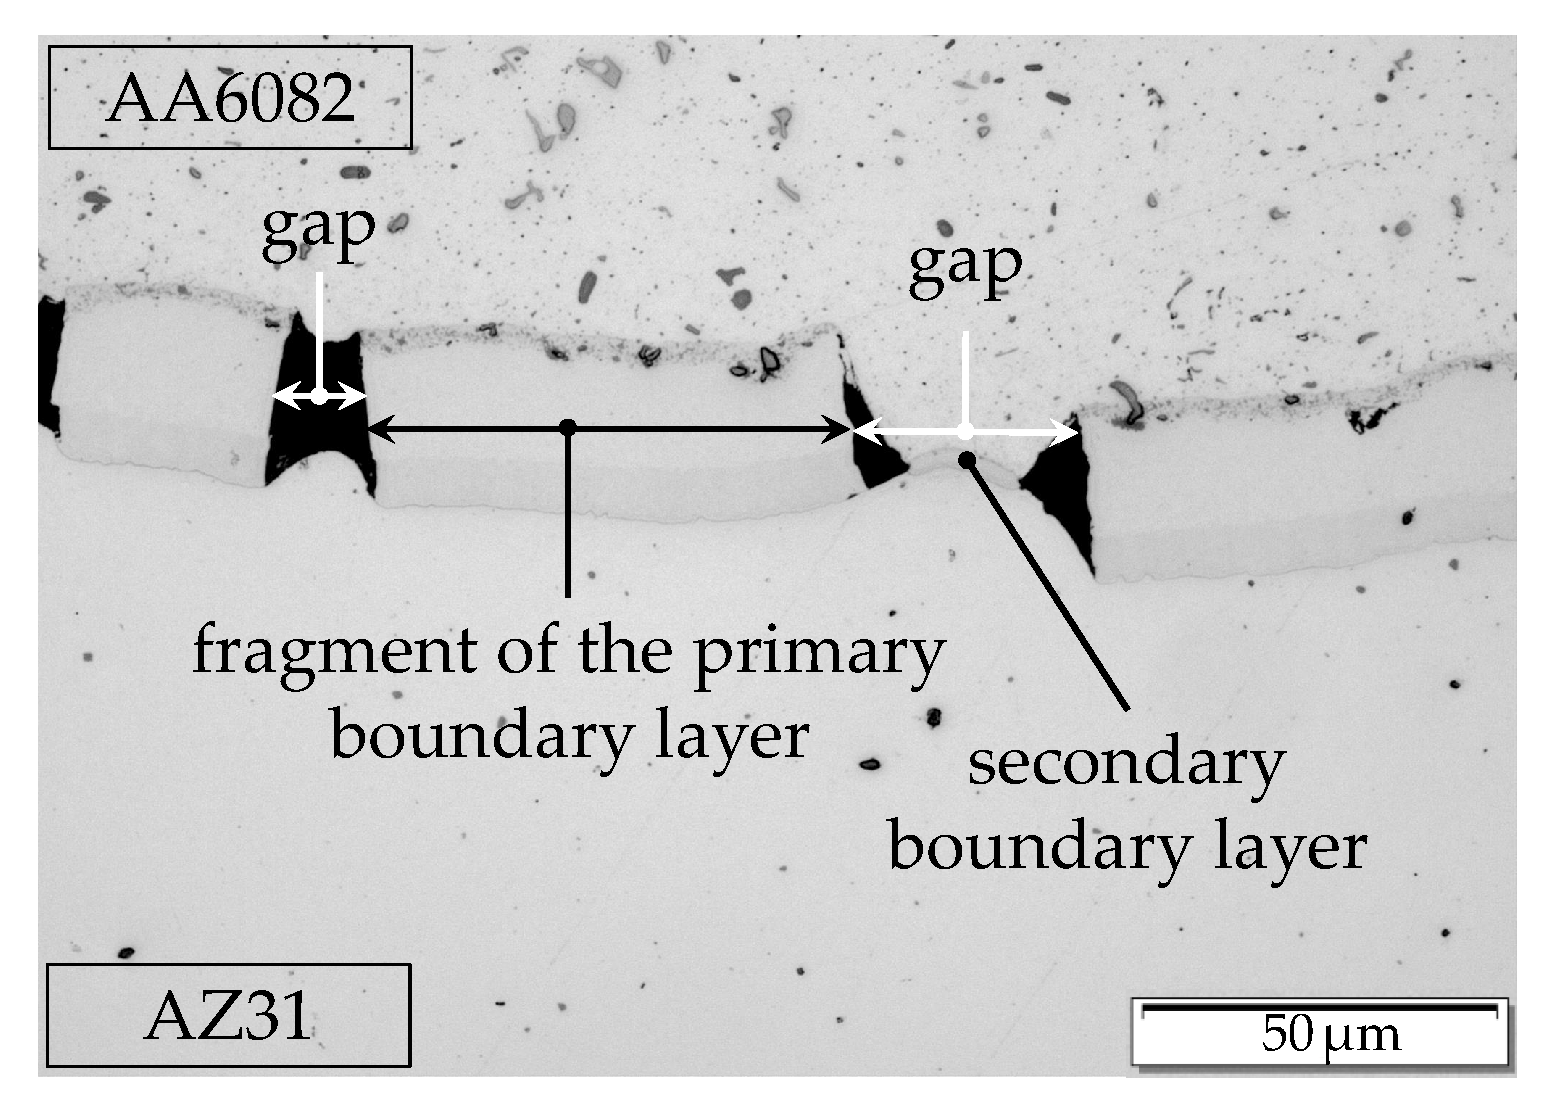
2.1. Metallographic Evaluation

At first, the check of the real boundary layer thickness is performed. With the aid of the digital light microscope Leica VZ700 C with a DVM2500 camera (Leica Microsystems GmbH, Wetzlar, Germany), the sample edges are closely investigated. These positions are appropriate due to the negligible deformation during the compression because of the special sample shape (see Section 3.2). The boundary layer thickness here corresponds to the state directly before the compression test. To minimize the influence of local fluctuations in the thickness and for a statistical coverage, five measurement points at both outer edges are analyzed per sample. The present average thicknesses differ only slightly from the desired ones. The maximum deviations ( 2.5 μ m ) and fluctuations can be detected for a thickness of 25 μ m , resulting from distinctions in the heating process.
In regards to the following evaluation of the boundary layer structure with respect to the number and length of fragments together with the distance between them, it is worthwhile to depict the whole boundary layer in one image. The related microscope software enables an image extension to cover large structures with a sufficient resolution. After preparing boundary layer images of all specimens, each fragment and gap is sized (Figure 5) to receive information about the boundary layer behavior under load. If the basic materials come into contact again between two fragments, a new secondary boundary layer is built that still belongs to the gap and is not treated as a new fragment. The deformation behavior of the secondary boundary layer cannot be investigated with the channel compression test shown here. Due to an unknown point of development, this layer is only exposed to an unknown part of the complete deformation. Furthermore, the thickness differs enormously from the primary boundary layer, resulting probably in another deformation behavior as the following investigations indicate. In the following assessment, the designation interface includes the complete contact area of the two basic materials and therefore contains fragments and gaps. The designation boundary layer only contains the fragments.
The schematic sketch in Figure 6 shows the measured dimensions above described together with the associated parameters used for the evaluation. The length l 0 corresponds to the theoretical initial boundary layer length in an ideal manufactured specimen without the meandering shape of the real boundary layer. A measurement of the real initial boundary layer is not possible due to the necessary new surface preparation after channel compression, resulting in a material removal and accordingly another cross section. Additionally, the disposal of the embedding resin after measuring l 0 could damage the specimen and its boundary layer.
Receiving initial information about the ductility of the boundary layer, the length of the fragments is summed up to l T F in Equation (1) to compute the average fragment strain according to Equation (2). ε F should not be seen as a breaking elongation of the boundary layer due to the strong strain inhomogeneity in the specimen due to the special specimen shape:
l T F = i = 1 n l i F ,
ε F = l T F l 0 l 0 .
The lengths of the gaps are also summed up to l T G in Equation (3) and used to calculate the percentage of gaps on the interface p G after channel compression according to Equation (4). In contrast to ε F , the variable p G is only based on dimensions measured at the deformed cross section and is not subjected to any assumptions like l 0 :
l T G = i = 1 n 1 l i G ,
p G = l T G l 1 × 100 % .

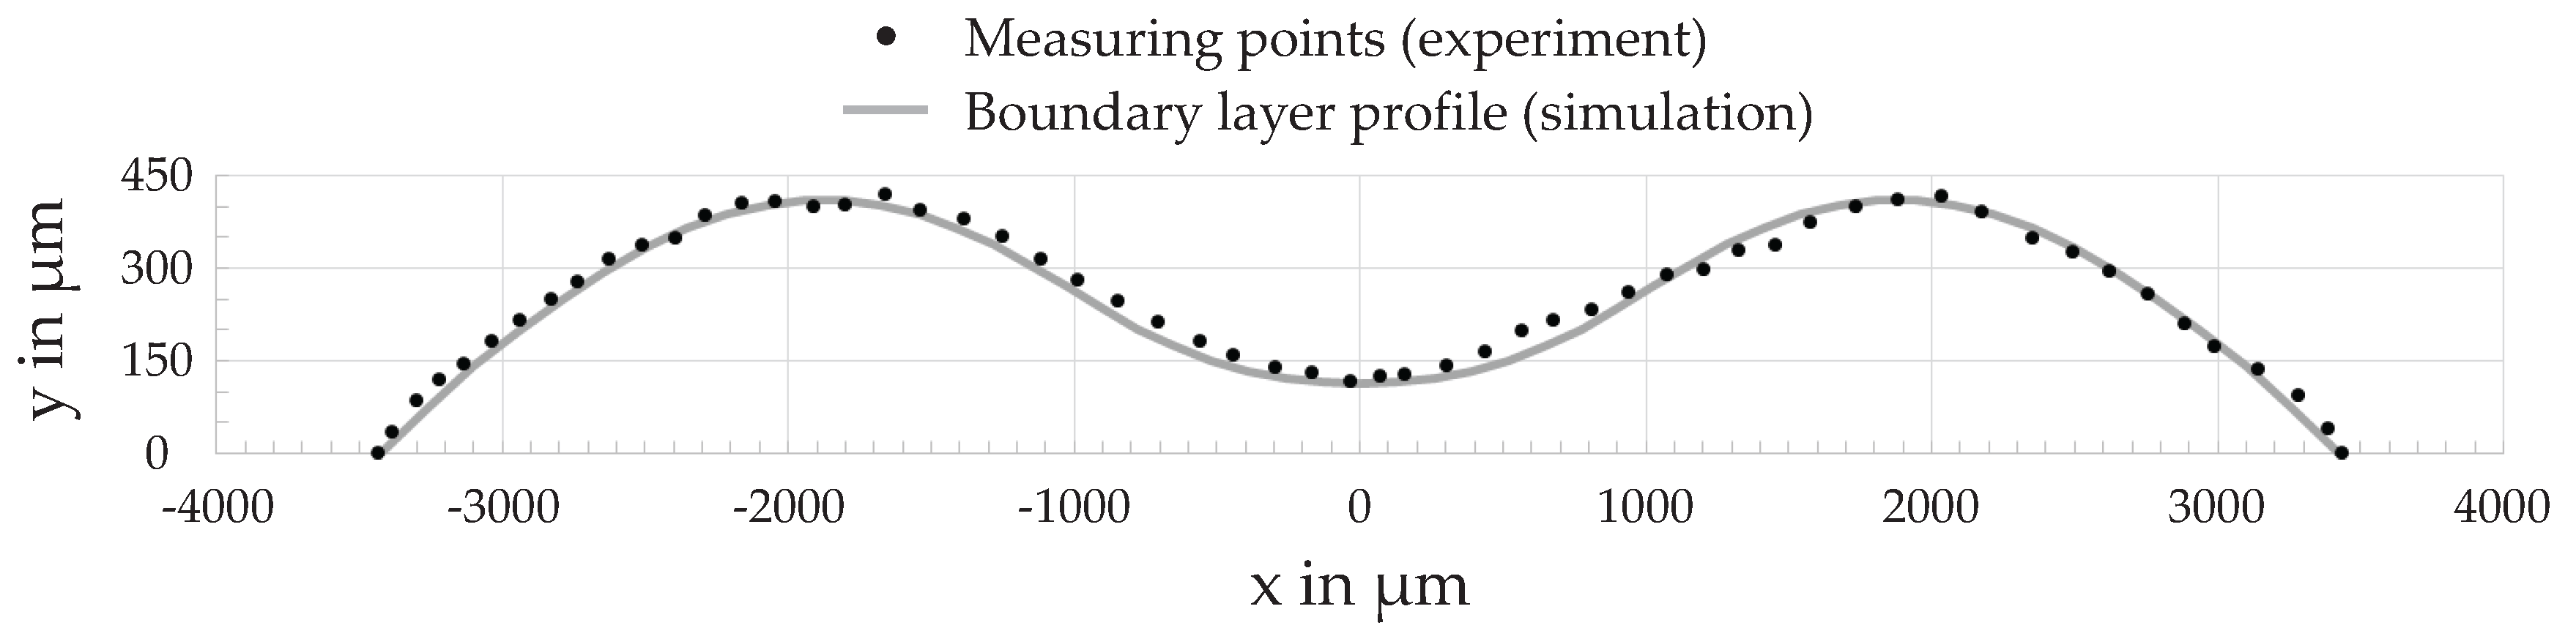
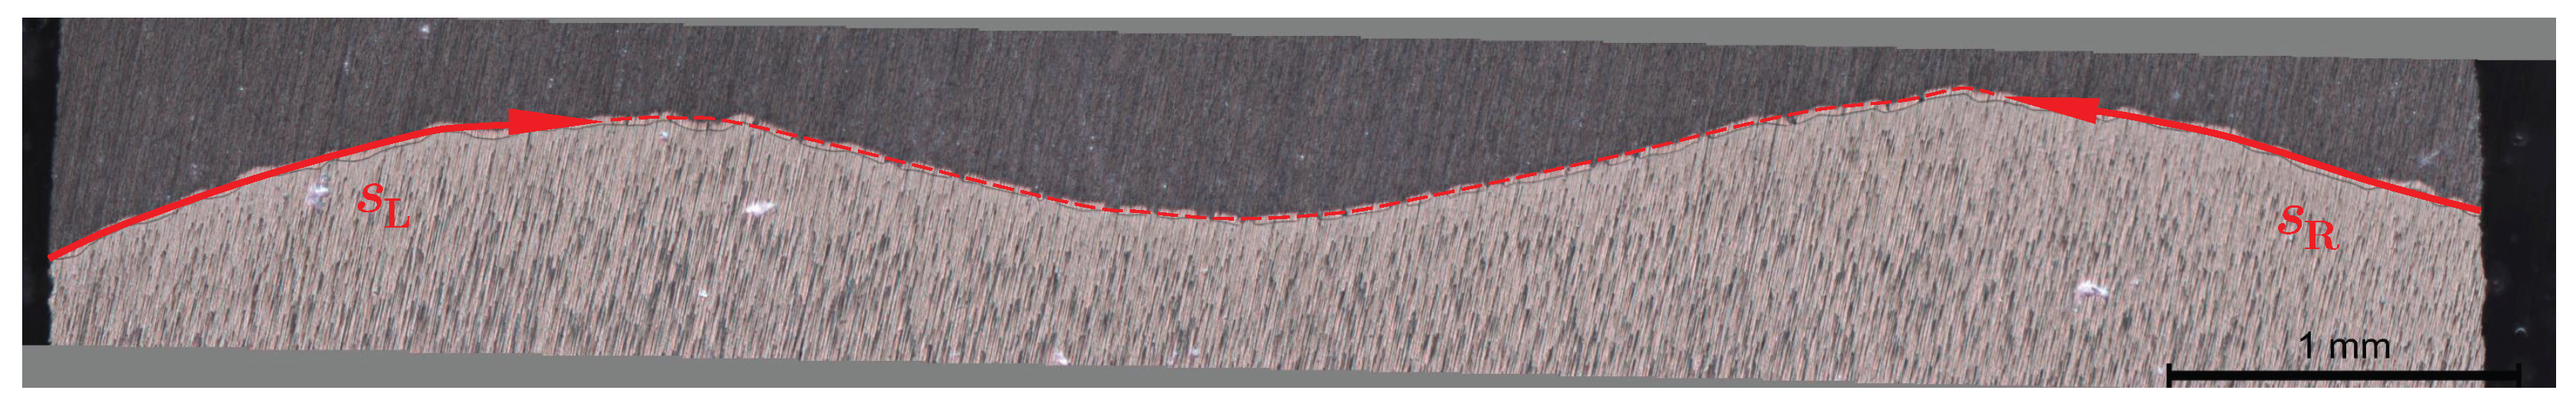
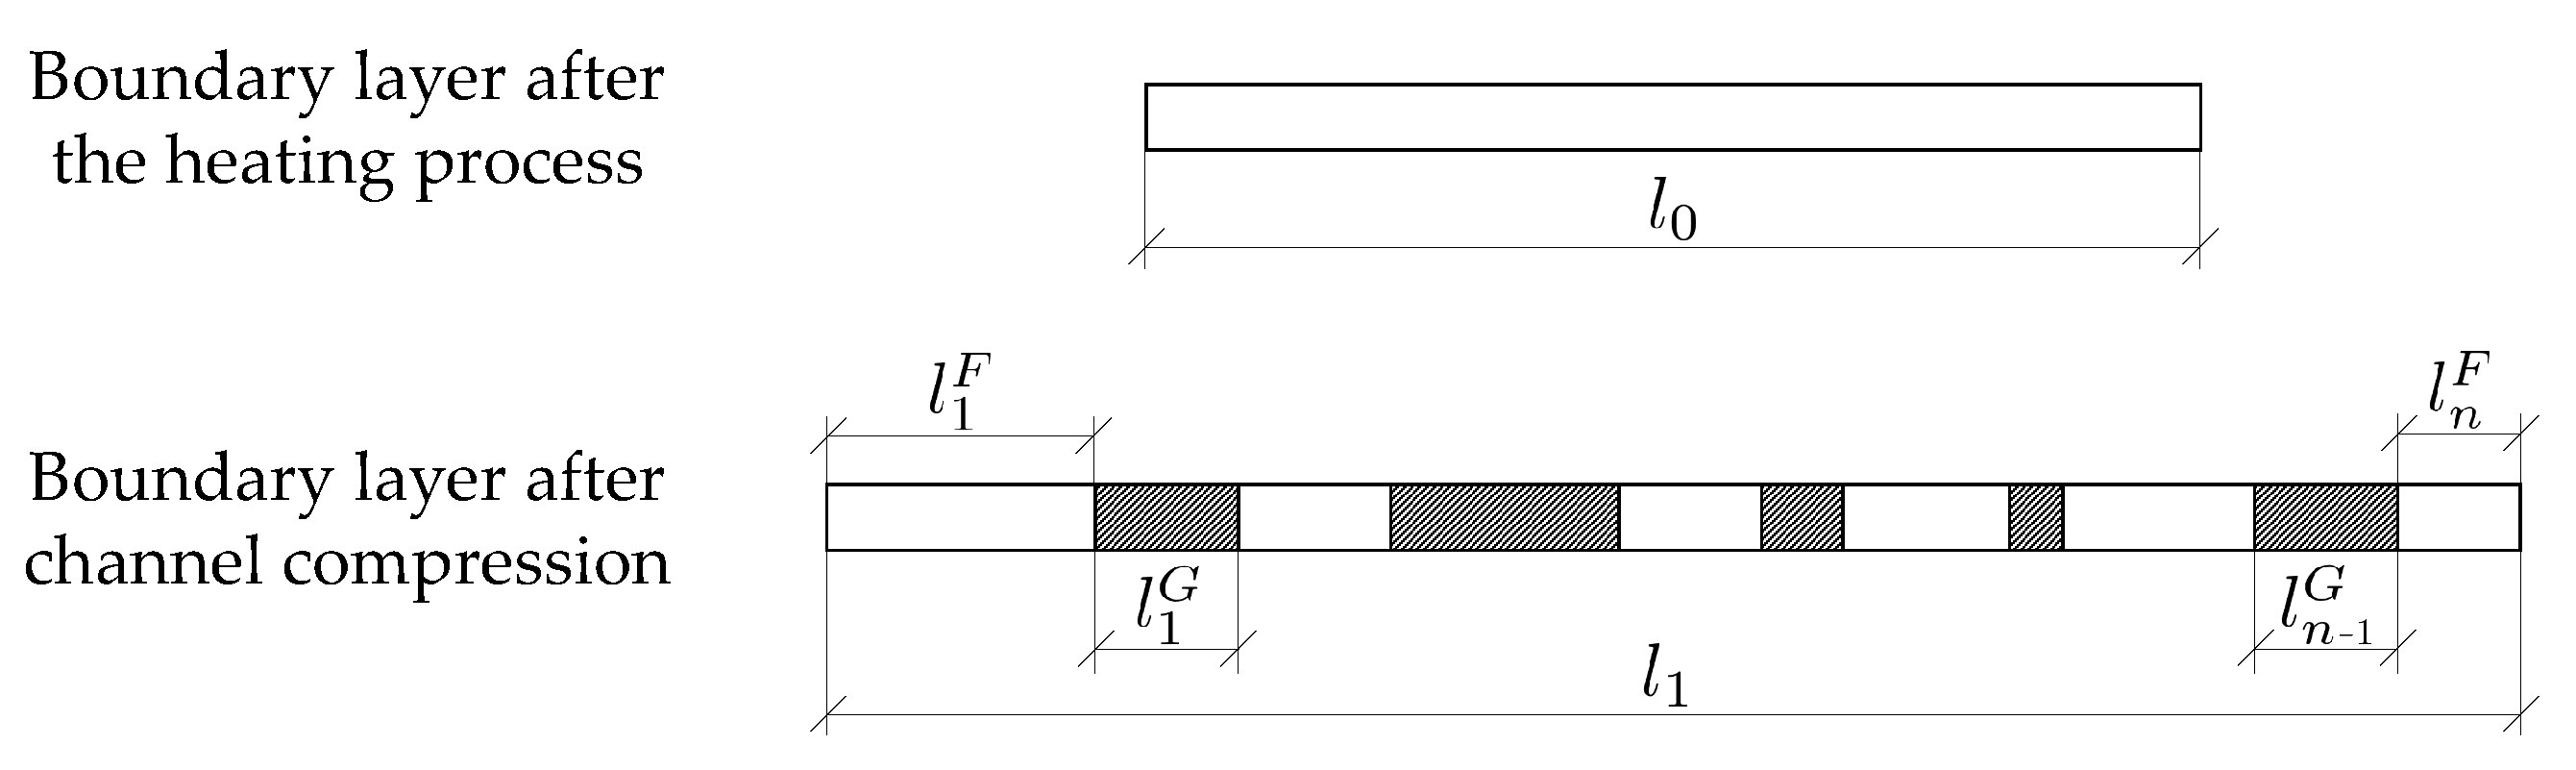
2.2. Stretch of the Boundary Layer

The special specimen shape induces an irregular distribution of the boundary layer stretch. This results in an area of fragmentation that is always located in the middle of the interface. In the outer parts, no fragmentation occurs. To determine the distribution of the boundary layer stretch, a numerical simulation of the channel compression test is performed with ABAQUS 6.14-4 (Dassault Systèmes Simulia Corp., Providence, RI, USA).
To verify the numerical simulation, the profile of the boundary layer after the compression is used. A comparison of all 21 boundary layer profiles reveals no significant differences independent of the fragmentation state. The measurement of the profile is done by a dot-wise scanning in the image of the whole specimen shown. The specimen 3 of the parameter set V3 serves as a reference. Due to the approximately identical profiles, the deformation behavior and the fragmentation state of the boundary layer respectively seem to have no influence on the specimens macroscopic deformation. For that reason, the boundary layer is not included in the simulation.
The three-dimensional simulation is based on some simplifications and makes use of both symmetries. A schematic display of the numerical setup is shown in Figure 7 together with the used mesh geometry. The stamp, steering plates and base plate consist of rigid bodies. The steering plates and the base plate are connected to the channel and rigidly clamped. The stamp performs a vertical shift of 1 m m . Shifts in all other directions and rotations are suppressed. The determined stamp shift does not correlate with the traverse stroke in the experiments due to the missing elasticities of the experimental setup in the numerical simulation. The stamp velocity is 200 m m / s . At the sections with contact boundary conditions, friction is assumed. Between channel and specimen, a friction coefficient of 0.1 is determined due to the lubrication. The specimen’s top and the stamp are not lubricated, which is why the friction coefficient here is increased to 0.2. The heat-up and cool-down processes as well as the load relief after the compression test are not considered in the simulation.
The material behavior in the simulation is based on flow curves determined by tensile tests with dwell times and monolithic specimens extracted from the hydrostatic extruded rode. More information about the tensile tests can be found in [24]. A tension–compression–anisotropy that occurs through the production process is not considered in the simulation. According to NOSTER [25], the influence of the stress direction on the deformation behavior of hot-rolled AZ31 at room temperature disappears at 300 C . Therefore, the use of an isotropic material behavior is permitted.
The implementation of rate-dependent flow curves in ABAQUS is possible through the specification of a quasi-static flow curve together with the increase of the yield stress in accordance with the equivalent plastic strain rate. The flow curves for AZ31 and AA6082, respectively, are described in Figure 8 and Figure 9. The approximate quasi-static flow curves correspond to the experimentally determined curves at a logarithmic deformation rate of 5 × 10 5 s 1 . The deformation rate in conjunction with a stamp velocity of 200 m m / s exceeds the deformation rate of the tensile tests, for which reason the flow curves are extrapolated.
Both the quasi-static flow curves as well as the increasing of the yield stress are adapted and extrapolated, respectively, with the aim of fitting the boundary layer profile in the simulation to the measured one. The deviations from the measured flow curves that could emerge are subordinated to this aim. A comparison of the real boundary layer profile with the simulation revealed a satisfactory accordance (Figure 10), allowing to deduce the stretch of the boundary layer from the numerical simulation.

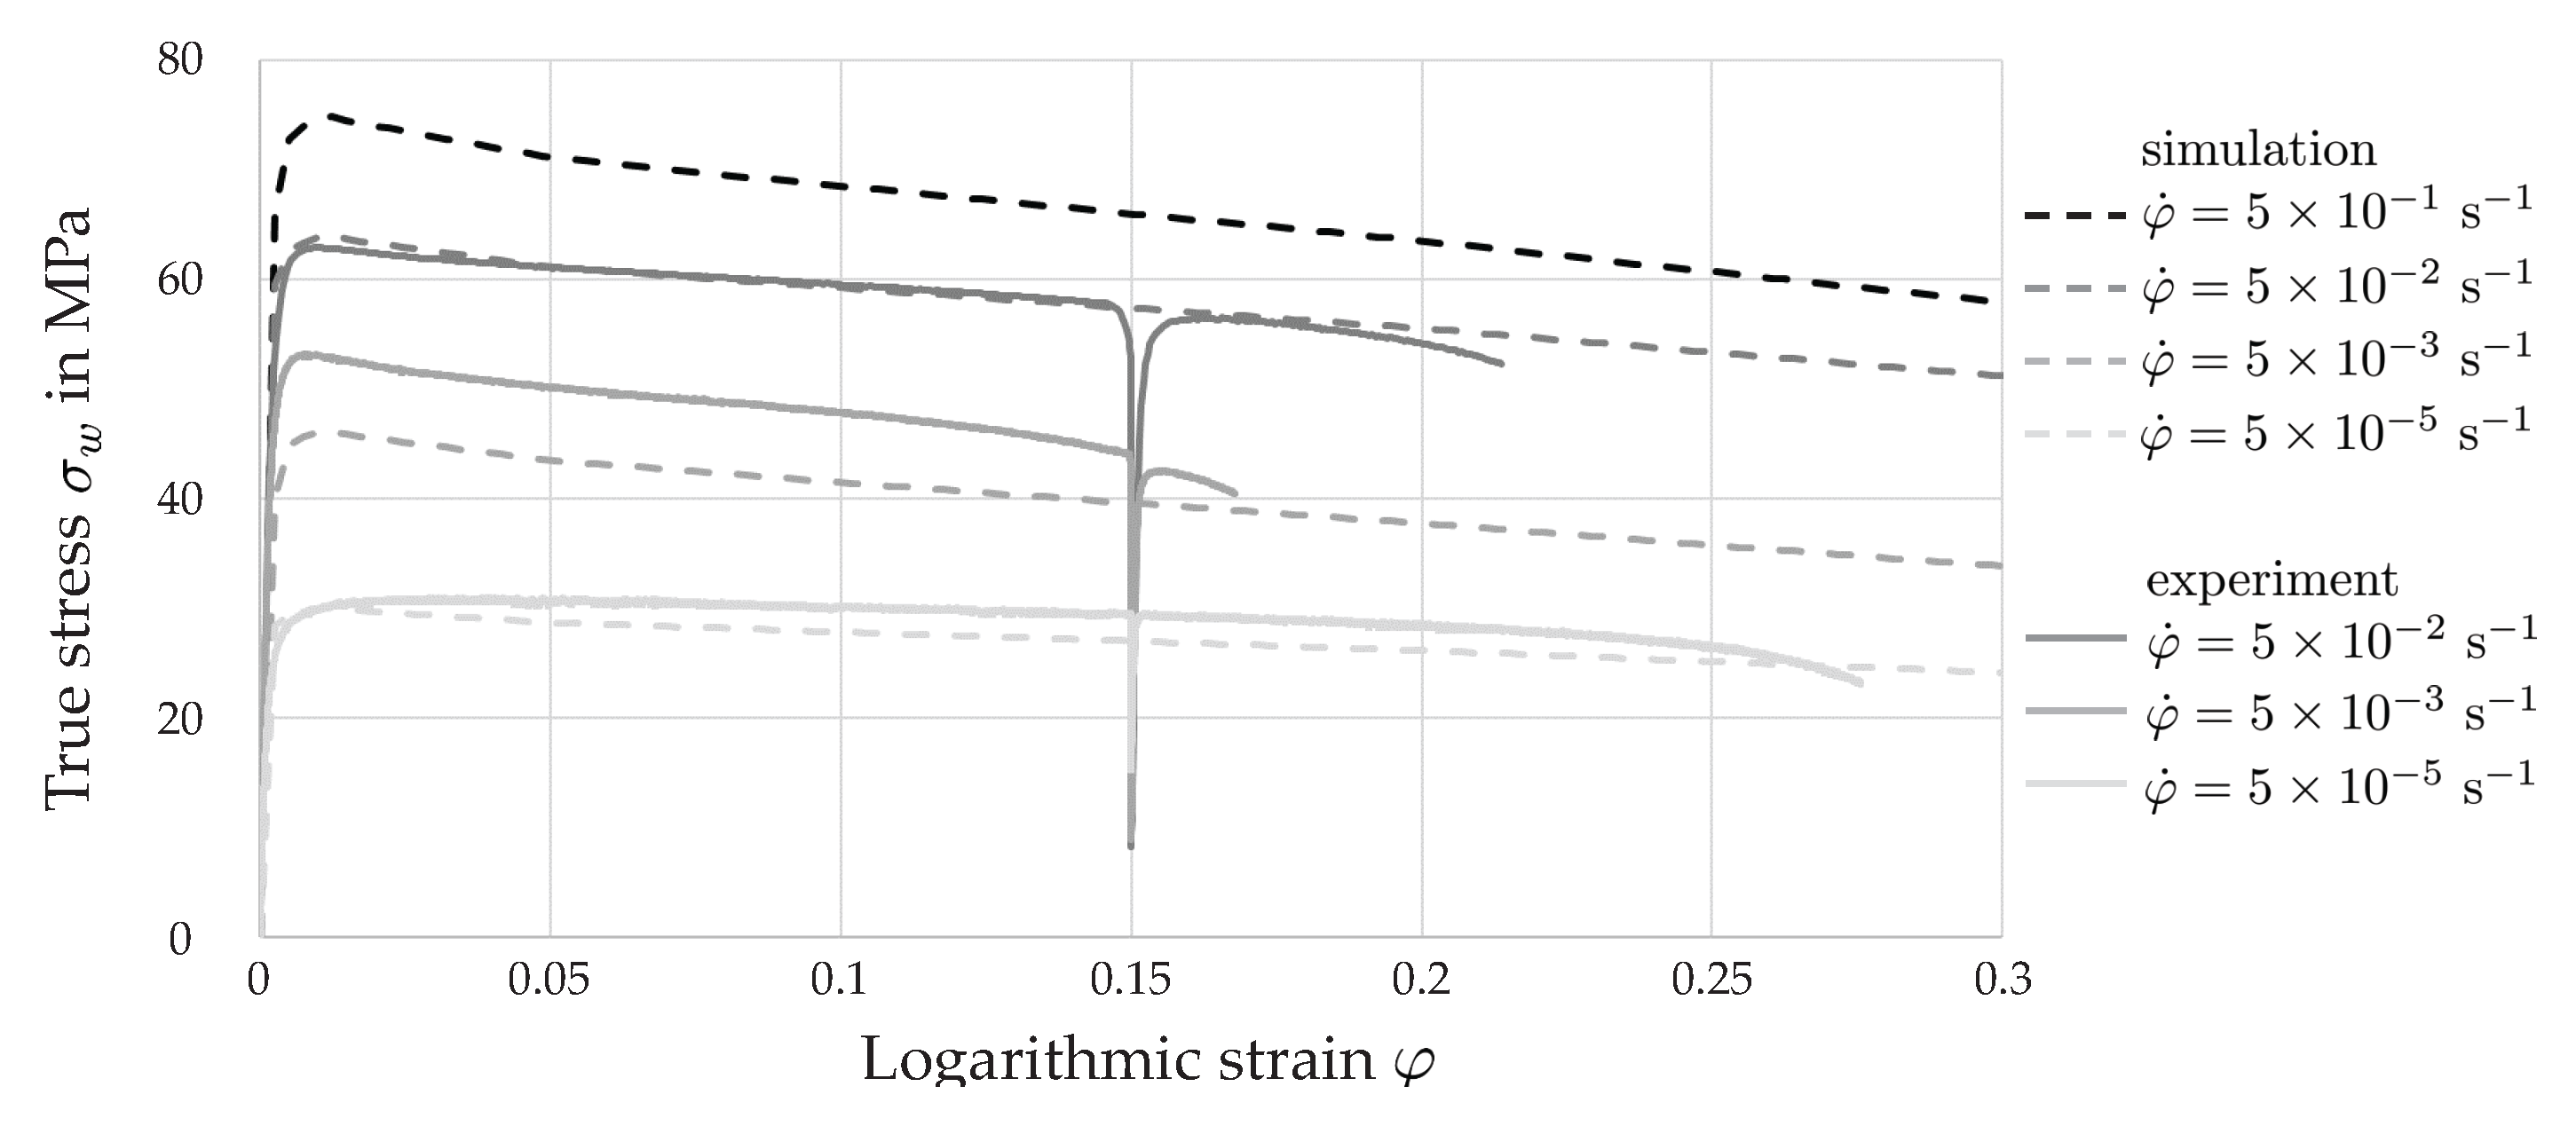
3. Results and Discussion

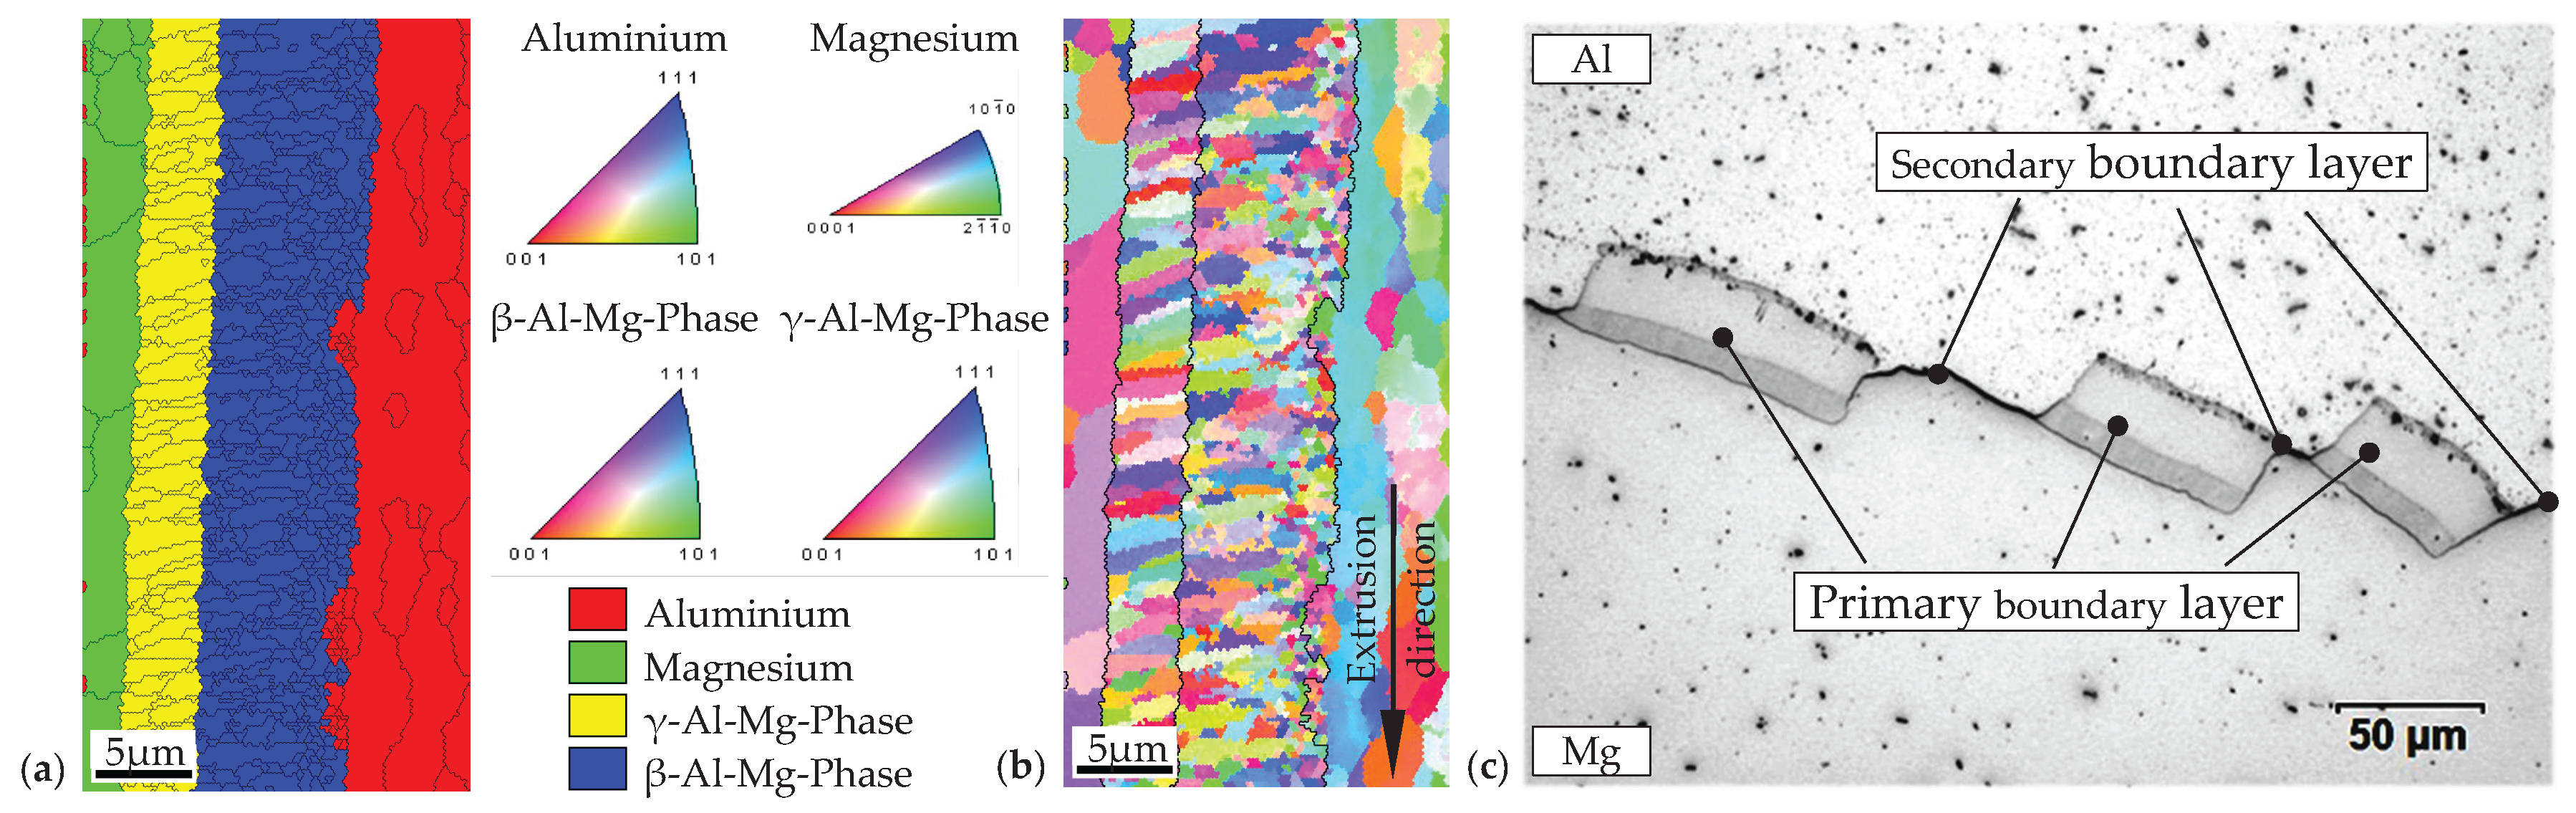
3.1. Metallographic Evaluation

Receiving initial information about the ductility of the boundary layer, the average fragment strain and the percentage of gaps are evaluated. The results regarding the dependency on stamp velocity of a 25 μ m thick boundary layer are shown in Figure 11. The large deviations between samples with the same boundary layer thickness result from irregularities in the microstructure (e.g., inclusions, the meander shape of the boundary layer, etc.) and small deviations during testing (e.g., testing temperature, stamp stroke, etc.). The maximum average fragment strain of ε F = 6.9% is reached with a stamp velocity of 0.2 m m / s . Such a deformation is very slow in comparison to mass forming processes and not industrially used. The remaining higher stamp velocities lead to no significant fragment strain ε F and thereby reveal a brittle material behavior. The shift from brittle to ductile material behavior lies between the stamp velocities 0.2 m m / s ( ε F = 6.9%) and 2 m m / s ( ε F = 1.9%). Such a brittle-to-ductile transition in β - and γ -Al-Mg-phases at 300 C is known from the literature [26,27]. The microstructure seems to have a significant influence due to the possibility of grain boundary sliding and the effects on the dislocation movement.
As expected, this trend is also seen by considering the percentage amount of gaps on the interface (Figure 11b). The brittle material behavior expresses itself through an increasing amount of gaps on the interface. The stretch of the interface then arises from the fragment movement and not from the stretch of the fragments.
The comparison of the interface structures in Figure 12 shows two brittle boundary layers. The interface of V4 is represented by a large number of gaps and short fragments, respectively. The distinctive higher amount of gaps in V4 than in V2 indicates an increasing brittleness with higher stamp velocities even though the difference in the average fragment strain is small.
The dependency of the fragmentation state on the boundary layer thickness is investigated by the same strategy. The associated diagrams are shown in Figure 13. Here again, a clear trend becomes apparent. With a decreasing boundary layer thickness, the ductility increases significantly up to an average fragment strain of 15.6% for a thickness of 7.5 μ m .
The percentage of gaps on the interface follows, as expected, a reverse trend compared to the average fragment strain. Decreasing the boundary layer thickness also leads to a decreasing p G due to an enhanced ductility. The stretch of the interface then results from the stretch of the boundary layer. Firstly remarkable is the extremely low number of gaps for the parameter set D1. Additionally, the gaps seems to be randomly distributed. Secondly, the comparison of the sets D3 ( 12.5 μ m ) and D4 ( 25 μ m ) reveals an almost identical number of gaps and fragments, respectively. Only the size of the gaps is smaller in D3, therefore indicating a more ductile material behavior. It might be assumed that these gaps emerge at a later point in time in the channel compression test, resulting in the partial filling of the gaps with the basic materials. For a 25 μ m thick boundary layer, the interface elongation happens through a movement of the fragments already evolving at the beginning of the compression and resulting in larger gaps.

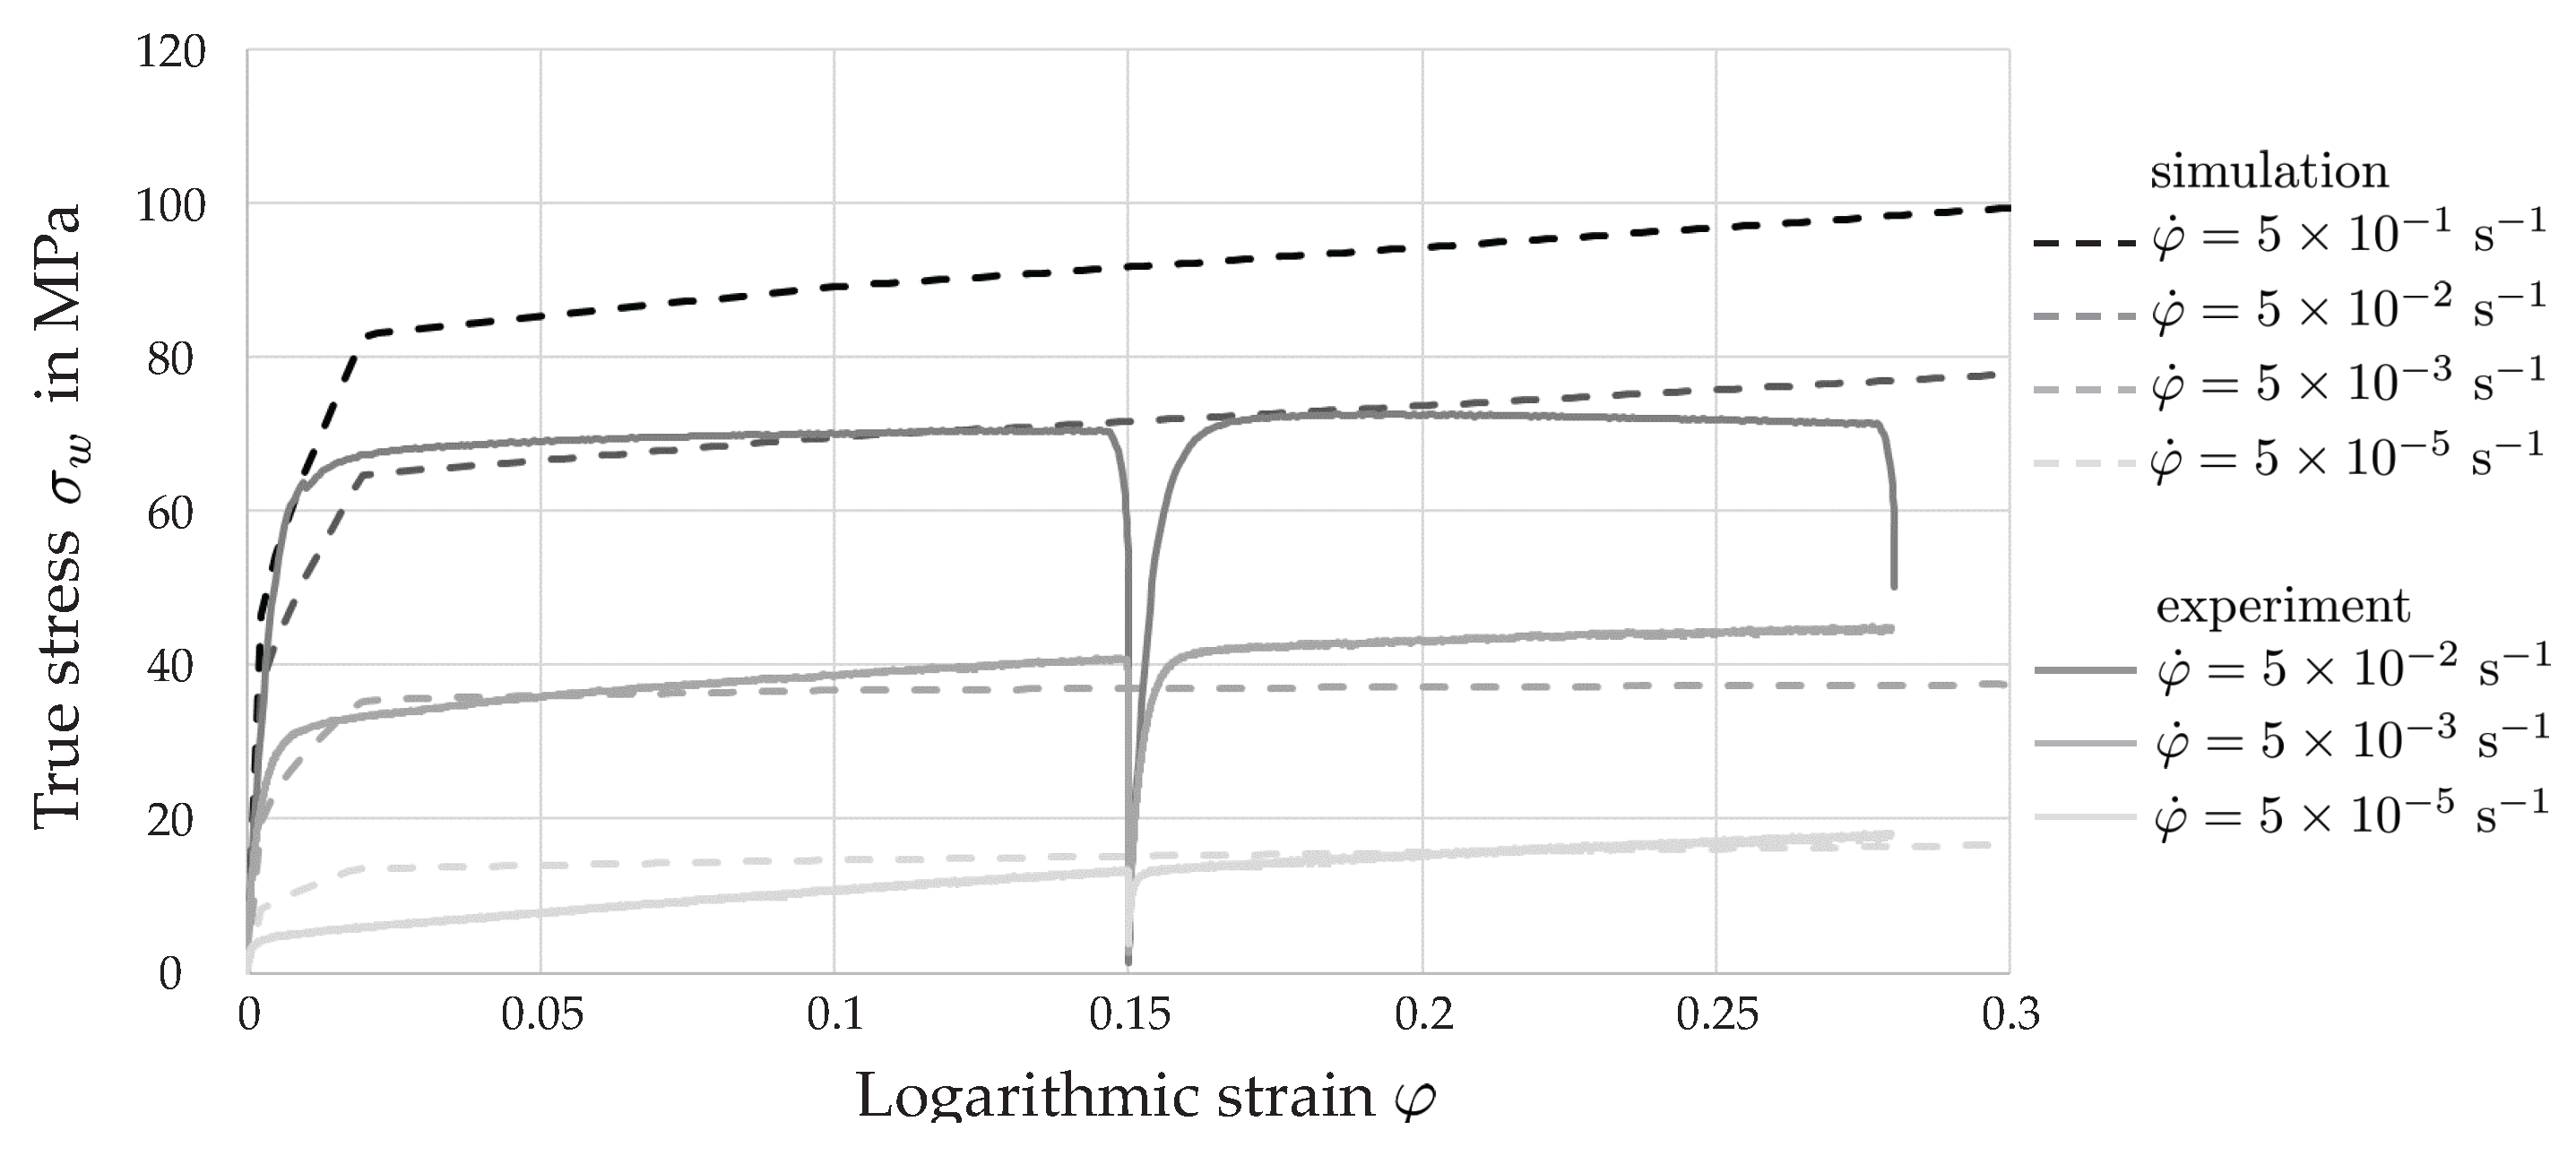
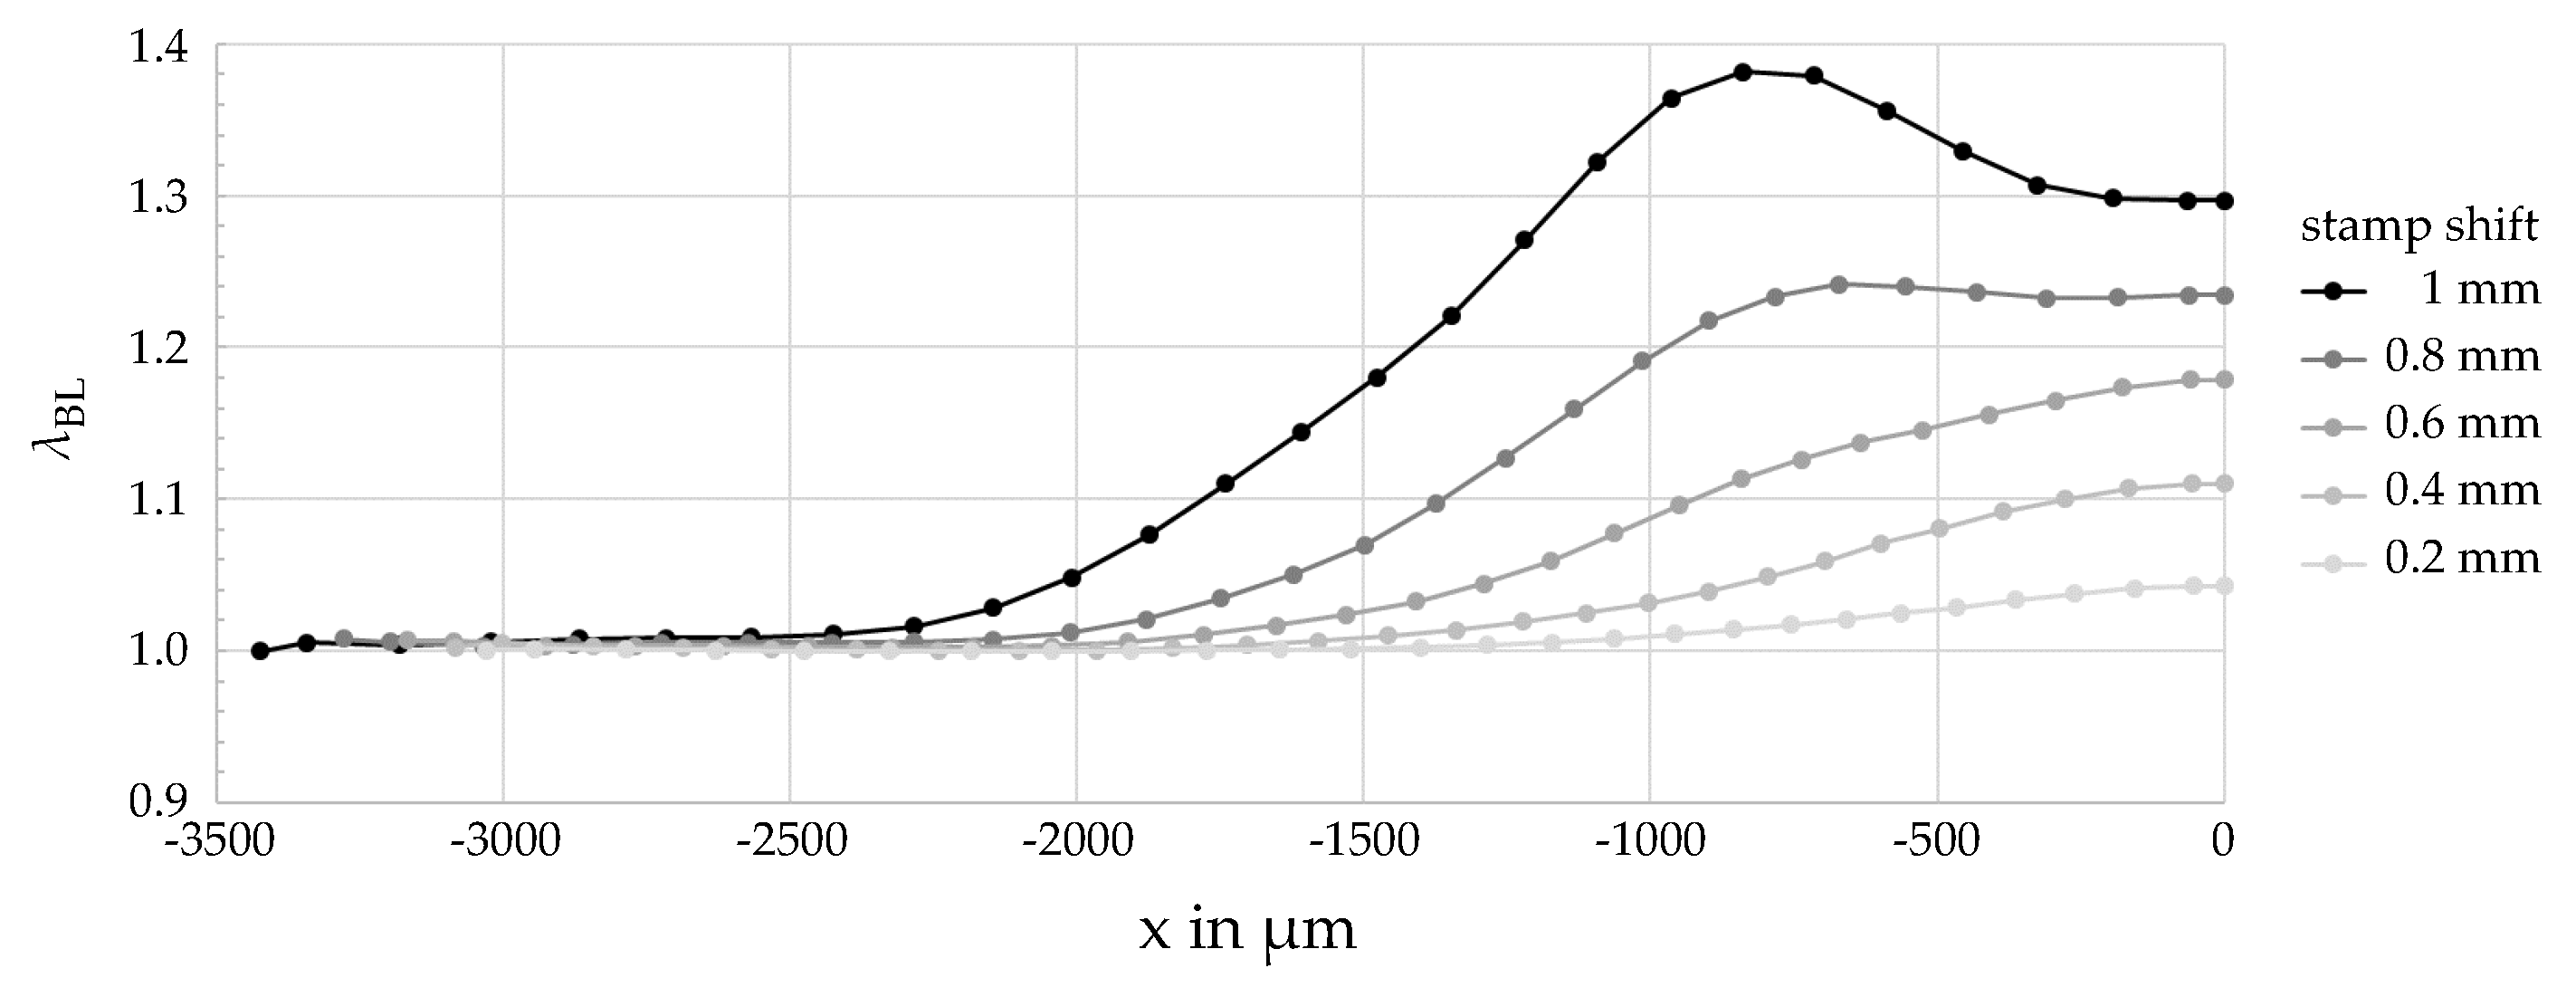
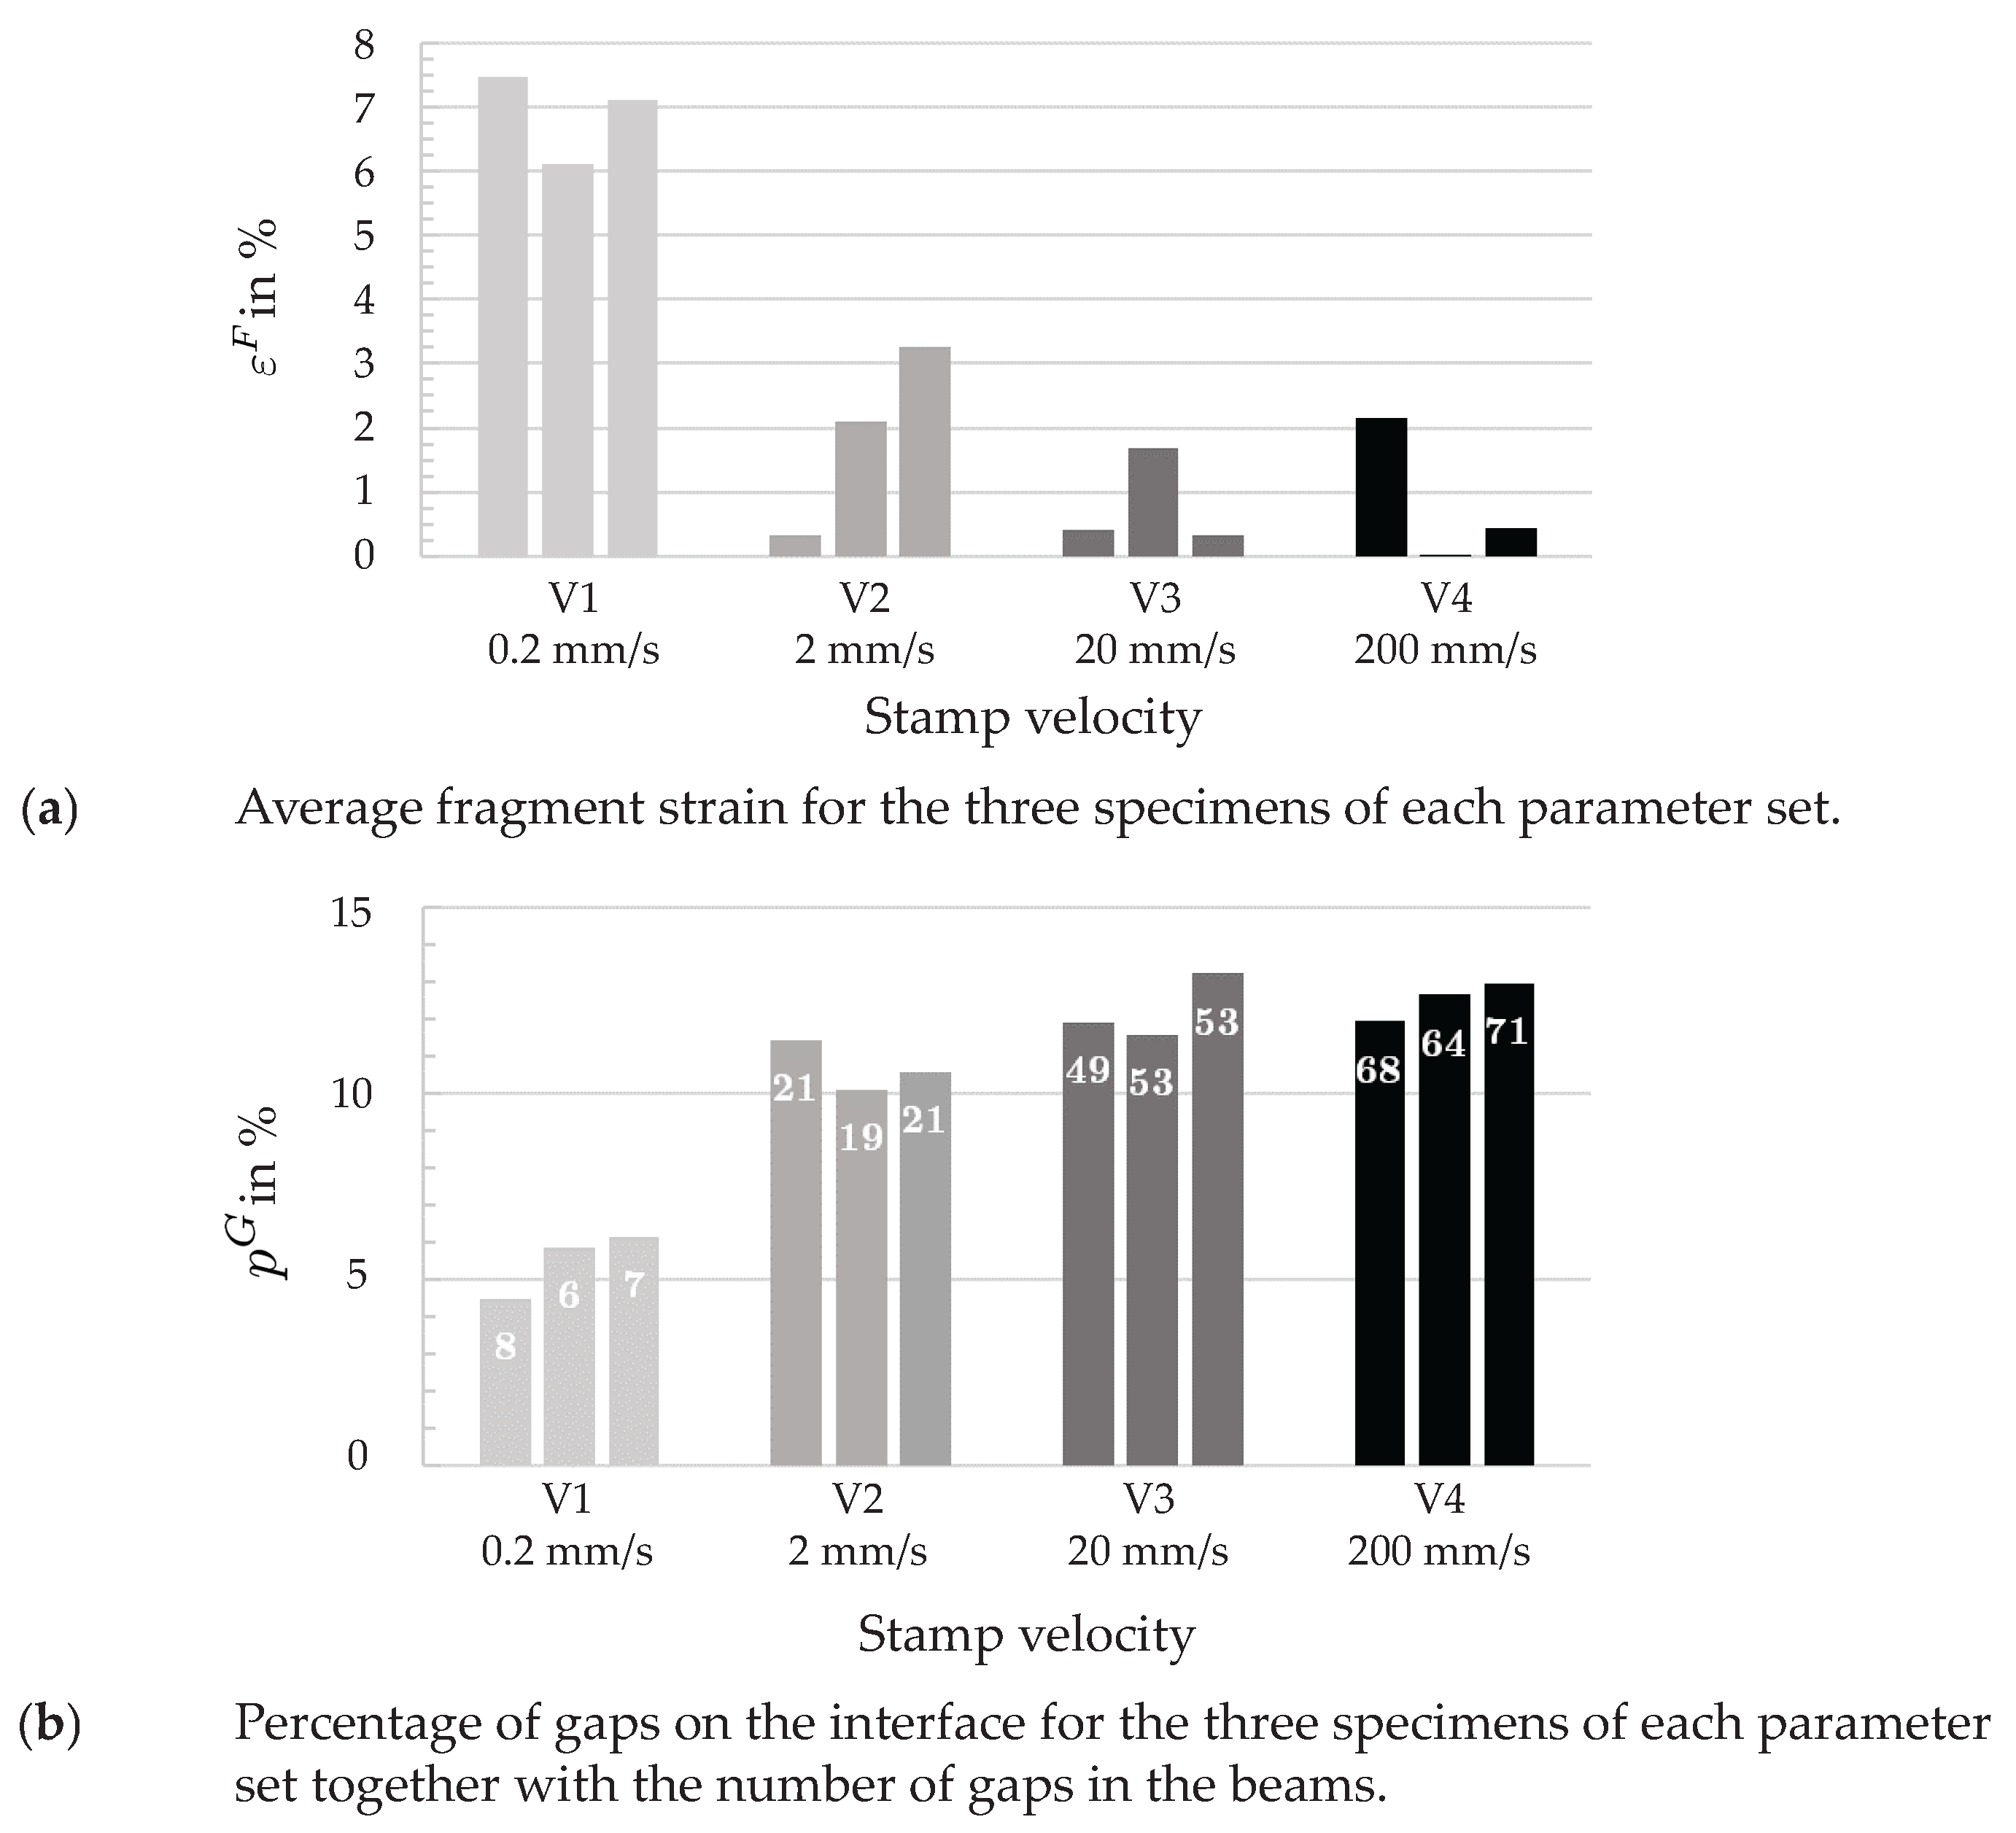
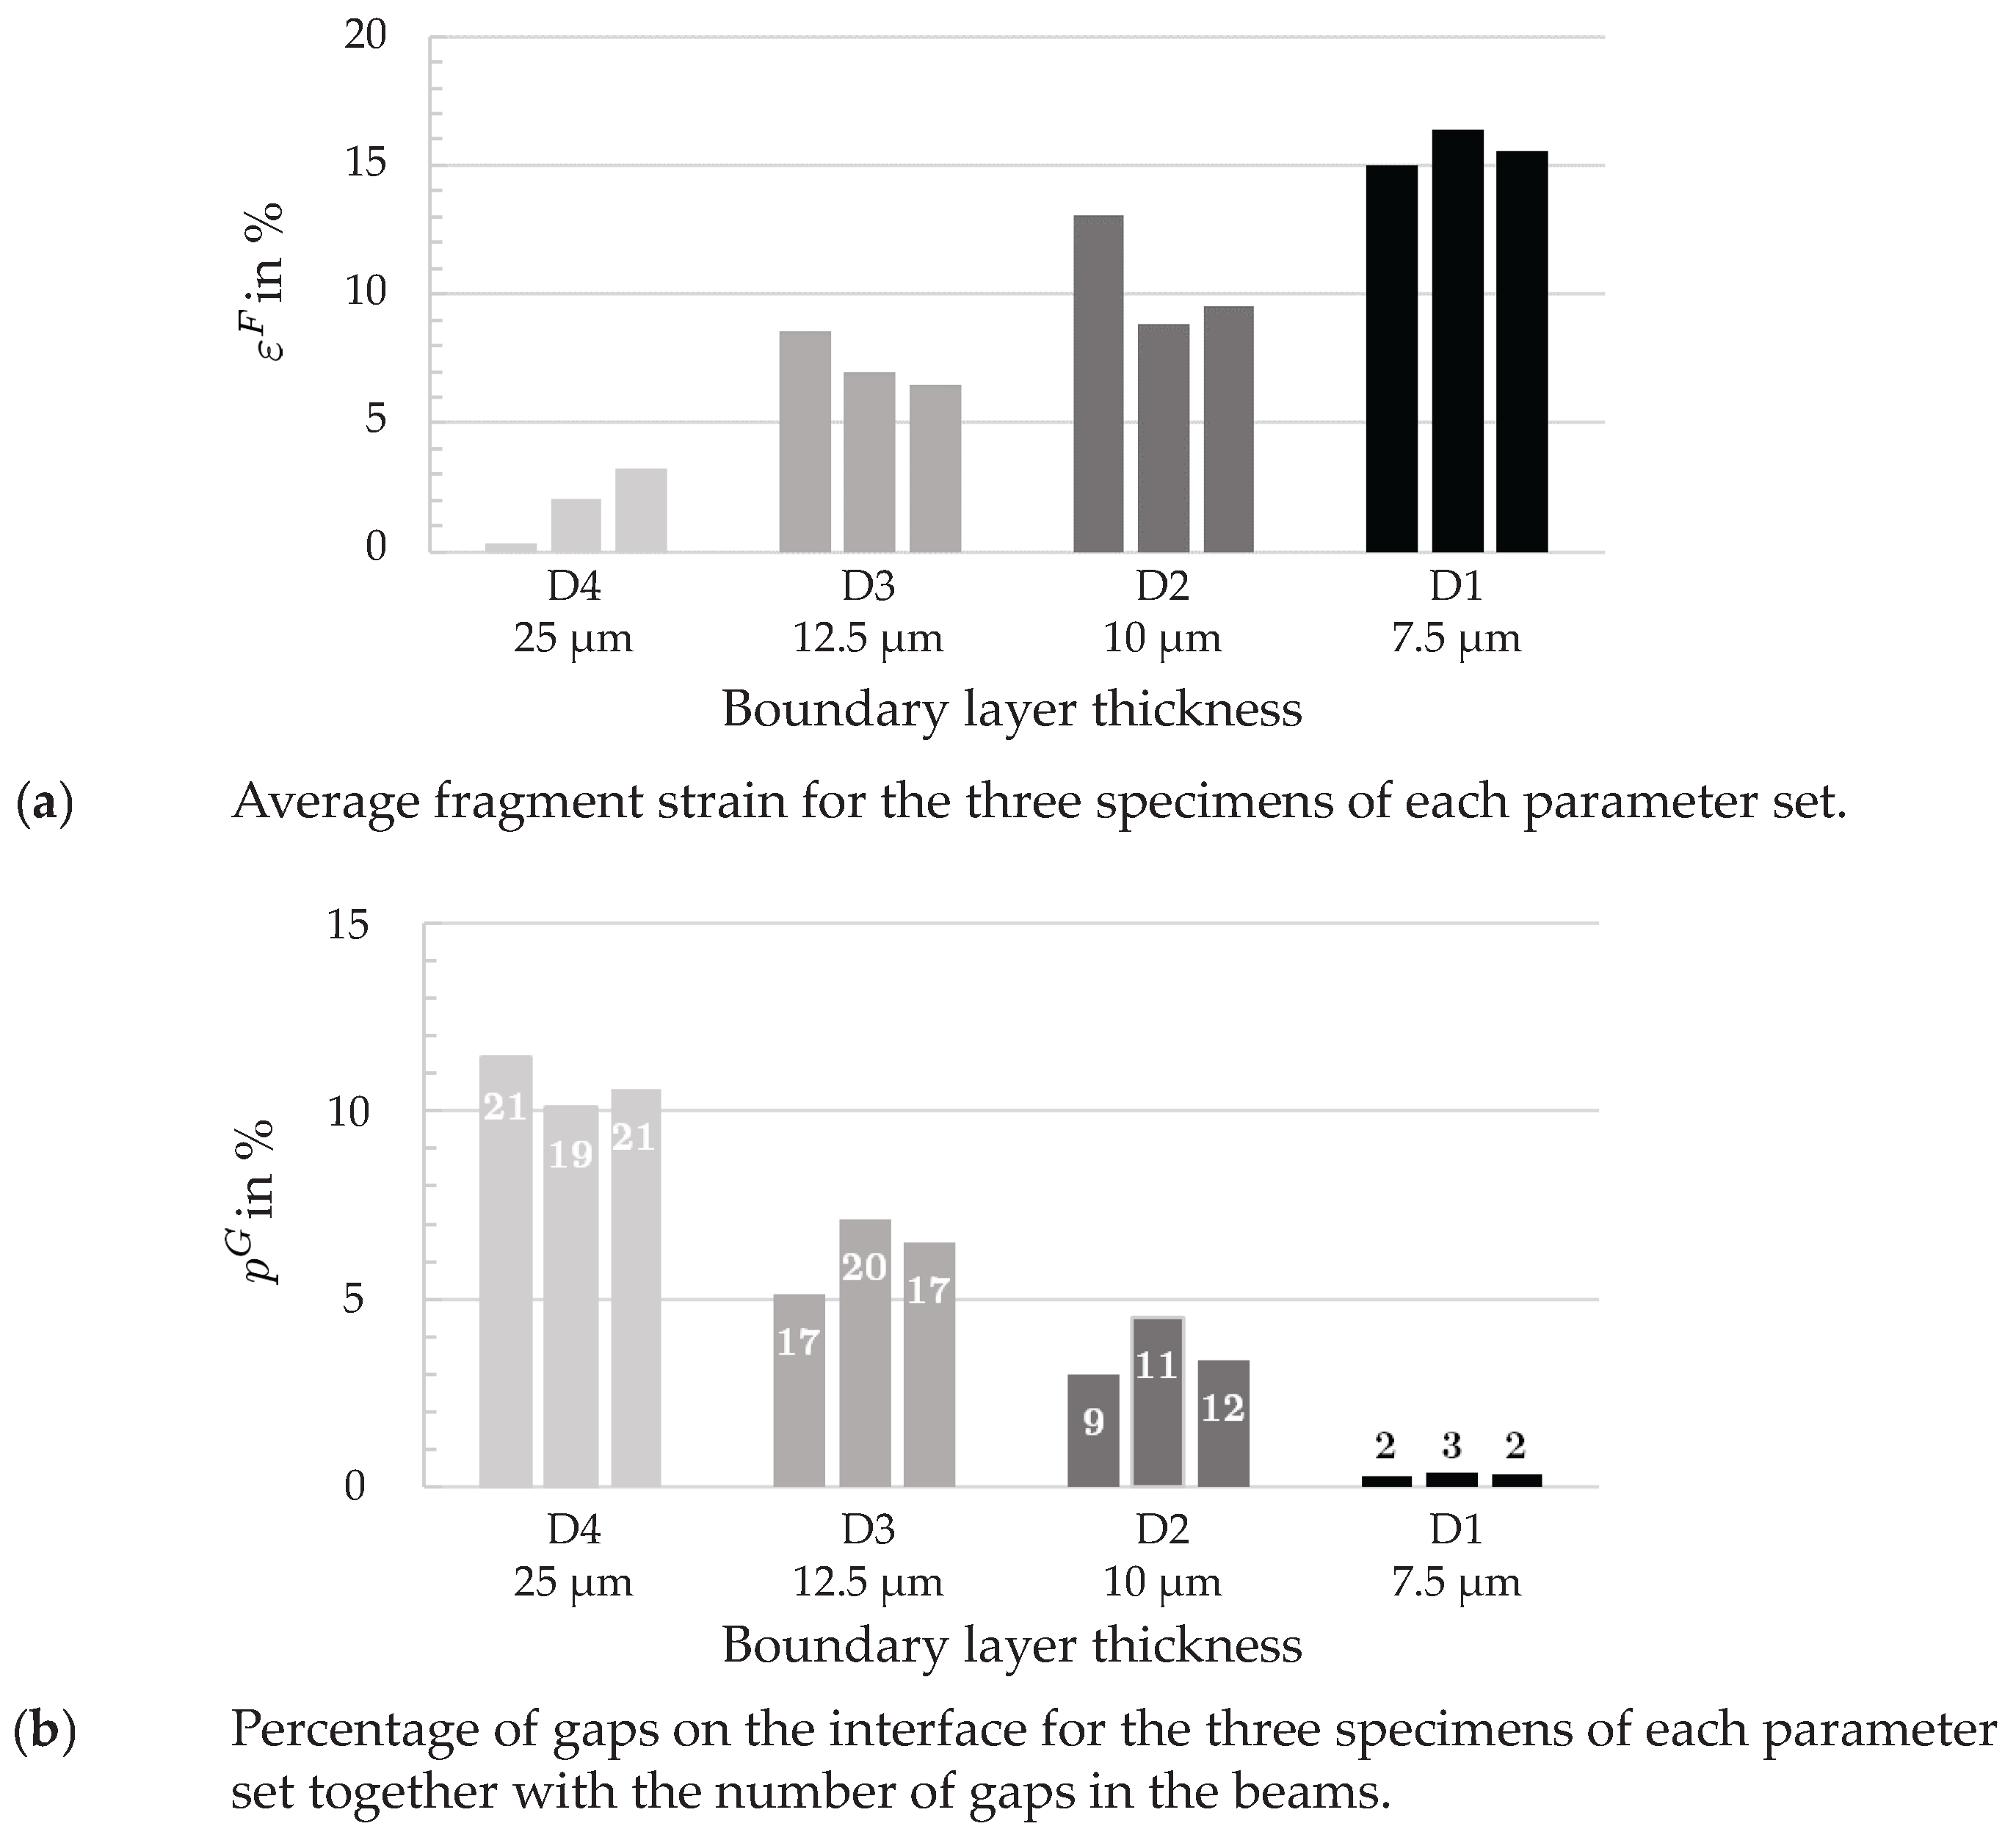
3.2. Stretch of the Boundary Layer

The computation of the boundary layer stretch is based on the coordinates of the nodes located on the interface between the two basic materials in the numerical simulation. Using the distance of two adjacent nodes δ i before ( i = 0 ) and after ( i = 1 ) the compression test respectively, the stretch λ BL between the two nodes can be calculated according to Equation (5):
λ BL = δ 1 δ 0
The resulting stretch profile from the simulation is shown in Figure 14 for different loading stages. Due to the specific specimen shape, the deformation starts in the middle section of the interface and propagates further with an increasing stamp shift. At the outer sections, the interface stays in the origin state. This stretch distribution correlates with the observed fragmentation states in the metallographic evaluation (Section 3.1). Furthermore, it can be determined that, within one specimen, stretches from 1 to 1.38 exist at the same time.
As a result, it is not necessary to consider different loading stages to evaluate different elongations of the interface. This circumstance offers the opportunity for obtaining a critical stretch value depending on the fragmentation beginning point as described below in Section 3.3.
It is clear that the stretch maximum is not located in the center of the specimen (stamp shift of 1 m m ). In the middle of the specimen, the interface runs horizontal and the channel compression test results in this area in an almost homogenous, simultaneously increasing stretching normal to the compression. The area with the maximum stretch experiences an additional stretching through a rotation of the orientation comparable to a simple shear deformation.

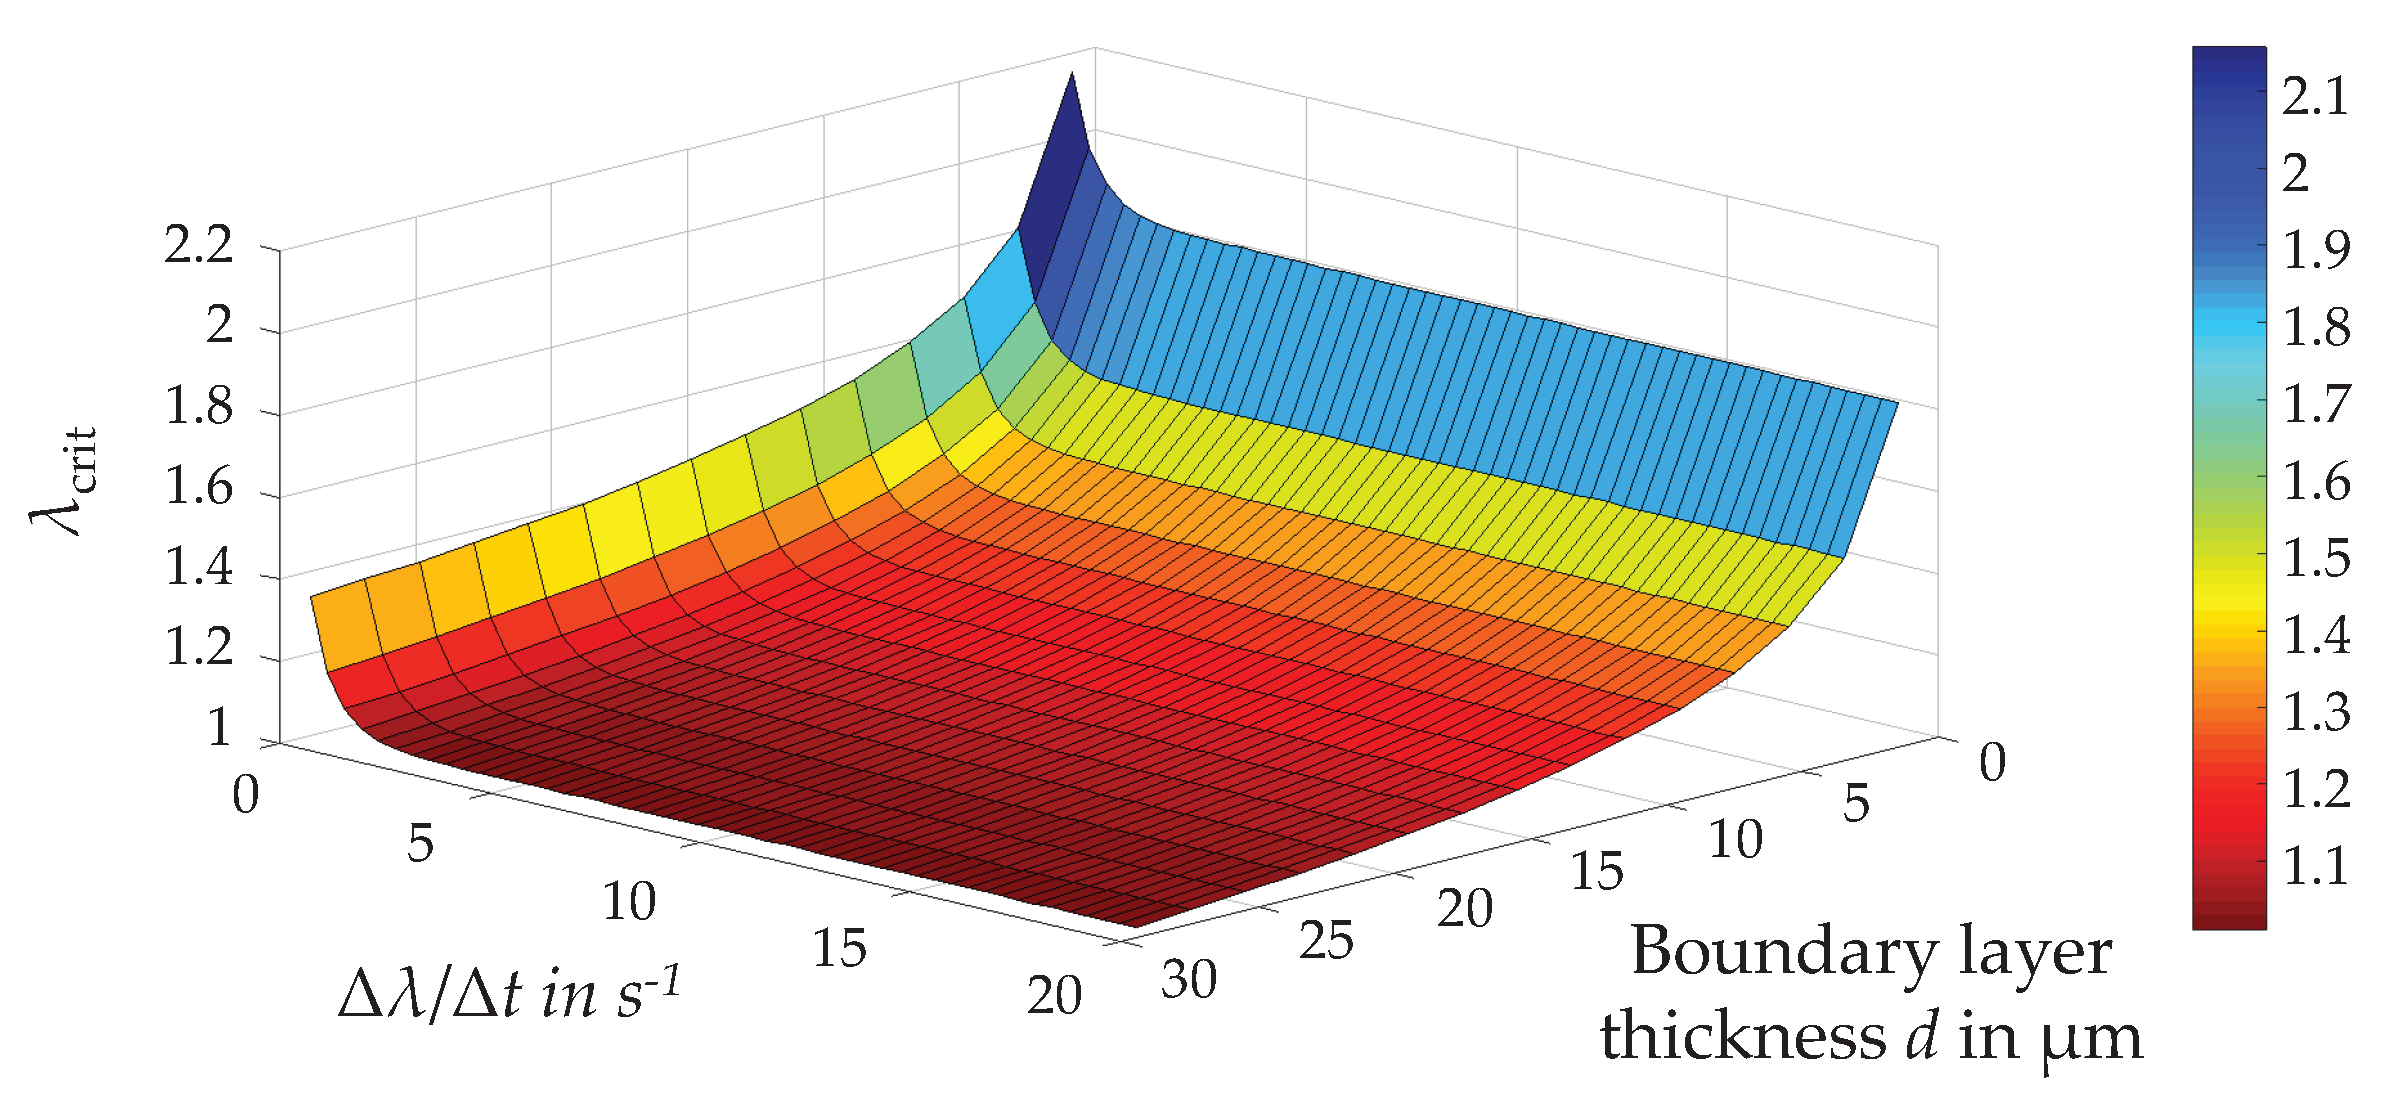
3.3. Fragmentation Criterion

The determination of the critical stretch where the fragmentation of the boundary layer starts is based on the profile variable s. Figure 15 shows the definition of s, which is comparable to the length of a trajectory. It starts at the edge of the specimen and follows the smoothed profile of the interface (dashed line in Figure 15). Smoothing the real profile of the interface improves the comparability to the numerical simulation where the individual meander shape of the real interface is not included.
Starting from each specimen edge and following the interface profile, the position of the first gap is marked as s L , crit and s R , crit , respectively. At this position, the fragmentation has just started and the stretch at this position can be defined as critical stretch λ crit regarding the fragmentation for the related boundary layer thickness and deformation rate. With the assistance of the numerical simulation, every value of s L , crit and s R , crit , respectively, is related to a λ crit value. The results are summarized in Table 2, which contains the average values of λ crit for every parameter set. Additionally, the extreme values s max , crit and s min , crit of s L , crit and s R , crit are listed too for comparison between the parameter sets.
In the case of high stamp velocities ( 200 m m / s and 20 m m / s ), the critical stretch amounts to only 1.03 and 1.04, respectively, confirming the statement formulated above that, at high deformation rates and a boundary layer thickness of 25 μ m , the elongation at fracture is very small. Decreasing stamp velocity and deformation rate, respectively, lead to an increase of s crit and consequently of the critical stretch. The range with fragmentation in the center of the specimen narrows.
The results of the metallographic evaluation regarding the dependency on the boundary layer thickness are confirmed too with the exception of 7.5 μ m . Due to the low quantity of gaps, the determined critical stretch has a poor reliability for this parameter set, for which reason it is excluded from the further utilization. Additionally, the gaps are randomly distributed resulting in inconsistent values of s crit .
On the basis of the experimental and numerical investigations presented above, it is possible to approximate the critical stretch λ crit of the measuring points as a function of the stretch rate Δ λ / Δ t and the boundary layer thickness d. The mathematical approximation is given by Equation (6). The graphical representation in Figure 16 illustrates the identified dependencies. Distortion conditions under the surface indicate an undamaged boundary layer. Above the surface, fragmentation starts. Therefore, Equation (6) can be interpreted as a fragmentation criterion:
λ crit = 1.825 0.349 ln d + 0.032 ( ln d ) 2 + 0.048 e Δ λ / Δ t + 0.353 e 2 Δ λ / Δ t

4. Conclusions

The presented channel compression experiment is very well-suited to investigate the boundary layer deformation behavior in hydrostatic extruded Al-Mg-compounds. Due to the newly developed specimen shape and the resulting inhomogeneous strain distribution, it is possible to detect the onset of fragmentation for a specific deformation rate and boundary layer thickness without a load variation. Thereby, the amount of necessary tests could be reduced considerably. For each parameter set, a critical stretch regarding onset of fragmentation is determined and transferred to a fragmentation criterion. In this context, an initial contribution to the quantification of the load-dependent deformability of the boundary layer is made and further complements the damage model from Feuerhack.
The results indicate the possibility to optimize forging processes regarding damage by fragmentation through a reduction of the process speed and boundary layer thickness. Due to the need for short process times in industry, the reduction of the process speed is limited. On the contrary, the reduction of the boundary layer thickness is possible through shorter heat-up phases during production, making it even more energy efficient respectively.
In future investigations, the three-dimensional deformation of the compound has to be addressed to clarify the mutual influence of two deformation directions. For this purpose, it is recommended to use computer tomography scans for the evaluation.

Acknowledgments

The authors thank the German Research Foundation (DFG) for its funding within the framework of the Collaborative Research Centre 692 (SFB HALS 692).

Author Contributions

Carola Kirbach performed the experimental and numerical investigations and wrote the paper. Martin Stockmann, Jörn Ihlemann and Carola Kirbach discussed the results.

Conflicts of Interest

The authors declare no conflict of interest.

References

  1. Klüting, M.; Landerl, C. The new BMW inline six-cylinder spark-ignition engine. MTZ Worldw. 2004, 65, 2–5. [Google Scholar]
  2. Kleiner, M.; Schomäcker, M.; Schikorra, M.; Klaus, A. Herstellung verbundverstärkter Aluminiumprofile für ultraleichte Tragwerke durch Strangpressen. Materialwissenschaft und Werkstofftechnik 2004, 35, 431–439. [Google Scholar] [CrossRef]
  3. Avitzur, B.; Wu, R.; Talbert, S.; Chou, Y. An Analytical Approach to the Problem of Core Fracture During Extrusion of Bimetal Rods. ASME. J. Eng. Ind. 1985, 107, 247–253. [Google Scholar] [CrossRef]
  4. Story, J.; Avitzur, B.; Hahn, W.C., Jr. The Effect of Receiver Pressure on the Observed Flow Pattern in the Hydrostatic Extrusion of Bimetal Rods. ASME. J. Eng. Ind. 1976, 98, 909–913. [Google Scholar] [CrossRef]
  5. Feuerhack, A. Experimentelle und Numerische Untersuchungen von Al-Mg-Verbunden Mittels Verbundschmieden. Ph.D. Thesis, Chemnitz University of Technology, Chemnitz, Germany, 23 May 2014. [Google Scholar]
  6. Lehmann, T. Experimentell-Numerische Analyse Mechanischer Eigenschaften von Aluminium/Magnesium-Werkstoffverbunden. Ph.D. Thesis, Chemnitz University of Technology, Chemnitz, Germany, 29 June 2012. [Google Scholar]
  7. Kittner, K.; Feuerhack, A.; Förster, W.; Binotsch, C.; Graf, M. Recent Developments for the Production of Al-Mg Compounds. Mater. Today Proc. 2015, 2, S225–S232. [Google Scholar] [CrossRef]
  8. Kirbach, C.; Stockmann, M.; Ihlemann, J. Experimental and numerical investigations of Al/Mg-compound specimens under bending after mass forming processes. In Proceedings of the 31st Danubia Adria Symposium on Advances in Experimental Mechanics, Kempten, Germany, 24–27 September 2014; pp. 32–33. [Google Scholar]
  9. Förster, W.; Binotsch, C.; Awiszus, B.; Lehmann, T.; Müller, J.; Kirbach, C.; Stockmann, M.; Ihlemann, J. Forging of eccentric co-extruded Al-Mg compounds and analysis of the interface strength. IOP Conf. Ser. Mat. Sci. Eng. 2016, 118, 012032. [Google Scholar] [CrossRef]
  10. Kosch, K.G.; Frischkorn, C.; Huskic, A.; Odening, D.; Pfeiffer, I.; Prüß, T.; Vahed, N. Effizienter Leichtbau Durch Belastungsangepasste und Anwendungsoptimierte Multimaterial-Schmiedebauteile; UTF Science, Meisenbach Verlag Bamberg: Bamberg, Germany, 2012; pp. 1–17. [Google Scholar]
  11. Kosch, K.G.; Pfeiffer, I.; Foydl, A.; Behrens, B.; Tekkaya, A. Schmieden von Partiell Stahlverstärkten Aluminiumhalbzeugen; UTF Science, Meisenbach Verlag Bamberg: Bamberg, Germany, 2012; pp. 1–9. [Google Scholar]
  12. Foydl, A.; Pfeiffer, I.; Kammler, M.; Pietzka, D.; Matthias, T.; Jäger, A.; Tekkaya, A.; Behrens, B. Manufacturing of Steel-Reinforced Aluminium Productes by Combining Hot Extrusion and Closed-Die Forging. Key Eng. Mater. 2012, 504–506, 481–486. [Google Scholar] [CrossRef]
  13. Kittner, K. Integrativer Modellansatz bei der Co-Extrusion von Aluminium-Magnesium-Werkstoffverbunden. Ph.D. Thesis, Chemnitz University of Technology, Chemnitz, Germany, 11 May 2012. [Google Scholar]
  14. Negendank, M.; Mueller, S.; Reimers, W. Coextrusion of Mg–Al macro composites. J. Mater. Process. Technol. 2012, 212, 1954–1962. [Google Scholar] [CrossRef]
  15. Lehmann, T.; Stockmann, M. Residual Stress State and Fracture Mechanical Properties of Al/Mg Compounds. Mater. Today Proc. 2016, 3, 1041–1044. [Google Scholar]
  16. Lehmann, T.; Stockmann, M. Residual Stress Analysis of Al/Mg Compounds by Using the Hole Drilling Method. J. Jpn. Soc. Exp. Mech. 2011, 11, s233–s238. [Google Scholar]
  17. Lehmann, T.; Stockmann, M.; Naumann, J. Experimental and Numerical Investigations of Al/Mg Compound Specimens under Load in an Extended Temperature Range. FME Trans. 2009, 37, 1–8. [Google Scholar]
  18. Kittner, K.; Awiszus, B.; Lehmann, T.; Stockmann, M.; Naumann, J. Numerische und experimentelle Untersuchungen zur Herstellung von stranggepressten Aluminium/Magnesium-Werkstoffverbunden und zur Festigkeit des Interface. Materialwissenschaft und Werkstofftechnik 2009, 40, 532–539. [Google Scholar] [CrossRef]
  19. Kittner, K.; Binotsch, C.; Awiszus, B.; Lehmann, T.; Stockmann, M. Herstellungsprozess zur Erzeugung schädigungsarmer Al/Mg-Verbunde und Analyse der mechanischen Grundeigenschaften sowie der Interfacefestigkeit. Materialwissenschaft und Werkstofftechnik 2010, 41, 744–755. [Google Scholar]
  20. Lehmann, T.; Stockmann, M.; Kittner, K.; Binotsch, C.; Awiszus, B. Bruchmechanische Eigenschaften von Al/Mg-Verbunden und deren Fließverhalten im Herstellungsprozess. Materialwissenschaft und Werkstofftechnik 2011, 42, 612–623. [Google Scholar]
  21. Kirbach, C.; Lehmann, T.; Stockmann, M.; Ihlemann, J. Digital Image Correlation Used for Experimental Investigations of Al/Mg Compounds. Strain 2015, 51, 223–234. [Google Scholar] [CrossRef]
  22. Dietrich, D.; Nickel, D.; Krause, M.; Lampke, T.; Coleman, M.P.; Randle, V. Formation of intermetallic phases in diffusion-welded joints of aluminium and magnesium alloys. J. Mater. Sci. 2011, 46, 357–364. [Google Scholar] [CrossRef]
  23. Pawelski, H. Erklärung Einiger Mechanischer Eigenschaften von Elastomerwerkstoffen mit Methoden der Statistischen Physik. Ph.D. Thesis, Universität Hannover, Hannover, Germany, 1998. [Google Scholar]
  24. Feuerhack, A.; Binotsch, C.; Awiszus, B.; Wolff, A.; Brämer, C.; Stockmann, M. Materialeigenschaften und Formänderungsvermögen von stranggepressten Al-Mg-Verbunden in Abhängigkeit der Temperatur. Materialwissenschaft und Werkstofftechnik 2012, 43, 601–608. [Google Scholar] [CrossRef]
  25. Noster, U.; Scholtes, B. Isothermal strain-controlled quasi-static and cyclic deformation behavior of magnesium wrought alloy AZ31. Zeitschrift für Metallkunde 2003, 94, 559–563. [Google Scholar] [CrossRef]
  26. Ragani, J.; Donnadieu, P.; Tassin, C.; Blandin, J. High-temperature deformation of the γ-Mg17Al12 complex metallic alloy. Scr. Mater. 2011, 65, 253–256. [Google Scholar] [CrossRef]
  27. Roitsch, S. Microstructural and macroscopic aspects of the plasticity of complex metallic alloys. Ph.D. Thesis, RWTH Aachen University, Aachen, Germany, 2008. [Google Scholar]
Figure 1. Principle of hydrostatic co-extrusion.
Metals 08 00157 g001
Figure 2. Representation of the grain structure (a) Electron backscatter diffraction phase map; (b) Inverse pole figure map; (c) principle state of the boundary layer after fragmentation [5].
Metals 08 00157 g002
Figure 3. Loading device for the channel compression test (a) Computer-aided design depiction; (b) experiment; (c) implementation into a temperature chamber and a 50 k N INSTRON hydraulic testing machine.
Metals 08 00157 g003
Figure 4. Channel compression specimen (all units are in mm) (a) dimensions and coordinate system; (b) positions in the undeformed cross-section.
Metals 08 00157 g004
Figure 5. Example image of the boundary layer after channel compression with fragments and gaps.
Metals 08 00157 g005
Figure 6. Schematic sketch of the boundary layer before and after channel compression.
Metals 08 00157 g006
Figure 7. Numerical simulation of the channel compression test - schematic display of the setup together with the used mesh geometry.
Metals 08 00157 g007
Figure 8. Numerical and experimental flow curves of AZ31.
Metals 08 00157 g008
Figure 9. Numerical and experimental flow curves of AA6082.
Metals 08 00157 g009
Figure 10. Comparison of the measured boundary layer profile (parameter set V3 specimen 3) and the profile based on the numerical simulation (mirrored at x = 0 ), no true-to-scale illustration.
Metals 08 00157 g010
Figure 11. Results of the parameter sets with a boundary layer thickness of 25 μ m and a varying stamp velocity (a) ε F and (b) p G .
Metals 08 00157 g011
Figure 12. Comparison of the fragmentation state in parameter set (a) V4 and (b) V2.
Metals 08 00157 g012
Figure 13. Results of the parameter sets with varying boundary layer thickness and a stamp velocity of 2 m m / s (a) ε F and (b) p G .
Metals 08 00157 g013
Figure 14. Stretch of the boundary layer λ BL at different loading stages.
Metals 08 00157 g014
Figure 15. Definition of the profile coordinates s L und s R .
Metals 08 00157 g015
Figure 16. Critical stretch λ crit regarding fragmentation as a function of the stretch rate and the boundary layer thickness.
Metals 08 00157 g016
Table 1. Overview of all parameter sets.
Boundary Layer Thickness dStamp VelocityAbbreviation
25 μ m 0 . 2 m m / s V1
25 μ m 2 m m / s V2/D4
25 μ m 20 m m / s V3
25 μ m 200 m m / s V4
7 . 5 μ m 2 m m / s D1
10 μ m 2 m m / s D2
12 . 5 μ m 2 m m / s D3
Table 2. Critical stretches of the boundary layer regarding the fragmentation and the measured positions of the fragmentation onset.
Boundary LayerStamp λ crit s min , crit s max , crit
Thickness dVelocity in μ m in μ m
25 μ m 200 m m / s 1.0310651537
25 μ m 20 m m / s 1.0412281615
25 μ m 2 m m / s 1.1416182058
25 μ m 0 . 2 m m / s 1.3523293576
7 . 5 μ m 2 m m / s (1.26)15243979
10 μ m 2 m m / s 1.3021242665
12 . 5 μ m 2 m m / s 1.2519962753

