Article

Feature Size Effect on Formability of Multilayer Metal Composite Sheets under Microscale Laser Flexible Forming

1
School of Mechanical Engineering, Jiangsu University, Zhenjiang 212013, China
2
Department of Mechanical Engineering, Northern Illinois University, DeKalb, IL 60115, USA
*
Author to whom correspondence should be addressed.
Metals 2017, 7(7), 275; https://doi.org/10.3390/met7070275
Submission received: 14 June 2017 / Revised: 12 July 2017 / Accepted: 15 July 2017 / Published: 18 July 2017

Abstract

:
Multilayer metal composite sheets possess superior properties to monolithic metal sheets, and formability is different from monolithic metal sheets. In this research, the feature size effect on formability of multilayer metal composite sheets under microscale laser flexible forming was studied by experiment. Two-layer copper/nickel composite sheets were selected as experimental materials. Five types of micro molds with different diameters were utilized. The formability of materials was evaluated by forming depth, thickness thinning, surface quality, and micro-hardness distribution. The research results showed that the formability of two-layer copper/nickel composite sheets was strongly influenced by feature size. With feature size increasing, the effect of layer stacking sequence on forming depth, thickness thinning ratio, and surface roughness became increasingly larger. However, the normalized forming depth, thickness thinning ratio, surface roughness, and micro-hardness of the formed components under the same layer stacking sequence first increased and then decreased with increasing feature size. The deformation behavior of copper/nickel composite sheets was determined by the external layer. The deformation extent was larger when the copper layer was set as the external layer.

Graphical Abstract

1. Introduction

With the rapid development of miniaturization and integration, micro components have been widely applied to micro-electromechanical systems, micro-system technology, and precision machinery. Responding to this important industry trend, micro forming processes, which have unique advantages compared with other micro manufacturing technologies, have been rapidly developed and researched. Nevertheless, the deformation behavior of materials is considerably changed when the geometrical sizes of components decrease to the microscale. The deformation mechanics, material flow, and friction condition are changed because of the size effect [1]. As such, it is critical to investigate the size effect on the deformation behavior of materials. Many scholars have conducted investigation on the size effect phenomenon, including grain size effect, specimen size effect, and feature size effect [2,3,4,5,6,7,8,9,10,11,12,13,14,15,16,17,18,19].
Gau et al. [2] investigated the influence of grain size on flow stress and formability through tensile and bending tests. Chan and Fu [3] researched the grain size effect on surface quality and irregular plastic deformation in the embossing process of micro-channels. Hu et al. [4] found that grain size and laser spot had a considerable effect on the indentation depth under laser shock processing. Through micro-compression experiments of high purity aluminum, Xu et al. [5] investigated the coarse-grained and ultrafine-grained effect on flow stress. Wang et al. [6] established a finite element model to study the grain size effect on the deformation behavior of metal foils under the laser flexible micro bending process.
Besides, some investigations were conducted on the specimen size effect in the micro forming process. Chen and Tsai [7] performed a micro-hardness test to research the specimen size effect on mechanical properties of materials. The results showed that hardness and flow stress decreased with decreasing specimen size, which was in agreement with the theoretical proportionality between hardness and flow stress. Gao and Cheng [8] established a multiscale model and discovered that the yield strength, strain hardening, and strain rate sensitivity of materials depended on sample thickness and strain rate. Parasiz et al. [9] investigated the specimen size effect on deformation behavior during the micro-extrusion process. They also obtained the result that in the micro-bending process, inhomogeneous plastic deformation and irregular hardness distribution occurred [10]. Molotnikov et al. [11] investigated the specimen size effect in the micro deep drawing process. They used a constitutive model based on dislocation density to simulate the influence of sheet thickness on load-displacement curve and limit drawing ratio. Wang et al. [12] studied the effect of the ratio of grain size to specimen thickness in the micro bending process under laser shock flexible forming.
Apart from grain size effect and specimen size effect, feature size effect also has a remarkable influence on the deformation behavior of materials. Wang et al. [13] explored the feature size effect in the micro-coining process when the forming temperature was 400 °C. They concluded that the formation behavior was obviously related to groove size. Mahabunphachai and Koç [14] investigated the influence of the ratio of die diameter to sheet thickness on the flow curve of materials under hydraulic bulge testing. A model which considered Taylor factors was established by Justinger and Hirt [15] and the experimental results revealed that thickness thinning of the cup wall and surface roughness increased with decreasing component size. Parasiz et al. [16] investigated the feature size effect in the micro-extrusion process. They concluded that the deformation behavior was strongly determined by the location, size and orientation of individual grains. Xu et al. [17] found that surface quality and irregular geometry shape worsened with the feature size of the formed cup decreasing under the micro deep drawing process. Fu et al. [18] researched the influence of punch radius on forming load during the micro compound process of blanking and drawing. Wang et al. [12] and Liu et al. [19] studied the feature size effect on the micro forming process of thin copper foils under laser flexible dynamic loading.
The materials studied in the researches on the size effect phenomenon currently mainly belong to monolithic metal sheets. However, with modern industry developing rapidly, it is increasingly hard for monolithic metal sheets to meet the demand of many industrial applications which need several different superior properties at the same time. As such, multilayer metal composite sheets, which are bonded by two or more metals, have been developed to replace monolithic metal sheets in many instances [20]. This type of materials is proven to have superior comprehensive properties compared with monolithic metal sheets, such as strength-to-weight efficiency, high electrical and thermal conductivity, wear, and corrosion resistance [21]. Besides, multilayer metal composite sheets are necessary when the two sides of the components are in different physical and chemical environments [22]. In addition, formability of brittle metals can be enhanced by bonding with ductile metals [23]. Thus, multilayer metal composite sheets have been widely applied in many industrial fields, such as electrical industry, automotive, aerospace, and medical instruments [24].
In view of the superiority of multilayer metal composite sheets, there have been some investigations on the micro-forming process of this kind of materials [25,26,27,28,29]. The formability of multilayer steel sheets was evaluated by Oya et al. [25] through tensile, V-bending, and hemming tests. Tsukamoto [26] investigated the impact of the compressive behavior of multilayer aluminum sheets in the deep drawing process. Sun et al. [27] studied the influence of contact status and annealing on the forming limit of Cu/Al clad metals. Karajibani et al. [28] investigated the formability of aluminum-steel sheets in the deep drawing process through numerical simulation and experiment. Li et al. [29] studied the limit drawing ratio and interface microstructure of three-layer Al/Mg/Al metal sheets in the deep drawing process at different forming temperature, punch speed, and die radius. However, only a few studies have probed into the size effect phenomenon of the formability of multilayer metal composite sheets. Afshin and Kadkhodayan [30] investigated the effect of grain size of the aluminum layer on the warm deep drawing performance of aluminum/steel composite sheets. They concluded that the effect of grain size of the aluminum layer on formability was determined by blank hold force. Kadkhodayan and Afshin [31] obtained the result that, in the deep drawing process of aluminum/steel composite sheets, the maximum thickness thinning ratio increased with increasing grain size.
From above, it can be seen that the investigations on the size effect phenomenon of the formability of multilayer metal composite sheets are very few, in spite of them having superior properties and widespread applications. Besides, as multilayer metal composite sheets combine properties from different metals, their deformation behavior is essentially different from that of monolithic metal sheets, especially the effect of the layer stacking sequence on formability, while the failure mode of them is also different. Thereby, it is essential to enhance the investigations on size effect on the formability of multilayer metal composite sheets. Additionally, in view of its unique advantages, microscale laser flexible forming, which belongs to the dynamic loading forming process, was selected to conduct the research.
Therefore, this paper conducted research on the feature size effect on the formability of multilayer metal composite sheets under microscale laser flexible forming, while the effect of the layer stacking sequence was of particular interest. Two-layer copper/nickel composite sheets were used as experiment materials and five kinds of micro molds with different diameter were utilized. The formability of materials was evaluated by forming depth, thickness thinning, surface quality, and micro-hardness distribution. Some new phenomena were obtained and they are explained in this paper.

2. Materials and Methods

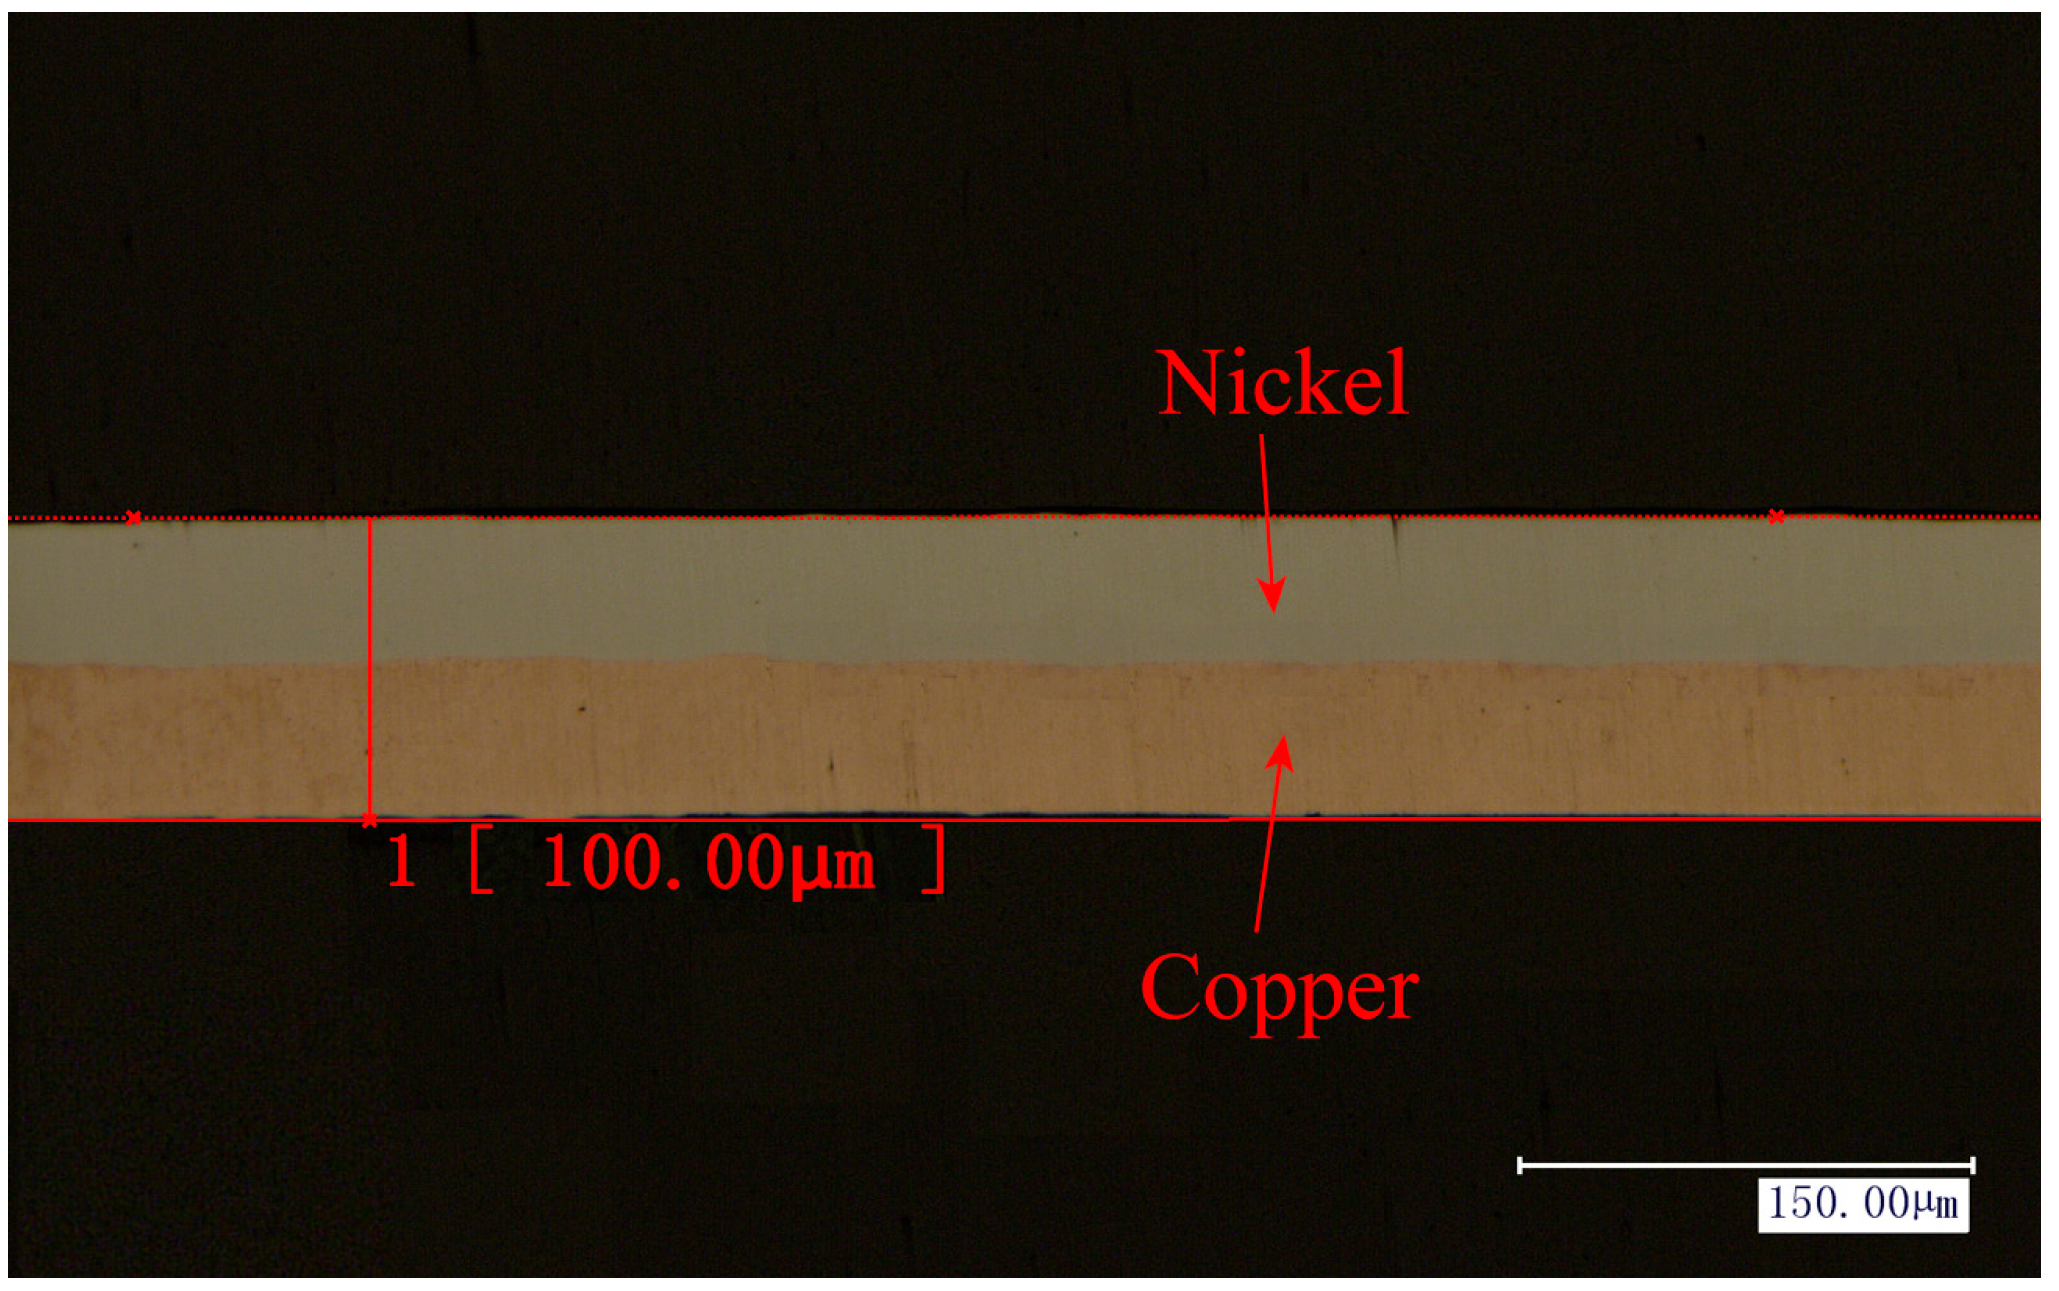
2.1. Experimental Materials

The application of copper in various industries is plentiful. Copper possesses high conductivity but low magnetic property (such as retentivity and coercivity). To improve the magnetic property, its composition with nickel can be used, while nickel can also improve the mechanical properties [32]. Therefore, two-layer copper/nickel composite sheets were selected as the experiment materials. They were constituted of a copper layer and a nickel layer. The total thickness of the materials was 0.1 mm and the thickness of the copper layer and nickel layer were both 0.05 mm. The cross section of the copper/nickel composite sheets under a digital microscope (KEYENCE VHX-1000C, KEYENCE Corporation, Osaka, Japan) is shown in Figure 1. The mechanical properties of copper and nickel are listed in Table 1 [33].
The process to fabricate these materials was as follows. First, the surface of copper sheets and nickel sheets were degreased by acetone and dried in air. Second, a copper sheet and a nickel sheet of the same thickness were stacked together. Third, they were press bonded to a certain thickness. Fourth, accumulative roll bonding was utilized and materials with the desired thickness were obtained. Finally, the materials were annealed to eliminate residual stress generated in the fabrication procedure. In the experiments, the materials were cut to specimens of 10 mm × 20 mm. As Urbikain et al. [34] presented in their work, galvanic corrosion is generated when the metal composite sheets contact electrolyte, but nothing occurs when they are worked in a dry atmosphere. In this research, the combination and forming procedure of the composite materials were conducted in a dry environment, so the galvanic effects were negligible.

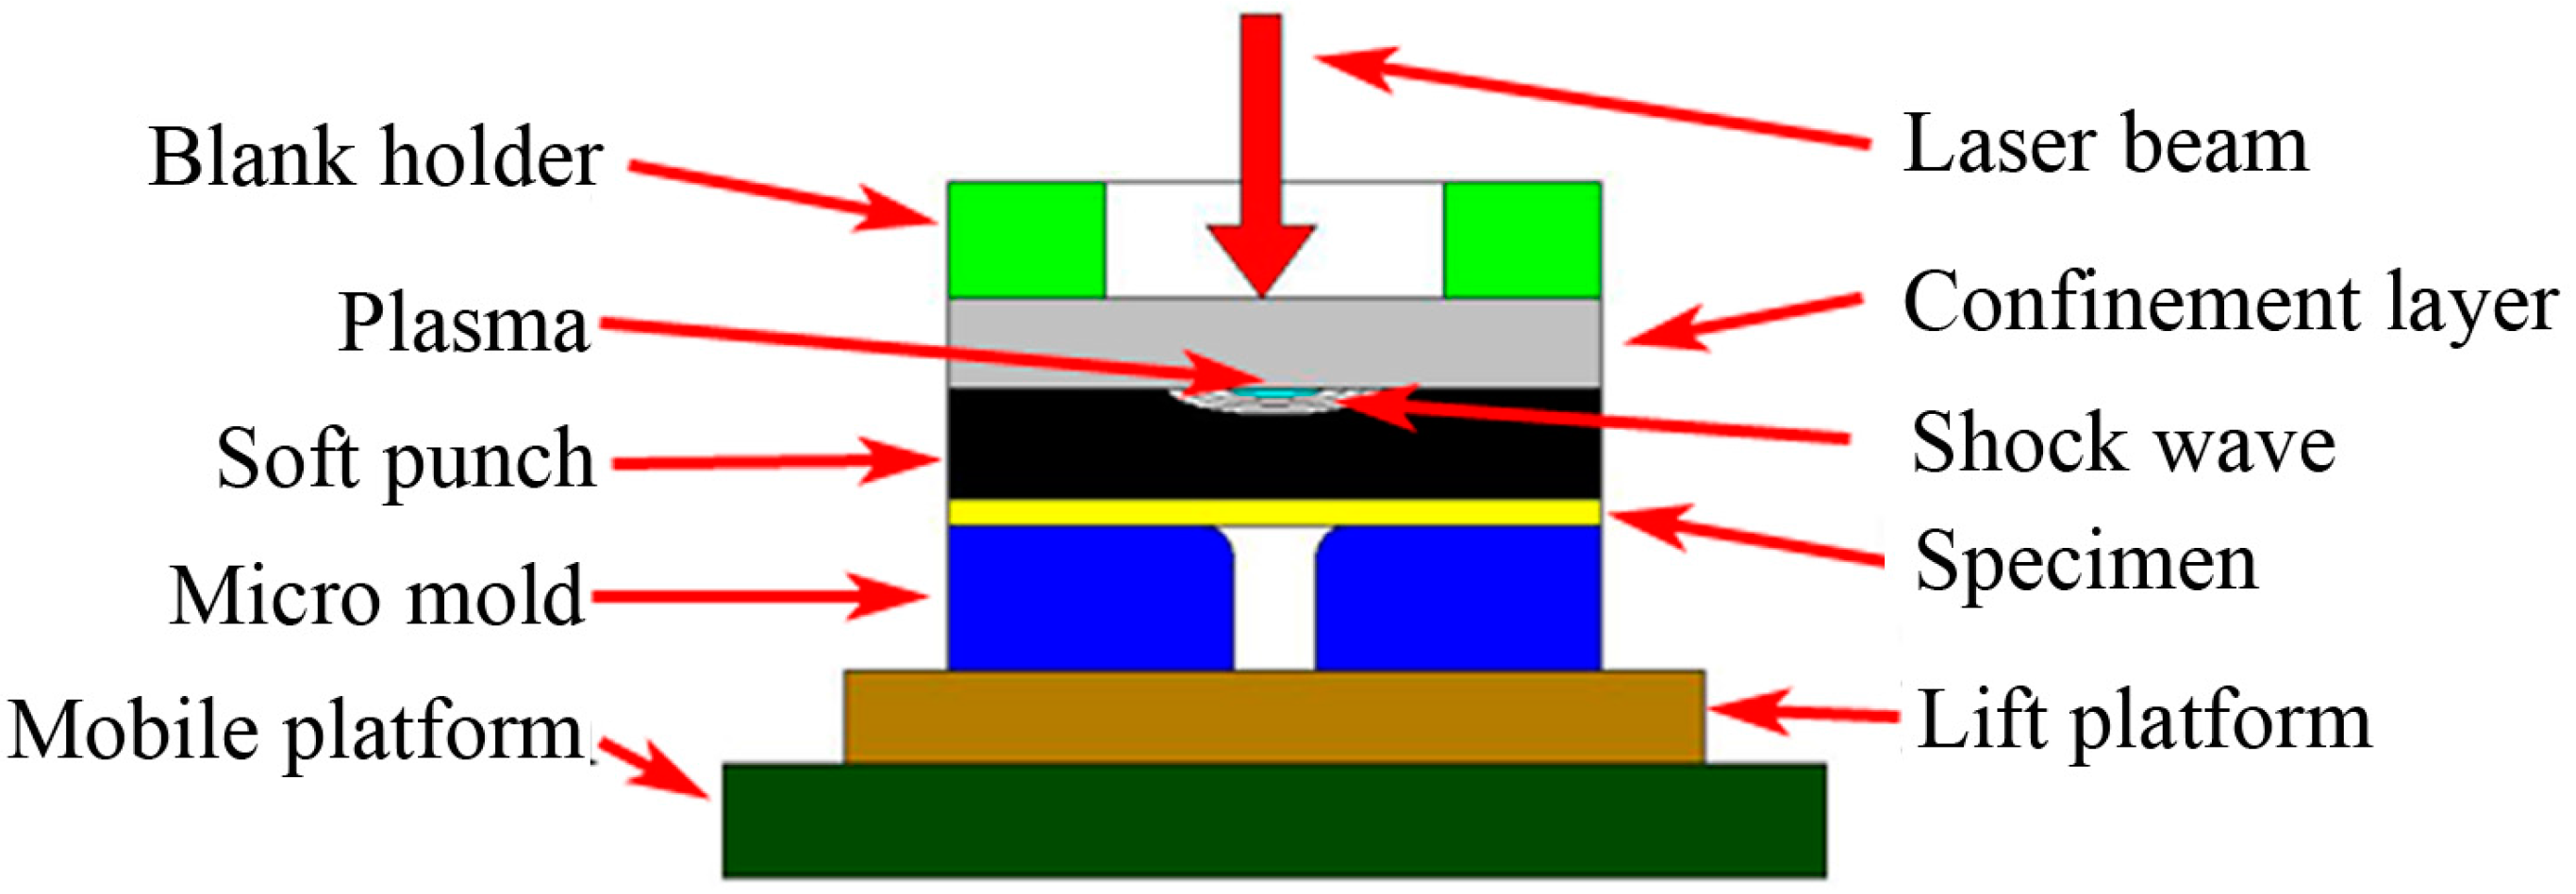
2.2. Experiment Appliance and Principle

In the microscale laser flexible forming process, ultrahigh strain rate deformation is generated, due to the ultrahigh pressure and ultrashort impacting time of this process [35]. The appliance of microscale laser flexible forming is shown in Figure 2. It is composed of laser beam, blank holder, confinement layer, soft punch, specimen, micro mold, lift platform and mobile platform.
The laser was an ND: YAG Spitlght 2000 laser (Spitlight 2000 Nd:YAG, InnoLas Corporation, Munich, Germany), its energy was in spatial Gaussian distribution; its parameters are listed in Table 2. The blank holder force was 12 N. The confinement layer was made of polymethyl methacrylate (PMMA); its thickness was 3 mm, length and widths were all 6 cm. Black opaque silica gel was adopted as the material of soft punch and the thickness of soft punch was 0.25 mm. Five micro molds with different feature size were used in the experiments. The shape of the micro molds was a through hole with a fillet, as shown in Figure 2. The feature sizes of the five micro molds are listed in Table 3. The sizes of mold diameter and fillet radius were changed in proportion.
The forming principle of microscale laser flexible forming is presented as follows. Through the transparent confinement layer, a laser beam irradiates on the soft punch. Then the black substance on the surface of the soft punch absorbs the laser energy and plenty of plasma with high pressure is produced. The confinement layer prevents the plasma expanding upward, so the plasma moves down and a large shock wave is induced. Impacted by the induced shock wave, the soft punch is squeezed into the micro mold, and the specimen is deformed to a certain shape. Therefore, the heat model of the laser, just like that studied by Tabernero et al. [36], is not involved in microscale laser flexible forming; the process utilizes the force effect of the laser. The laser power density I, a very important parameter in the model, is calculated by Equation (1), in which E is the laser energy, d is the spot diameter, and τ is the pulse width.
I = 4 E π d 2 τ
The shockwave pressure generated by laser shock was evaluated by the Fabbro model [37]. The relationship between the peak pressure of the shockwave and the laser power density is given by Equation (2), in which P is the peak pressure of the shockwave, α is the fraction of absorbed energy (commonly set as 0.1), I is the laser power density, and Z is the shock impedance. The shock impedance can be calculated by Equation (3), in which Z1 and Z2 are the impedance of the confinement layer and the soft punch respectively.
P = 0 . 01 × ( α 2 α + 3 ) 1 / 2 × Z 1 / 2 × I 1 / 2
2 Z = 1 Z 1 + 1 Z 2
The soft punch is a critical element in microscale laser flexible forming. The surface of components would be destroyed if the laser irradiated on the specimens directly. Using the soft punch can protect the surface of the components and a fine surface quality can be acquired. Moreover, the soft punch can also increase the forming pressure due to the impedance mismatch effect [38].

2.3. Experiment Procedure

Specimens of two different layer stacking sequences were studied. One type of layer stacking sequence was named as Cu-Ni, in which the copper layer was set to contact with the soft punch and the nickel layer was set to contact with the micro mold. Another type was named as Ni-Cu, in which the nickel layer was set to contact with the soft punch and the copper layer was set to contact with the micro mold. Three components were formed repeatedly under each group of process parameters to ensure the reliability of experimental results.
The profile of the formed components was observed and the forming depth was measured by a digital microscope. To measure thickness distribution, the components were mounted by a mixed solution made of epoxy resin and curing agent. Then the mosaic blocks were ground and polished and the deepest cross section of the components was obtained. A confocal microscope (Axio CSM 700, Carl Zeiss AG, Jena, Germany) was utilized to acquire the surface morphology and roughness value of the bottom portion of the formed components. The micro-hardness of the formed components was measured by a Vickers indentation test machine; the load was 10 g and the dwell time was 10 s.

3. Results and Discussion

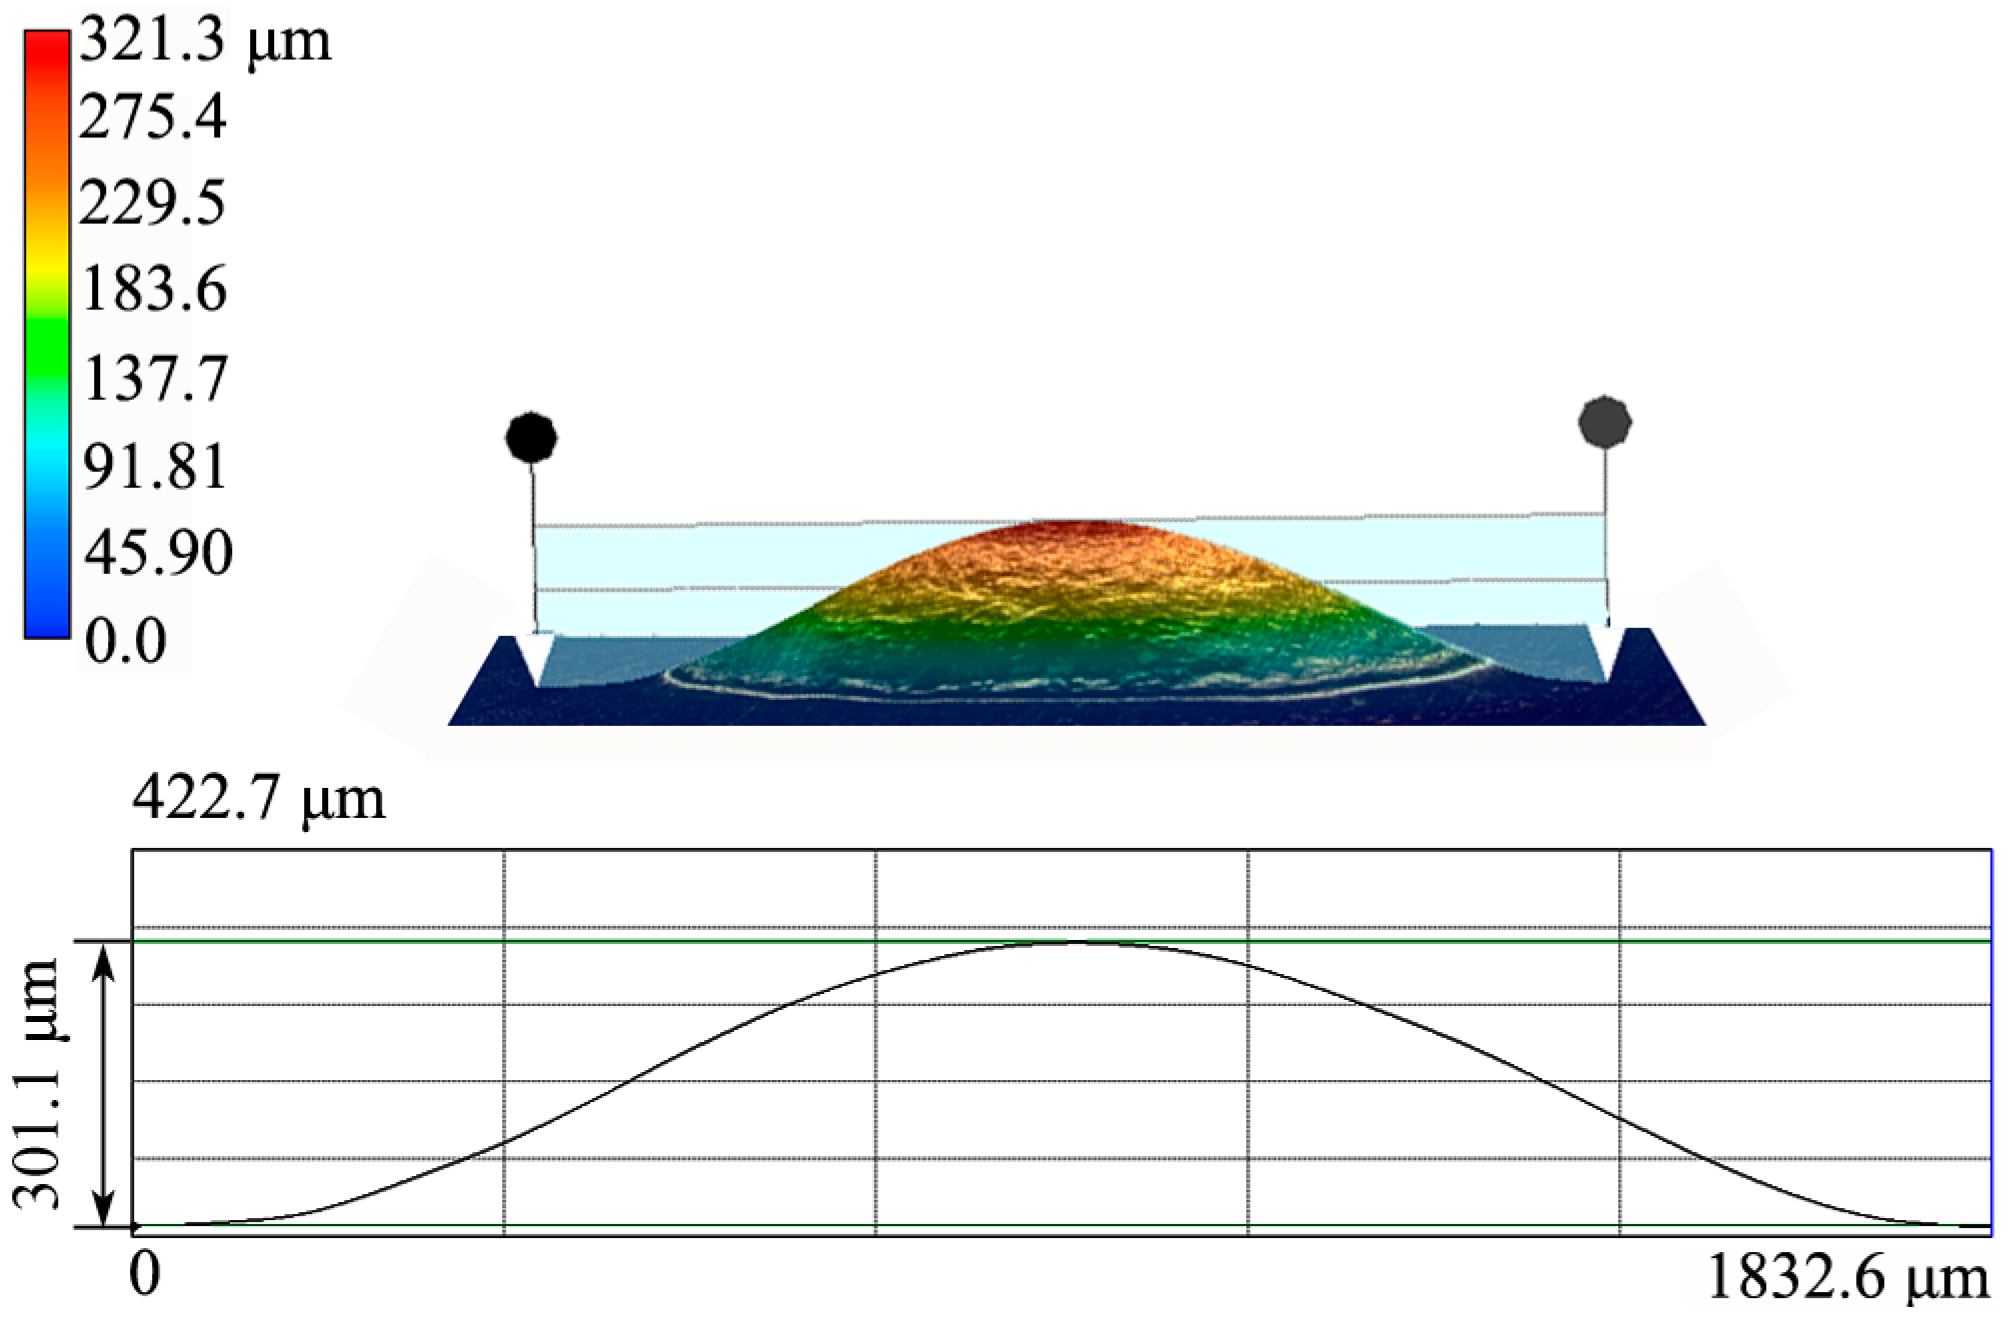
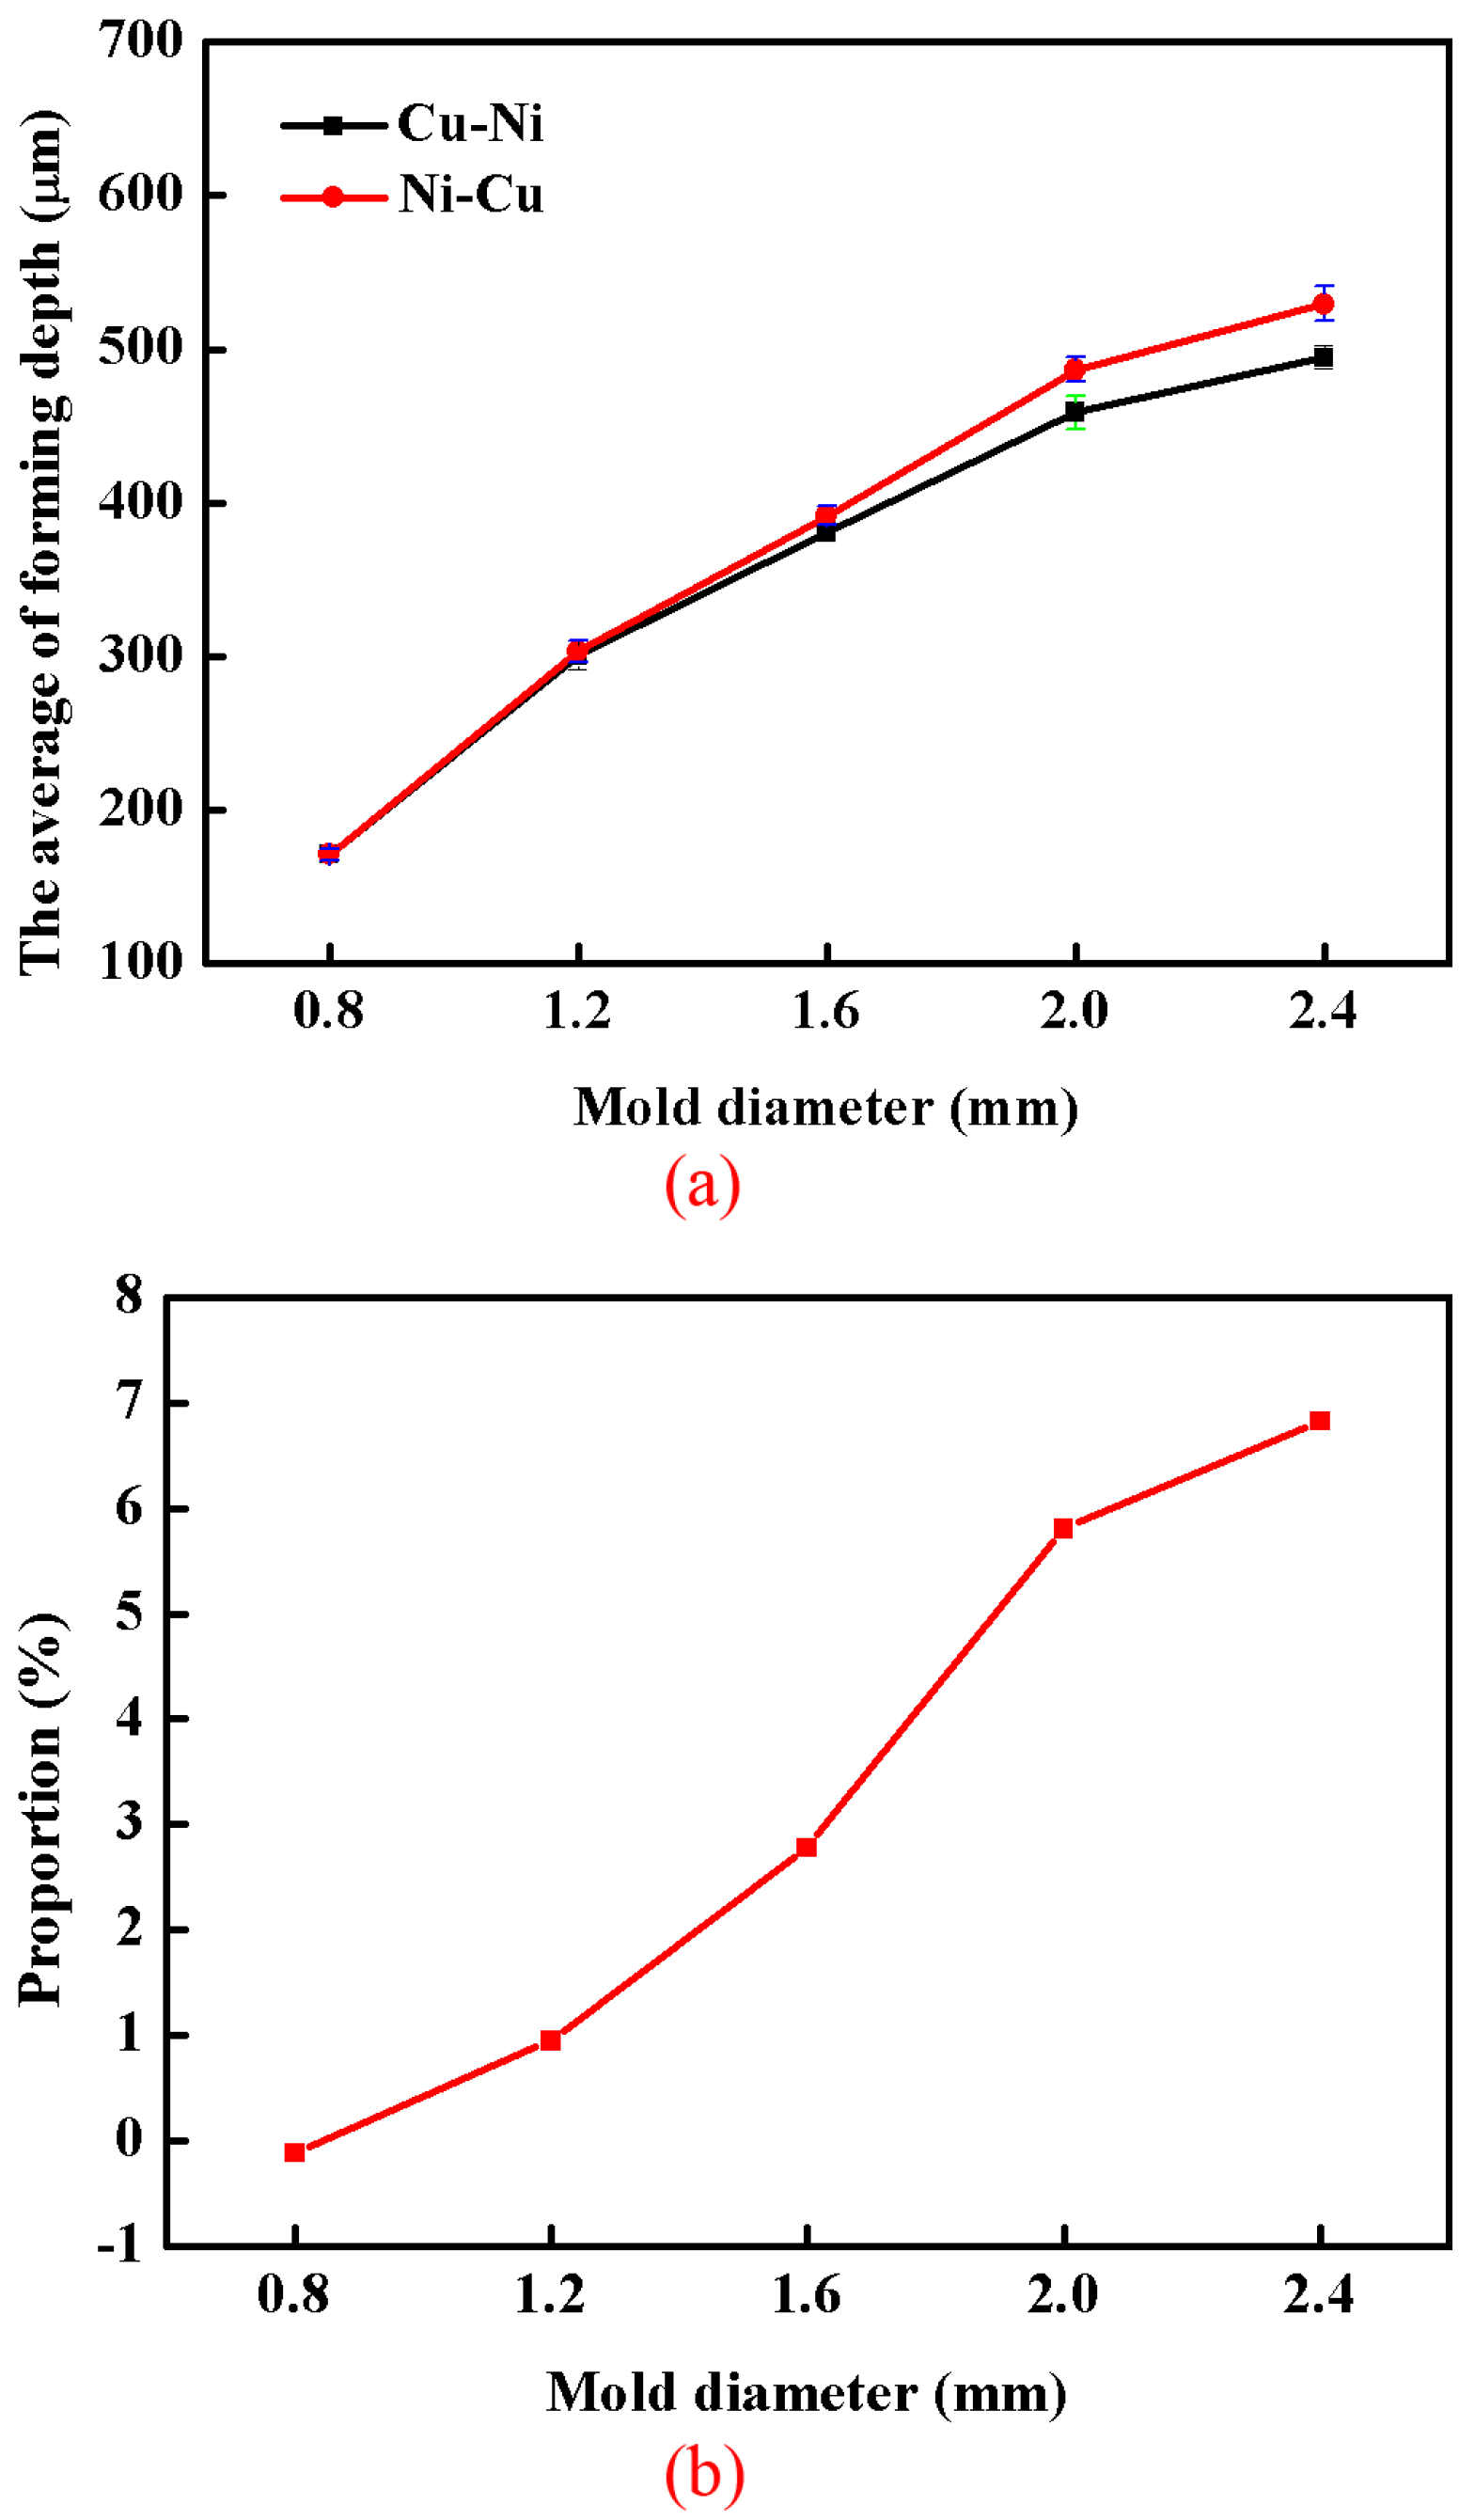
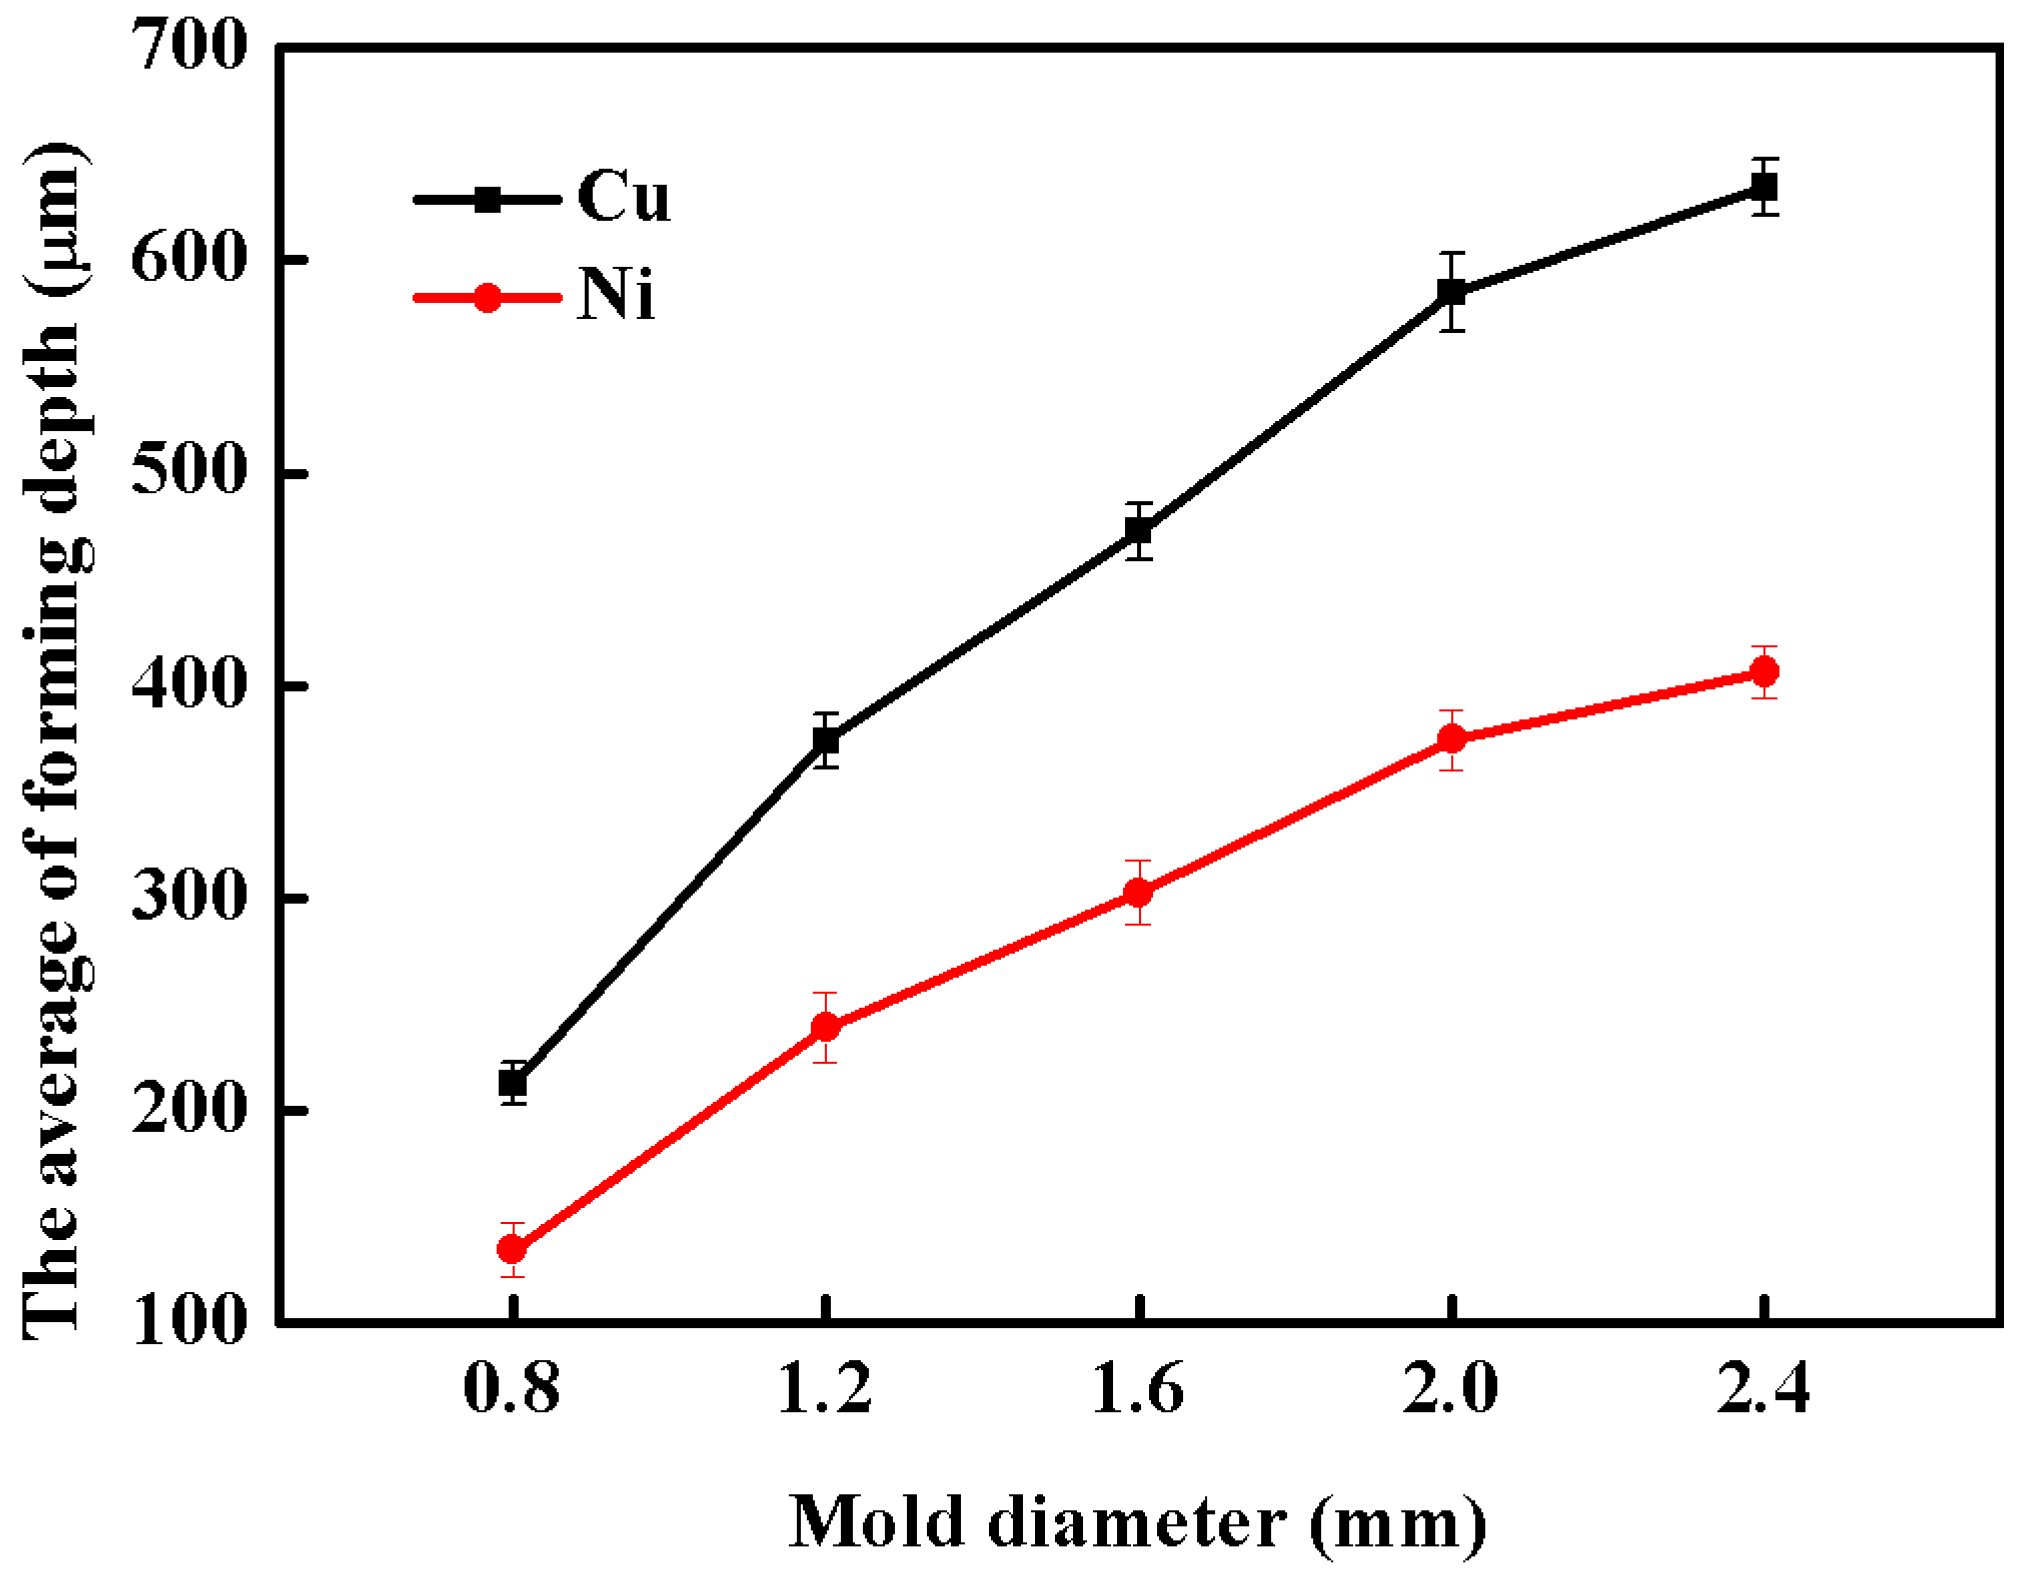
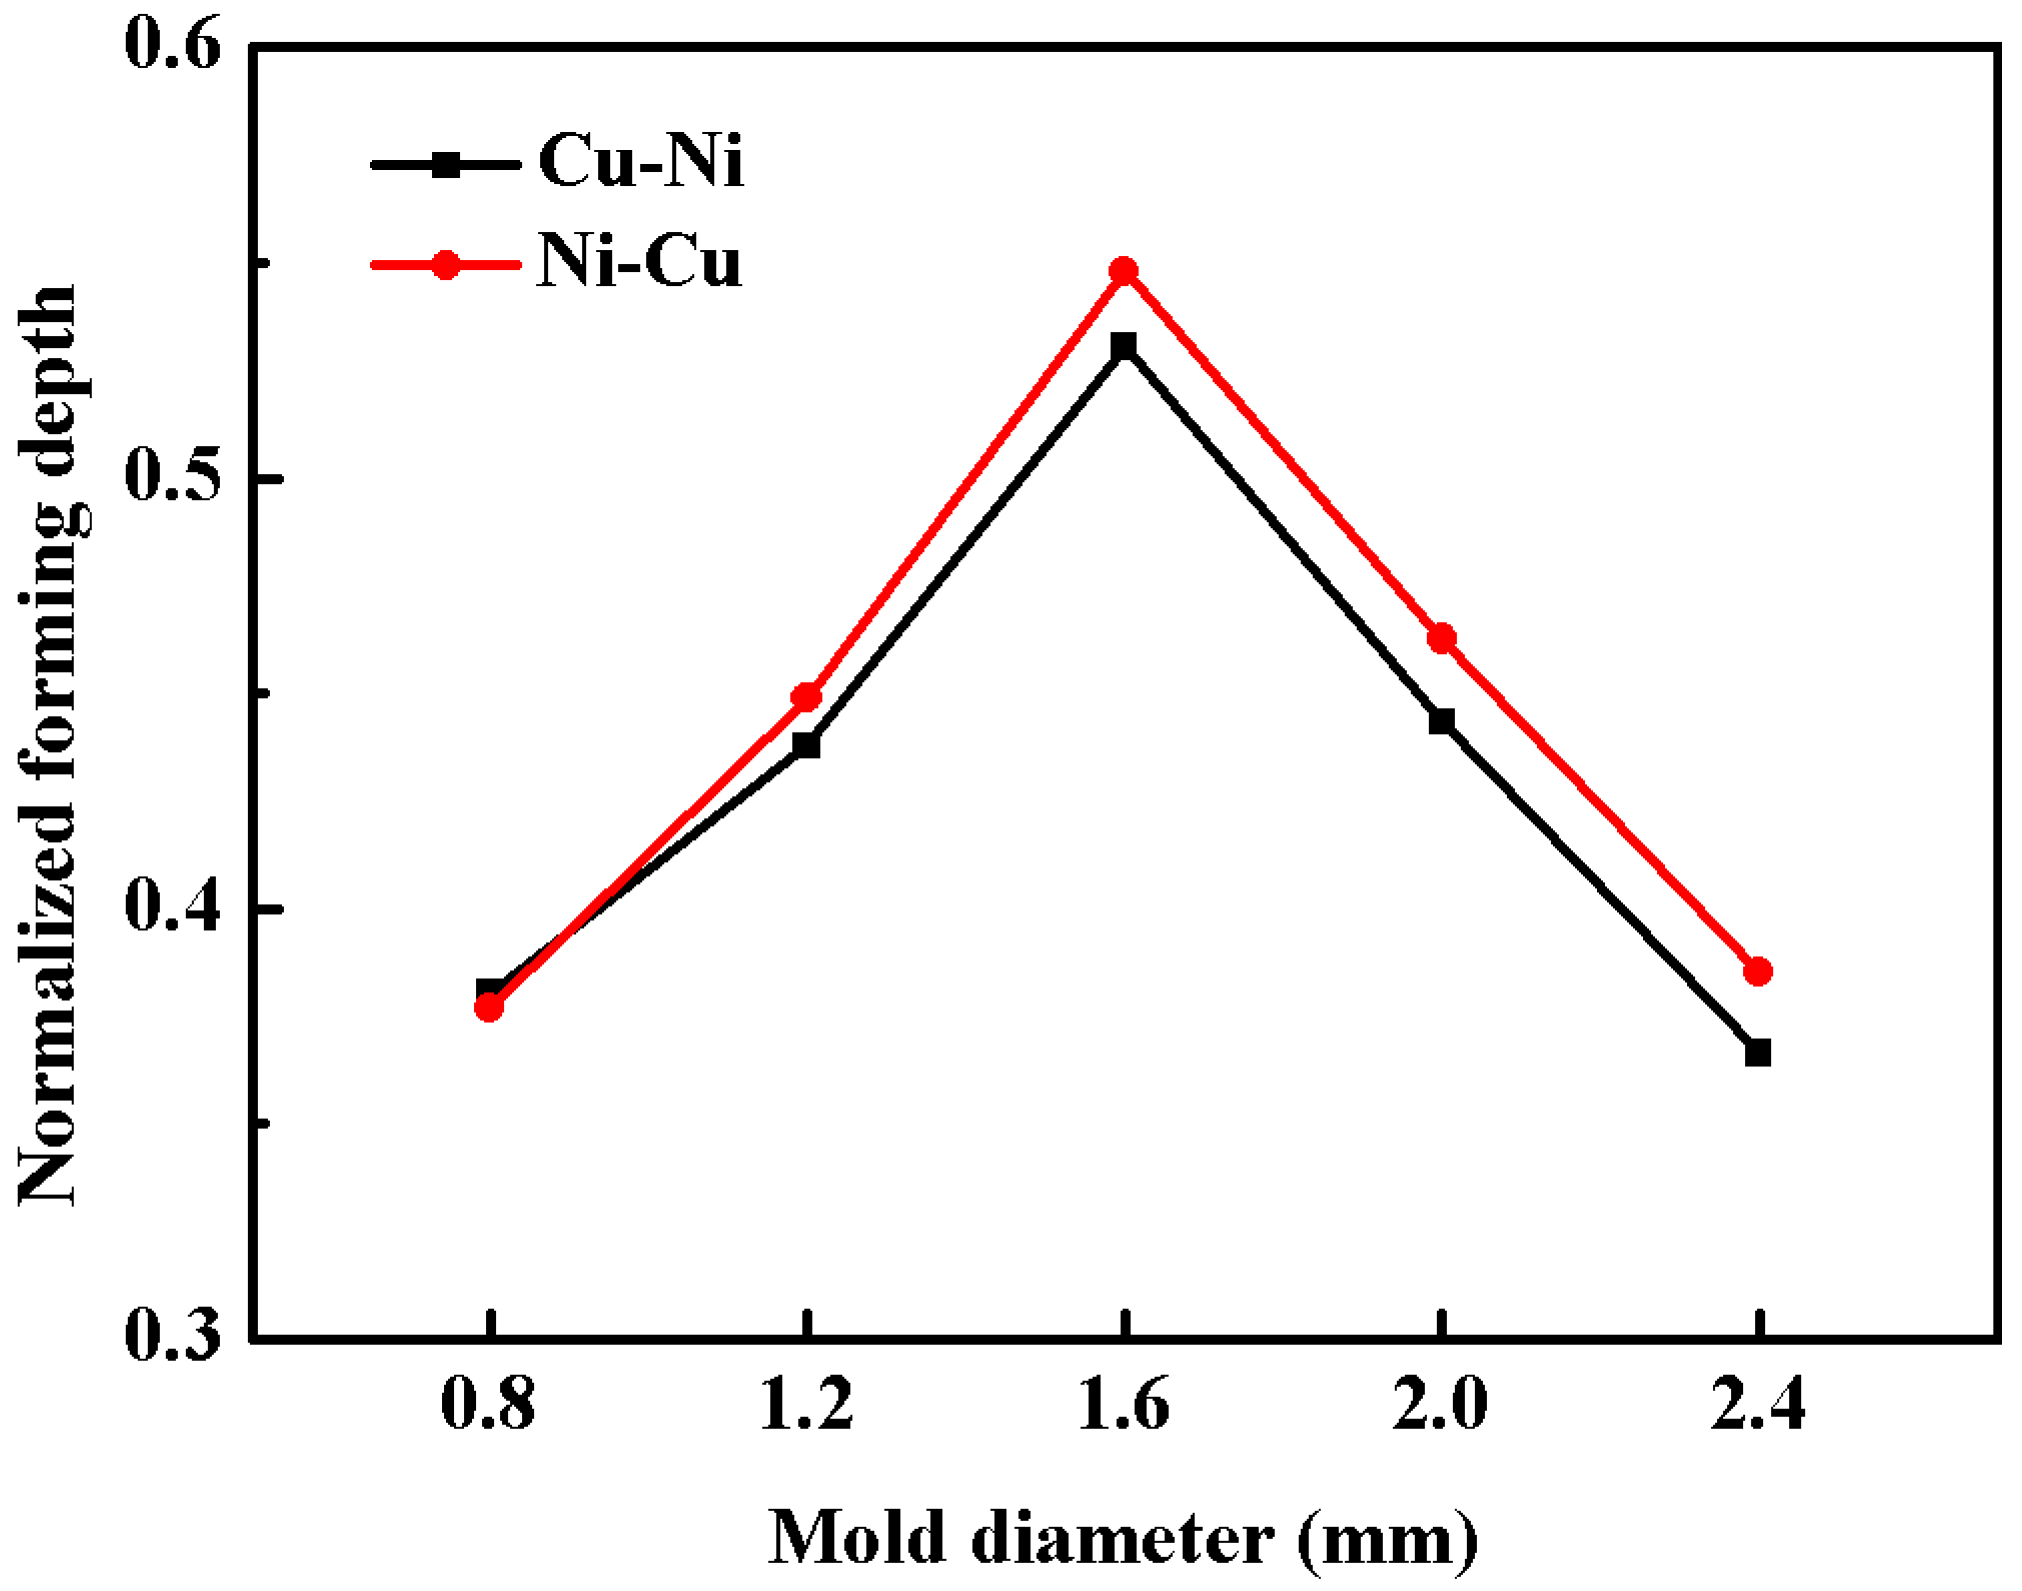
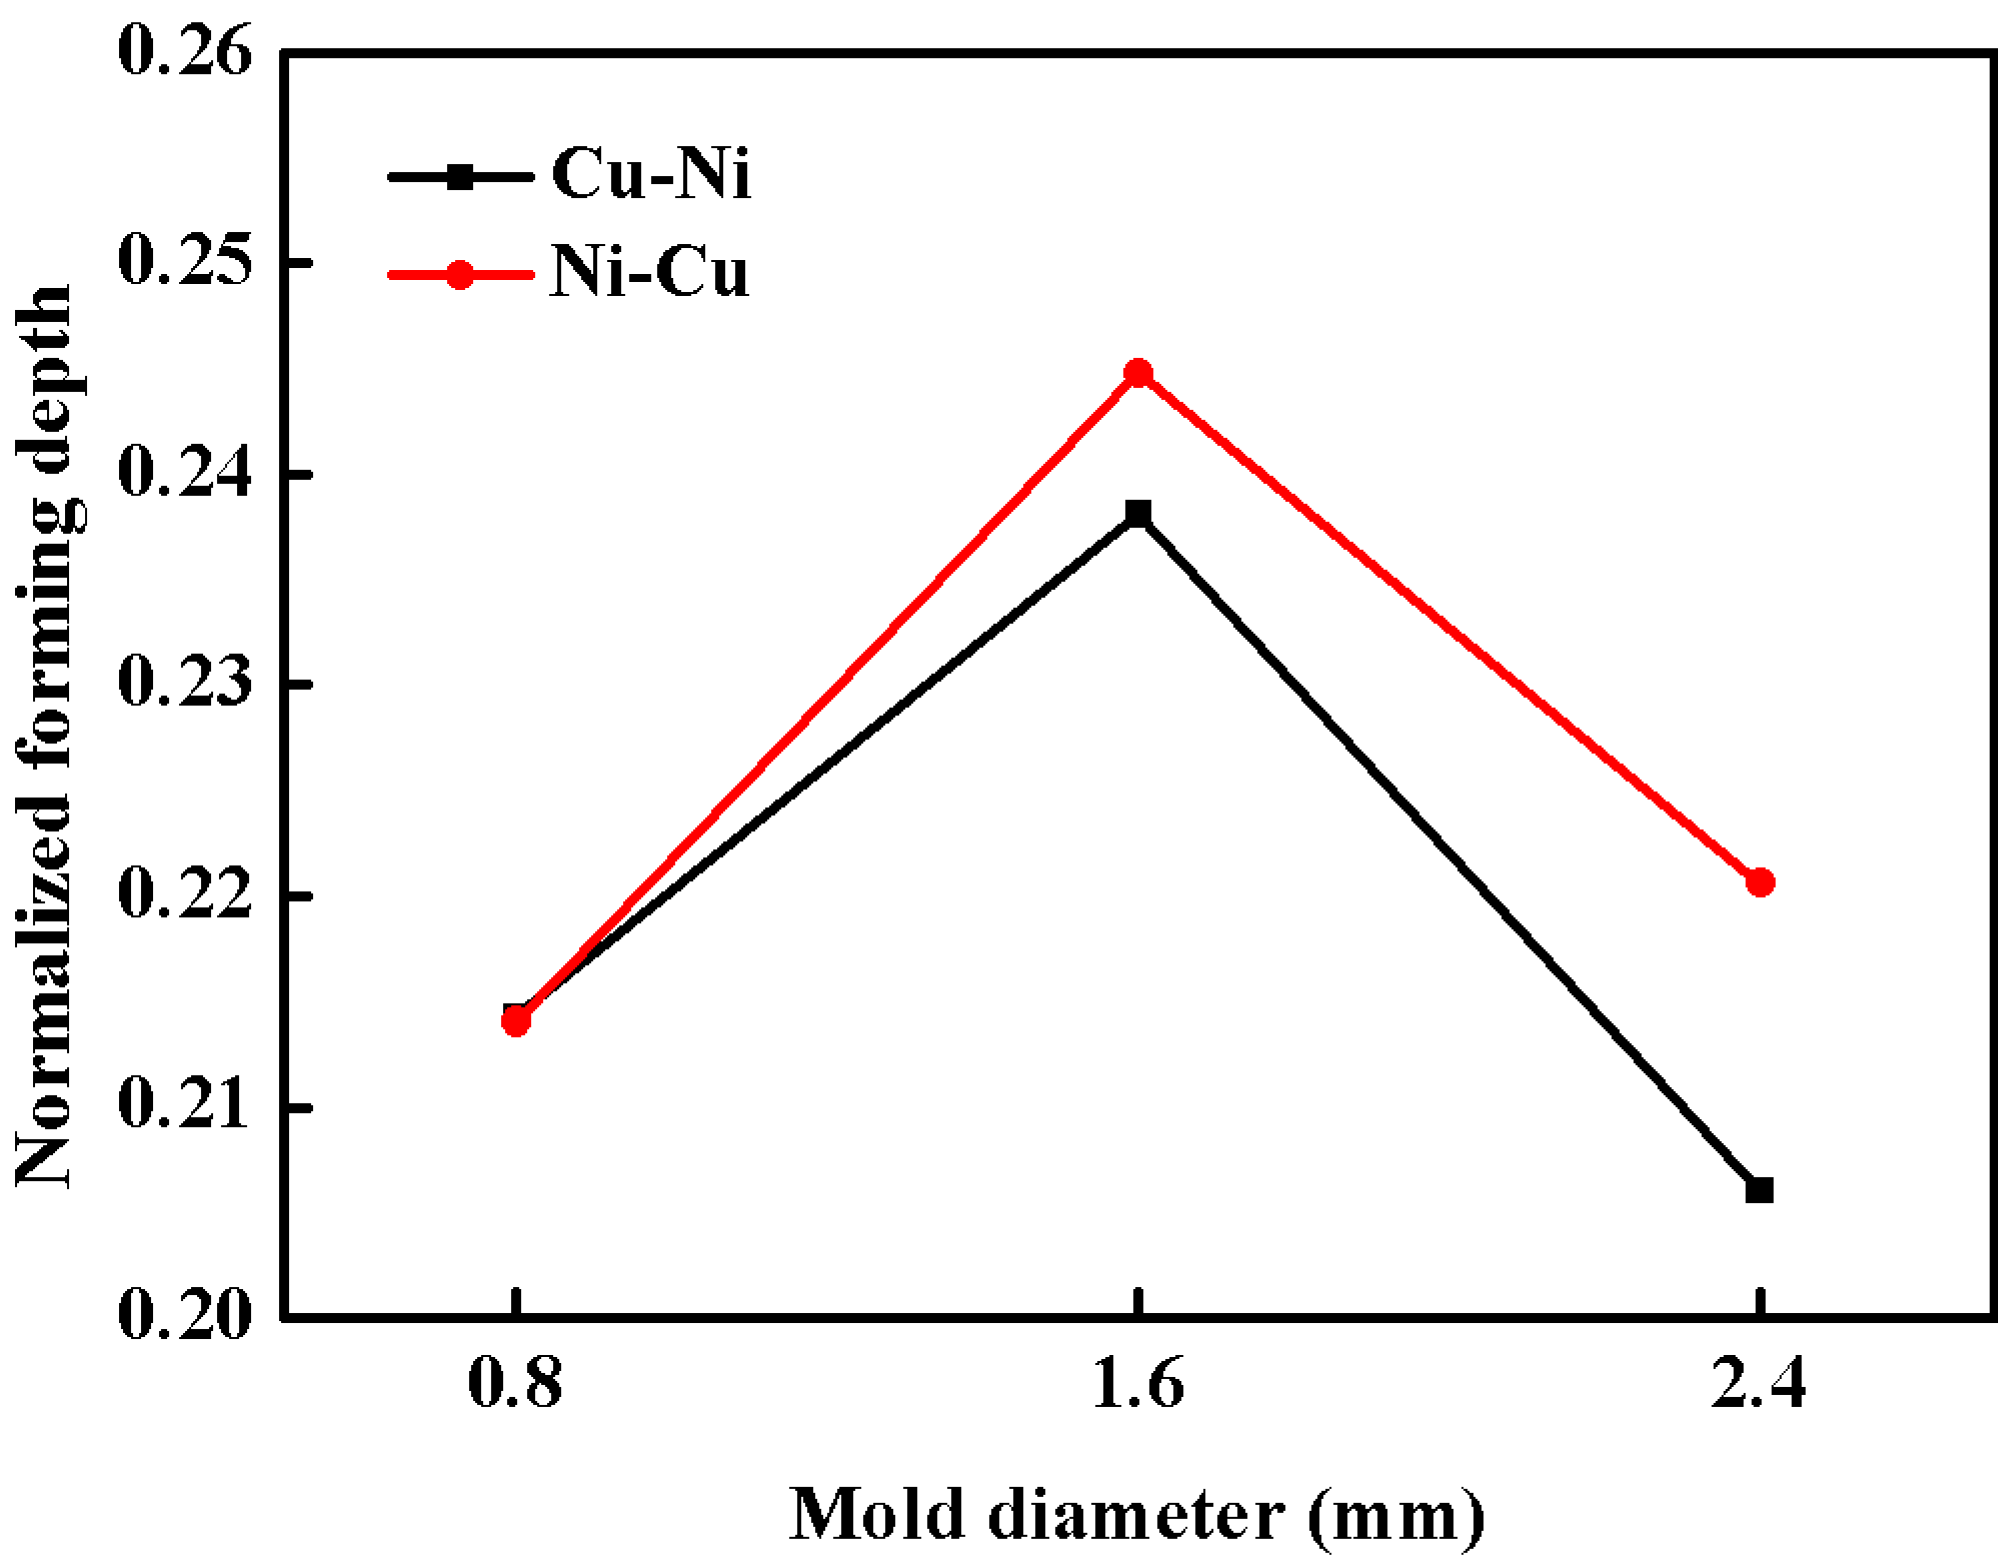
3.1. Feature Size Effect on Forming Depth

In this section, a range of experiments was conducted to research the feature size effect on the forming depth of the copper/nickel composite sheets, as the forming depth is the fundamental parameter to characterize the performance of the forming process. Laser energy was selected as 835 mJ. Components with different feature sizes were formed through the five molds. After the laser shock, the specimens were deformed to dome shaped components, which were identical with an in spatial Gaussian distribution. The maximum forming depth was defined to be the forming depth. Figure 3 shows one of the components formed through mold 2. Figure 4a shows the average forming depth of components formed through each mold.
From Figure 4a, it could be seen that the forming depth obviously decreased with decreasing mold diameter, either in Cu-Ni or Ni-Cu, and the decreasing degree tended to be increasingly larger as the mold diameter became increasingly smaller. This was in agreement with the phenomenon discovered in the formation of monolithic metal sheets under laser shock [19]. It was because the flow of materials suffered from a large geometry constraint in the small mold and the deformation resistance also became larger. Moreover, with feature size decreasing, the number of grains participating in plastic deformation decreased, which multiplied the number of necessary geometry dislocations in the materials. Due to that, the deformation resistance further increased, which caused a decreasing degree of the increasingly larger forming depth.
In previous studies, scholars found that the forming behavior of multilayer metal composite sheets was strongly influenced by the layer stacking sequence [27,28,30,39,40,41,42,43]. Sun et al. [27] came to the conclusion that the forming limit of the Al/Cu clad metals with Al in the inner layer contacted with the punch is higher than the clad metals with Cu in the inner layer. Karajibani et al. [28] found that in deep drawing of two-layer Al/St sheets, a larger limit drawing ratio can be achieved when the steel layer is in contact with the punch. Bagherzadeh et al. [39] discovered that a higher drawing ratio could be achieved when the Al layer was set to contact with the punch in the hydroforming process of aluminum-steel sheets. Afshin and Kadkhodayan [30] concluded that less forming load was needed when a stainless steel layer rather than an aluminum layer was set as the upper layer to contact with the punch. By means of experiment and finite element simulation, Atrian and Fereshteh-Saniee [40] verified that, in the deep drawing process of laminated steel/brass sheets, the load-displacement curve and the influence extent of friction on forming load were significantly different under different stacking sequences. Morovvati et al. [41] found that the minimum needed blank holder force was greater when the aluminum layer of two-layer aluminum-stainless steel sheets was in contact with the punch in the deep drawing process. Yilamu et al. [42] concluded that the total thickness and bending angle of bended Al/SS composite sheets became smaller when the stainless steel layer was set inside. Mori and Kurimoto [43] found that the formability of stainless steel-aluminum sheets was higher in stretching and deep drawing when aluminum was set outside. However, it is revealed from Figure 4a that, layer stacking sequence did not have a considerable effect on forming depth when the feature size was small; while with the feature size increasing, the distinction of forming depth between Cu-Ni and Ni-Cu became increasingly noteworthy. Due to the forming depth of components formed through different molds being different from each other, to show the variation trend of the distinction of forming depth between Cu-Ni and Ni-Cu accurately, the proportion of difference was calculated by Equation (4), in which Pd was the proportion of difference, D1 was the average forming depth of Cu-Ni, and D2 was the average forming depth of Ni-Cu. The variation law between difference degree of forming depth and feature size is shown in Figure 4b.
P d = 2 × ( D 2 D 1 ) ( D 1 + D 2 ) × 100 %
Figure 5 shows the forming depth of monolithic Cu and monolithic Ni with the same thickness through the five types of molds. It can be seen obviously from Figure 5 that the formability of monolithic Cu and monolithic Ni was very different under laser shock. Therefore, the characteristic of microscale laser flexible forming could be the reason for the phenomenon that the forming depth of Cu-Ni and Ni-Cu was very similar when the feature size was small. As mentioned before, microscale laser flexible forming is a dynamic loading process and ultrahigh strain rate deformation is produced in materials, so the distinction of formability between different metals could not obviously respond under this forming process. Therefore, the layer stacking sequence did not have a great effect on the forming depth when the feature size was small. However, with feature size increasing, the number of grains participated in plastic deformation increased. The difference of formability between the copper layer and nickel layer containing a few grains was negligible, but with the number of grains increasing, the difference would become larger. As such, the effect of the layer stacking sequence on the forming depth became increasingly considerable as the feature size increased.
In addition, it can also be seen from Figure 4 that the forming depth of Ni-Cu is larger than Cu-Ni. This could be attributed as follows. As previous study presented, the external layer of two-layer metal composite sheets suffering from larger deformation than the internal layer (external layer is the layer which is contacted with the micro mold) [22]. In Ni-Cu formed components, the copper layer served as the external layer, meanwhile the formability of copper was stronger than nickel, so the forming depth of Ni-Cu formed components was larger than Cu-Ni.

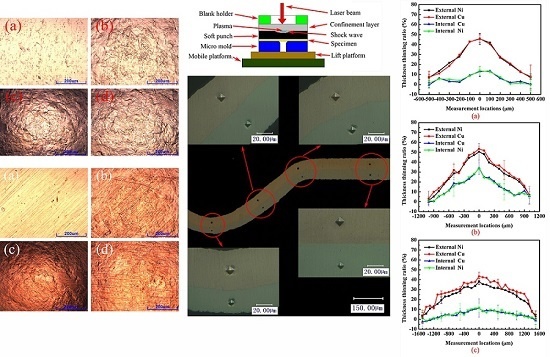
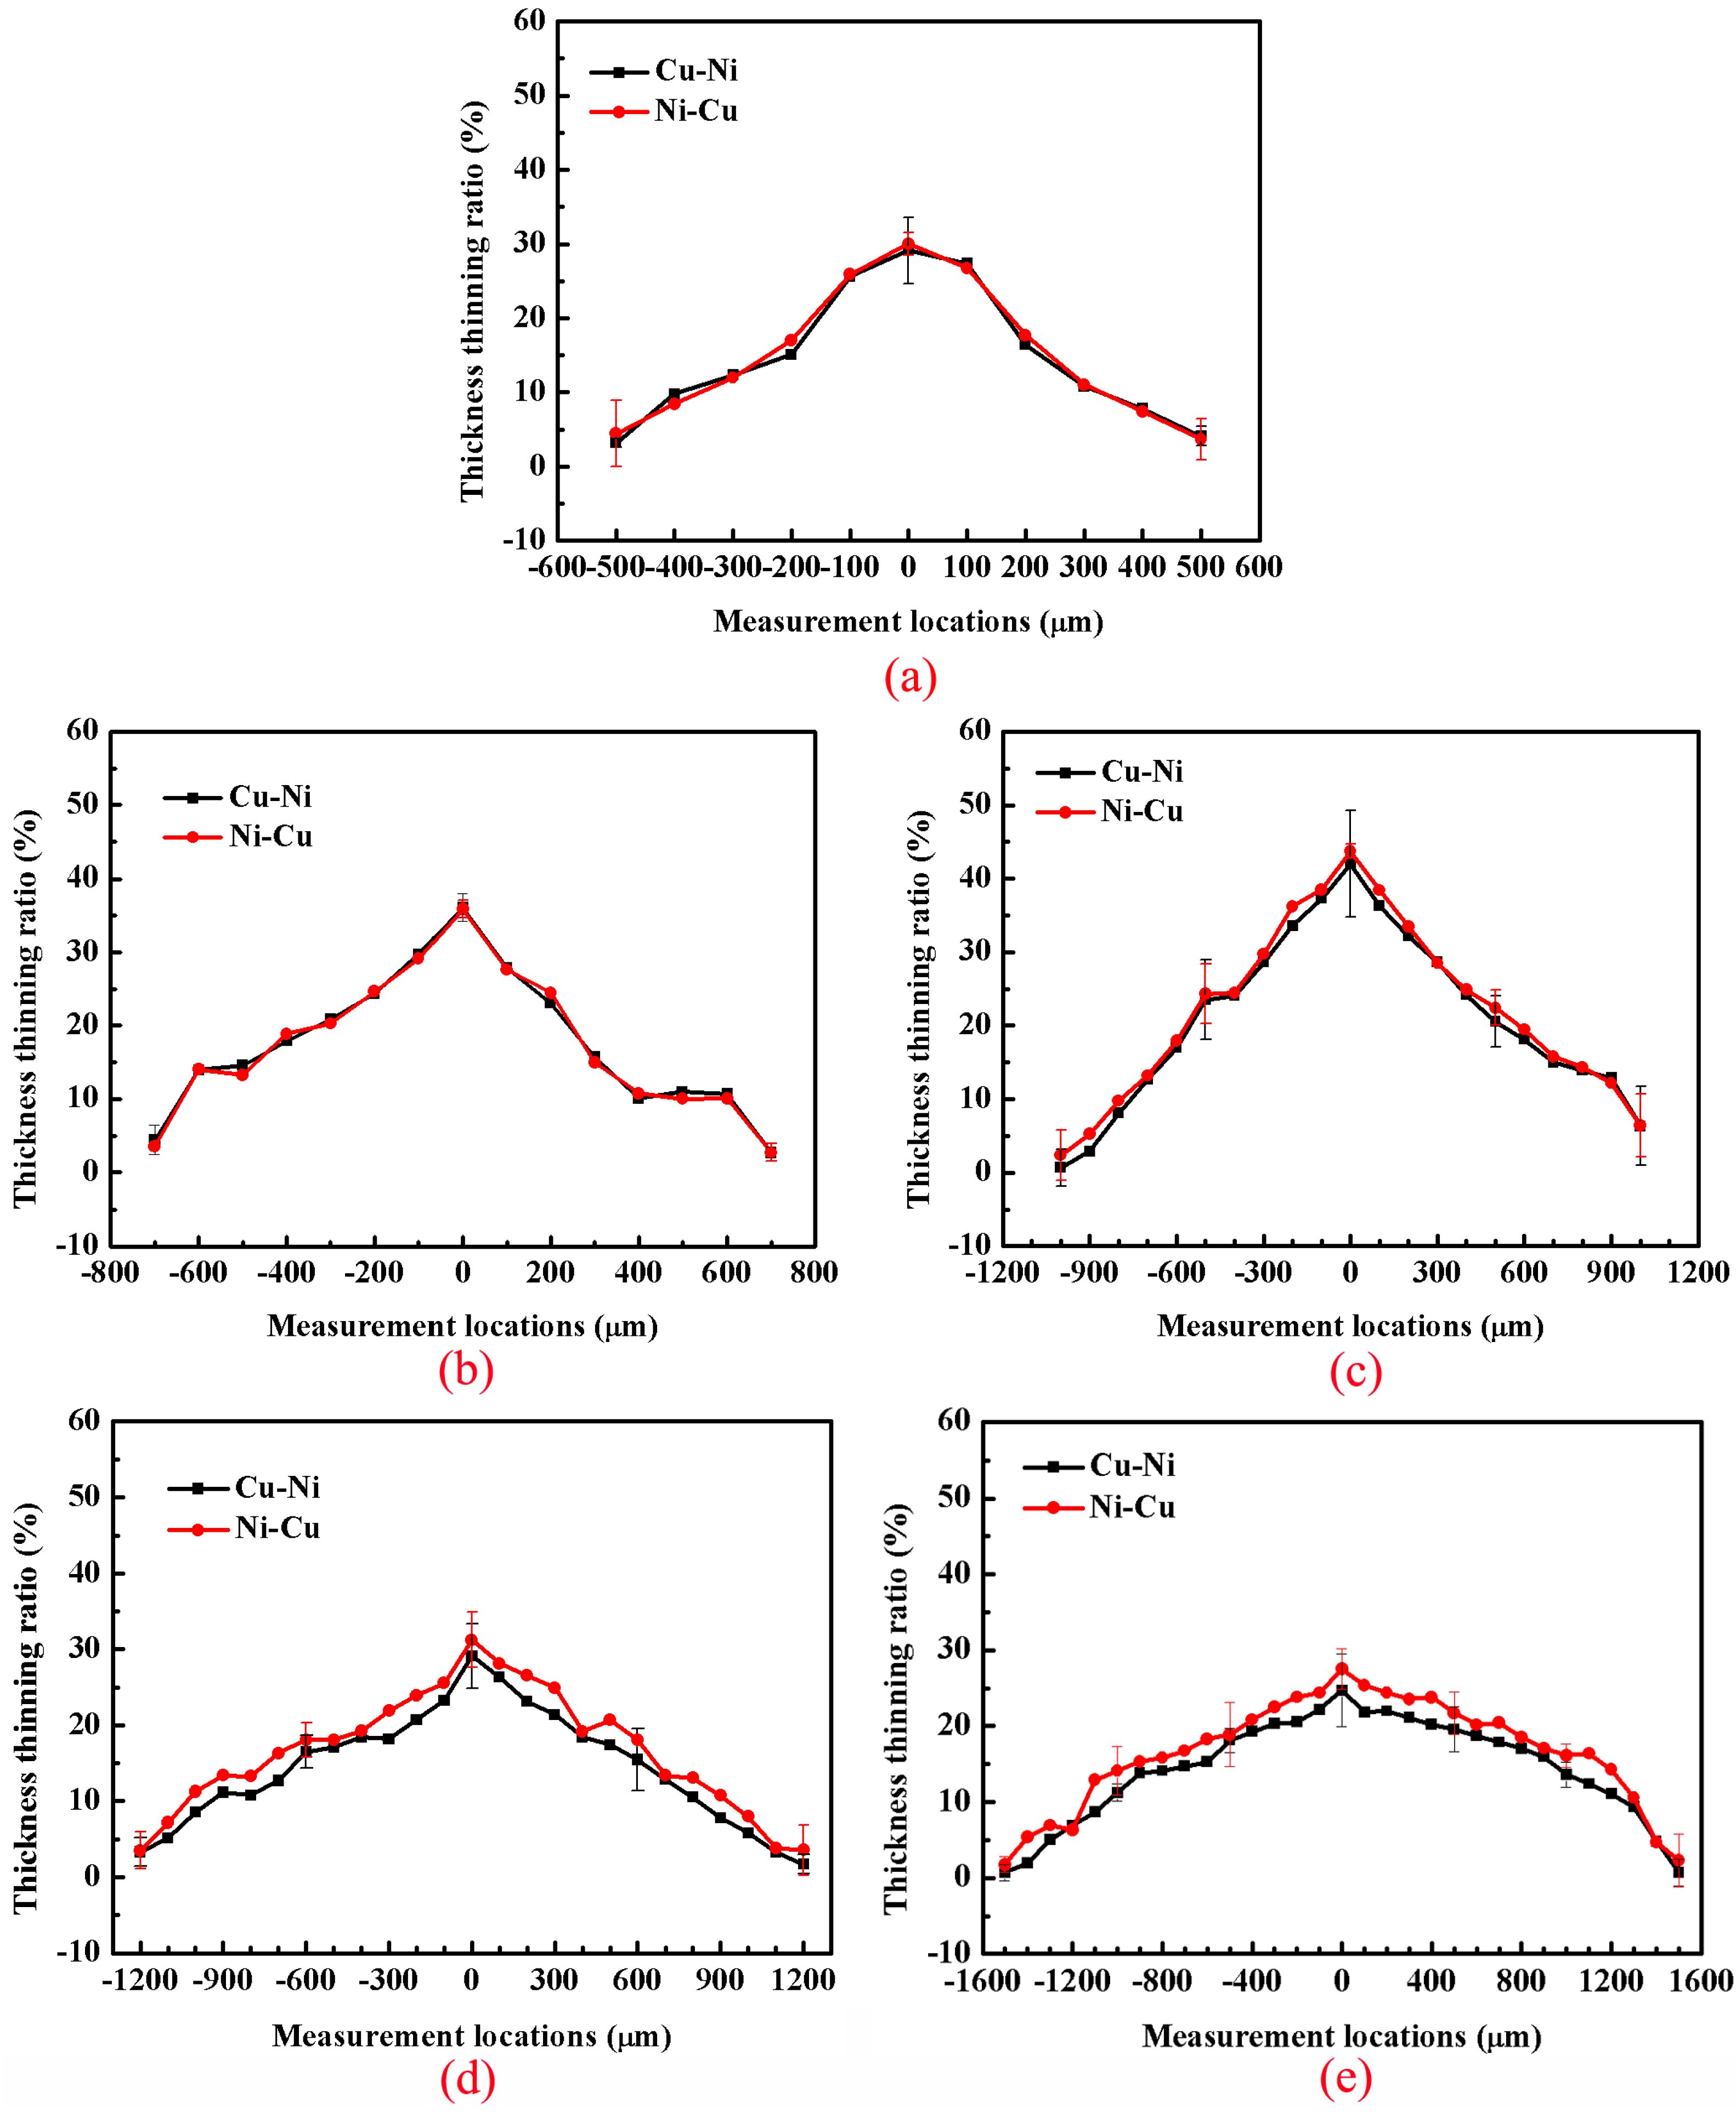
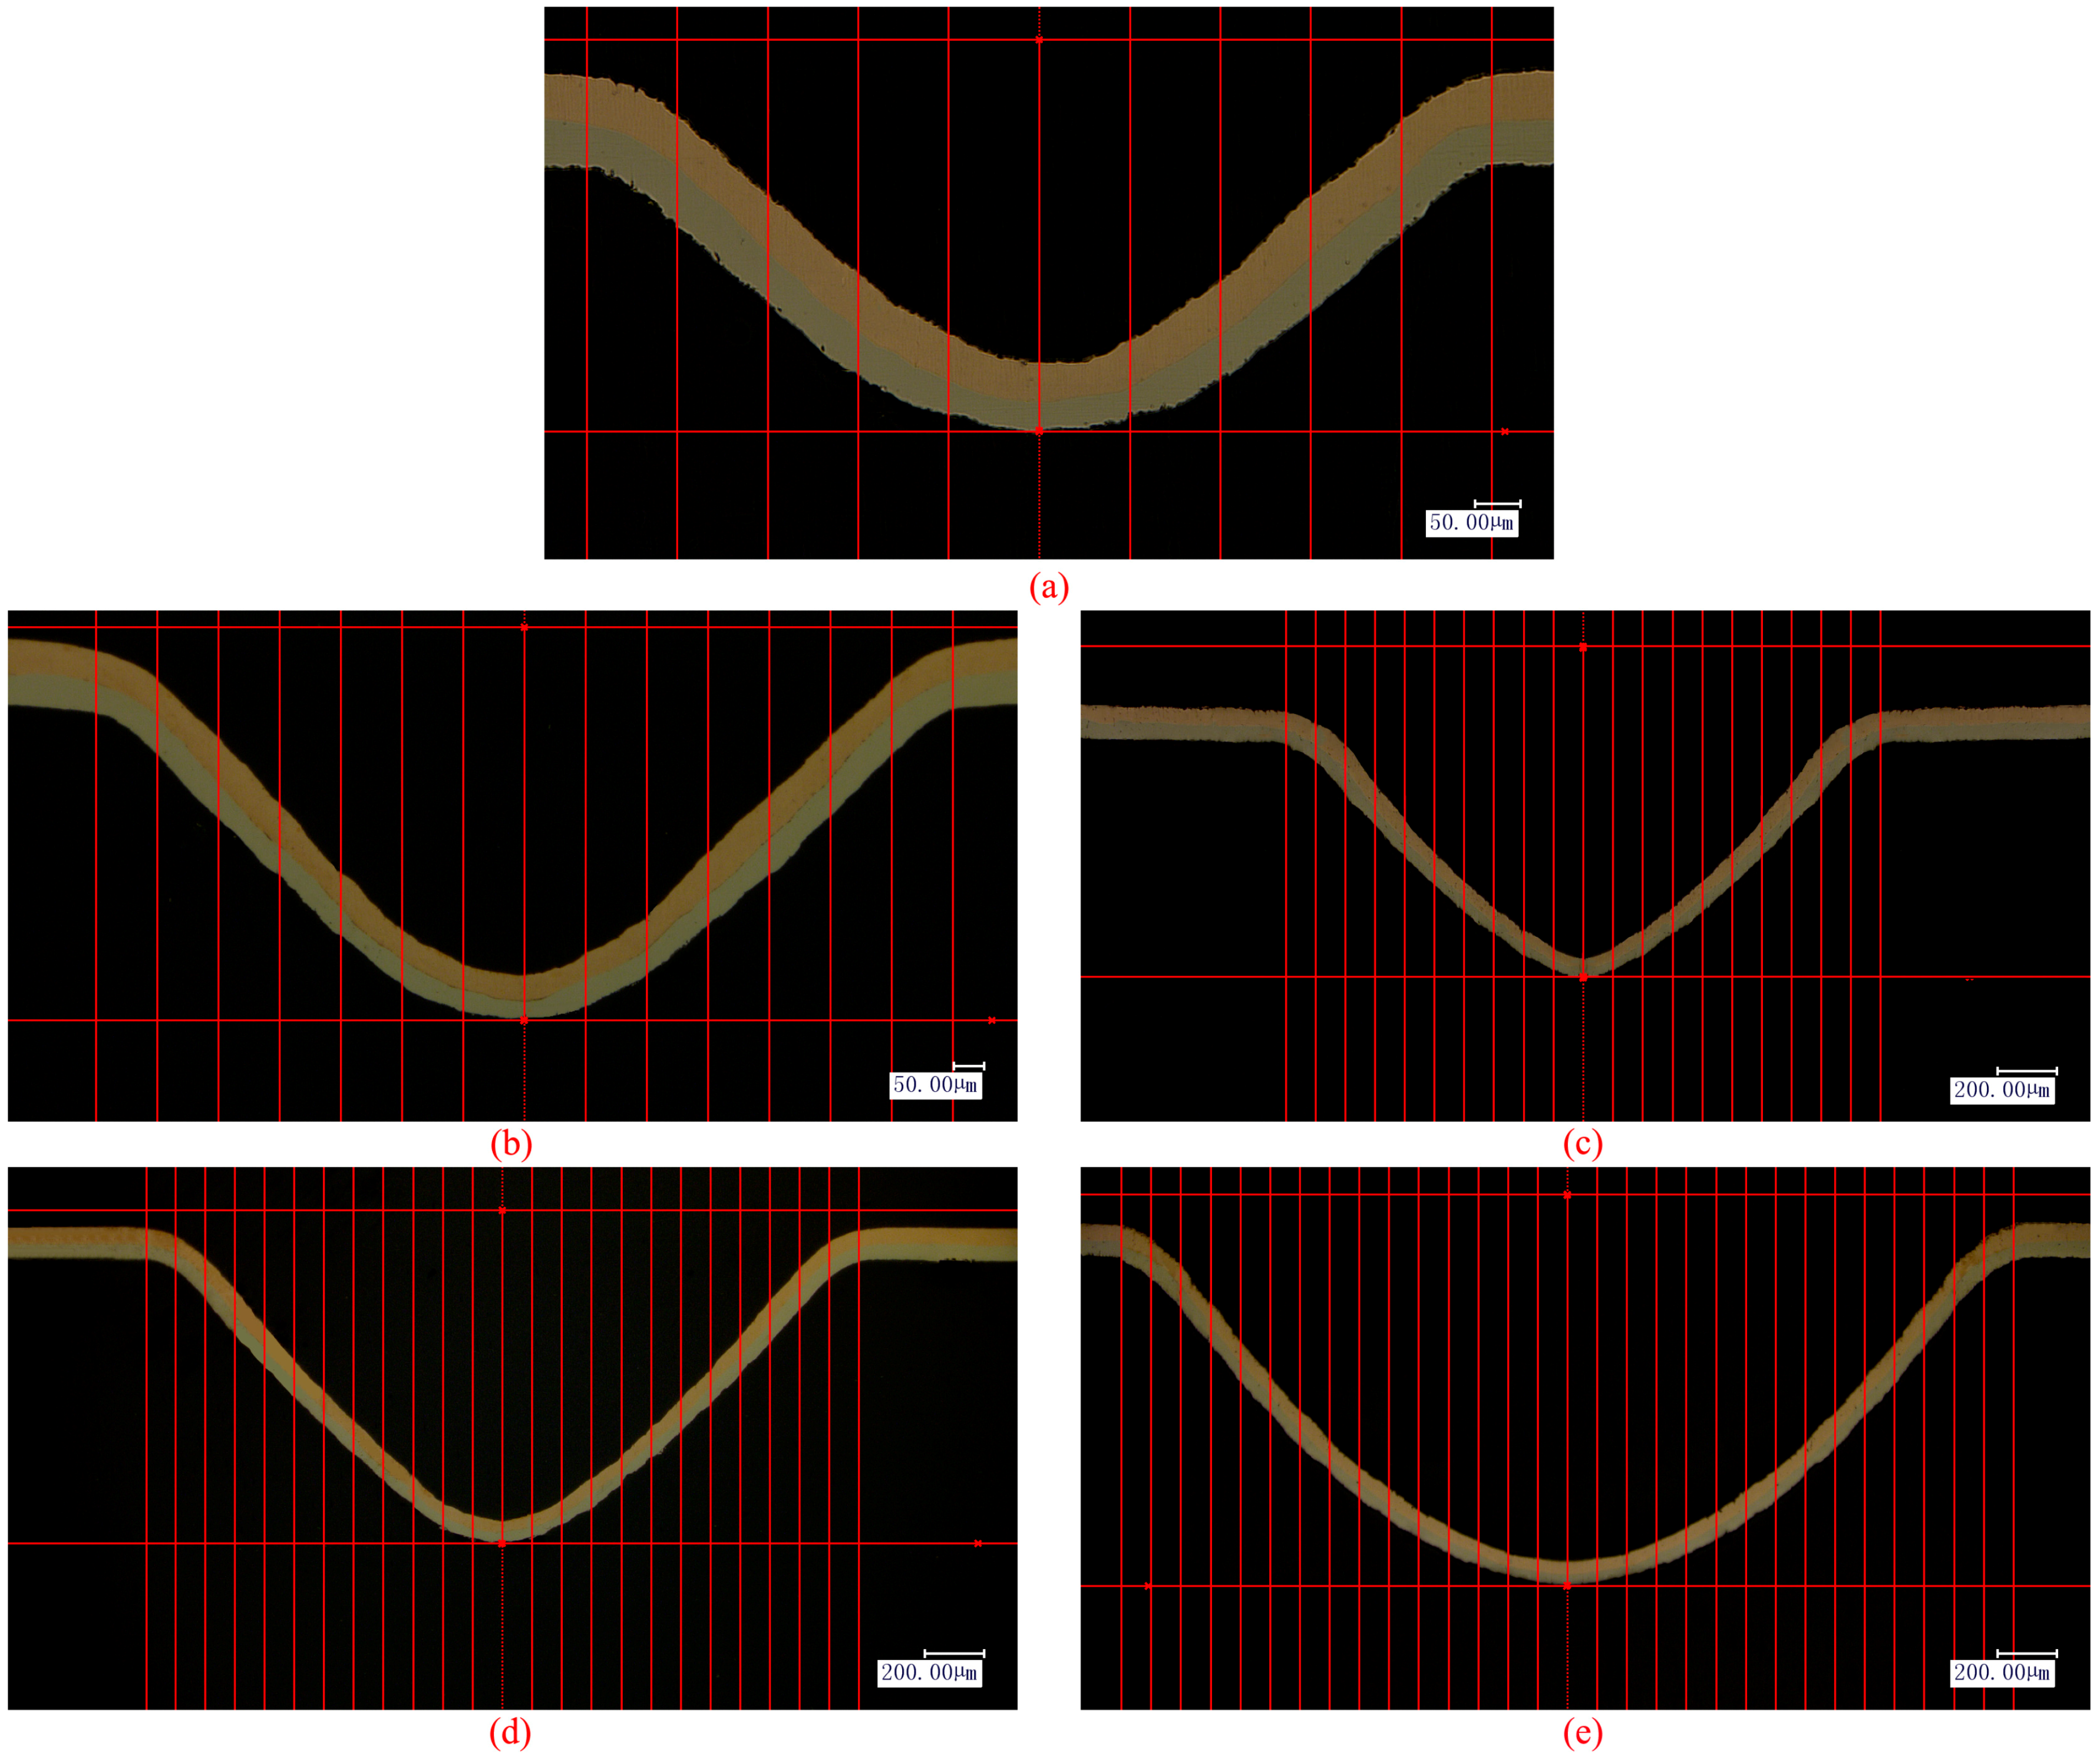
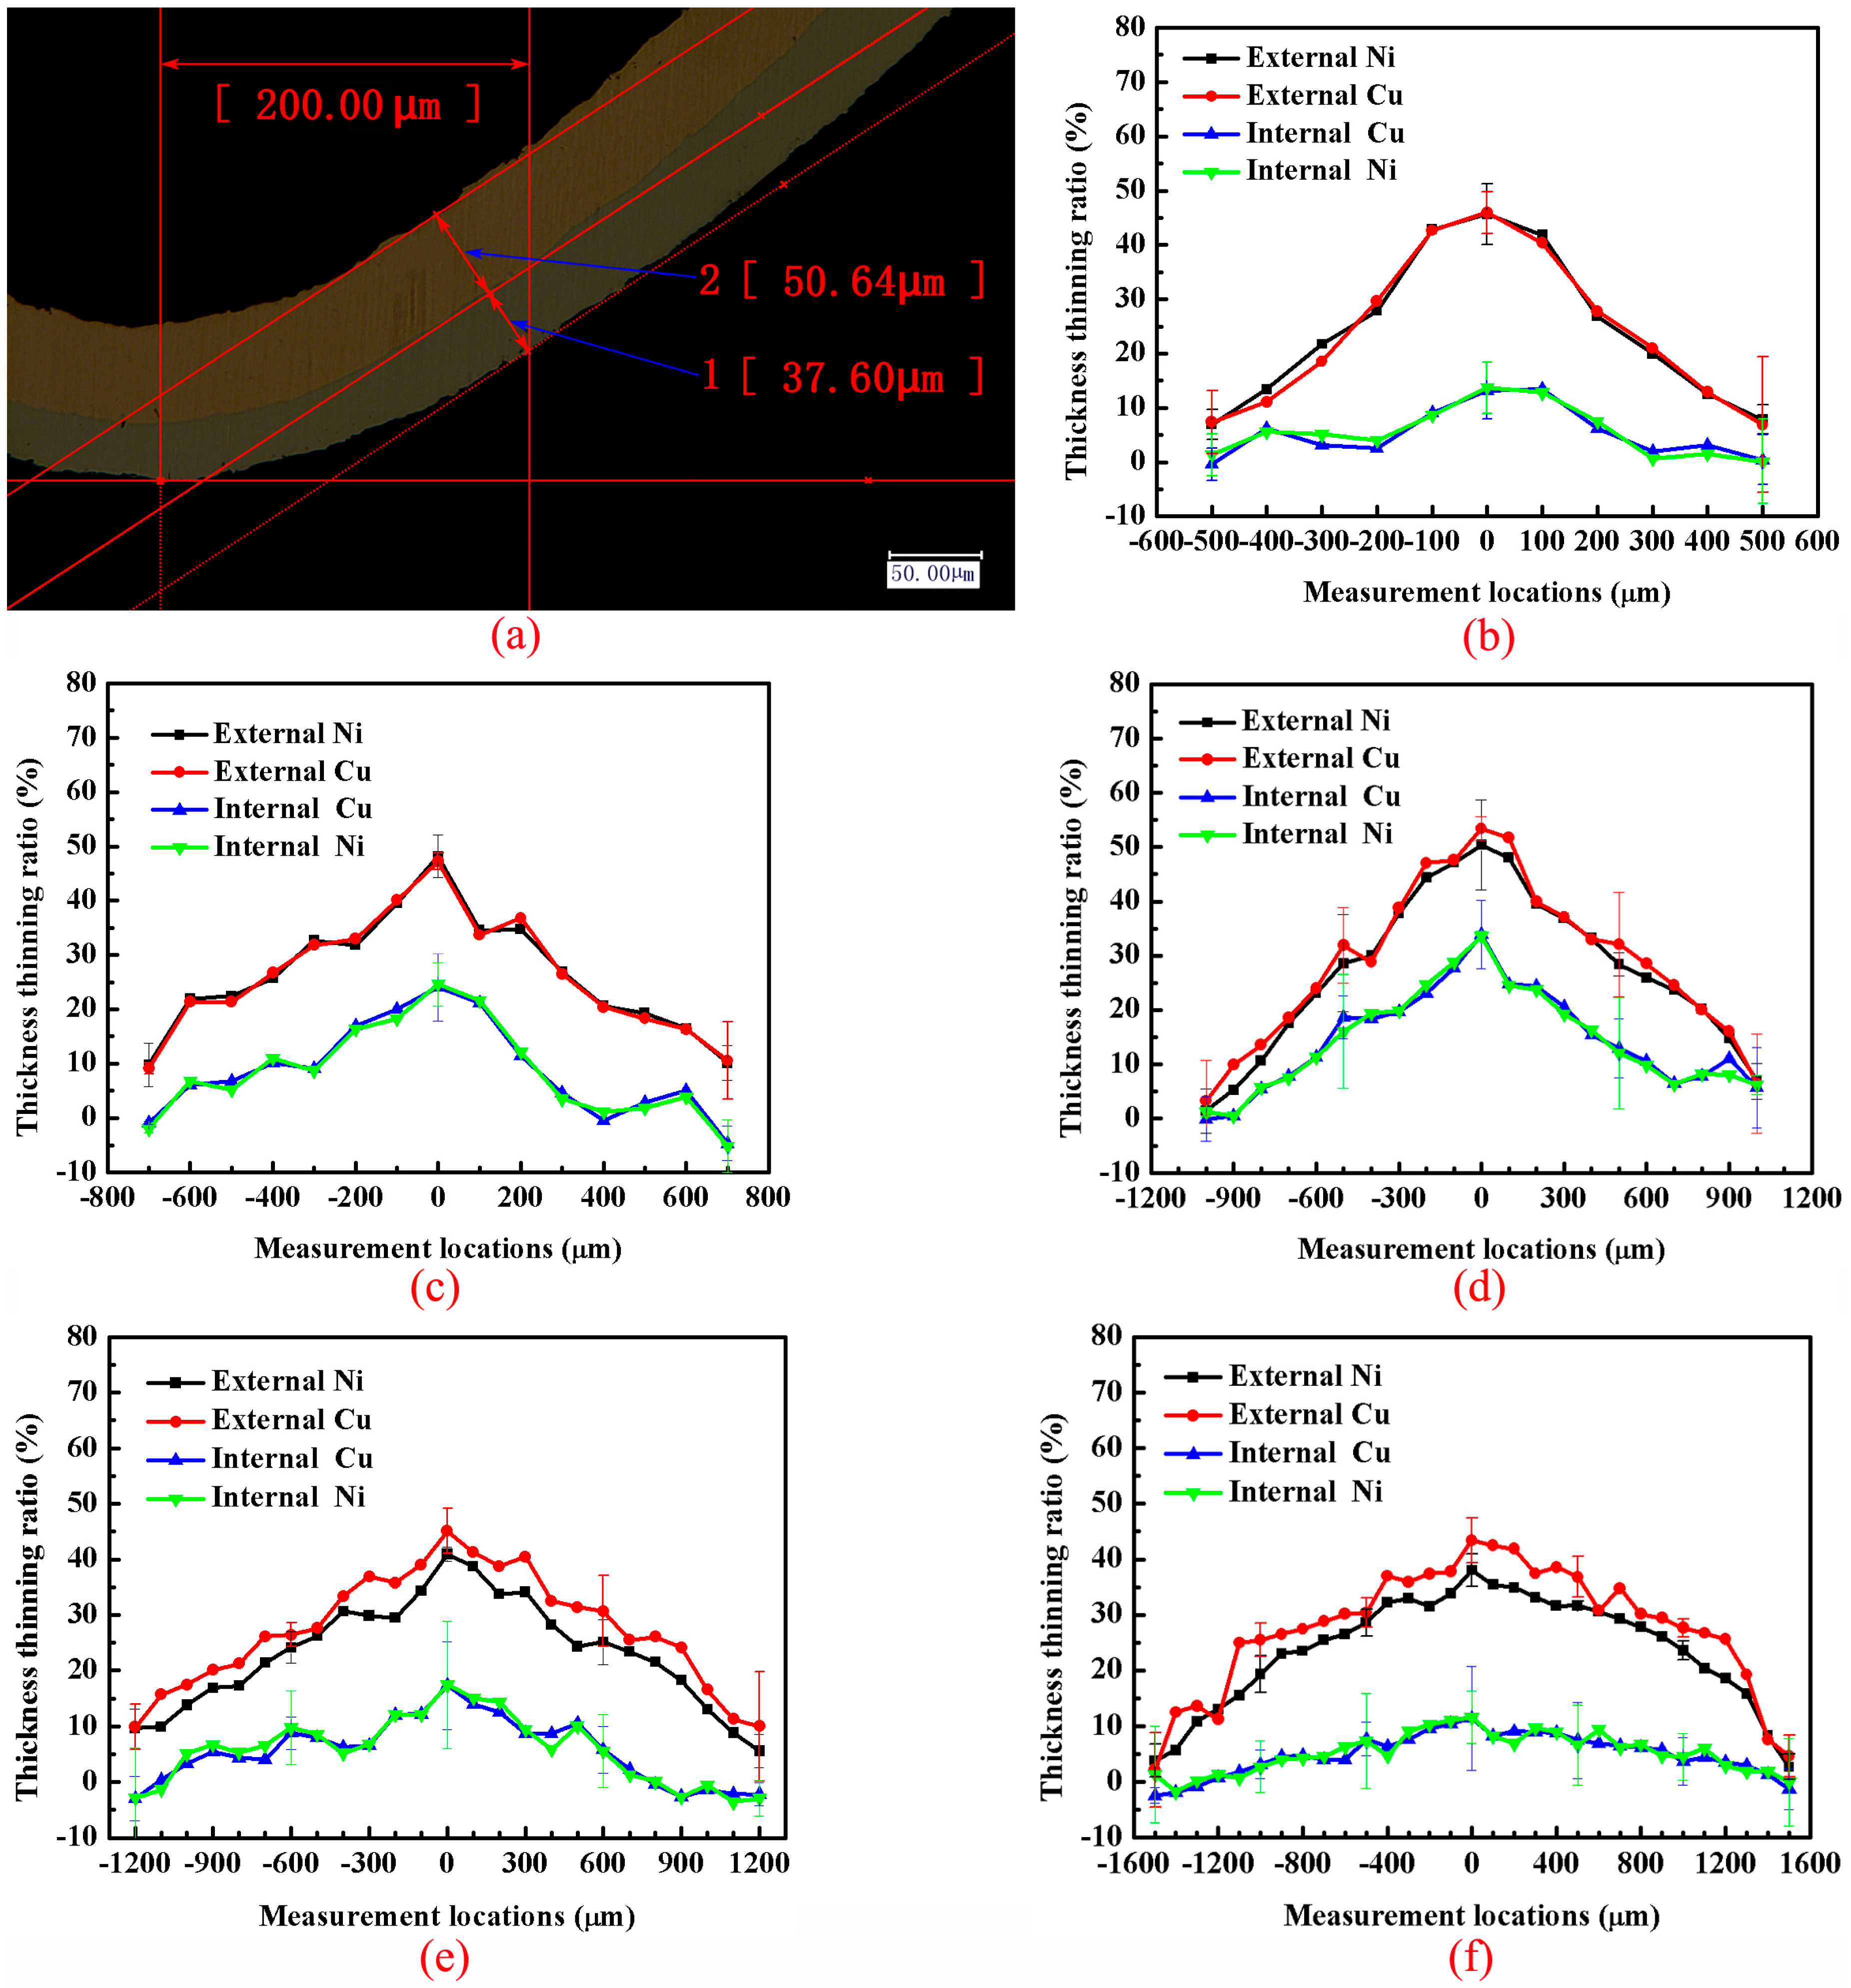
3.2. Feature Size Effect on Thickness Thinning

During the plastic forming process, thickness thinning is inevitably generated in materials. However, if the thickness thinning ratio is too large, localized necking even cracking could be produced which would severely deteriorate the performance of the components. Furthermore, thickness thinning behavior is strongly affected by the size effect. Therefore, it is essential to research the feature size effect on the thickness thinning behavior.
Laser energy was selected as 1800 mJ. Components with a different feature size were formed through the five types of molds. Eleven locations of components formed through mold 1 (as shown in Figure 6a), fifteen locations of components formed through mold 2 (as shown in Figure 6b), twenty-one locations of components formed through mold 3 (as shown in Figure 6c), twenty-five locations of components formed through mold 4 (as shown in Figure 6d), and thirty-one locations of components formed through mold 5 (as shown in Figure 6e) were selected to measure the thickness of the copper layer and the nickel layer. The distance between each location was 100 μm. In view of the thickness the two layers all needed to be measured, which was done through a high magnification lens, as shown in Figure 7a.
The thickness thinning ratio of the entire sheet and each layer were calculated by Equation (5), in which R was the thickness thinning ratio, T was the initial thickness, and Ti was the thickness after forming. For the total thickness of the sheets, t was 100 μm; for thickness of each layer, t was 50 μm. The thickness thinning ratios of each layer under two different layer stacking sequences formed through the five types of molds are shown in Figure 7. The thickness thinning ratios of entire sheets under two different layer stacking sequences are shown in Figure 8.
R = T T i T × 100 %
It showed that, no matter that the feature size was small or large, the thickness thinning ratio became gradually smaller from the bottom portion to the fillet portion, either in the copper layer or the nickel layer. The explanation was that the laser energy is in spatial Gaussian distribution, so the shock wave pressure became gradually larger from the fillet portion to the bottom portion, and the materials were subjected to a larger strain with increasing pressure. What is more, the thickness thinning ratio of the external layer was obviously larger than the internal layer, regardless of the layer stacking sequence and feature size, and the thickness thinning behavior of the entire sheets was determined by the external layer. This could be due to two reasons. Firstly, it was totally free for the external layer to deform, whereas the deformation of the internal layer was limited by the soft punch and the external layer. Secondly, the external layer was subjected to tensile stress while the internal layer was subjected to compressive stress during the forming procedure. Besides, the difference degree between the external layer and the internal layer became gradually smaller from the bottom portion to the fillet portion. It may also be due to the Gaussian distribution of the laser energy, as with the deformation extent of the two layers decreasing, the difference degree of the thickness thinning ratio between the two layers would also decrease.
Dehghani and Salimi [22] found that, when the copper layer of copper-steel composite sheets was set as the external layer, the difference degree of the thickness strain between the external layer and the internal layer was larger compared with that of copper-steel composite sheets when the steel layer was set as the external layer, and the thickness of the entire sheets decreased more. However, it can be seen from Figure 7 and Figure 8, the influence degree of the layer stacking sequence on thickness thinning is considerably affected by feature size. For components formed from mold 1, mold 2 or mold 3, the thickness thinning behavior of the external layer or internal layer or entire sheet between the two different layer stacking sequences was almost the same. For components formed through mold 4 and mold 5, the thickness thinning ratio of the external layer or entire sheet of Ni-Cu was conspicuously larger than Cu-Ni. This phenomenon could also be due to the fact that, as the feature size increased, more and more grains participated in plastic deformation, so the difference of formability between the copper layer and the nickel layer became larger and larger. Additionally, the formability of copper is superior to nickel, in that the thickness thinning ratio of the external layer would become larger when copper rather than nickel was set as the external layer in the large feature size. Nevertheless, the deformation degree of the internal layer was too small to bring about difference of thickness thinning between the copper layer and nickel layer.
It also revealed that, with feature size increasing, the thickness thinning ratio firstly increased then decreased. For example, for entire sheets of Ni-Cu, the maximum average thickness thinning ratio of components formed through mold 1, mold 2, mold 3, mold 4, and mold 5 was 30.03%, 35.89%, 43.73%, 31.27%, and 27.51% respectively. This was not in agreement with the results obtained by Liu et al. [19], as they reported that the thickness thinning ratio of monolithic copper sheets always increased with increasing feature size. However, the maximum mold diameter they used was only 1.6 mm. The limit of material flow and the deformation resistance became gradually smaller with increasing feature size. However, as feature size further increased, the number of grains participating in deformation rapidly increased and the influence of deformation resistance became smaller, which meant the average deformation extent of the grains decreased. Therefore, the thickness thinning ratio of the components formed through mold 3 was the largest. To illustrate the phenomenon in detail, the normalized forming depth was calculated by Equation (6), in which Dn was the normalized forming depth, Df was the average forming depth, and Dm was the mold diameter. The variation trend of the normalized forming depth with different feature size is shown in Figure 9.
D n = D f 1000 × D m
It showed that the normalized forming depth first increased then decreased with increasing feature size. In accordance with this, the deformation extent also first increased and then decreased with increasing feature size. Therefore, the thickness thinning ratio first increased then decreased. It could be speculated that, under the same experiment parameters, it was easier for components formed through the small feature size to arrive at the forming limit.

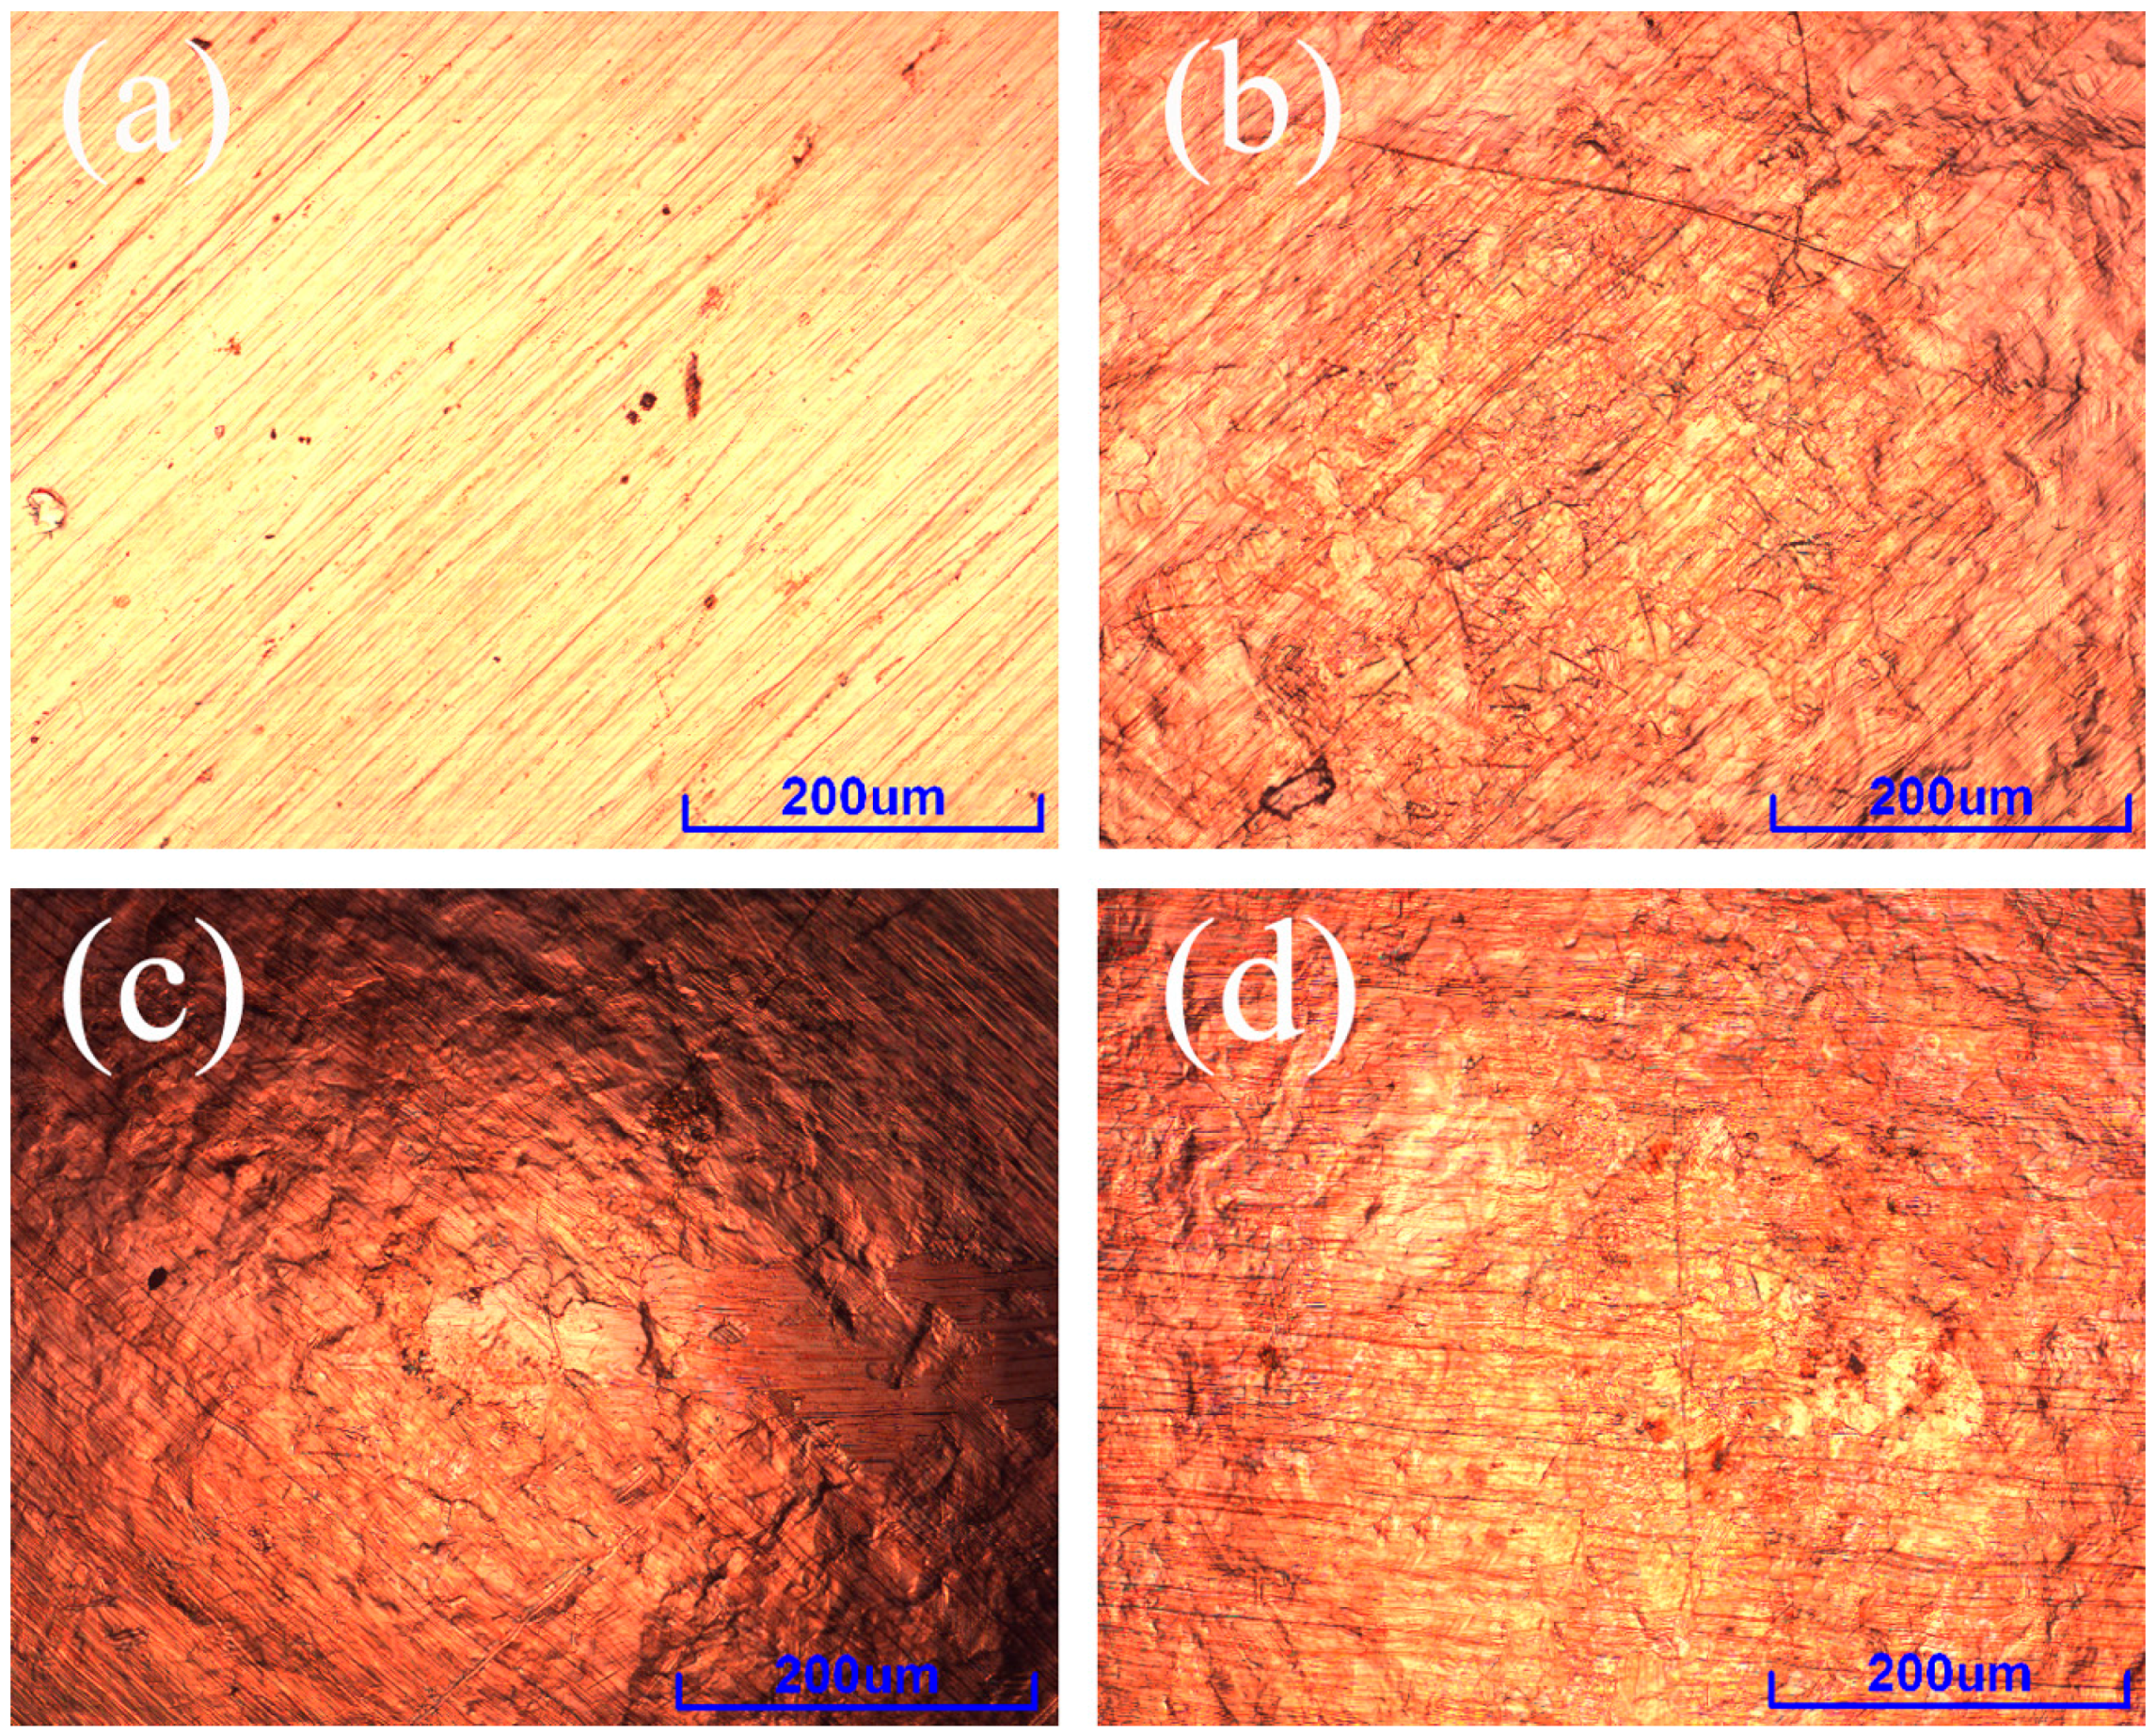
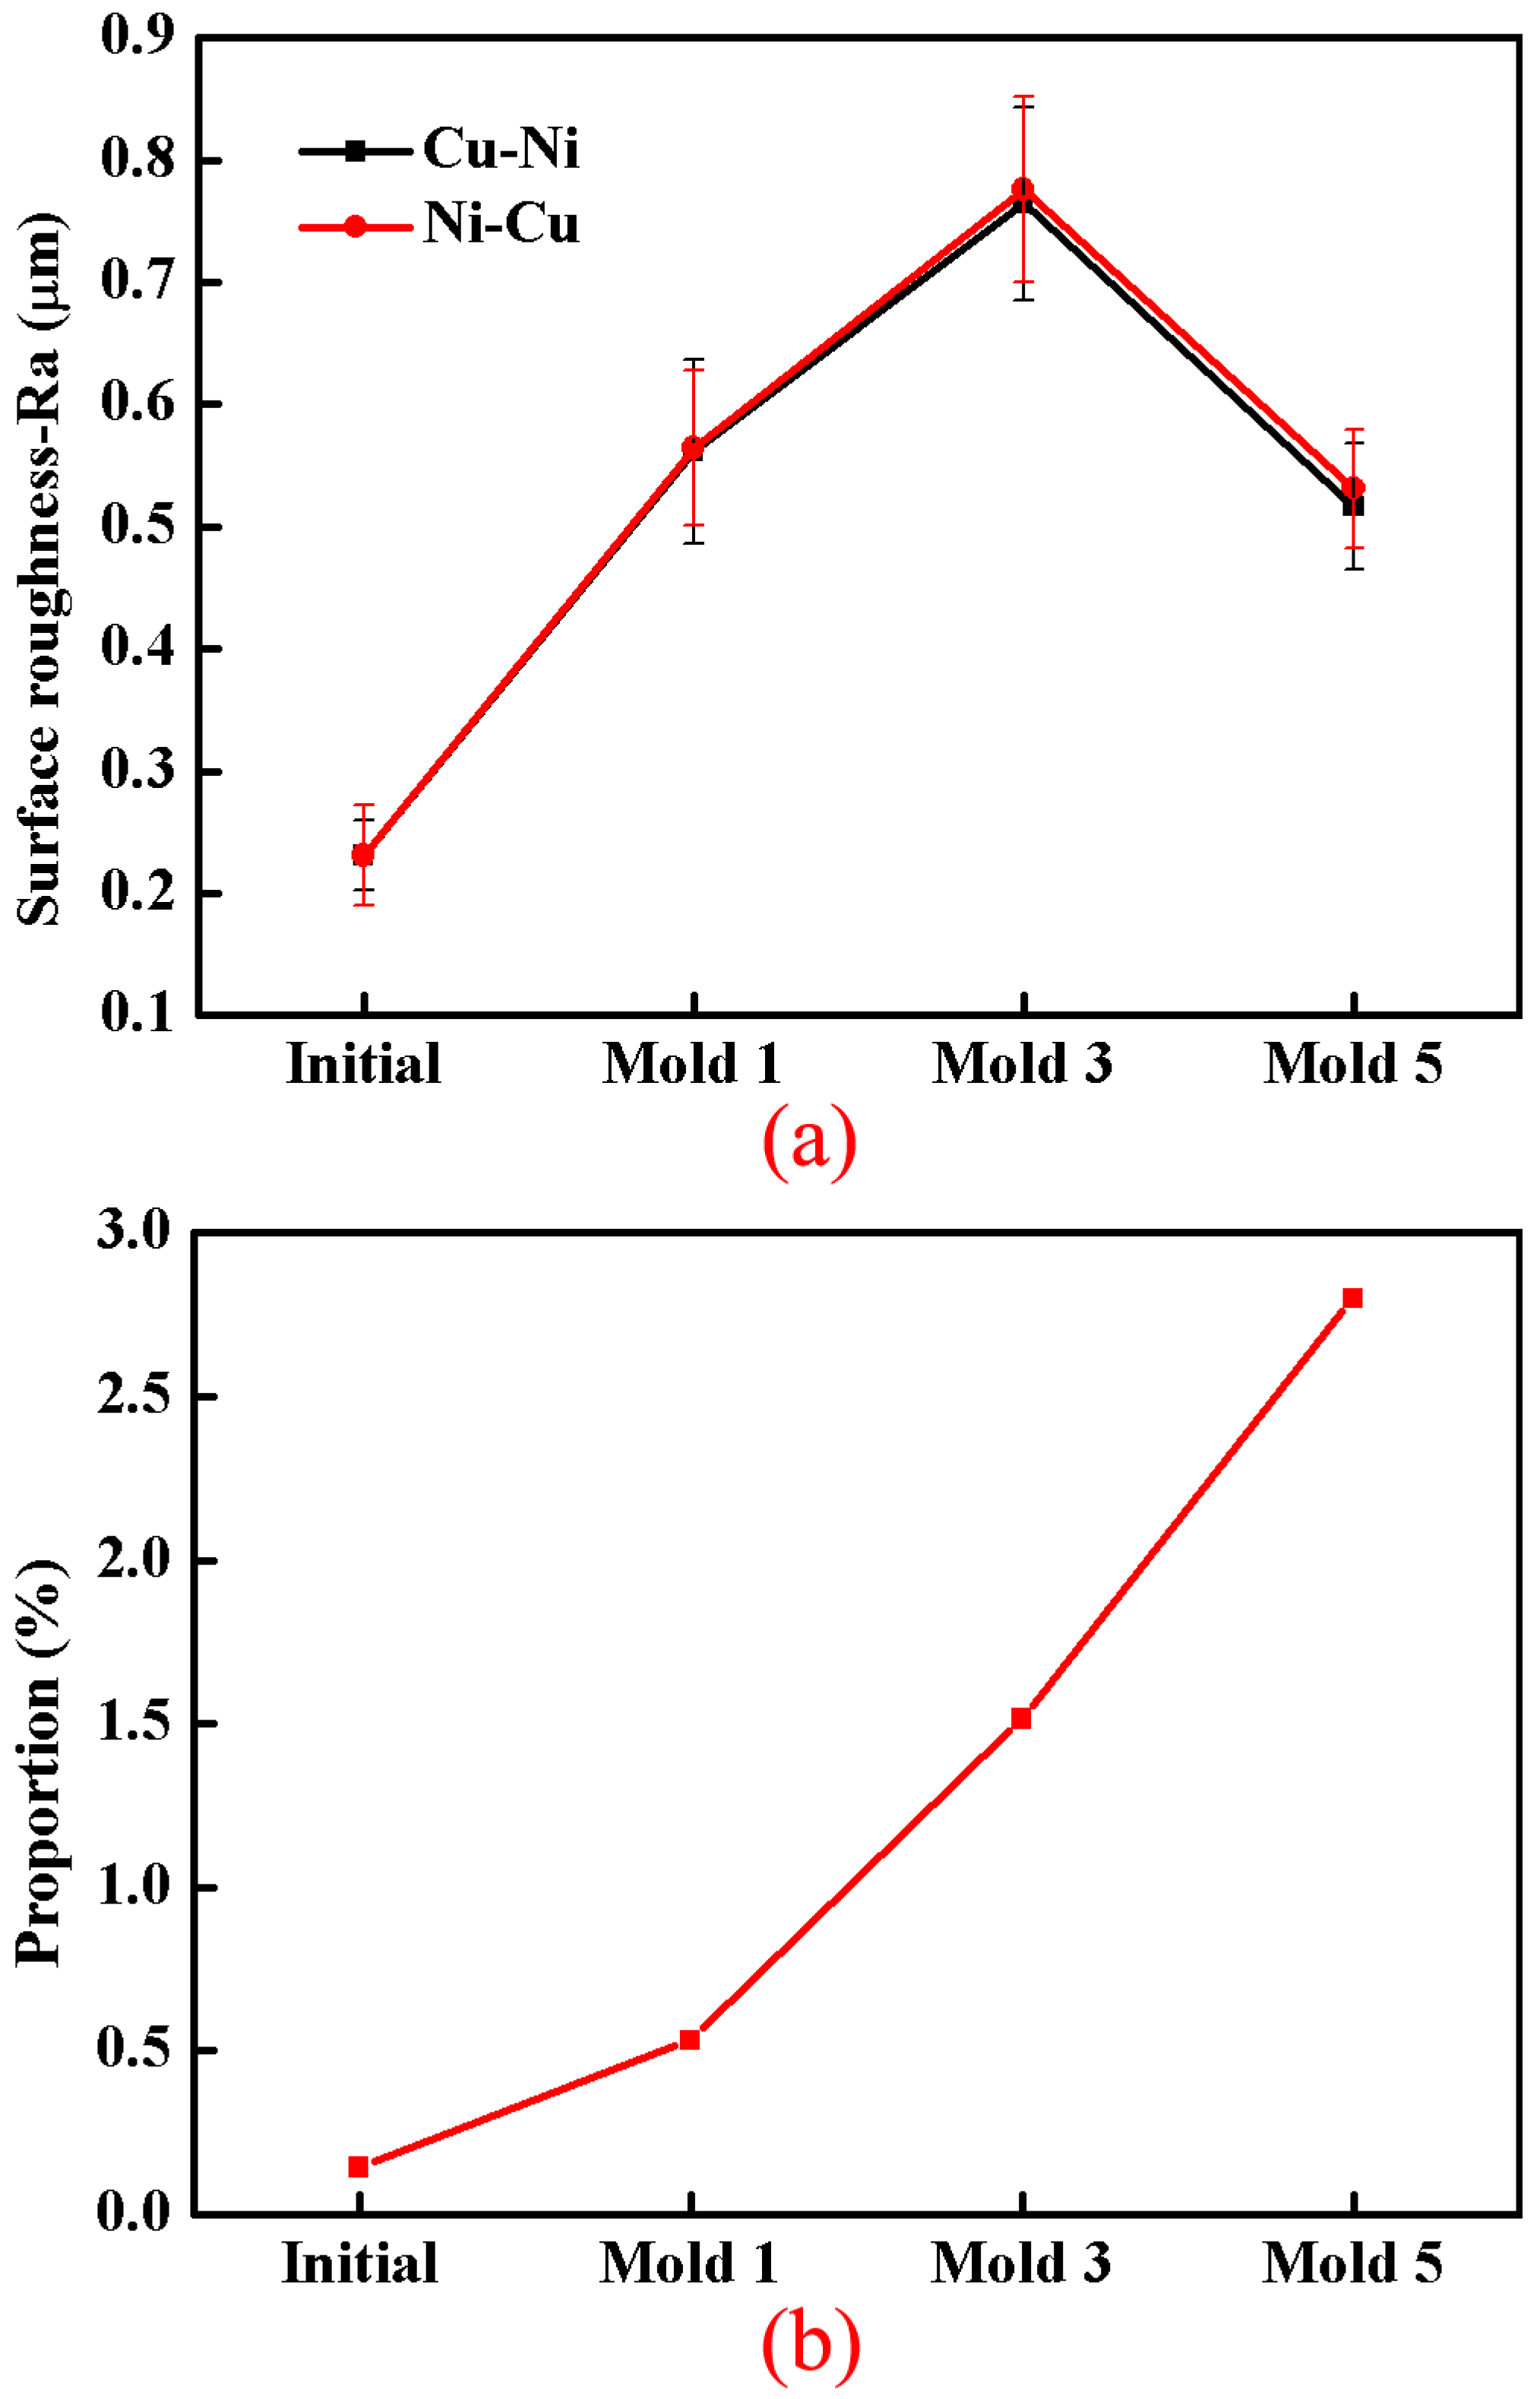
3.3. Feature Size Effect on Surface Quality

Some studies have shown that the surface quality of formed components is significantly influenced by size effect, meanwhile the deterioration of surface integrity would cause materials failed, so it is essential to research the feature size effect on surface quality of multilayer metal composite sheets.
The laser energy was selected as 835 mJ, and components with different feature sizes were formed through mold 1, mold 3 and mold 5. For Cu-Ni formed components, the surface of the nickel layer was measured; for Ni-Cu formed components, the surface of the copper layer was measured. Additionally, the surface of the initial portion was also measured. Figure 10 shows the surface morphology of initial portion and bottom portion of the Cu-Ni components. Figure 11 shows the surface morphology of initial portion and bottom portion of the Ni-Cu components.
The roughness value of the surface morphology shown in Figure 10 and Figure 11 is displayed in Figure 12a. It can be seen that surface roughening occurred in materials after the laser shock. This was due to two reasons: (1) dislocations occurred during deformation, and dislocation slipped out materials, then slip step occurred on the surface of the materials; (2) grains with lower constraint moved or rotated because of the strain incompatibility between contiguous grains.
It was also found that the surface roughness value of the nickel and copper layer of the initial portion was almost the same. It also could be seen that, although there was only a slight difference of surface roughness between Cu-Ni and Ni-Cu, with feature size increasing, the difference became increasingly larger. Due to the surface roughness of components formed through different feature size being very different from each other, to show the variation trend of difference degree of surface roughness between Cu-Ni and Ni-Cu accurately, the proportion of difference was calculated by Equation (7), in which Pr was the proportion of the difference, Rn was the average surface roughness of Cu-Ni and Rc was the average surface roughness of Ni-Cu. The variation law between the difference degree of surface roughness and feature size is shown in Figure 12b.
P r = 2 × ( R c R n ) ( R c + R n ) × 100 %
Ultrahigh strain rate deformation was produced in materials under microscale laser flexible forming, so the distinction of formability between different metals under quasi-static condition could not obviously respond under dynamic loading. However, as feature size increased, increasingly more grains took part in plastic deformation, which resulted in the difference of formability between the copper layer and nickel layer becoming increasingly considerable. In consequence, the surface quality of components with different layer stacking sequences became increasingly different with feature size increasing.
It also revealed that, with feature size increasing, the surface roughness first increased then decreased, either for Cu-Ni or Ni-Cu. This was inconsistent with the result obtained by Wang et al. [12], as they concluded that the surface roughness of monolithic copper sheets formed by laser shock always increased with increasing feature size. It was also in disagreement with the conclusion in quasi-static loading illustrated by Fu et al. [18], as they found surface roughness of monolithic copper sheets increasingly larger with decreasing mold size. This could be due to the fact that, the surface roughness of two-layer metal composite sheets is decided by the deformation extent of the external layer rather than the entire sheet. From Section 3.2, it could be seen that the deformation extent of the external layer of components formed through mold 3 was much larger than mold 1 and mold 5. Meanwhile, under larger deformation, dislocations were easier to slip out materials to leave slip steep on the surface, and the strain incompatibility between grains became more obvious. Therefore, the extent of surface roughening firstly increased and then decreased. This was also why the surface roughness of Ni-Cu formed components was larger than Cu-Ni formed components. In addition, it was also in agreement with the variation trends of normalized forming depth. The normalized forming depth of components was calculated by Equation (6). The variation trend between normalized forming depth and feature size is shown in Figure 13.
This shows that normalized forming depth firstly increased then decreased with increasing feature size. Consistent with this, the average deformation extent of grains also first increased and then decreased. Therefore, with feature size increasing, the surface roughness of components first increased then decreased.

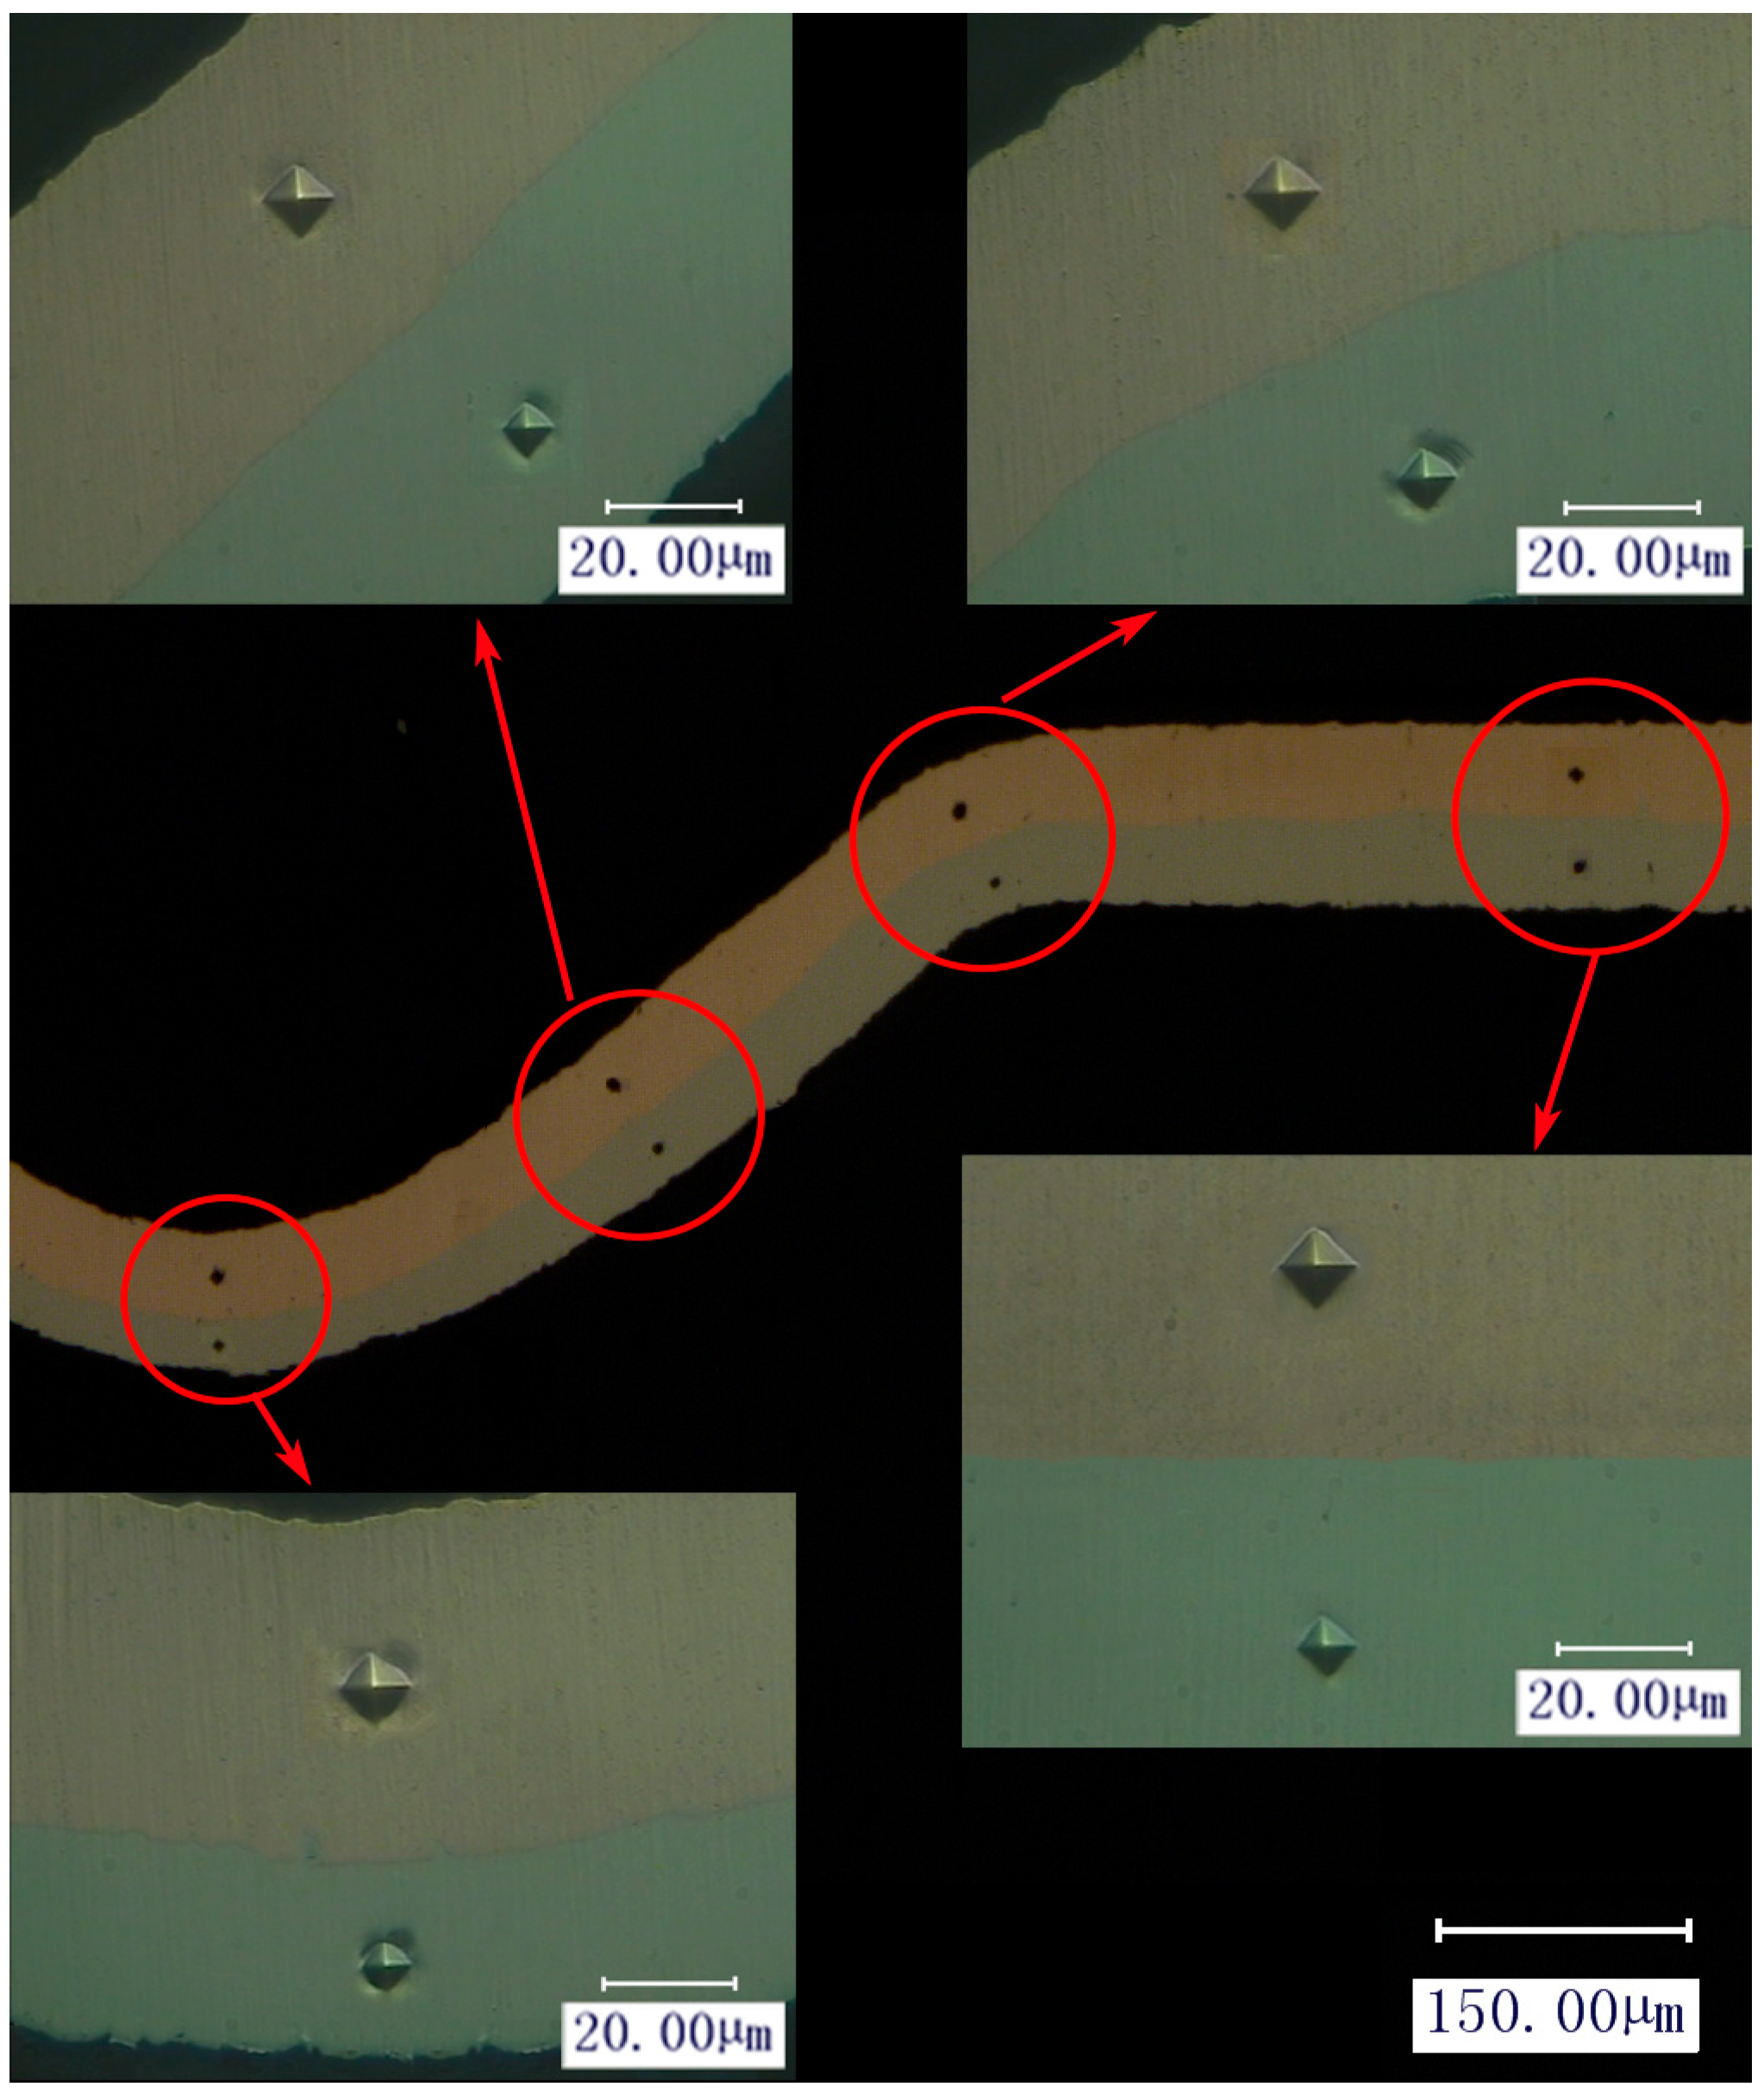
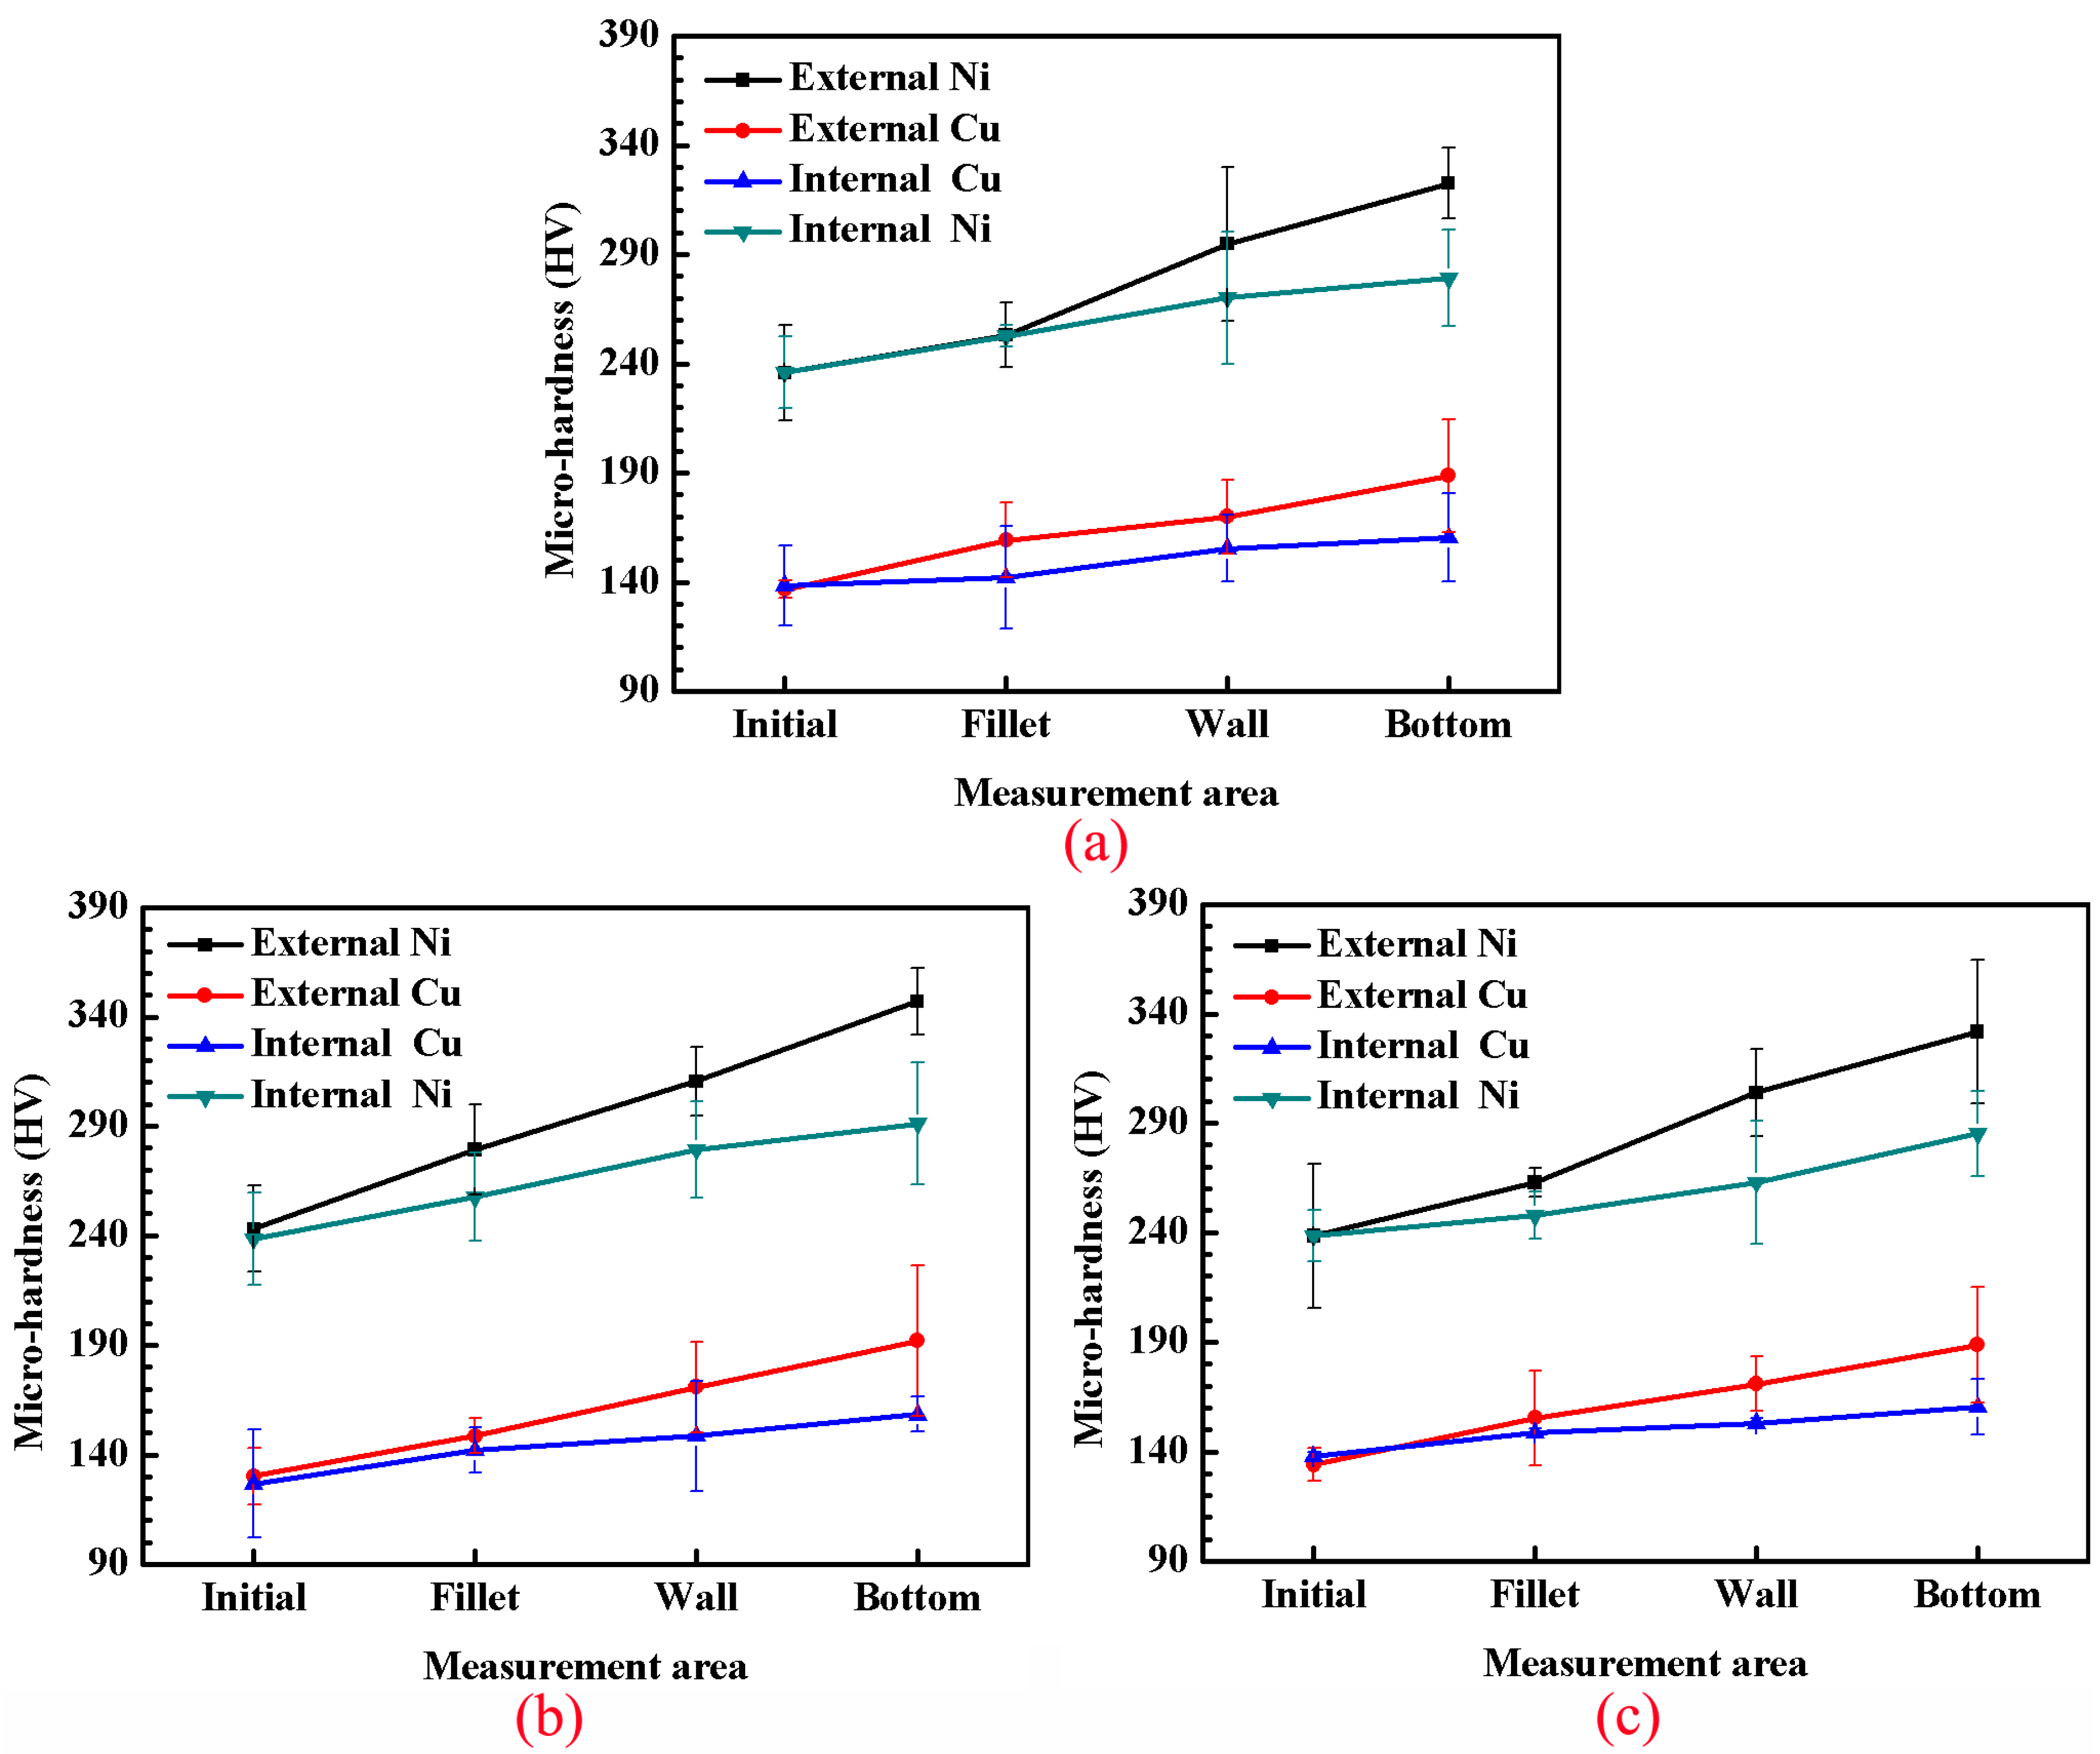
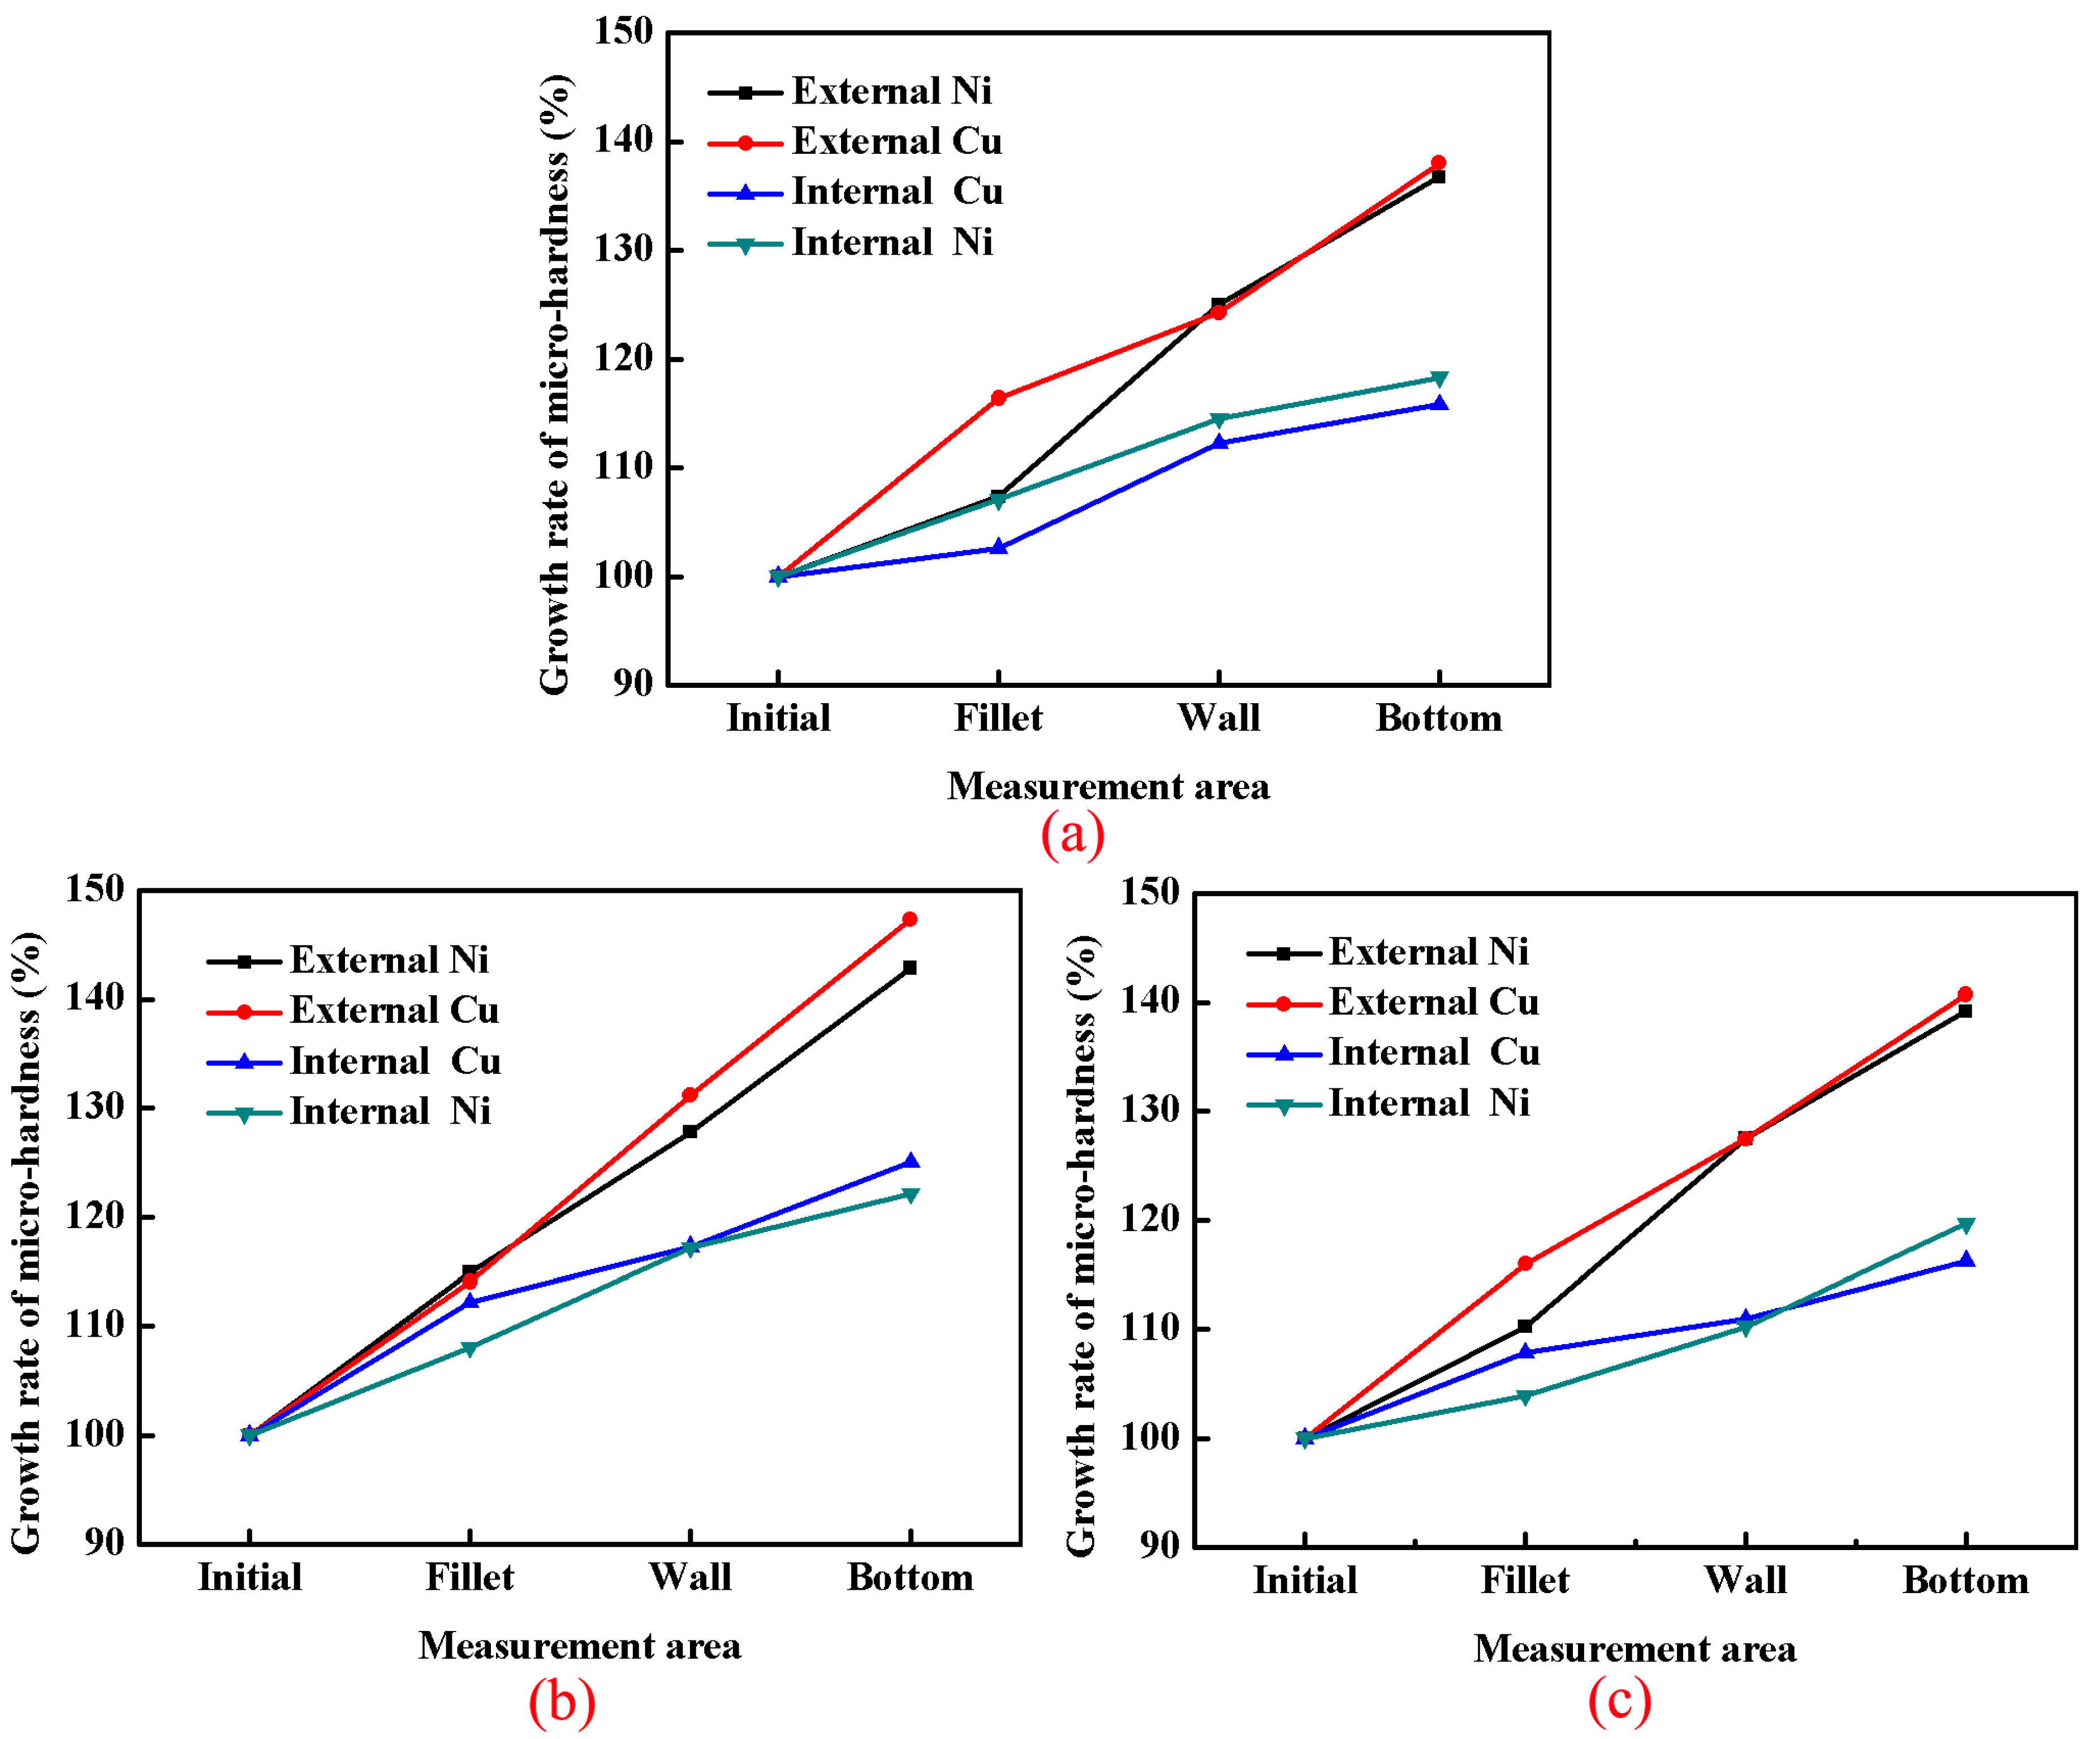
3.4. Feature Size Effect on Micro-Hardness Distribution

Micro-hardness is an important aspect of the characteristics of metals, so it is essential to study the influence of feature size on micro-hardness distribution during the forming process. The micro-hardness of components formed through mold 1, mold 3, and mold 5 under 1800 mJ were measured. The initial area, fillet area, wall area, and bottom area of the two layers were measured, as shown in Figure 14.
Figure 15 shows the measurement results of the micro-hardness. It can be seen that the micro-hardness of copper and nickel were different from each other, clearly to eliminate the difference and reveal the variation trend, the micro-hardness value of copper and nickel layer in initial area were all denoted as 100%. The growth rate of micro-hardness in other areas was calculated by Equation (8), in which G was the growth rate of micro-hardness, h was the micro-hardness value of initial area and hi was the micro-hardness value of other areas. The variation trend of micro-hardness is shown in Figure 16.
G = h i h × 100 %
The results show that: (1) from initial area to bottom area, the micro-hardness became larger and larger, either in the copper layer or nickel layer; (2) the micro-hardness of the external layer was obviously larger than the internal layer; (3) the amplification of micro-hardness under mold 3 was larger than mold 1 or mold 5 (for instance, for the bottom area of the external copper layer, the growth rate was 138.01%, 147.35%, and 140.72% under mold 1, mold 3, and mold 5 respectively). The reason was that, as presented in Section 3.2, the strain became increasingly larger from the edge area to the center area, and the external layer was deformed more strongly than the internal layer, while the plastic deformation extent under mold 3 was the largest. With plastic deformation increasing, the dislocation density became larger, grain size became smaller and the number of grain boundaries increased [44], which induced the increase of micro-hardness, such that the distribution of micro-hardness was as Figure 15.
However, unlike the thickness thinning or the forming depth or surface roughness, it could not be seen that the effect of the layer stacking sequence on micro-hardness distribution was considerably influenced by feature size. The different characteristic of copper and nickel may cause this phenomenon. Further investigation is needed in this aspect.

4. Conclusions

In this paper, the feature size effect on the formability of two-layer copper/nickel composite sheets under microscale laser flexible forming was studied, including forming depth, thickness thinning, surface quality, and micro-hardness distribution. Several conclusions were acquired from the experiment results:
(1)
With feature size increasing, forming depth increased. Meanwhile, with feature size increasing, the thickness thinning ratio and surface roughness first increased then decreased.
(2)
The difference degree of forming depth and surface roughness between the two different layer stacking sequences increased with increasing feature size. The forming depth and surface roughness of Ni-Cu formed components were larger than Cu-Ni.
(3)
The thickness thinning ratio of the external layer was much larger than the internal layer. As feature size increased, the effect of layer stacking sequence on the thickness thinning behavior became increasingly obvious. The difference degree of thickness thinning ratio of the external layer between Cu-Ni and Ni-Cu increased with increasing feature size, and the thickness thinning ratio of the external layer was larger when copper was set as the external layer rather than nickel. The variation law between the thickness thinning ratio of the entire sheet and the feature size was the same as the external layer.
(4)
The distribution of micro-hardness was similar to thickness thinning, but it seemed that the difference degree of micro-hardness between two different layer stacking sequences was not considerably influenced by feature size.

Acknowledgments

This work is supported by the National Natural Science Foundation of China (No. 51675243) and the Natural Science Foundation of Jiangsu Province (Grant No. BK20151343).

Author Contributions

Huixia Liu, Wenhao Zhang and Jenn-Terng Gau conceived and designed the experiments; Zongbao Shen and Guoce Zhang performed the experiments; Zongbao Shen and Youjuan Ma analyzed the data; Huixia Liu and Youjuan Ma contributed materials tools; Huixia Liu, Wenhao Zhang and Xiao Wang wrote the paper.

Conflicts of Interest

The authors declare no conflict of interest.

References

  1. Vollertsen, F.; Biermann, D.; Hansen, H.N.; Jawahir, I.S.; Kuzman, K. Size effects in manufacturing of metallic components. CIRP Ann. Manuf. Technol. 2009, 58, 566–587. [Google Scholar] [CrossRef]
  2. Gau, J.T.; Principe, C.; Wang, J. An experimental study on size effects on flow stress and formability of aluminm and brass for microforming. J. Mater. Process. Technol. 2007, 184, 42–46. [Google Scholar] [CrossRef]
  3. Chan, W.L.; Fu, M.W. Experimental and simulation based study on micro-scaled sheet metal deformation behavior in microembossing process. Mater. Sci. Eng. A 2012, 556, 60–67. [Google Scholar] [CrossRef]
  4. Hu, Y.X.; Li, K.M.; Qi, C.J.; Yao, Z.Q.; Grandhi, R.V. Size effect on indentation depth of oxygen-free high purity copper induced by laser shock processing. Trans. Nonferr. Met. Soc. China 2012, 22, 573–578. [Google Scholar] [CrossRef]
  5. Xu, J.; Zhu, X.C.; Shan, D.B.; Guo, B.; Langdon, T.G. Effect of grain size and specimen dimensions on micro-forming of high purity aluminum. Mater. Sci. Eng. A 2015, 646, 207–217. [Google Scholar] [CrossRef]
  6. Wang, X.; Qian, Q.; Shen, Z.B.; Li, J.W.; Zhang, H.F.; Liu, H.X. Numerical simulation of flexible micro-bending processes with consideration of grain structure. Comput. Mater. Sci. 2015, 110, 134–143. [Google Scholar] [CrossRef]
  7. Chen, F.K.; Tsai, J.W. A study of size effect in micro-forming with micro-hardness tests. J. Mater. Process. Technol. 2006, 177, 146–149. [Google Scholar] [CrossRef]
  8. Gao, H.; Cheng, G.J. 3D microscale laser dynamic forming: Multiscale modeling and experimental validation. J. Appl. Phys. 2011, 109, 103511. [Google Scholar] [CrossRef]
  9. Parasiz, S.A.; Kinsey, B.L.; Mahayatsanun, N.; Cao, J. Effect of specimen size andgrain size on deformation in microextrusion. J. Manuf. Process. 2011, 13, 153–159. [Google Scholar] [CrossRef]
  10. Parasiz, S.A.; VanBenthysen, R.; Kinsey, B.L. Deformation size effects due to specimen and grain size in microbending. J. Manuf. Sci. Eng. 2010, 132, 011018. [Google Scholar] [CrossRef]
  11. Molotnikov, A.; Lapovok, R.; Gu, C.F.; Davies, C.H.J.; Estrin, Y. Size effects in micro cup drawing. Mater. Sci. Eng. A 2012, 550, 312–319. [Google Scholar] [CrossRef]
  12. Wang, X.; Ma, Y.J.; Shen, Z.B.; Gu, Y.X.; Zhang, D.; Qiu, T.B.; Liu, H.X. Size effects on formability in microscale laser dynamic forming of copper sheet. J. Mater. Process. Technol. 2015, 220, 173–183. [Google Scholar] [CrossRef]
  13. Wang, C.J.; Shan, D.B.; Zhou, J.; Guo, B.; Sun, L.N. Size effects of the cavity dimension on the microforming ability during coining process. J. Mater. Process. Technol. 2007, 187–188, 256–259. [Google Scholar] [CrossRef]
  14. Mahabunphachai, S.; Koç, M. Investigation of size effects on material behavior of thin sheet metals using hydraulic bulge testing at micro/meso-scales. Int. J. Mach. Tools Manuf. 2008, 48, 1014–1029. [Google Scholar] [CrossRef]
  15. Justinger, H.; Hirt, G. Estimation of grain size and grain orientation influence in microforming processes by Taylor factor considerations. J. Mater. Process. Technol. 2009, 209, 2111–2121. [Google Scholar] [CrossRef]
  16. Parasiz, S.A.; Kinsey, B.; Krishnan, N.; Cao, J.; Li, M. Investigation of deformation size effects during microextrusion. J. Manuf. Sci. Eng. 2007, 129, 690–697. [Google Scholar] [CrossRef]
  17. Xu, J.; Guo, B.; Shan, D.B.; Li, B.S. Study of size effects on deformation behavior and formability in micro metal forming of Ti foil. In Proceedings of the ASME 2012 International Manufacturing Science and Engineering Conference (MSEC), Note Dame, IN, USA, 4–8 June 2012; pp. 263–268. [Google Scholar]
  18. Fu, M.W.; Yang, B.; Chan, W.L. Experimental and simulation studies of micro blanking and deep drawing compound process using copper sheet. J. Mater. Process. Technol. 2013, 213, 101–110. [Google Scholar] [CrossRef]
  19. Liu, H.X.; Sun, X.Q.; Shen, Z.B.; Li, C.; Sha, C.F.; Li, L.Y.; Gao, S.; Ma, Y.J.; Wang, X. The size effect on deformation behavior in microscale laser shock flexible drawing. Opt. Laser Technol. 2016, 86, 93–102. [Google Scholar] [CrossRef]
  20. He, P.; Yue, X.; Zhang, J.H. Hot pressing diffusion bonding of a titanium alloy to a stainless steel with an aluminum alloy interlayer. Mater. Sci. Eng. A 2008, 486, 171–176. [Google Scholar] [CrossRef]
  21. Lee, J.E.; Bae, D.H.; Chung, W.S.; Kim, K.H.; Lee, J.H.; Cho, Y.R. Effects of annealing on the mechanical and interface properties of stainless steel/aluminum/copper clad-metal sheets. J. Mater. Process. Technol. 2007, 187–188, 546–549. [Google Scholar] [CrossRef]
  22. Dehghani, F.; Salimi, M. Analytical and experimental analysis of the formability of copper-stainless-steel 304L clad metal sheets in deep drawing. Int. J. Adv. Manuf. Technol. 2016, 82, 163–177. [Google Scholar] [CrossRef]
  23. Syn, C.K.; Lesuer, D.R.; Sherby, O.D. Enhancing tensile ductility of a particulate-reinforced aluminum metal matrix composite by lamination with Mg-9%Li alloy. Mater. Sci. Eng. A 1996, 206, 201–207. [Google Scholar] [CrossRef]
  24. Manesh, D.H.; Shahabi, H.S. Effective parameters on bonding strength of roll bonded Al/St/Al multilayer. J. Alloys Compd. 2009, 476, 292–299. [Google Scholar] [CrossRef]
  25. Oya, T.; Tiesler, N.; Kawanishi, S.; Yanagimoto, J.; Koseki, T. Experimental and numerical analysis of multilayered steel sheets upon bending. J. Mater. Process. Technol. 2010, 210, 1926–1933. [Google Scholar] [CrossRef]
  26. Tsukamoto, H. Impact compressive behavior of deep-drawn cups consisting of aluminum/duralumin multi-layered graded structures. Mater. Sci. Eng. B 2015, 198, 25–34. [Google Scholar] [CrossRef]
  27. Sun, T.; Liang, J.; Guo, X.; Ren, M.D.; Wang, L.Z. Optical Measurement of Forming Limit and Formability of Cu/Al Clad Metals. J. Mater. Eng. Perform. 2015, 24, 1426–1433. [Google Scholar] [CrossRef]
  28. Karajibani, E.; Fazli, A.; Hashemi, R. Numerical and experimental study of formability in deep drawing of two-layer metallic sheets. Int. J. Adv. Manuf. Technol. 2015, 80, 113–121. [Google Scholar] [CrossRef]
  29. Li, C.; Chi, C.Z.; Lin, P.; Zhang, H.; Liang, W. Deformation behavior and interface microstructure evolution of Al/Mg/Al multilayer composite sheets during deep drawing. Mater. Des. 2015, 77, 15–24. [Google Scholar] [CrossRef]
  30. Afshin, E.; Kadkhodayan, M. An experimental investigation into the warm deep-drawing process on laminated sheets under various grain sizes. Mater. Des. 2015, 87, 25–35. [Google Scholar] [CrossRef]
  31. Kadkhodayan, M.; Afshin, E. Thinning behavior of laminated sheets metal in warm deep-drawing process under various grain sizes. In Proceedings of the 12th International Conference on Numerical Methods in Industrial Forming Processes, Troyes, France, 4–7 July 2016; Volume 80, p. 15001. [Google Scholar]
  32. Eslami, A.H.; Zebarjad, S.M.; Moshksar, M.M. Study on mechanical and magnetic properties of Cu/Ni multilayer composite fabricated by accumulative roll bonding process. Mater. Sci. Technol. 2013, 29, 1000–1005. [Google Scholar] [CrossRef]
  33. Bae, G.; Xiong, Y.; Kumar, S.; Kang, K.; Lee, C. General aspects of interface bonding in kinetic sprayed coatings. Acta Mater. 2008, 56, 4858–4868. [Google Scholar] [CrossRef]
  34. Urbikain, G.; Perez, J.M.; López de Lacalle, L.N.; Andueza, A. Combination of friction drilling and form tapping processes on dissimilar materials for making nutless joints. Proc. Mech. Eng. Part B J. Eng. Manuf. 2016, 230, 1–14. [Google Scholar] [CrossRef]
  35. Zhou, M.; Zhang, Y.K.; Cai, L. Laser shock forming on coated metal sheets characterized by ultrahigh-strain-rate plastic deformation. J. Appl. Phys. 2002, 91, 5501–5503. [Google Scholar] [CrossRef]
  36. Tabernero, I.; Lamikiz, A.; Martínez, S.; Ukar, E.; López de Lacalle, L.N. Modelling of energy attenuation due to powder flow-laser beam interaction during laser cladding process. J. Mater. Process. Technol. 2012, 212, 516–522. [Google Scholar] [CrossRef]
  37. Fabbro, R.; Fournier, J.; Ballard, P.; Devaux, D.; Virmont, J. Physical study of laser-produced plasma in confined geometry. J. Appl. Phys. 1990, 68, 775–784. [Google Scholar] [CrossRef]
  38. Wang, X.; Du, D.Z.; Zhang, H.; Shen, Z.B.; Liu, H.; Zhou, J.Z.; Liu, H.X.; Hu, Y.; Gu, C.X. Investigation of microscale laser dynamic flexible forming process—Simulation and experiments. Int. J. Mach. Tools Manuf. 2013, 67, 8–17. [Google Scholar] [CrossRef]
  39. Bagherzadeh, S.; Mirnia, M.J.; Dariani, M.B. Numerical and experimental investigations of hydro-mechanical deep drawing process of laminated aluminum/steel sheets. J. Manuf. Process. 2015, 18, 131–140. [Google Scholar] [CrossRef]
  40. Atrian, A.; Fereshteh-Saniee, F. Deep drawing process of steel/brass laminated sheets. Composites Part B 2013, 47, 75–81. [Google Scholar] [CrossRef]
  41. Morovvati, M.R.; Mollaei-Dariani, B.; Asadian-Ardakani, M.H. A theoretical, numerical, and experimental investigation of plastic wrinkling of circular two-layer sheet metal in the deep drawing. J. Mater. Process. Technol. 2010, 210, 1738–1747. [Google Scholar] [CrossRef]
  42. Yilamu, K.; Hino, R.; Hamasaki, H.; Yoshida, F. Air bending and springback of stainless steel clad aluminum sheet. J. Mater. Process. Technol. 2010, 210, 272–278. [Google Scholar] [CrossRef]
  43. Mori, T.; Kurimoto, S. Press-formability of stainless steel and aluminum clad sheet. J. Mater. Process. Technol. 1996, 56, 242–253. [Google Scholar] [CrossRef]
  44. Liu, H.X.; Hu, Y.; Wang, X.; Shen, Z.B.; Li, P.; Gu, C.X.; Liu, H.; Du, D.Z.; Guo, C. Grain refinement progress of pure titanium during laser shock forming (LSF) and mechanical property characterizations with nanoindentation. Mater. Sci. Eng. A 2013, 564, 13–21. [Google Scholar] [CrossRef]
Figure 1. The cross section of the Cu/Ni composite sheets under an optical microscope.
Metals 07 00275 g001
Figure 2. Experiment appliance of microscale laser flexible forming.
Metals 07 00275 g002
Figure 3. The profile and forming depth of a formed component through mold 2.
Metals 07 00275 g003
Figure 4. (a) The feature size effect on forming depth; (b) the feature size effect on difference degree of forming depth between two different layer stacking sequences.
Metals 07 00275 g004
Figure 5. The forming depth of formed components of monolithic Cu and monolithic Ni.
Metals 07 00275 g005
Figure 6. Measurement locations of thickness: (a) mold 1; (b) mold 2; (c) mold 3; (d) mold 4; (e) mold 5.
Metals 07 00275 g006
Figure 7. (a) Measurement method for thickness; Thickness thinning ratio of each layer: (b) mold 1; (c) mold 2; (d) mold 3; (e) mold 4; (f) mold 5.
Metals 07 00275 g007
Figure 8. Thickness thinning ratio of entire sheet: (a) mold 1; (b) mold 2; (c) mold 3; (d) mold 4; (e) mold 5.
Metals 07 00275 g008
Figure 9. Feature size effect on normalized forming depth (laser energy was 1800 mJ).
Metals 07 00275 g009
Figure 10. Surface morphology of nickel layer: (a) initial portion; (b) bottom portion formed through mold 1; (c) bottom portion formed through mold 3; (d) bottom portion formed through mold 5.
Metals 07 00275 g010
Figure 11. Surface morphology of copper layer: (a) initial portion; (b) bottom portion formed through mold 1; (c) bottom portion formed through mold 3; (d) bottom portion formed through mold 5.
Metals 07 00275 g011
Figure 12. (a) The feature size effect on surface roughness; (b) The feature size effect on difference degree of surface roughness between two different layer stacking sequences.
Metals 07 00275 g012
Figure 13. Feature size effect on normalized forming depth (laser energy was 835 mJ).
Metals 07 00275 g013
Figure 14. Measurement locations of micro-hardness.
Metals 07 00275 g014
Figure 15. Micro-hardness distribution of different feature size: (a) mold 1; (b) mold 3; (c) mold 5.
Metals 07 00275 g015
Figure 16. Variation trend of micro-hardness with different feature size: (a) mold 1; (b) mold 3; (c) mold 5.
Metals 07 00275 g016
Table 1. The mechanical properties of copper and nickel [33].
MaterialYield Strength (MPa)Young’s Modulus (GPa)Poison’s RatioStrain Hardening Exponent
Copper90.01240.340.310
Nickel163.02070.310.330
Table 2. Parameters of the utilized laser.
ParametersWave LengthPulse WidthSingle Pulse EnergySpot DiameterEnergy Stability
Value1064 nm8 ns80–1800 mJ3 mm<±1%
Table 3. Feature sizes of five micro molds.
Mold 1Mold 2Mold 3Mold 4Mold 5
Diameter (mm)0.81.21.62.02.4
Fillet radius (mm)0.100.150.200.250.30

