Abstract
Rare earth rich magnesium alloys are used in aerospace and automotive fields because of their high specific strength and good castability. However, due to their low corrosion resistance, protective surface treatments, such as conversion coating or electroless plating are necessary, when they have to be used in humid or corrosive environments. The present study was aimed at evaluating the effect of plasma electrolytic oxidation (PEO) and different surface roughness (Ra ≈ 0.8 μm and Ra ≈ 0.3 μm) on the rotating bending fatigue of an innovative Mg alloy, with a high content of Nd (up to 3.1 wt %) and Gd (up to 1.7 wt %). Fatigue tests revealed a 15% decrease in the fatigue strength of the PEO-treated alloy (fatigue strength = 88 MPa) with respect to the bare alloy (fatigue strength = 103 MPa). The reduction of fatigue strength was mainly due to the residual tensile stresses induced by the PEO treatment. The effect of surface roughness on the bare alloy was, instead, negligible. The mechanisms of crack initiation were similar in the untreated and PEO-treated alloy, with crack nucleation sites located in correspondence to large facets of the cleavage planes.
1. Introduction
Due to their low density, high specific strength, good vibrational absorption and good castability [1,2,3,4], Mg alloys are increasingly used in aerospace and automotive fields. Structural components for the transport industry, such as camshaft covers, clutch and transmission housings, intake manifolds, engine blocks, steering components, radiator supports, and automobile wheels, are inevitably subjected to cyclic stresses in service. For this reason, investigation of the fatigue behaviour of both cast and wrought Mg alloys has recently drawn considerable interest [5,6,7,8,9]. Recent studies [7,9,10] have demonstrated that the addition of rare earth (RE) elements, such as Nd, Gd, Y, can remarkably enhance both the tensile and fatigue strength of Mg alloys. In the case of castings, this improvement was related both to the microstructural refinement and to the decreased size and amount of porosity and inclusions induced by RE elements [7,11,12], while in wrought Mg alloys it seems mainly due to the corresponding weakness of crystallographic textures and the reduction of twinning [13,14,15,16]. It was also found that the addition of RE and the reduction of impurities can effectively improve the corrosion resistance of Mg alloys [17,18,19,20].
However, when components have to be used in humid or corrosive environments and/or improved wear resistance is needed, Mg–RE alloys can also be inadequate, and protective surface treatments, such as conversion coating or electroplating/electroless plating, are necessary [21,22,23].
Among the conversion coating processes, plasma electrolytic oxidation (PEO) is gaining increasing attention, since it is able to produce relatively thick, dense and protective surface oxide layers, with enhanced wear and corrosion resistance [24,25,26]. Moreover, the lower residual surface stresses and amount of microstructural defects in the conversion layer, with respect to traditional oxide coating, seem to reduce its adverse effect on the fatigue properties of Mg alloys.
To date, however, little data on the fatigue behaviour of RE-containing cast Mg alloys are available [6,12,27,28,29], and the effect of anodisation or PEO has mainly been investigated in traditional wrought Mg-alloys without RE addition [21,22,23,30].
Based on the above, the present study was aimed at evaluating the rotating bending fatigue behaviour of an innovative casting Mg alloy, with a high content of Nd (up to 3.1 wt %) and Gd (up to 1.7 wt %). The excellent fluidity of this alloy, thanks to the high amount of Nd, enables the production of sand cast components, with very low defect content and an average grain size comparable to that of wrought alloys. The effect of different surface roughness on the untreated alloy, as well as surface modification by Plasma Electrolytic Oxidation (PEO), was evaluated.
2. Materials and Methods
The RE-rich magnesium alloy used in the present study was provided by Magnesium Elektron® (Manchester, UK) and its chemical composition is reported in Table 1.

Table 1.
Chemical composition (wt %) of Elektron 21® (EV31A) magnesium alloy (Magnesium Elektron® test report).
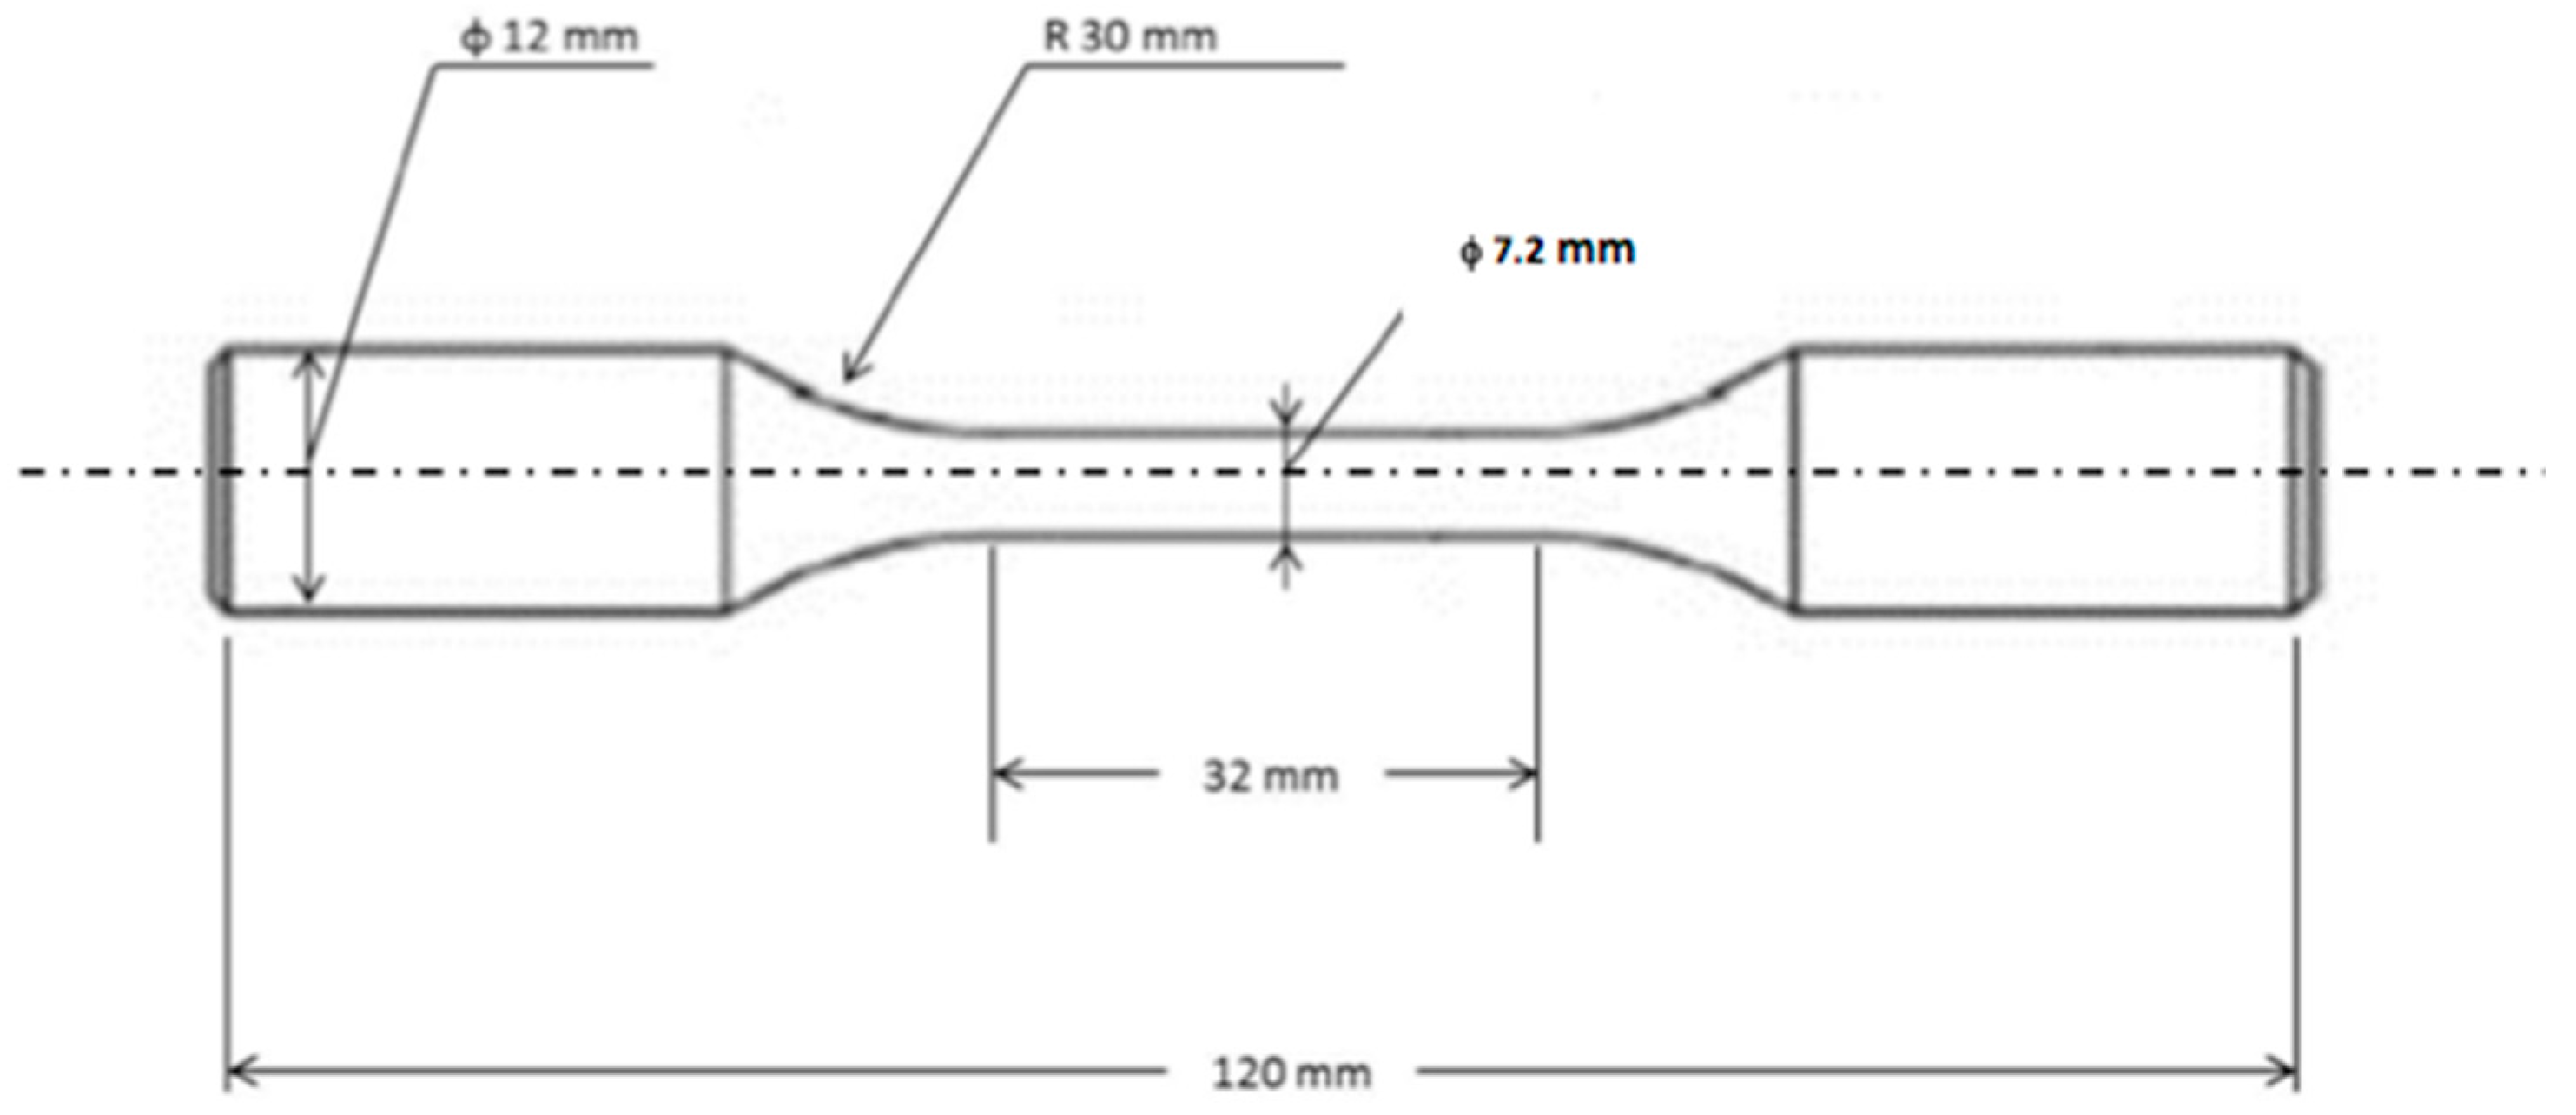
Fatigue test samples were machined from sand castings to the final geometry reported in Figure 1 according to ISO-1143 [31] and then were T6 heat-treated according to standard conditions (solutionising at 520 °C for 8 h; quenching in water at 70 °C; and aging at 200 °C for 16 h). These treatment conditions were defined on the basis of the results of previous work, carried out by the authors, focused on the influence of heat treatment on the microstructure and tensile strength of this alloy.
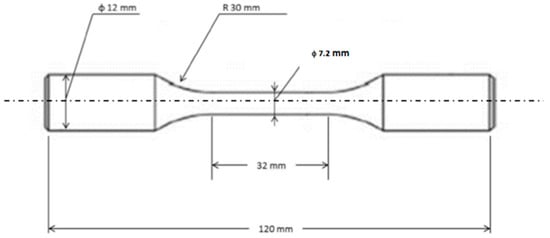
Figure 1.
Geometry of rotating bending fatigue specimens.
Subsequently, they were finished with emery papers in order to achieve two different surface roughness values, Ra ≈ 0.6–0.8 μm (samples abbreviation S0.8) and Ra ≈ 0.2–0.3 μm (samples abbreviation S0.3). A set of T6 heat-treated specimens was surface treated by Plasma Electrolytic Oxidation (PEO) at AHC® (Kerpen, Germany), using a proprietary production process (MAGOXID-COAT®). After PEO, they were sandblasted to a final surface roughness Ra between 1.9 and 2.1 μm (sample abbreviation SP). Surface roughness was checked by a stylus profilometer (tip radius: 5 µm). Fatigue tests were carried out on samples with two different Ra values that represent the typical surface finishing applied to magnesium components for high performance applications. The PEO treatment, instead, is often applied to components that need high mechanical properties combined with good corrosion resistance and less strict dimensional and roughness requirements. These components, for example bike frames, are typically sandblasted and not machined after PEO.
The microstructure of the base and PEO-treated alloy, both in surface and cross-section, was analysed by optical microscopy (OM) and Scanning Electron Microscopy (SEM) (Zeiss EVO®, Oberkochen, Germany) equipped with an energy dispersive spectroscopy (EDS) (Oxford INCA 350, Oxfordshire, UK) microprobe.
Microstructural characterisation was carried out on samples prepared by standard metallographic techniques (grinding with SiC emery papers and polishing with diamond paste) and chemically etched with 2% Nital (HNO3 2% vol. with ethanol). Image analyses on the optical micrographs (OM) were carried out using the ®Image Pro-Plus software (4.5, Media Cybernetics, Inc., Rockville, MD, USA, 2009) and grain size was evaluated using the linear intercept method, according to ASTM E112-10 [32].
The adhesion/cohesion of the PEO layer was evaluated by the scratch test method, using a Revetest system (CSM Instruments SA, Peseux, Switzerland) equipped with a diamond indenter (200 μm diameter). The scratch indentations were carried out using a linear progressive load mode, from 1 to 20 N, with a linear speed rate of 10 mm/min and for a scratch length of 6 mm. The testing conditions were set based on experimental trials.
Rotating bending fatigue tests were carried out both on the untreated specimens with different surface roughness (S0.3 and S0.8 series), and on the PEO-treated ones (SP series), according to UNI 3964 [33] using the staircase method, at a frequency of 90 Hz and at a stress ratio R = −1. The maximum number of cycles was set to 2 × 10⁶ cycles. To relate the different surface conditions to the fatigue behaviour, SEM analyses of the fracture surfaces were carried out.
3. Results and Discussion
3.1. Microstructure of the Untreated Alloy
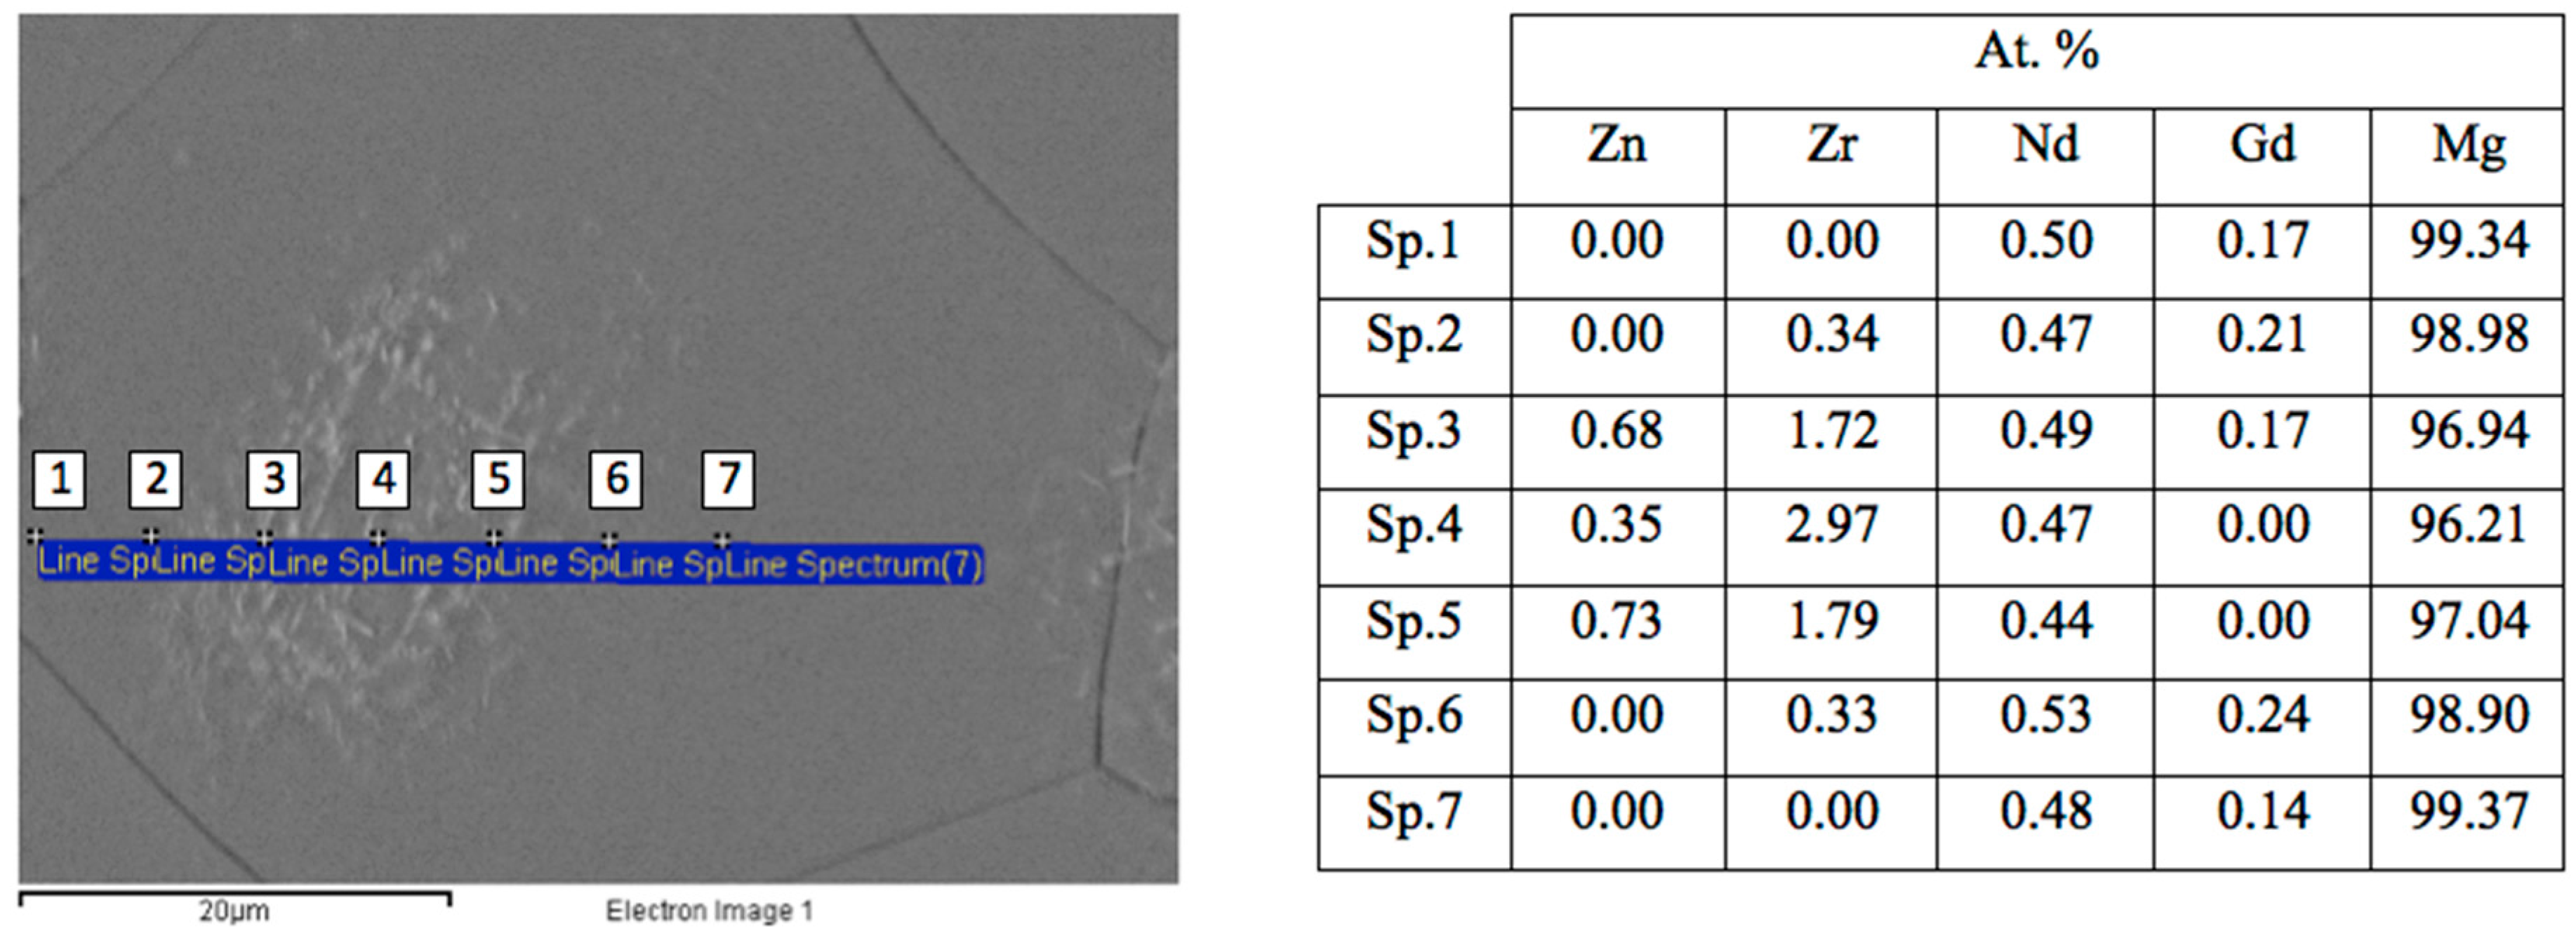
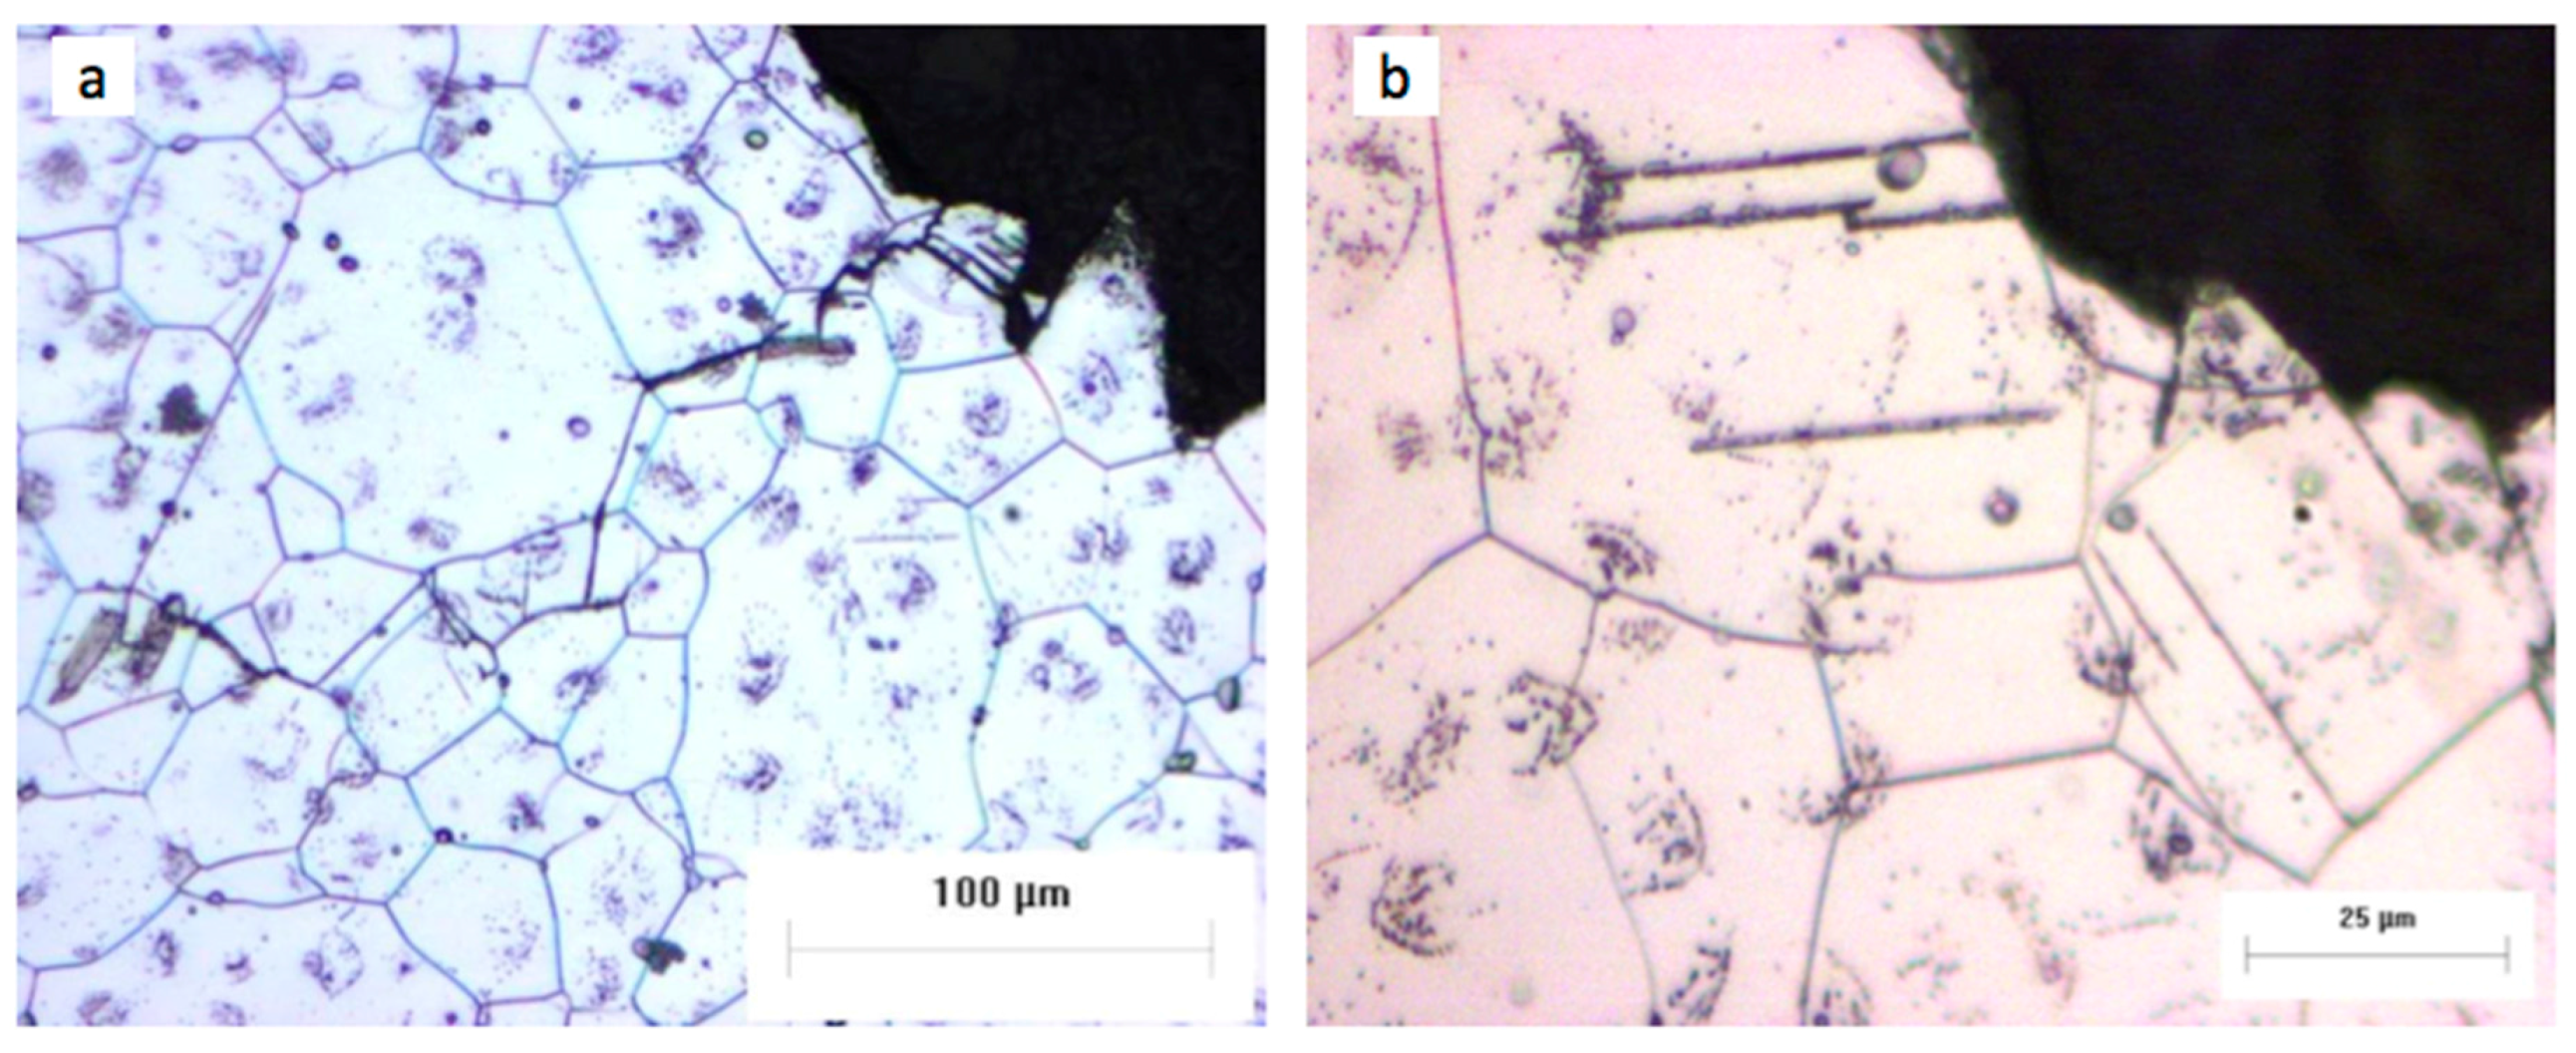
OM and SEM images of the EV31A-T6 alloy are reported in Figure 2. The microstructure is composed of equiaxed grains, with an average size of 45 ± 2 μm (Figure 2a). The T6 heat treatment did not completely dissolve the ternary eutectic compound Mg12NdxGd(1−x) located at the grain boundaries, as highlighted in Figure 2b and SEM-EDS of Figure 2c. Moreover, clusters of nanometric and micrometric Zr-Zn precipitates are clearly visible only at the grain centre, as shown by SEM-EDS analysis reported in Figure 3 (spectra 3, 4 and 5). A more detailed microstructural investigation on the strengthening precipitates, formed by the aging treatment, has previously been reported by the authors [34].
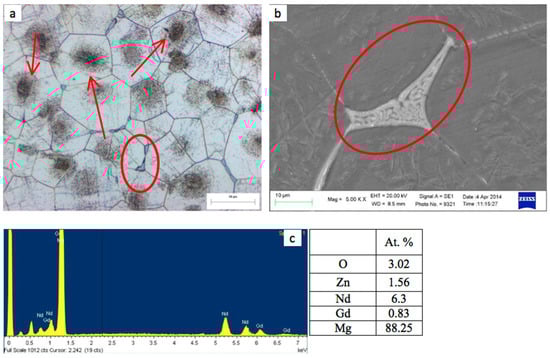
Figure 2.
Optical microscopy (OM) image of EV31A etched with 2% Nital: (a) Zr-Zn cluster and eutectic compounds highlighted respectively by red arrows and red circles and (b) SEM image of the eutectic compound at the grain boundaries with (c) corresponding energy dispersive spectroscopy (EDS) analysis.
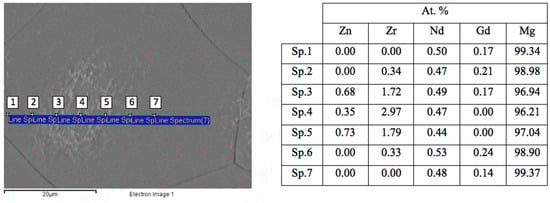
Figure 3.
Scanning electron microscopy (SEM) image and EDS analyses in different points inside a grain. Zr-Zn intermetallic precipitates are located at the grain core, as shown by EDS results in spots 3, 4 and 5.
No solidification defects, such as gas and shrinkage porosities or oxides, which can adversely affect the fatigue behaviour of the alloy were observed. This can be related both to the increased castability of the EV31A alloy, induced by the presence of RE, and to the optimised sand casting process used for samples production [35,36].
3.2. Microstructure of the PEO-Treated Alloy
The PEO process was carried out by AHC® (MAGOXID-COAT®) in a saline electrolyte solution. During the process, a high voltage between the anode and the sample was generated, inducing micro-discharges on the specimen surface and converting the alloy surface into a hard oxide layer (the chemical composition of the bath and the parameters of the process are proprietary and cannot be disclosed). PEO layers on Mg alloys can usually be divided into two or three regions, according to the operative treatment conditions: (i) a thin barrier layer (generally hundreds of nanometres) at the interface with the base material; (ii) a compact intermediate inner layer, with a small number of porosities and cavities; (iii) an outer region with a high number of pores and crater density [37,38,39].
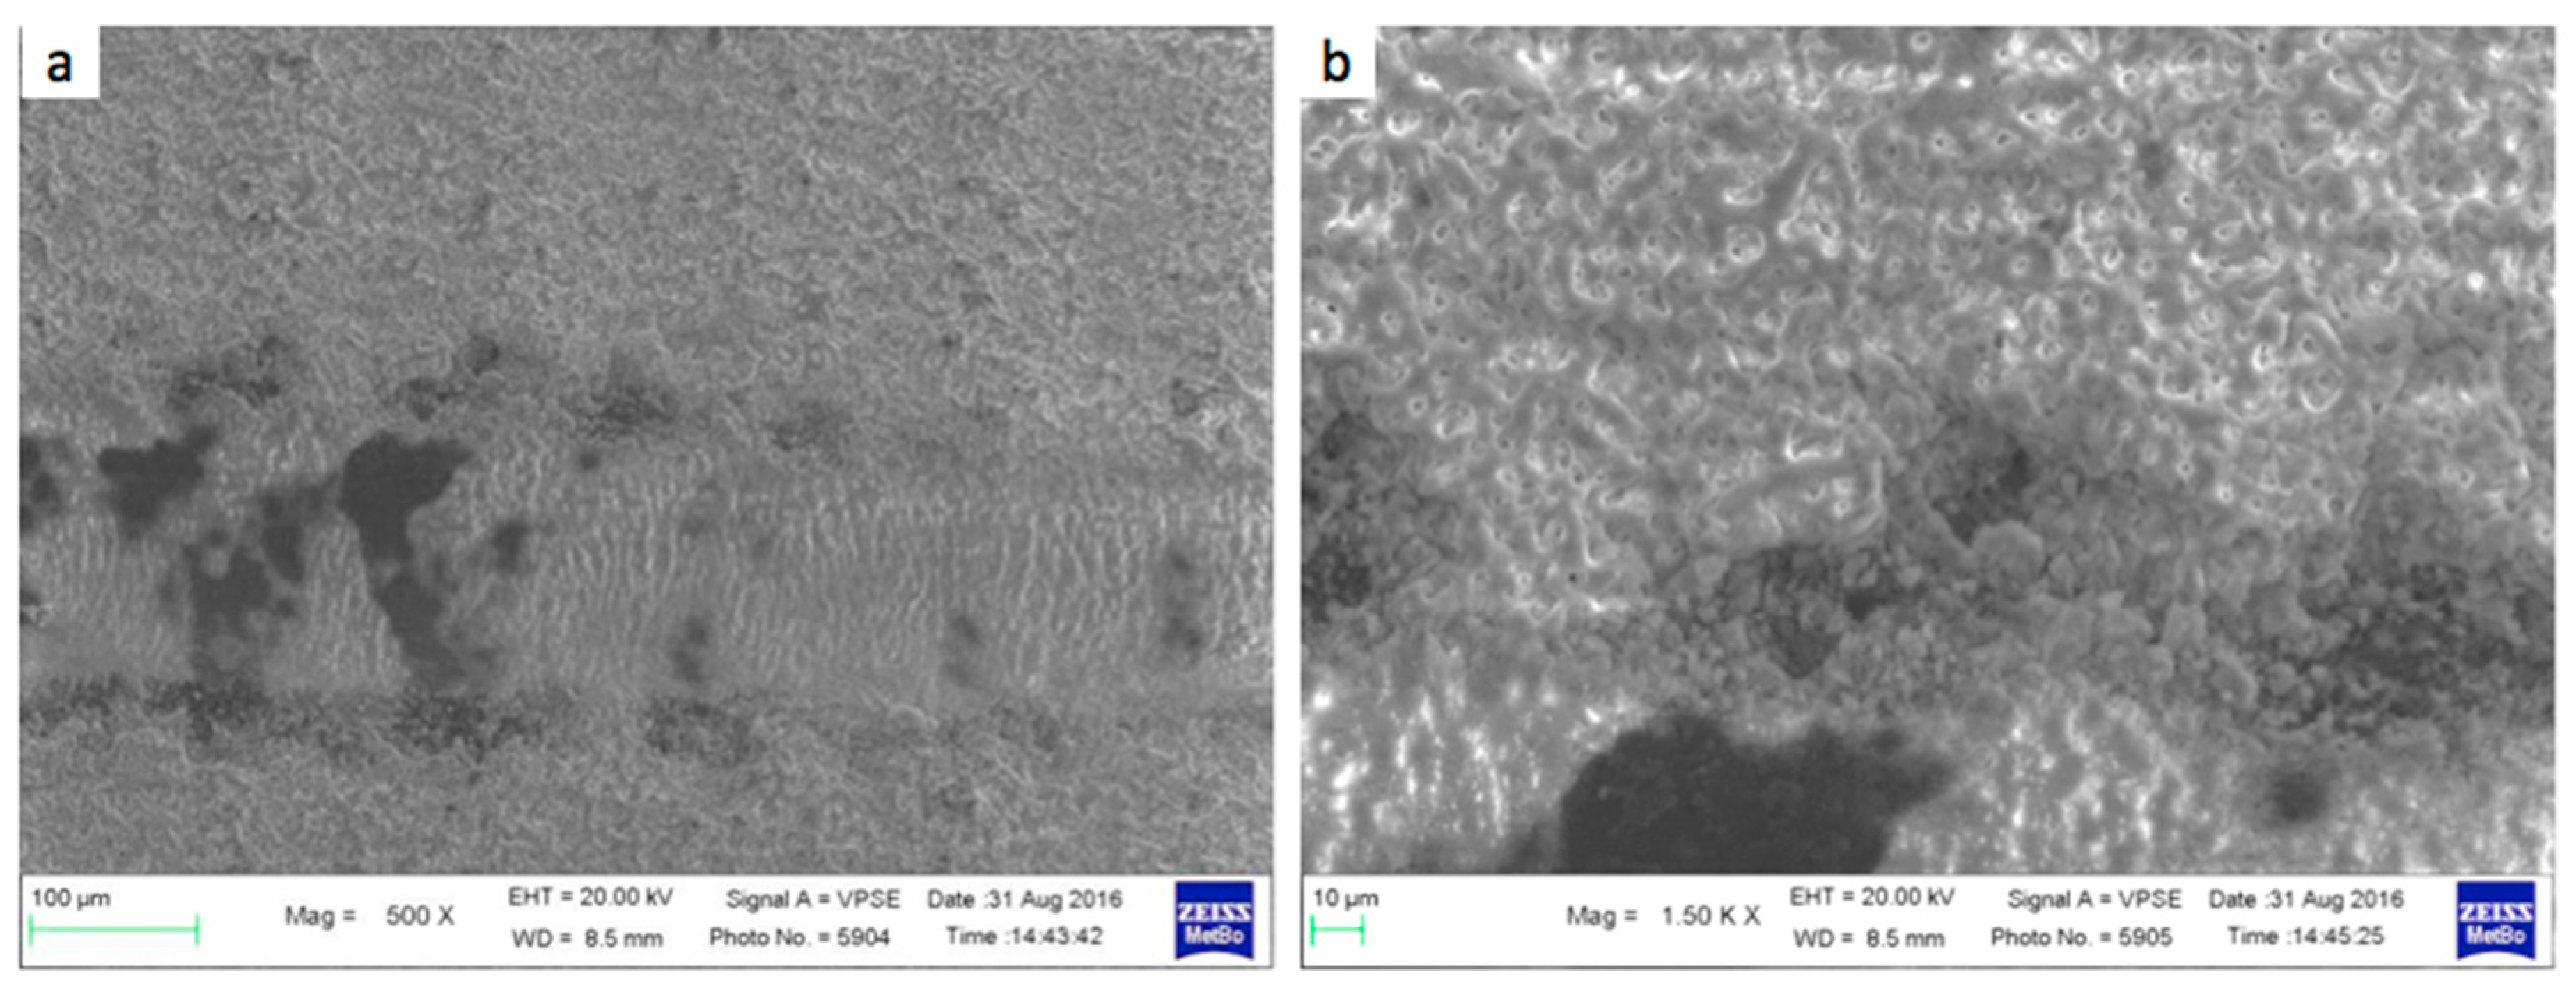
SEM images on the outer surface of the PEO-treated and sandblasted fatigue samples are shown in Figure 4. The sandblast process led to a relatively smooth surface, with a significant reduction of the typical cracks and microcracks present on the outer surface of the PEO layer. However, some of the small cracks through the pores are still present, as shown at higher magnification in Figure 4b.
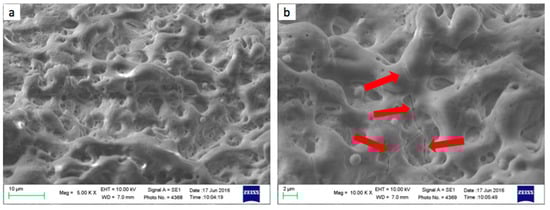
Figure 4.
SEM images at different magnification of the surface of plasma electrolytic oxidation treated (PEO-treated) and sandblasted fatigue specimens: (a) smooth surface with (b) very few small cracks through the pores.
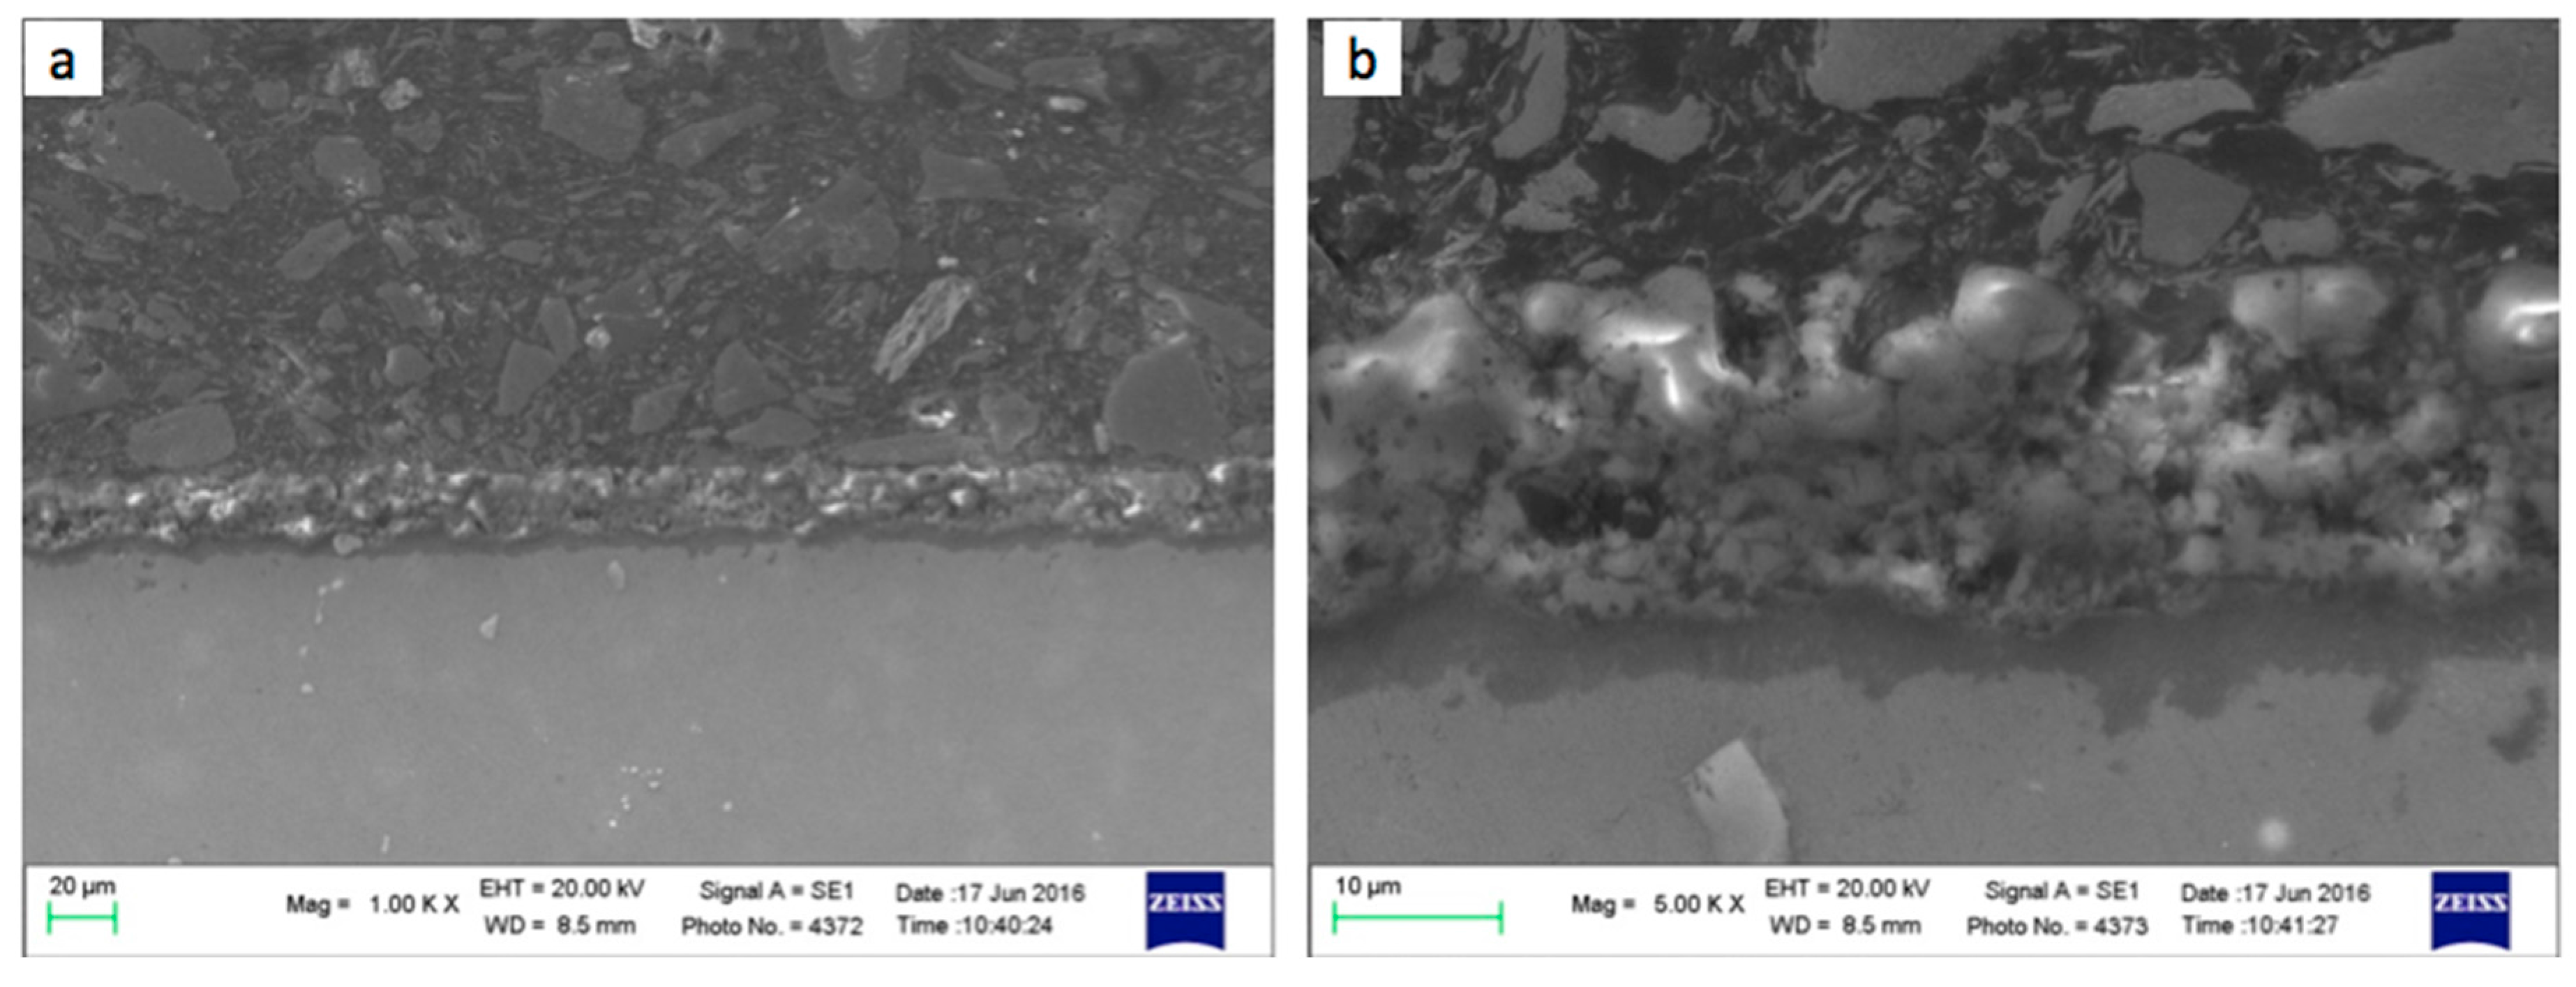
Representative SEM micrographs of the cross-section of the PEO-treated alloy are reported in Figure 5a,b. The conversion layer was about 23 ± 3 μm in thickness and appears uniform and compact, with low density of pores and cracks, thus confirming that the sandblasting process was effective in removing the outer region of the PEO layer.
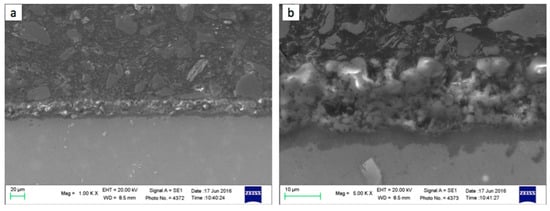
Figure 5.
SEM images of a plasma electrolytic oxidation (PEO) layer cross-section: (a) low and (b) high magnification.
SEM–EDS element maps on the cross-section, shown in Figure 6, revealed a homogenous distribution of phosphorous, potassium and oxygen due to the phosphate, silicate and potassium fluoride present in the electrolytic bath. A thin fluorine-rich layer at the interface between the PEO layer and substrate can also be detected. According to the authors of [37], this layer consists of MgF2 and plays an important role during the PEO process, reducing electrolyte conductivity, thus decreasing the working voltage. Moreover, fluoride addition helps to obtain a more compact layer, reducing porosity and correspondingly improving mechanical performance, tribological behaviour and corrosion resistance [40].
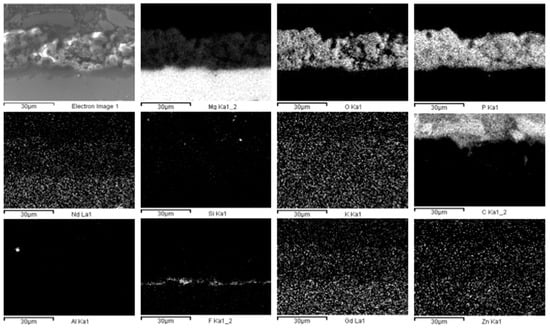
Figure 6.
SEM–EDS cross section maps of the PEO layer.
3.3. Adhesion of the Coating
PEO treatment on Mg alloys could be classified as a hard coating on a softer substrate material [41]. Scratch testing is a commonly used method to evaluate the adhesion of thin hard coatings. Failure depends on both substrate and coating properties, namely hardness and microstructural characteristics. A representative image of a scratch test performed on the PEO-treated EV31A alloy is shown in Figure 7a at a relatively low magnification, whereas more detailed images of the failure induced by the scratches are reported in Figure 7b.
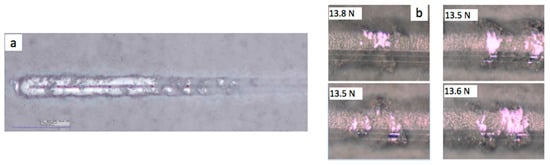
Figure 7.
(a) OM scratch test image; (b) OM images of the failure area for different scratch tests with corresponding failure load.
Reproducible results, in terms of failure mode and critical load, were obtained. SEM images at different magnifications of a representative scratch are shown in Figure 8a,b, with corresponding EDS X-ray maps in Figure 9. Buckling and spallation failure are both present in Figure 8a,b, where coating detachment from the substrate can clearly be seen.
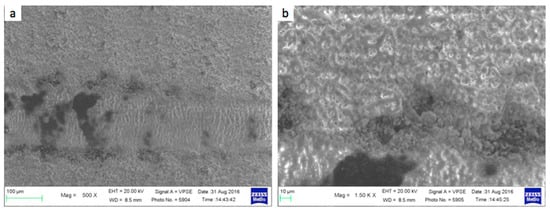
Figure 8.
SEM images of the scratch test track at different magnifications.
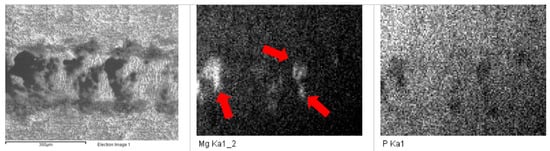
Figure 9.
Representative SEM-EDS maps of the scratch tests, with the substrate highlighted by red arrows.
The EDS maps confirmed adhesion failure of the PEO coating, since the Mg substrate was detected at the bottom of the scratch, as shown in Figure 9. Buckling failure occurs in response to the compressive stresses generated ahead of the moving indenter and typically occurs for a coating thickness less than 10 µm. Spallation occurs due to compressive shear stresses ahead of the indenter through the coating, resulting in crack nucleation that could propagate through the thickness. The continued forward motion of the indenter leads to an interfacial crack and consequent coating failure [41]. Additionally, in this case, where the PEO layer is about 20 µm and the EV31A substrate is relatively soft, buckling and spallation are the main failure modes.
3.4. Fatigue Tests
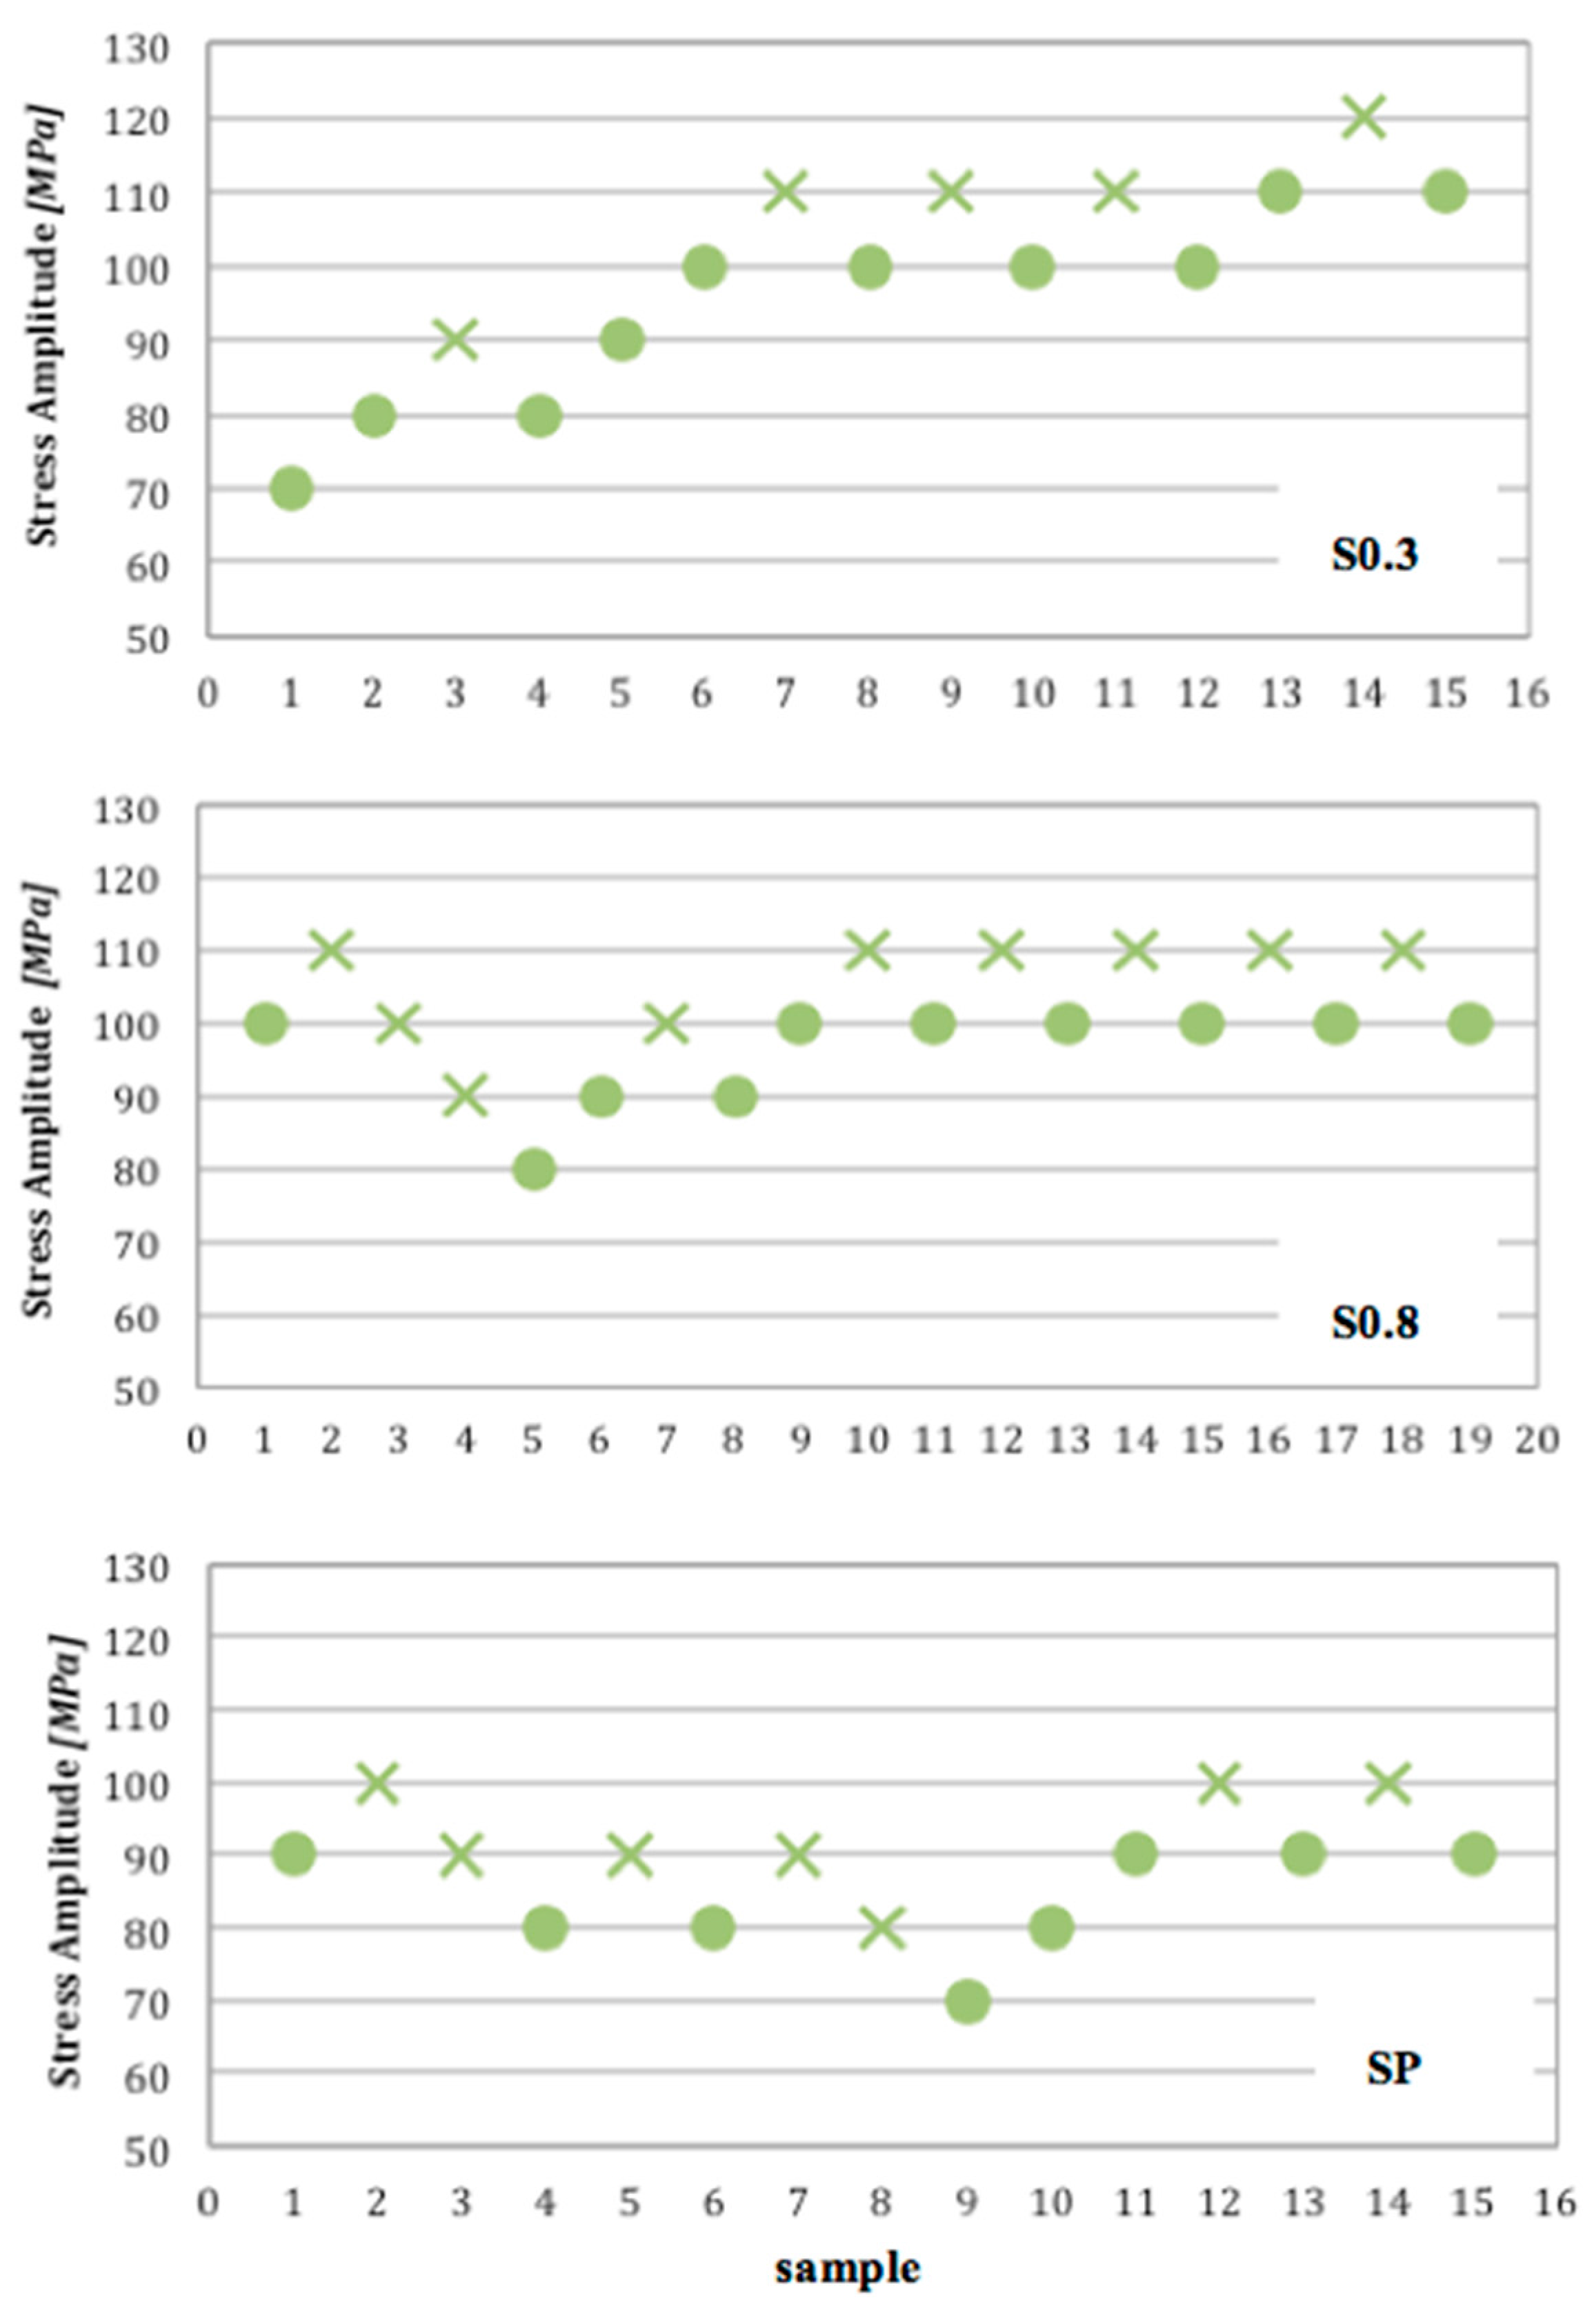
The results of the rotating bending fatigue tests carried out on the untreated sand cast EV31A Mg alloy with different surface roughness (S0.3 and S0.8 samples), and on the PEO-treated alloy are reported in Figure 10 and Table 2. It can be noted that the effect of surface roughness on the base alloy was negligible, since the difference in the mean fatigue strength values for the S0.8 and S0.3 samples was within 2% (103 and 101 MPa, respectively) and, as shown by the stair-case results in Figure 10, the minimum stress level at which no failure occurred was 80 MPa.
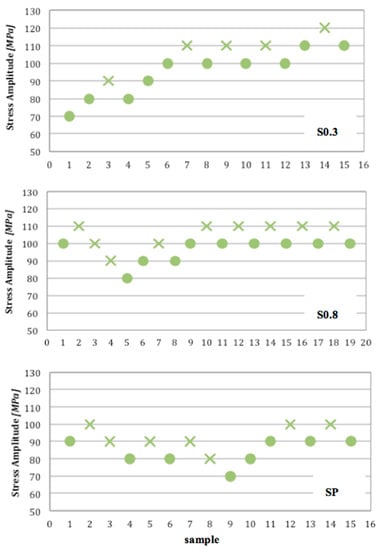
Figure 10.
Stair case data for: S0.3, S0.8 and SP series (X Failures, O Survivals). Tests were carried out according to UNI 3964 [34].
Table 2.
Results of the rotating bending fatigue tests carried out according to UNI 3964 [34].
The investigated alloy displayed a fatigue behaviour comparable or even better than that of other rare earth rich sand cast magnesium alloys; in fact, a fatigue strength of 98 MPa was measured on the AM-SC1 alloy (Mg-1.7 wt %, Nd-1.0 wt %, other RE-0.5 wt %, Zn-0.5 wt % Zr) [42], while the NZ30K2 alloy (Mg-2.8 wt %, Nd-0.19 wt %, Zn-0.50 wt %, Zr) [12] showed a fatigue strength of 84 MPa (15% lower compared to that measured on the present alloy). It is also worth noting that the fatigue strength of the EV31A alloy used in the present study is also comparable with that of the most common wrought magnesium alloy AZ31 [43]. Fatigue data for several wrought and cast magnesium alloys are reported in Table 3.
Table 3.
Fatigue strength of cast and wrought magnesium alloys (literature data).
The excellent fatigue response shown by the investigated alloy in respect to the traditional cast magnesium alloys (see Table 3) can be mainly ascribed to the reduction of solidification defects (size and amounts of porosity and inclusions), and microstructural refinement induced by RE elements [7,11,12]. Moreover, it can be also related to a careful control of the sand casting process. In fact, no solidification defects were detected close to the free surface of the samples, which experienced the maximum stresses, or in the bulk.
Plasma electrolytic oxidation only induced a slightly negative effect on the fatigue performance of the EV31A Mg alloy. In fact, the SP samples showed a mean fatigue strength of 88 MPa, which is about 15% lower by comparison to that of S0.3 and S0.8 (103 and 101 MPa, respectively). Moreover, in SP samples, the minimum stress level at which no failure occurred was equal to 70 MPa, instead of 80 MPa for S0.3 and S0.8 samples (Figure 10). However, by taking into account the standard deviation, the fatigue strength of bar and PEO-treated alloy appeared to be comparable.
The reduction in fatigue strength of SP samples appears to be mainly related to the intrinsic defectiveness of the ceramic conversion layer and its residual tensile stresses [41], rather than to its higher roughness. The micro-discharges, in fact, cause local melting of the surface, inducing pores and microcracks, as well as tensile stresses, during the subsequent rapid solidification [24]. Similar results were also found by Yerokhin et al. [21], who reported a fatigue strength reduction in the range of 3–10% on PEO-treated magnesium alloy rods (Mg-Al2-Zn1-Mn0.2) with respect to the bare material, while A. Nemcova et al. [23] showed a 40–50% reduction in fatigue strength of PEO-treated wrought AZ61 Mg alloys with respect to the untreated alloy.
3.5. Fracture Surfaces Analysis
It is well known that in high cycle fatigue, the crack initiation period may take up to 90% of the total fatigue life of the material, thus particular attention has been given to the crack initiation mechanisms, both in the untreated and PEO-treated alloy.
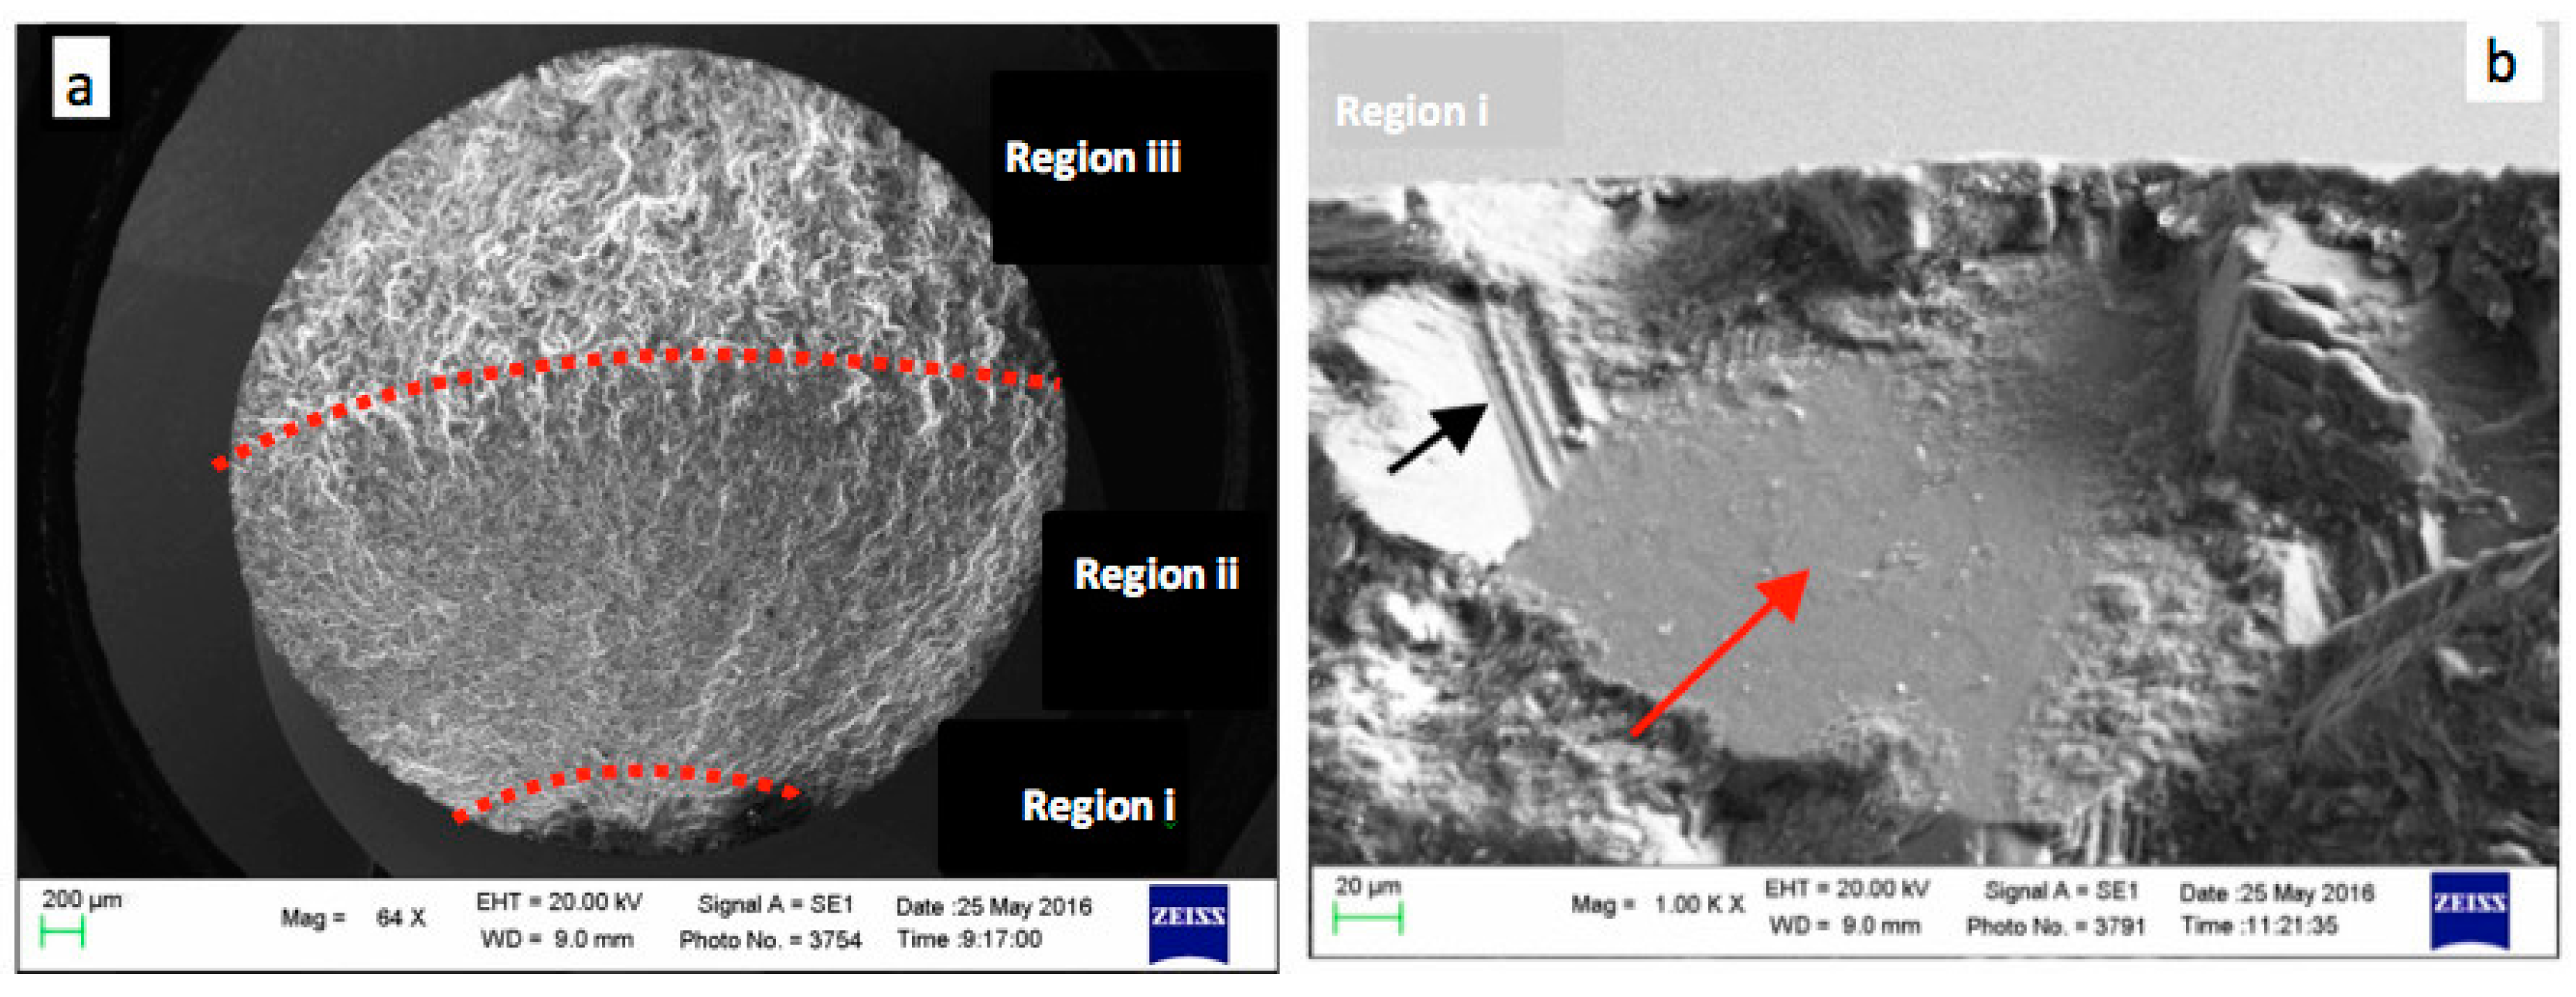
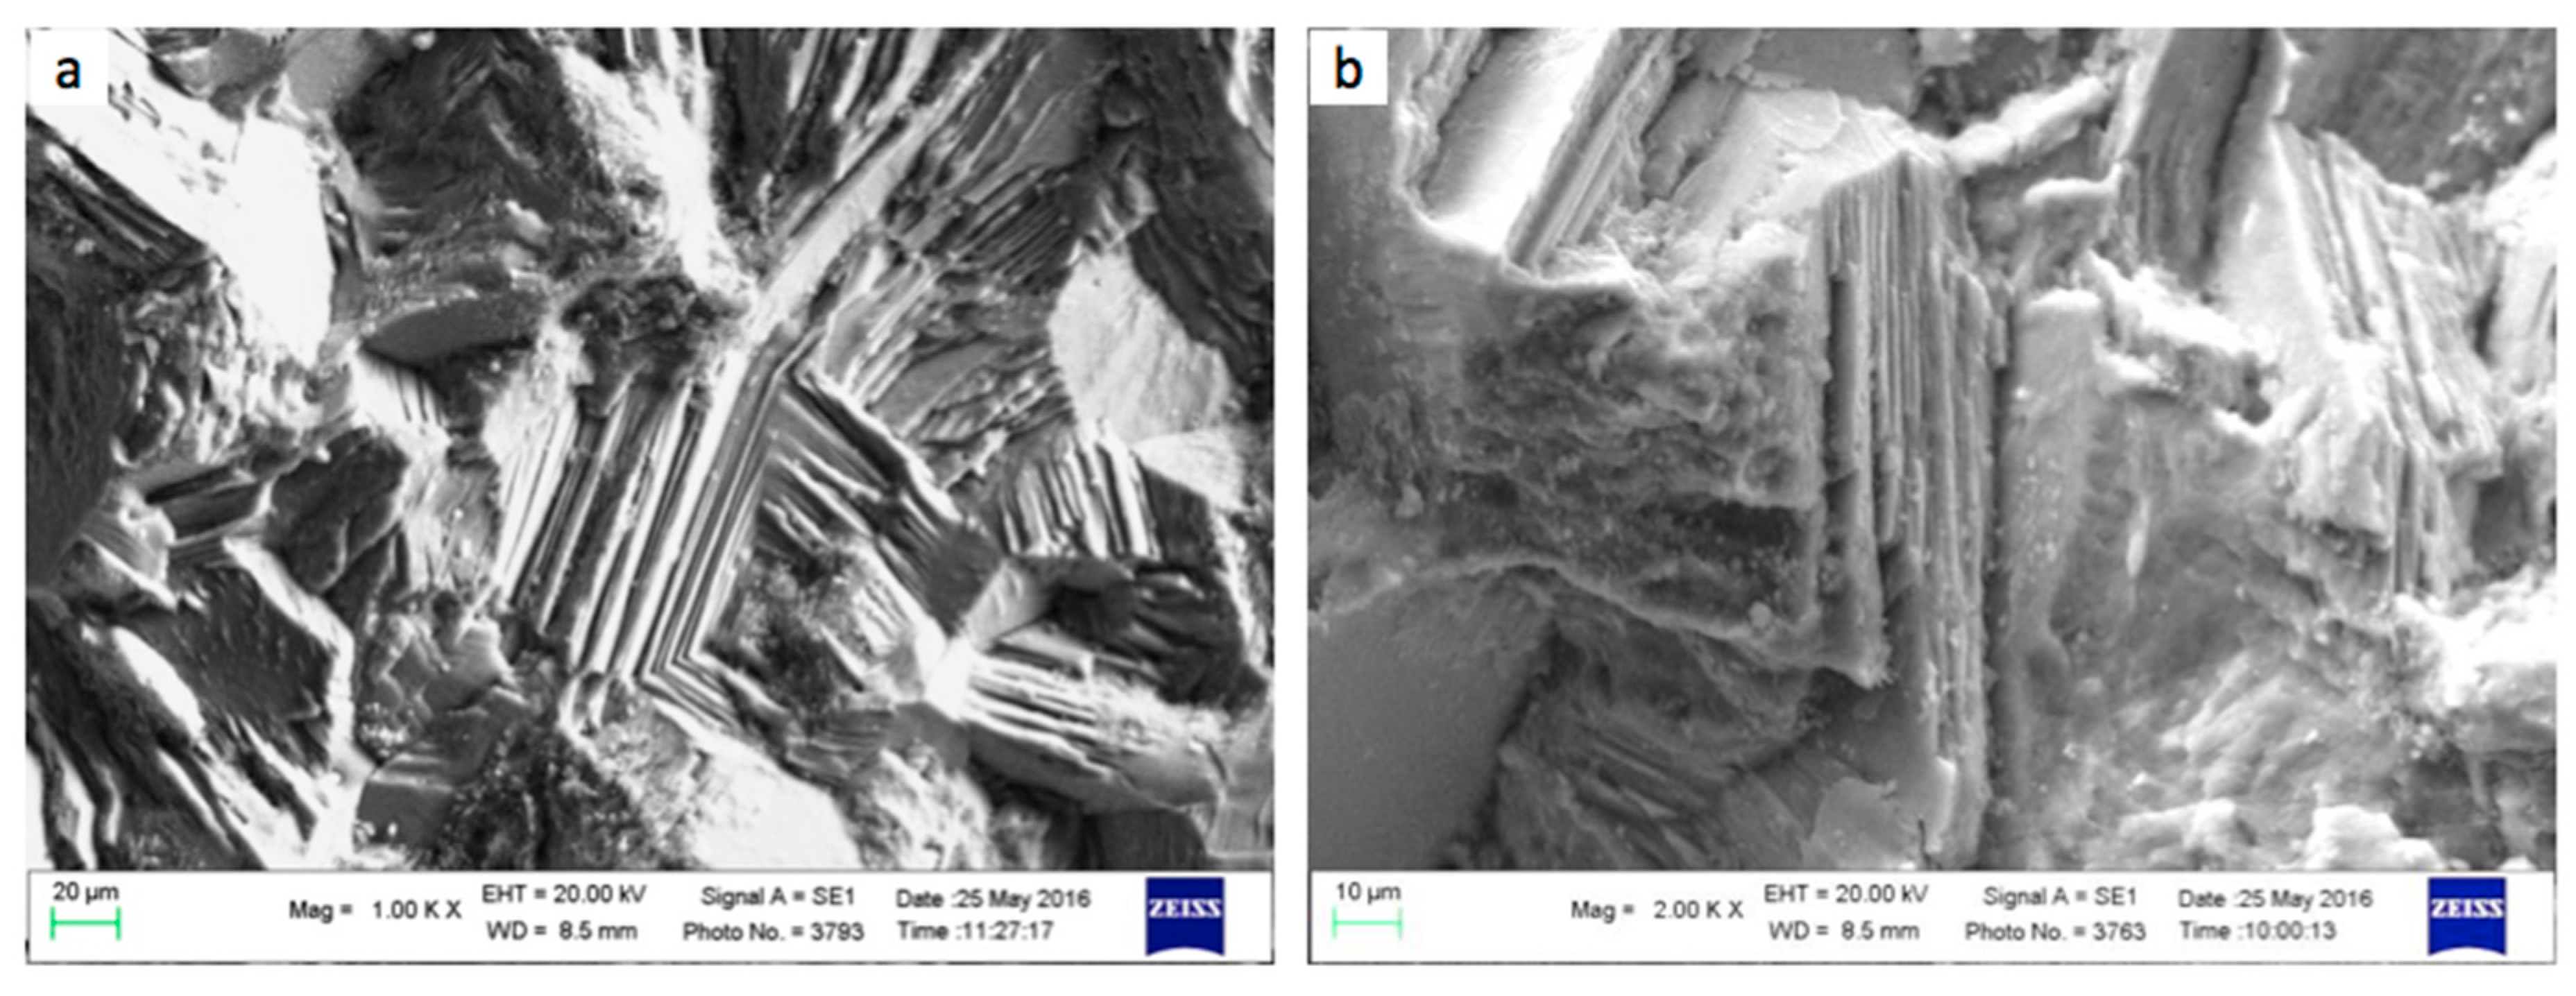
A representative SEM micrograph, at a relatively low magnification of the fracture surface of the untreated alloy is reported in Figure 11a. The three typical regions of fatigue failure can be clearly identified: (i) crack initiation; (ii) crack growth; (iii) final failure due to overloading.

Figure 11.
Representative SEM images of an untreated sample tested at 110 MPa. (a) Typical regions of fatigue failure at low magnification: initiation (i), propagation (ii) and final failure (iii); (b) high magnification of crack initiation at isolated facets of cleavage planes (red arrow), surrounded by fatigue striations (black arrow).
In rotating bending fatigue tests, the surface experiences the maximum stresses, thus the cracks mainly nucleate from it. The SEM image in Figure 11b shows, at a higher magnification, the crack initiation region in the untreated alloy, where it can be clearly seen that crack nucleation occurs at the isolated facets of cleavage planes, near the free surface of the specimen. The facets are flat and smooth, resulting from cleavage induced by the limited number of operative slip systems characteristic of HCP Mg alloys, and appear surrounded by fatigue striations. Similar crack nucleation features were observed on other magnesium alloys by Z. Li et al. [27].
The facet cleavage is due to the development of slip bands during the cyclic loading, acting as stress concentration sites; thus, once the damage takes place, the crack could quickly propagate. Cleavage was observed in a large grain with a size of about 200 µm, the average grain size of the alloy being 45 ± 2 µm. Coarse grains, in fact, can easily form longer initial cracks, due to a large number of dislocations and defects, resulting in a higher probability of localised damage under cyclic loading compared to fine grains.
The PEO-treated samples showed the same crack nucleation mechanisms, as can be seen in Figure 12a,b, where cleavage facets and fatigue striations can be clearly identified.
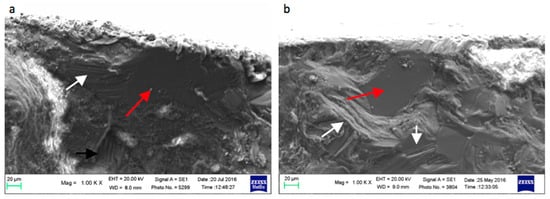
Figure 12.
SEM images of crack initiation at isolated facets of cleavage planes (red arrows) surrounded by fatigue striations (white arrows) of two different PEO-treated samples, tested at stress amplitude of 90 MPa (a) and 100 MPa (b).
It can, therefore, be inferred that the lower fatigue strength of PEO-treated samples is mainly due to the residual tensile stresses induced by the treatment, rather than the defects present in the conversion layer. As previously reported, the presence of fluorine in the electrolytic bath and the sandblast process, in fact, reduced the typical solidification defects in the conversion layer (Section 3.2) and consequently, their influence on the fatigue behaviour of the alloy.
Representative SEM images of the crack growth region for the PEO-treated and untreated samples are reported in Figure 13a,b, showing the presence of classic fatigue striations. In Mg alloys, their formation is generally associated with the dislocation slip and twinning mechanisms in the plastic zone ahead of the fatigue crack tip [4,6,48].
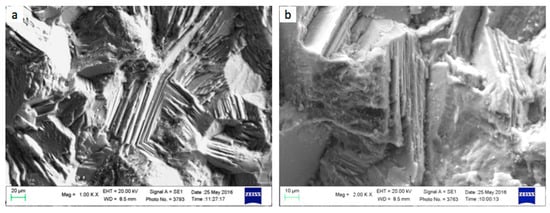
Figure 13.
Representative SEM images of the crack growth region: (a) SP sample, tested at stress amplitude of 100 MPa and (b) S0.2 sample, tested at stress amplitude of 110 MPa.
In this region also, secondary transgranular cracks are clearly visible, as shown by representative OM images on longitudinal sections of fatigue samples (Figure 14a); they originated from the main cracks, confirming a transgranular and intergranular mixed mode of crack propagation. Slip bands can clearly be seen inside the grains (Figure 14b), confirming the previously discussed mechanism for fatigue striations formation.
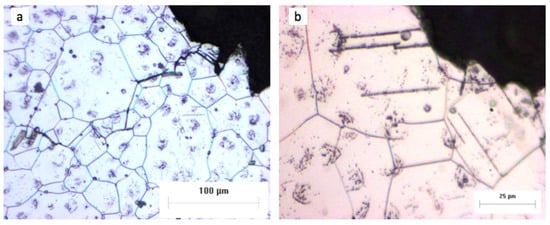
Figure 14.
Representative OM images of longitudinal sections (parallel to the gauge length), of S0.2 sample (stress amplitude of 110 MPa): (a) secondary transgranular cracks and (b) slip bands inside the grains.
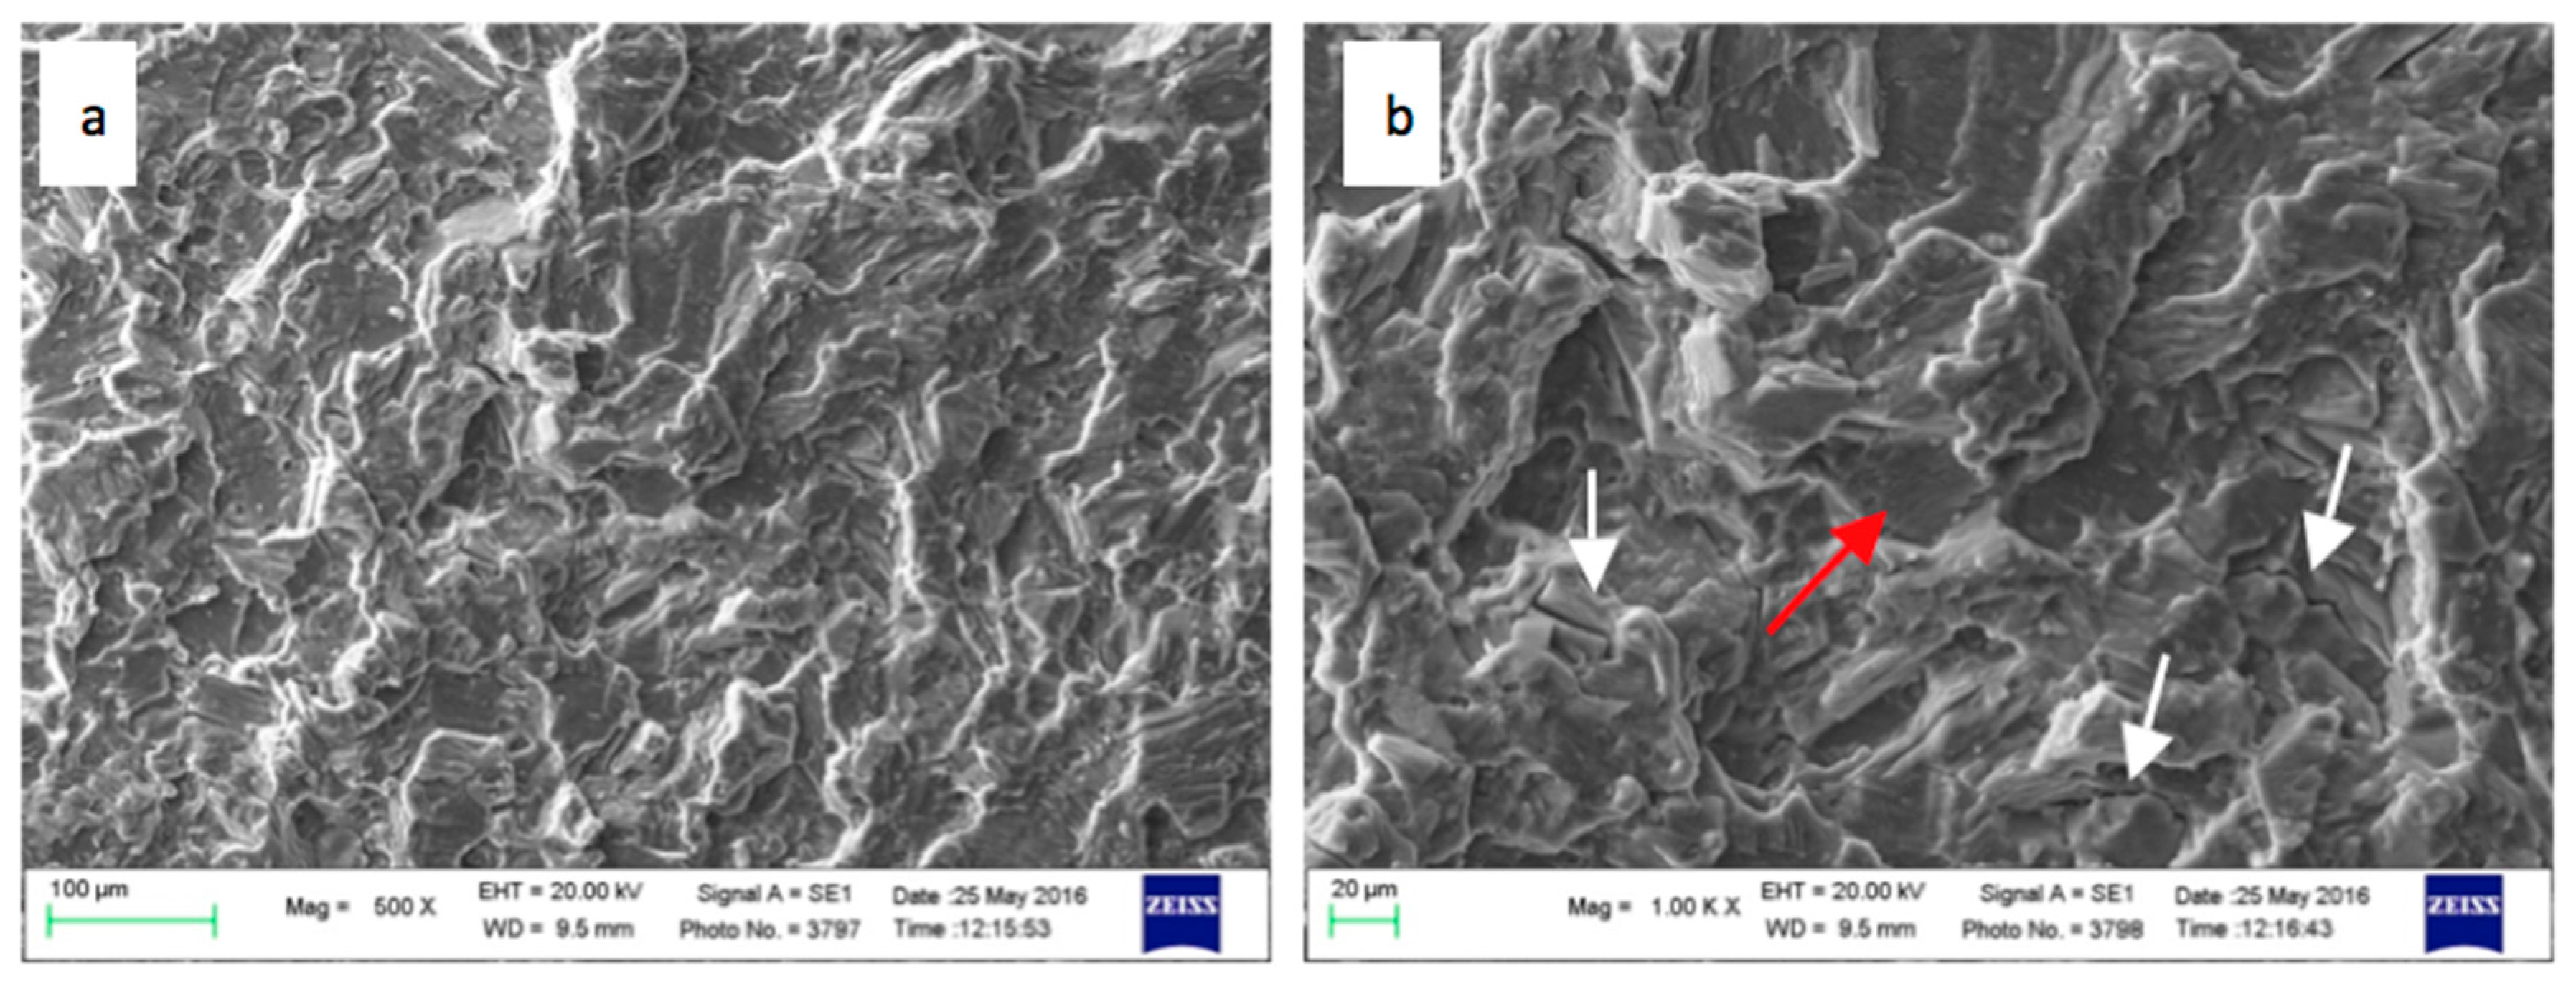
Finally, representative SEM images of the overloading regions are reported in Figure 15, where a typical brittle morphology, with cleavage planes and secondary cracks, can be observed.
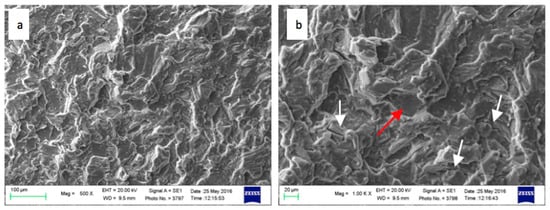
Figure 15.
Representative SEM images in the overloading area, at (a) low and (b) high magnification, with cleavage planes (red arrow) and secondary microcracks (white arrows).
4. Conclusions
The effect of surface roughness and plasma electrolytic oxidation on the fatigue behaviour of the innovative rare earth rich sand cast EV31A Mg alloy was investigated.
The fatigue strength of the untreated alloy was comparable with that of wrought Mg alloy, also due to its chemical composition as well as to the high quality of the cast product, substantially free from solidification defects due to a well-controlled sand casting process. The effect of specimen surface roughness was negligible.
The PEO treatment caused no more than 15% reduction in the alloy mean fatigue strength. The relatively low reduction in fatigue strength was related to the compact and well adherent conversion layer. A positive effect on its fatigue behaviour was probably also induced by the sandblasting process, carried out on the PEO-treated specimens, that removed the outer layer with the largest pores, channels and craters, typically induced by plasma electrolytic oxidation.
Similar mechanisms of fatigue failure were observed in base and PEO-treated alloys, with crack nucleation sites located close to the large facets of the cleavage planes. This allows us to conclude that the observed reduction in fatigue performance was mainly induced by the residual tensile stresses due to PEO treatment in the substrate material, rather than the defects present in the conversion layer.
Acknowledgments
The research was financially supported by Ducati Motor Holding.
Author Contributions
Lorella Ceschini, Alessandro Morri and Simone Messieri conceived and designed the experiments; Valerio Angelini performed the experiments. All the authors were involved in data analysis and paper writing.
Conflicts of Interest
The authors declare no conflict of interest.
References
- Li, Z.M.; Wang., Q.G.; Luo, A.A.; Peng, L.M.; Fu, P.H.; Wang, Y.X. Improved high cycle fatigue properties of a new magnesium alloy. Mater. Sci. Eng. A 2013, 582, 170–177. [Google Scholar] [CrossRef]
- Friedrich, H.; Schumann, S. Research for a “new age of magnesium” in the automotive industry. J. Mater. Process Technol. 2001, 117, 276–281. [Google Scholar] [CrossRef]
- Pantelakis, S.G.; Alexopoulos, N.D.; Chamos, A.N. Mechanical performance evaluation of cast magnesium alloys for automotive and aeronautical applications. J. Eng. Mater. Technol. 2007, 129, 422–430. [Google Scholar] [CrossRef]
- Mirza, F.A.; Chen, D.L.; Li, D.J.; Zeng, X.Q. Cyclic deformation behavior of a rare-earth containing extruded magnesium alloy: Effect of heat treatment. Metall. Mater. Trans. A 2014, 46, 1168–1187. [Google Scholar] [CrossRef]
- Li, Z.; Wang, Q.; Luo, A.A.; Fu, P.; Peng, L. Fatigue strength dependence on the ultimate tensile strength and hardness in magnesium alloys. Int. J. Fatigue 2015, 80, 468–476. [Google Scholar] [CrossRef]
- Li, Z.; Wang, Q.; Luo, A.A.; Fu, P.; Peng, L.; Wang, Y.; Wu, G. High cycle fatigue of cast Mg-3Nd-0.2Zn magnesium alloys. Metall. Mater. Trans. A 2013, 44, 5202–5215. [Google Scholar] [CrossRef]
- Peng, L.; Fu, P.; Li, Z.; Wang, Y.; Jiang, H. High cycle fatigue properties of cast Mg-xNd-0.2Zn-Zr alloys. J. Mater. Sci. 2014, 49, 7105–7115. [Google Scholar] [CrossRef]
- Li, H.; Lv, F.; Xiao, Z.; Liang, X.; Sang, F.; Li, P. Low-cycle fatigue behavior of a cast Mg–Y–Nd–Zr alloy by T6 heat treatment. Mater. Sci. Eng. A 2016, 676, 377–384. [Google Scholar] [CrossRef]
- Mirza, F.A.; Chen, D.L. Fatigue of rare-earth containing magnesium alloys: A review. Fatigue Fract. Eng. Mater. Struct. 2014, 37, 831–853. [Google Scholar] [CrossRef]
- Mokhtarishirazabad, M.; Boutorabi, S.M.A.; Azadi, M.; Nikravan, M. Effect of rare earth elements on high cycle fatigue behavior of AZ91 alloy. Mater. Sci. Eng. A 2013, 587, 179–184. [Google Scholar] [CrossRef]
- Pan, F.; Yang, M.; Chen, X. A review on casting magnesium alloys: Modification of commercial alloys and development of new alloys. J. Mater. Sci. Technol. 2016, 32, 1211–1221. [Google Scholar] [CrossRef]
- Peng, L.M.; Fu, P.H.; Li, Z.M.; Yue, H.Y.; Li, D.Y.; Wang, Y.X. High cycle fatigue behaviors of low pressure cast Mg-3Nd-0.2Zn-2Zr alloys. Mater. Sci. Eng. A 2014, 611, 170–176. [Google Scholar] [CrossRef]
- Wang, F.; Dong, J.; Jiang, Y.; Ding, W. Cyclic deformation and fatigue of extruded Mg-Gd-Y magnesium alloy. Mater. Sci. Eng. A 2013, 561, 403–410. [Google Scholar] [CrossRef]
- Stanford, N.; Barnett, M. Effect of composition on the texture and deformation behaviour of wrought Mg alloys. Scr. Mater. 2008, 58, 179–182. [Google Scholar] [CrossRef]
- Hadorn, J.P.; Hantzsche, K.; Yi, S.; Bohlen, J.; Letzig, D.; Agnew, S.R. Effects of solute and second-phase particles on the texture of Nd-containing Mg alloys. Metall. Mater. Trans. A 2012, 43, 1363–1375. [Google Scholar] [CrossRef]
- Mirza, F.A.; Chen, D.L.; Li, D.J.; Zeng, X.Q. Effect of rare earth elements on deformation behavior of an extruded Mg-10Gd-3Y-0.5Zr alloy during compression. Mater. Des. 2013, 46, 411–418. [Google Scholar] [CrossRef]
- Morales, E.D.; Ghali, E.; Hort, N.; Dietzel, W.; Kainer, K.U. Corrosion behaviour of magnesium alloys with RE additions in sodium chloride solutions. Mater. Sci. Forum 2003, 419, 867–872. [Google Scholar] [CrossRef]
- Wu, G.; Fan, Y.; Gao, H.; Zhai, C.; Zhu, Y.P. The effect of Ca and rare earth elements on the microstructure, mechanical properties and corrosion behavior of AZ91D. Mater. Sci. Eng. A 2005, 408, 255–263. [Google Scholar] [CrossRef]
- Smola, B.; Stulikova, I.; Von Buch, F.; Mordike, B.L. Structural aspects of high performance Mg alloys design. Mater. Sci. Eng. A 2002, 324, 113–117. [Google Scholar] [CrossRef]
- Xiao, W.; Shen, Y.; Wang, L.; Wu, Y.; Cao, Z.; Jia, S.; Wang, L. The influences of rare earth content on the microstructure and mechanical properties of Mg–7Zn–5Al alloy. Mater. Des. 2010, 31, 3542–3549. [Google Scholar] [CrossRef]
- Yerokhin, A.L.; Shatrov, A.; Samsonov, V.; Shashkov, P.; Leyland, A.; Matthews, A. Fatigue properties of Keronite coatings on a magnesium alloy. Surf. Coat. Technol. 2004, 182, 78–84. [Google Scholar] [CrossRef]
- Khan, S.A.; Miyashita, Y.; Mutoh, Y.; Koike, T. Effect of anodized layer thickness on fatigue behavior of magnesium alloy. Mater. Sci. Eng. A 2008, 474, 261–269. [Google Scholar] [CrossRef]
- Nemcova, A.; Skeldon, P.; Thompson, G.E.; Morse, S.; Cizek, J.; Pacal, B. Influence of plasma electrolytic oxidation on fatigue performance of AZ61 magnesium alloy. Corros. Sci. 2014, 82, 58–66. [Google Scholar] [CrossRef]
- Srinivasan, P.B.; Liang, J.; Blawert, C.; Dietzel, W. Dry sliding wear behaviour of magnesium oxide and zirconium oxide plasma electrolytic oxidation coated magnesium alloy. Appl. Surf. Sci. 2010, 256, 3265–3273. [Google Scholar] [CrossRef]
- Liu, C.; Liang, J.; Zhou, J.; Li, Q.; Peng, Z.; Wang, L. Characterization and corrosion behavior of plasma electrolytic oxidation coated AZ91-T6 magnesium alloy. Surf. Coat. Technol. 2016, 304, 179–187. [Google Scholar] [CrossRef]
- Durdu, S.; Usta, M. Characterization and mechanical properties of coatings on magnesium by micro arc oxidation. Appl. Surf. Sci. 2012, 261, 774–782. [Google Scholar] [CrossRef]
- Li, Z.; Wang, Q.; Luo, A.A.; Peng, L.; Zhang, P. Fatigue behavior and life prediction of cast magnesium alloys. Mater. Sci. Eng. A 2015, 647, 113–126. [Google Scholar] [CrossRef]
- Liu, W.; Jiang, L.; Cao, L.; Mei, J.; Wu, G.; Zhang, S.; Xiao, L.; Wang, S.; Ding, W. Fatigue behavior and plane-strain fracture toughness of sand-cast Mg-10Gd-3Y-0.5Zr magnesium alloy. Mater. Des. 2014, 59, 466–474. [Google Scholar] [CrossRef]
- Xu, D.K.; Liu, L.; Xu, Y.B.; Han, E.H. The fatigue behavior of I-phase containing as-cast Mg-Zn-Y-Zr alloy. Acta Mater. 2008, 56, 985–994. [Google Scholar] [CrossRef]
- Bhuiyan, M.S.; Mutoh, Y.; Murai, T.; Iwakami, S. Corrosion fatigue behavior of extruded magnesium alloy AZ61 under three different corrosive environments. Int. J. Fatigue 2008, 30, 1756–1765. [Google Scholar] [CrossRef]
- International Organization for Standardization. Metallic Materials—Rotating Bar Bending Fatigue Testing; International Organization for Standardization: Geneva, Switzerland, 2010. [Google Scholar]
- ASTM International. E112: Standard Test Methods for Determining Average Grain Size; ASTM International: West Conshohocken, PA, USA, 2012. [Google Scholar]
- Italian Organization for Standardization. Mechanical Testing of Metallic Materials Fatigue Testing at Room Temperature; Italian Organization for Standardization: Milano, Italy, 1985. [Google Scholar]
- Angelini, V.; Ceschini, L.; Morri, A.; Apelian, D. Influence of heat treatment on microstructure and mechanical properties of rare earth rich magnesium alloy. Int. J. Metalcast. 2016, 1–14. [Google Scholar] [CrossRef]
- Lyon, P. New magnesium alloy for aerospace and speciality applications. In Magnesium Technology; Luo, A.A., Ed.; TMS: Warrendale, PA, USA, 2004. [Google Scholar]
- Wang, Q.; Lu, Y.; Zeng, X.; Ding, W.; Zhu, Y.; Li, Q.; Lan, J. Study on the fluidity of AZ91+xRE magnesium alloy. Mater. Sci. Eng. A 1999, 271, 109–115. [Google Scholar]
- Duan, H.; Yan, C.; Wang, F. Effect of electrolyte additives on performance of plasma electrolytic oxidation films formed on magnesium alloy AZ91D. Electrochim. Acta 2007, 52, 3785–3793. [Google Scholar] [CrossRef]
- Arrabal, R.; Matykina, E.; Hashimoto, T.; Skeldon, P.; Thompson, G.E. Characterization of AC PEO coatings on magnesium alloys. Surf. Coat. Technol. 2009, 203, 2207–2220. [Google Scholar] [CrossRef]
- Ko, Y.G.; Namgung, S.; Shin, D.H. Correlation between KOH concentration and surface properties of AZ91 magnesium alloy coated by plasma electrolytic oxidation. Surf. Coat. Technol. 2010, 205, 2525–2531. [Google Scholar] [CrossRef]
- Blawert, C.; Srinivasan, P.B. Surface Engineering of Light Alloys, 1st ed.; Dong, H., Ed.; Woodhead Publishing: Sawston, UK, 2010; pp. 155–180. [Google Scholar]
- Bull, S.J.; Berasetegui, E.G. An overview of the potential of quantitative coating adhesion measurement by scratch testing. Tribol. Int. 2006, 39, 99–114. [Google Scholar] [CrossRef]
- Li, Z.; Fu, P.; Peng, L.; Becker, E.P.; Wu, G. Influence of solution temperature on fatigue behavior of AM-SC1 cast magnesium alloy. Mater. Sci. Eng. A 2013, 565, 250–257. [Google Scholar] [CrossRef]
- Yang, F.; Yin, S.M.; Li, S.X.; Zhang, Z.F. Crack initiation mechanism of extruded AZ31 magnesium alloy in the very high cycle fatigue regime. Mater. Sci. Eng. A 2008, 491, 131–136. [Google Scholar] [CrossRef]
- Wang, S.D.; Xu, D.K.; Wang, B.J.; Han, E.H.; Dong, C. Effect of corrosion attack on the fatigue behavior of an as-cast Mg-7%Gd-5%Y-1%Nd-0.5%Zr alloy. Mater. Des. 2015, 84, 185–193. [Google Scholar] [CrossRef]
- Liu, W.C.; Dong, J.; Zhang, P.; Korsunsky, A.M.; Song, X.; Ding, W.J. Improvement of fatigue properties by shot peening for Mg-10Gd-3Y alloys under different conditions. Mater. Sci. Eng. A 2011, 528, 5935–5944. [Google Scholar] [CrossRef]
- Mayer, H.; Papakyriacou, M.; Zettl, B.; Stanzl-Tschegg, S.E. Influence of porosity on the fatigue limit of die cast magnesium and aluminium alloys. Int. J. Fatigue 2003, 25, 245–256. [Google Scholar] [CrossRef]
- Tokaji, K.; Kamakura, M.; Ishiizumi, Y.; Hasegawa, N. Fatigue behaviour and fracture mechanism of a rolled AZ31 magnesium alloy. Int. J. Fatigue 2004, 26, 1217–1224. [Google Scholar] [CrossRef]
- Begum, S.; Chen, D.L.; Xu, S.; Luo, A.A. Effect of strain ratio and strain rate on low cycle fatigue behavior of AZ31 wrought magnesium alloy. Mater. Sci. Eng. A 2009, 517, 334–343. [Google Scholar] [CrossRef]


© 2017 by the authors. Licensee MDPI, Basel, Switzerland. This article is an open access article distributed under the terms and conditions of the Creative Commons Attribution (CC BY) license (http://creativecommons.org/licenses/by/4.0/).