Article

Economic and Qualitative Determinants of the World Steel Production

by
Amelia Bucur
1,*,
Gabriela Dobrotă
2,
Camelia Oprean-Stan
3 and
Cristina Tănăsescu
3
1
Faculty of Sciences, Lucian Blaga University of Sibiu, 550012 Sibiu, Romania
2
Faculty of Economics, Constantin Brâncuşi University of Târgu-Jiu, 210163 Târgu-Jiu, Romania
3
Faculty of Economics, Lucian Blaga University of Sibiu, 550324 Sibiu, Romania
*
Author to whom correspondence should be addressed.
Metals 2017, 7(5), 163; https://doi.org/10.3390/met7050163
Submission received: 20 March 2017 / Revised: 20 April 2017 / Accepted: 3 May 2017 / Published: 9 May 2017

Abstract

:
The aim of this paper is to highlight the influence of economic and qualitative factors on steel production globally, as well in the EU, US, and China, using a dataset corresponding to the period 2000–2015. The research methods used are the study of specialist literature, problematisation, modelling, and simulation using Statistical Package for the Social Sciences (SPSS) software. The main conclusion of this paper is that, on long term, the steel production is largely influenced by the rate of real economic growth and by car production, even if in the short term the correlation is not obvious. Likewise, qualitative factors affect the steel industry in the context of current regulations on reducing carbon emissions and ensuring sustainable development. An additional aim of the present study is to define entropy in the sustainable development of steel production, as well as illustrate some of its properties and the quality management modelling of the research process in steel production.

1. Introduction

The capacity of steel to be shaped and moulded, as well as its elasticity, ductility, its proven resistance in various uses, and its corrosion resistance, has given it a dominant position among the materials used in various sectors. In the modern world, steel is practically indispensable in construction, infrastructure, automotive, and many other industries while also being an important determinant of economic development. Many studies have examined the role of the steel industry within the economy and have indicated a positive correlation between the steel industry and economic growth [1,2,3,4]. Obviously, as this is not the only determinant, an analysis of a set of qualitative and quantitative factors is required. One of the most important issues widely debated in the literature remains air pollution, with industry in general and the steel industry in particular representing highly vulnerable areas viewed from this perspective [5,6,7,8]. As a result, manufacturing steel with efficient structures while reducing the negative effects on the environment can contribute to sustainable development. Moreover, the need to adopt principles of sustainable development in the steel industry has been the subject of numerous studies, given the need to ensure that performance is in accordance with these principles [9,10,11,12]. As special attention needs to be focused on resource efficiency, the application of basic rules of production management is required. As such, with regard to resource optimization, the management of production facilities includes economic, managerial and engineering activities. As it is essential to improve the utilization of machine capacity, the importance of developing of new methodologies in this field has been emphasised by many specialists [13]. In the steel industry, the application of such requirements can ensure that development meets the demands of future activities.
According to Kumar and Suresh (2008), “Production/operations management is the process, which combines and transforms various resources used in the production/operations subsystem of the organization into value added product/services in a controlled manner as per the policies of the organization”. It is obvious that manufacturers have to focus on customer needs, and their main objective should be fulfilling the customer’s needs [14]. Regarding the steel industry, consumers are interested in products made from high-strength steel (obtaining these steel grades is directly influenced by the particular raw materials and production methods applied). Furthermore, in the future, the estimated growth in the demand for steel in construction and car production, which requires improvements to the relevant quality parameters so that the steel industry can position itself as a component of circular economy, involves optimizing resource consumption and obtaining reusable material.
Matters specified justify a need for research to identify factors that influence the production of steel, both quantitatively and qualitatively. In this regard, the article is organized as follows: Section 2 presents a linear model describing the relationship between Economic Factors and Steel Production, Section 3 presents qualitative factors and Quality management in steel industry, and Section 4 presents conclusions followed by references.

2. Linear Model Describing the Relationship between Economic Factors and Steel Production

Companies are operating in an economic environment that significantly impacts on the results achieved by them. Thus, a period of economic boom transmits its positive influence at the microeconomic level by creating favourable conditions for companies’ development. Similarly, any economic or financial crisis affects production, consumption, and development through various channels. In this context, it is clear that the steel industry cannot be an exception. Steel production is directly influenced by the pace of the economic growth of a country and the demand exercised on the market.
Previous explanations have established that steel is one of the most widely used materials in important areas such as construction, transport, energy, and domestic appliance manufacturing. Obviously, most steel consumption is attributed to the construction sector (around 50%), followed by mechanical machinery (16%), the automotive industry (about 13%), and metal products (11%) (in accordance with the World Steel Association for 2014). Given the upward trend in car production worldwide and the fact that steel is a material with more than a 50% share of the weight of an average car, the present study is concerned with the correlation between steel production, car production, and the rate of economic growth. In addition, even if there is increasing talk about alternative materials as well as current regulations imposed in different countries to support carbon emission reduction and the efficient use of fuels (made possible by reducing the weight of cars, which is due to a reduction in the amount of steel used for their manufacture), it is obvious that steel remains an undisputed material in terms of its qualities, costs, and its possibilities in terms of large-scale applications in various industries [15].

2.1. Mathematical Model

The mathematical model is a system of mathematical relations that describes the essential properties of a real problem. Thus, it can be said that a real problem can be solved by solving a mathematical problem. Many specialists consider mathematical formalization one of the most convenient ways for describing the characteristics of the surrounding world, especially the quantitative ones. Mathematical models can be tested from the perspectives of logical non-contradiction, estimating the level of approximation of the obtained conclusions, and analysed data [16]. Mathematical modelling continues to have an important role in modern scientific research. The foundation of these models is represented by mathematical concepts and symbols.
The realization of the mathematical model highlights the essential characteristics of the modelled process/object, which determines the mathematical formalization. Formalization implies that it is possible for the characteristics of the real problem to be matched to appropriate mathematical concepts: functions, derivatives, integrals, equations, systems, inequalities etc. [17,18,19].
The decisions that are based solely on intuition or experience no longer have a place in modern organizations. An efficient quality management requires decisions to be supported using modern mathematical methods, combined with the most advanced computer calculation techniques using efficient electronic means [20]. As mathematical modelling provides the opportunity to identify correlations between different variables, and therefore the influences exerted by various factors, decisions and substantiating development strategies may be rooted in reality.
Multiple linear regression and correlations as statistical analysis methods were chosen in order to study the existence of a cause-result link between how steel production is influenced by economic growth and car production and its default role with in economic development and the attractiveness of investing in this production. The regression function represents the mathematical expression obtained after processing some experimental data that approximate or estimate the interrelations between one or more variables of a system or process. Producing a regression function is necessary when the interrelations between those variables cannot be calculated precisely enough by taking a theoretical approach.
In this respect, the proposed model includes the following variables:
  • The dependent resulting variable is steel production (million tons)marked by the letter P;
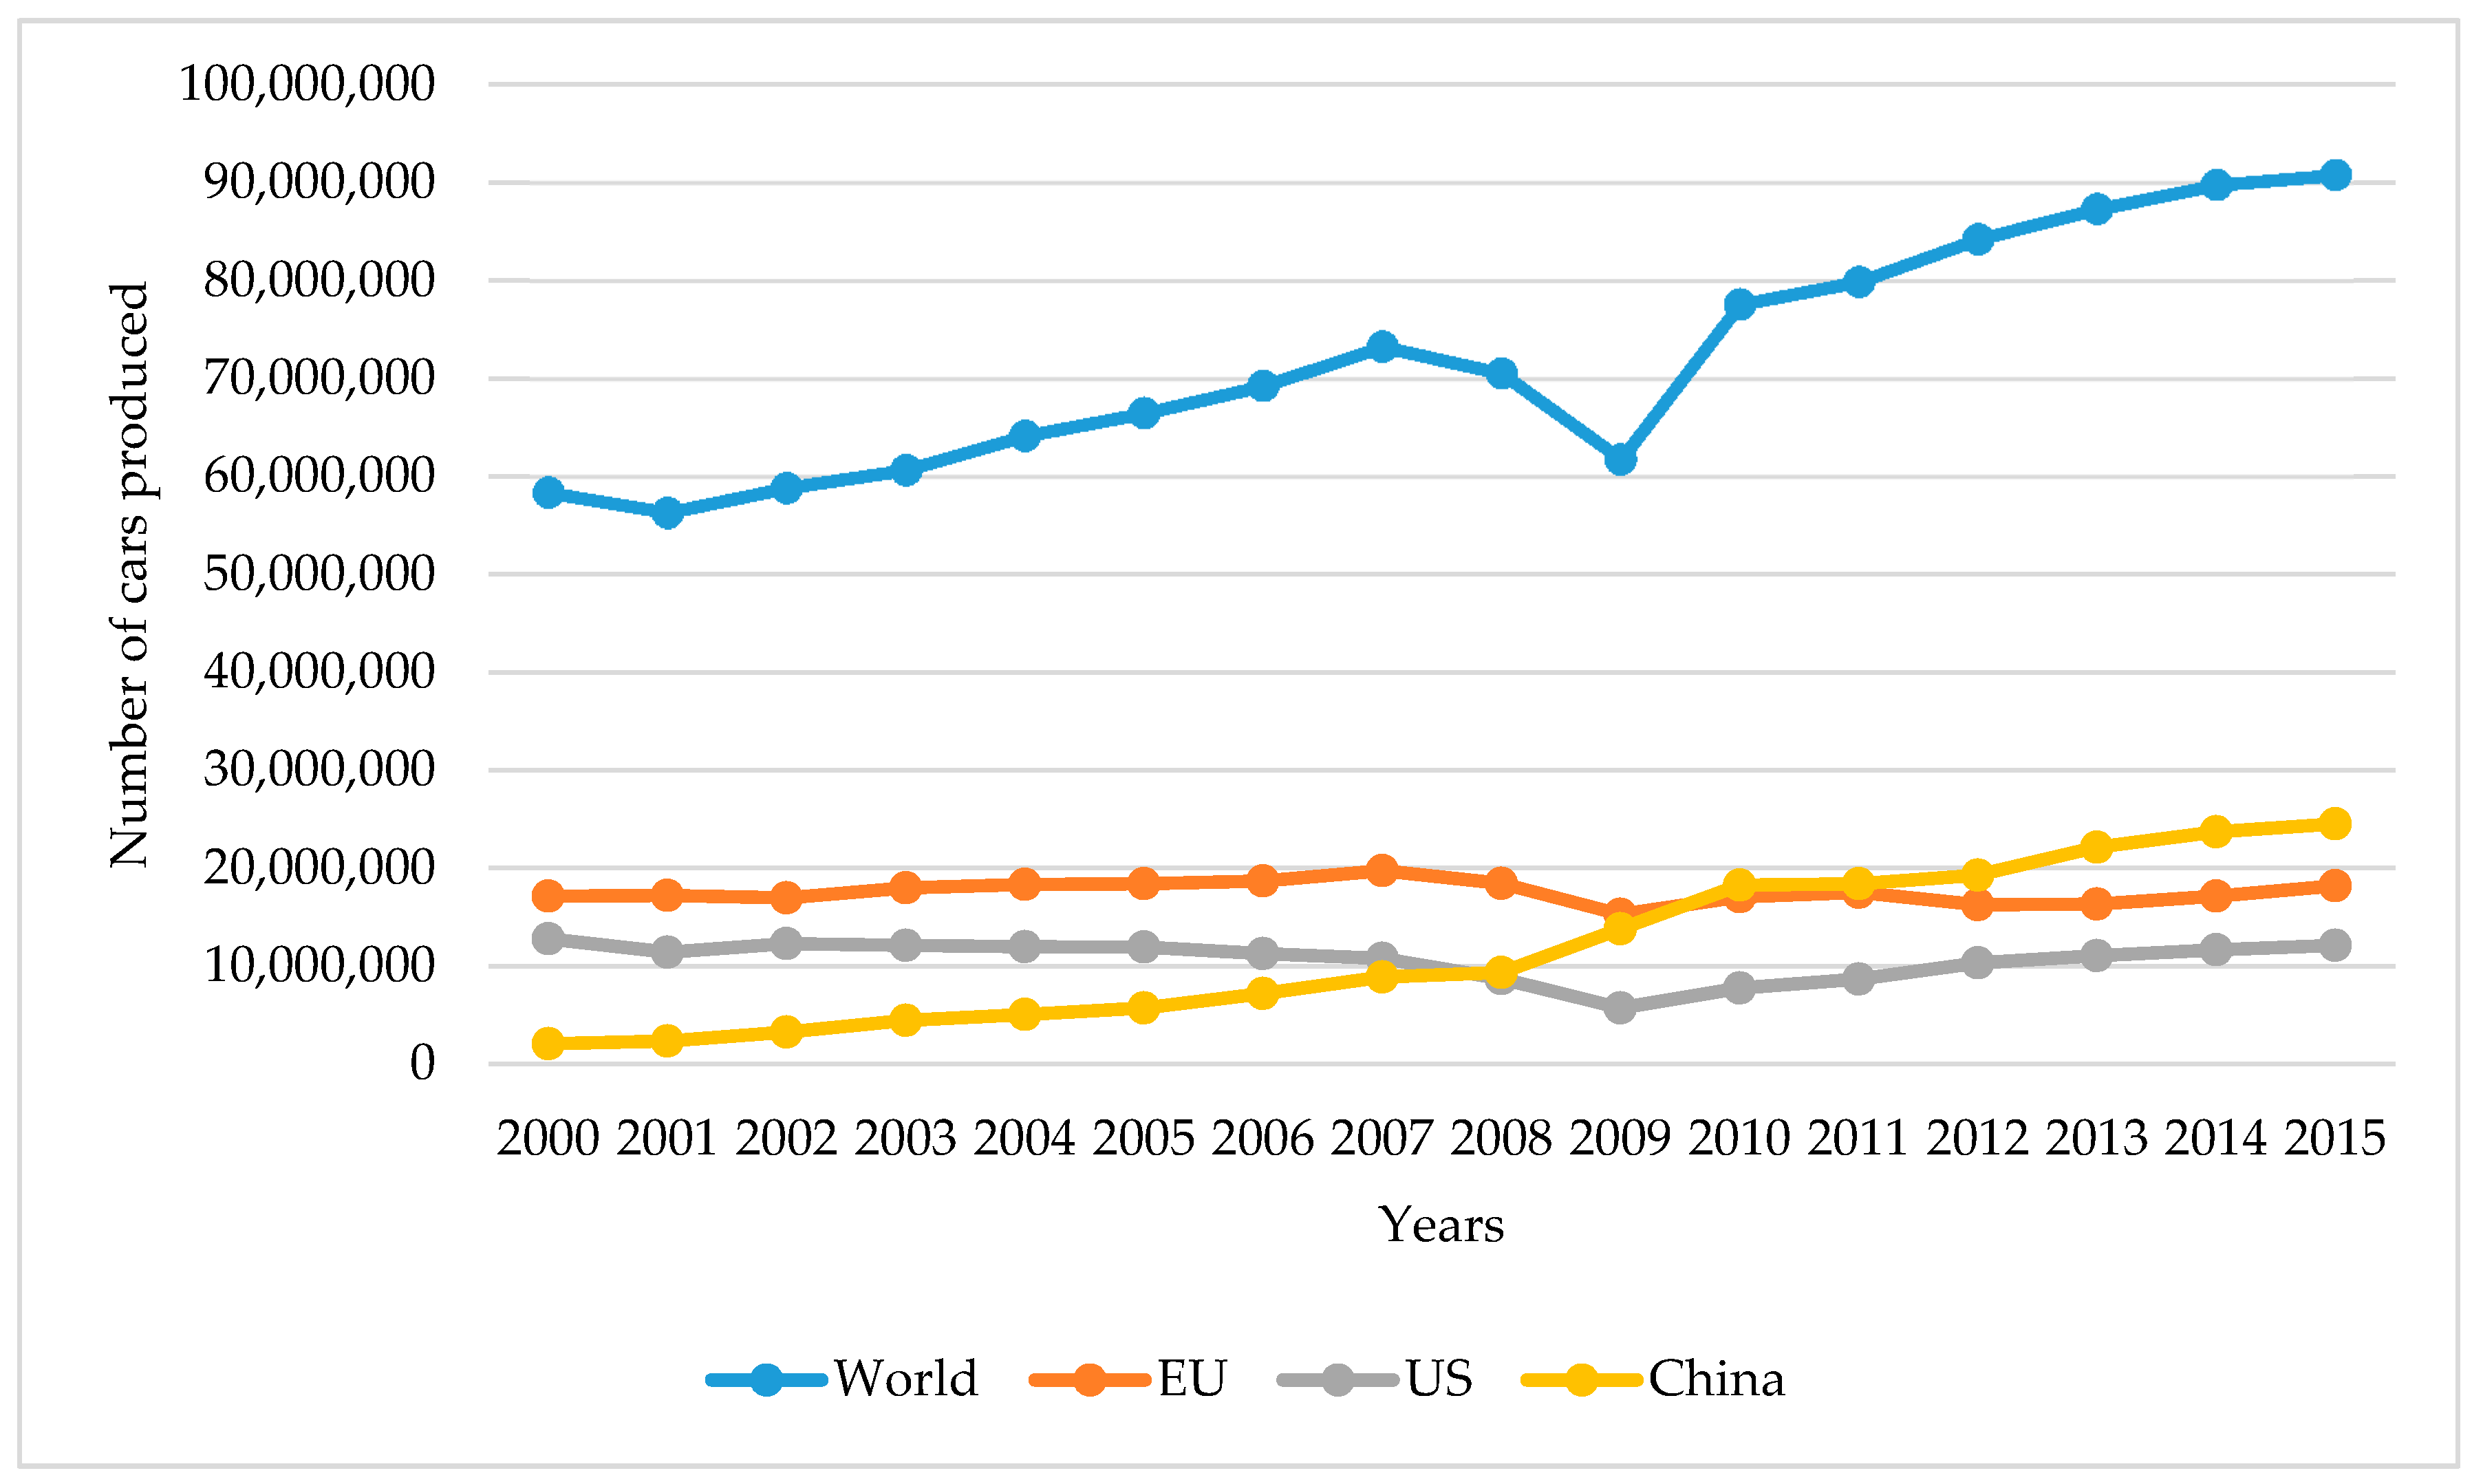
  • Factorial variables are represented by real economic growth rate (%) and motor vehicle production (automotive production volume) marked with R and M, respectively.
Regarding the selected variables, it must be stated that this study is interested in those recorded over the period 2000–2015, which are consistent with the information provided by well-established organizations [21,22,23].
The calculation formula using the regression multilinear model is,
P = a + bR + cM,
where: a is the ordinate at the origin; and b, c are regression coefficients, showing the dependence between the variables (how P changes on average at an increase or decrease of the R and M variables by a unit).
The aim of the multiple regression (term used by Pearson, 1908) is to highlight the relationship between a dependent variable and a set of independent variables. The model of multiple linear regression was chosen because it is associated to statistical techniques, which measures and describes the degree of linear association between normally distributed quantitative independent and dependent variables.
In the case of prospective selection, the procedure starts by including in the model the independent variable with the highest correlation coefficient with the dependent variable. Afterwards, the variables that were not included in the model were analyzed by performing a sequential test, and thus the model was extended by including the variable that brings maximum contribution (the lowest critical possibility from the sequential test).

2.2. Case Studies and Results

The values of variables found in the data collected for the entire globe, the EU, the US, and China have been processed with version 17 of the Statistical Package for the Social Sciences (SPSS) (IBM Corporation, New York, NY, USA) to determine the regression equation (1) in each of these four cases. The trend of car production worldwide was increasing until 2008, when the economic recession inevitably affected this sector. However, it should be noted that in China, an increase in production was noticed in 2008–2009 and has been significant thereafter (Table 1).
The formation of a clear vision on the evolution of car production is supported by Figure 1.
The global evolution of car production from Figure 1 is influenced by the evolution of steel production, with a Pearson correlation coefficient r = 0.242, which was calculated using the software SPSS. Regarding steel production, the influence of the development phase of an economic cycle may be clearly seen (Figure 2).
Between 2002 and 2007, one can observe a 48.93% increase, but after the global recession of 2008, the growth rate was slower (16.51% between 2010 and 2015), with 2014 marking the start of a new decline. In 2016, crude steel production around the world increased slightly, even if traditional producers, such as South Korea, Germany, Japan, the US, or Russia, achieved smaller quantities compared to the previous year, compared to increases in China (the world’s biggest producer, with 1.2%) or in India, Turkey, and Ukraine.
In each case, for the multiple linear regression analysis, via simulation with version 17 of the Statistical Package for the Social Sciences (SPSS) (IBM Corporation, New York, NY, USA) with successive commands (Analyze, Regression, Linear), the dependent variable and the two independent variables were selected [20]. The software displayed the results in a table for values of the a, b, c coefficients in Formula (1).
By replacing these results in (1), the mathematical module of a multilinear regression equation for every case was obtained, which shows how steel production is influenced by economic growth and car production:
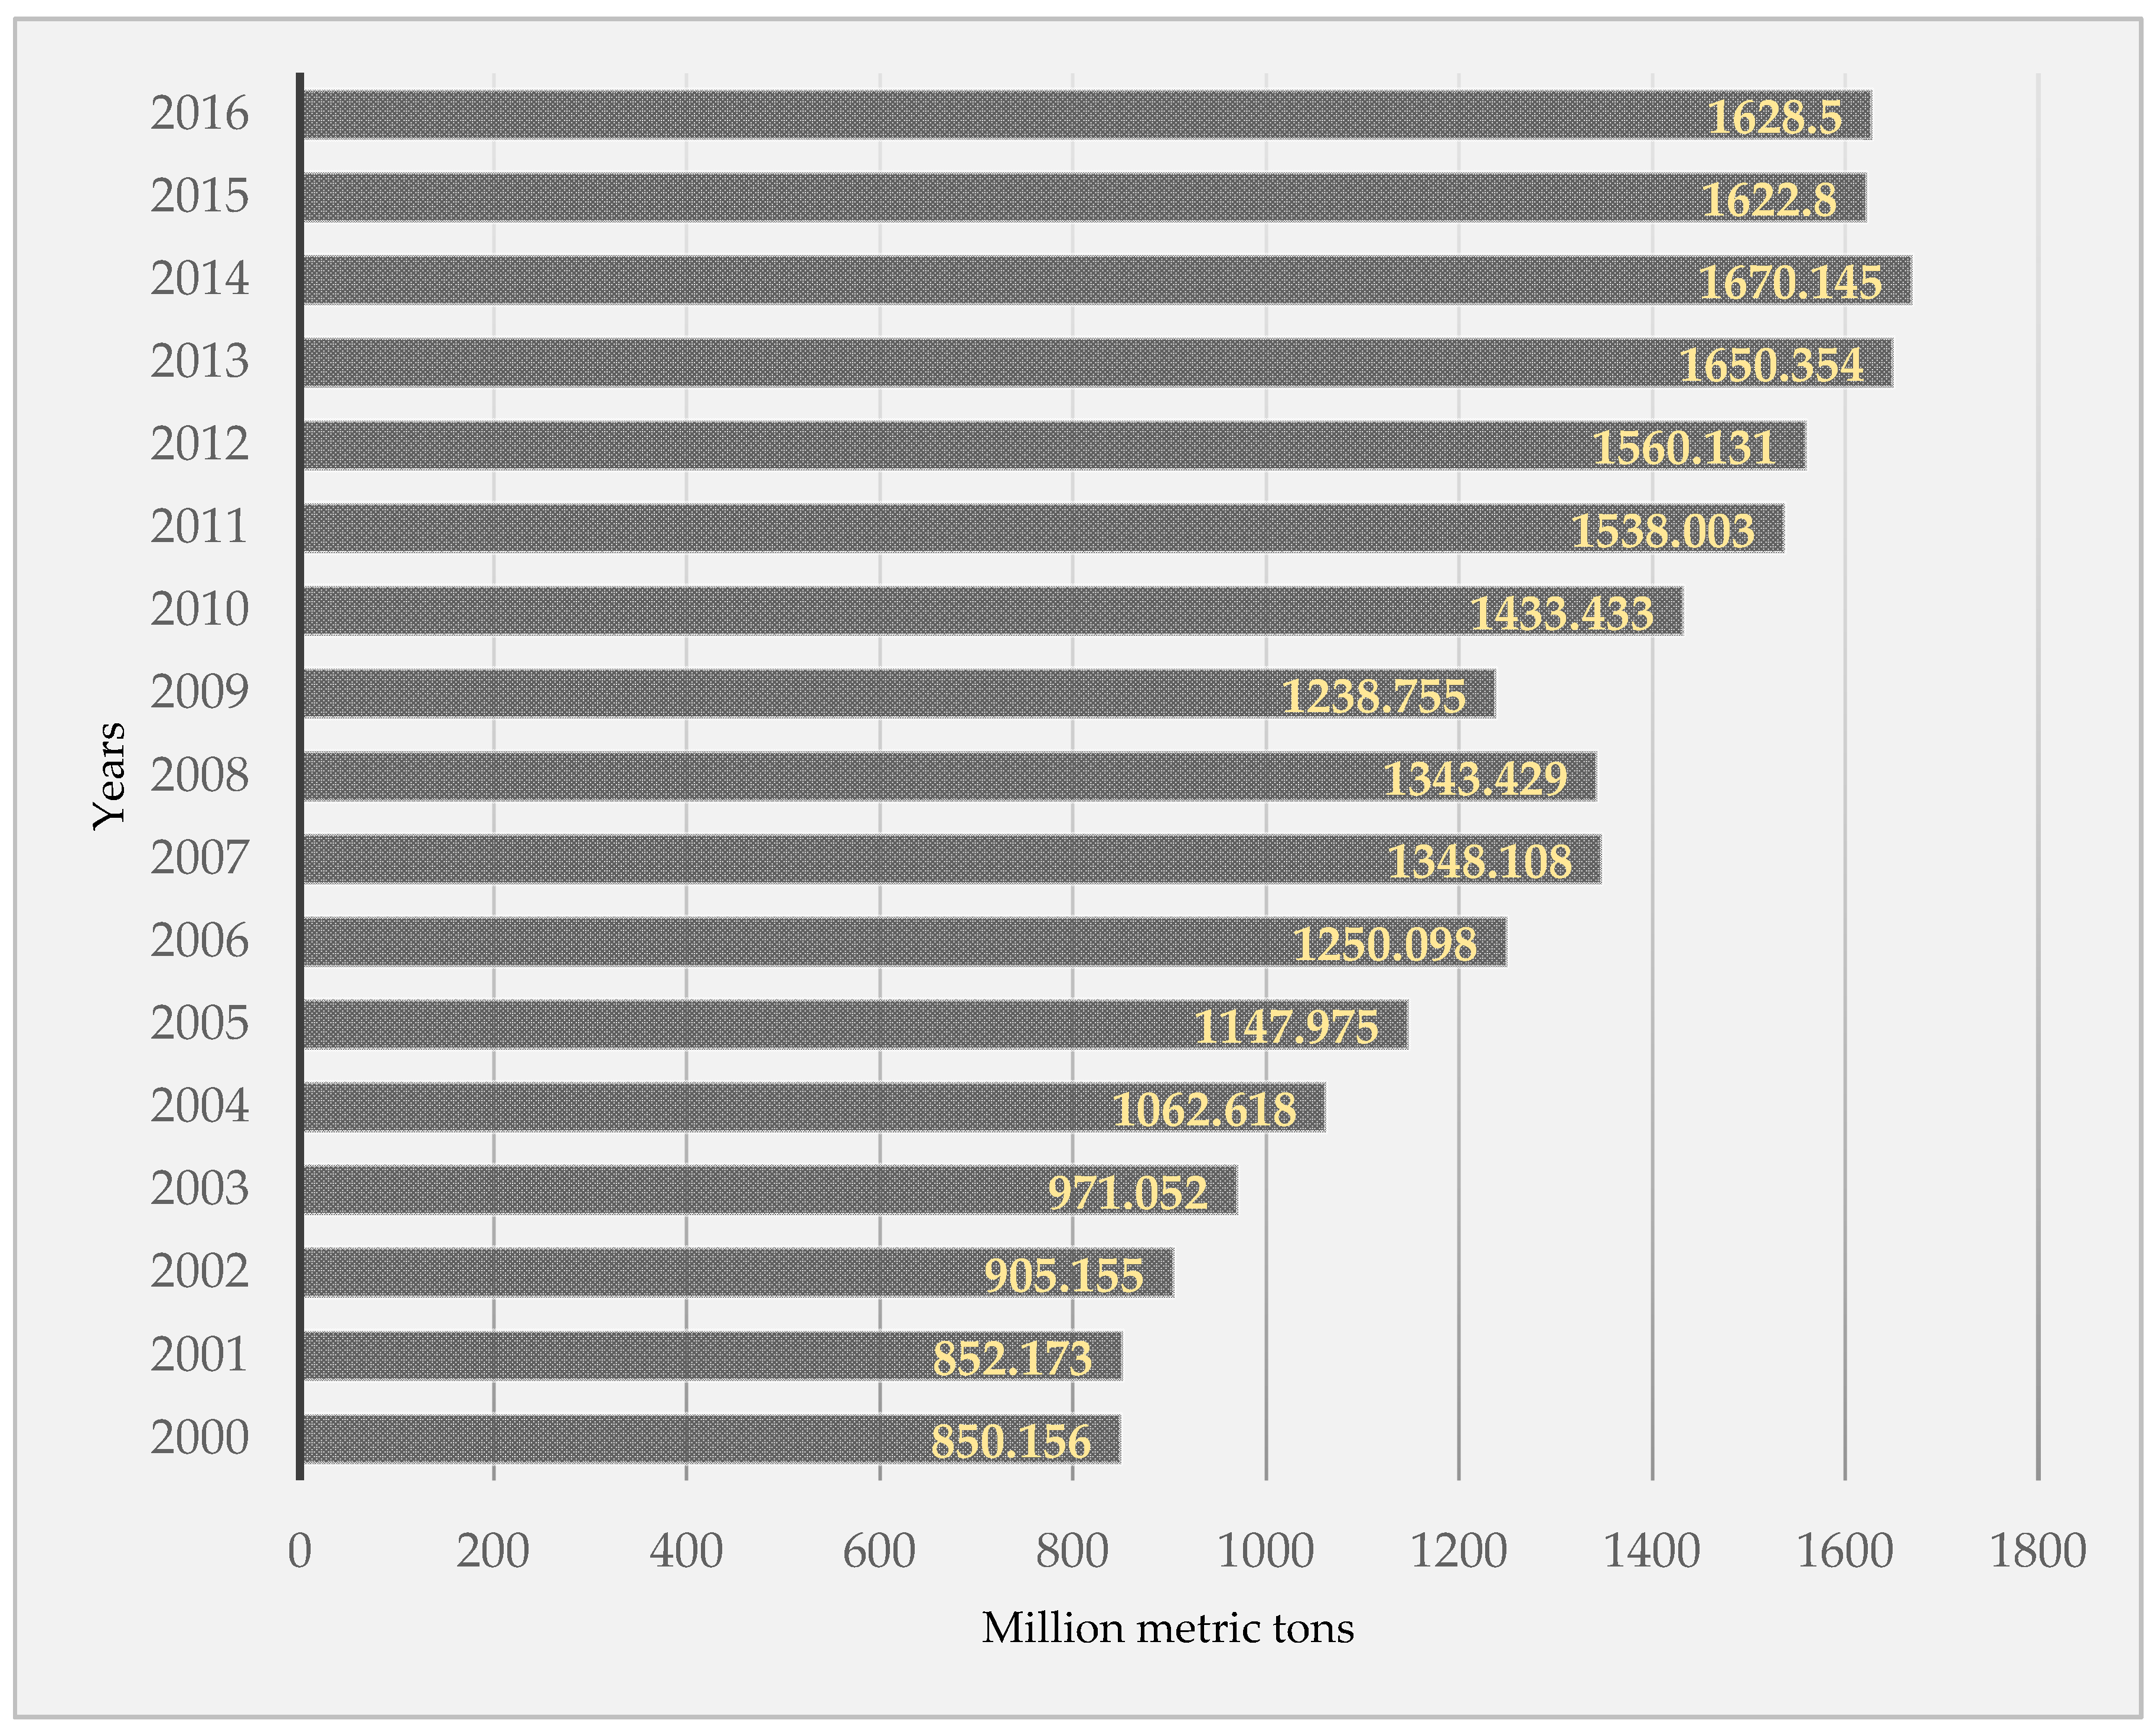
  • Analysis of world steel production evolution, expressed in million tons,
    Pworld = 988.270 + 4.005 × Rworld + 3.839 × 10⁻⁶ × Mworld,
    where Pworld is world steel production in million tons; Rworld is the rate of real economic growth worldwide, expressed as a percentage; Mworld is the automotive production volume worldwide, expressed as an absolute frequency; a = 988.270; b = 4.005; c =3.839 × 10⁻⁶.
  • Case of the EU
    PEU = 184.556 − 8.808 × 10⁻⁷ × REU + 6.464 × MEU,
    where PEU is the steel production of the EU in million tons; REU is the rate of the EU’s real economic growth, expressed as a percentage; MEU is the automotive production volume of the EU, expressed as an absolute frequency; a = 184.556; b = −8.808 × 10⁻⁷; c = 6.464.
  • Case of the US
    PUS = 61.668 + 2.350 × RUS + 2.165 × 10⁻⁶ × MUS
    where PUS is US steel production, expressed in million tons; RUS is the rate of the US’ real economic growth as a percentage; MUS is the US’ automotive production volume, expressed as an absolute frequency; a = 61.668; b = 2.350; c = 2.165 × 10⁻⁶.
  • Case of China
    PChina =1672.364 + 31.367 × RChina − 7.135 × 10⁻⁵ × MChina,
    where PChina is China’s steel production, expressed in million tons; RChina is the rate of China’s real economic growth, expressed as a percentage; MChina is China’s automotive production volume, expressed as an absolute frequency; a = 1672.364; b = 31.367; c = −7.135 × 10⁻⁵.
Meaningful results are provided for each case about Pearson correlation coefficients, r, between the variables steel production (million tons) and apparent steel consumption (million tons) (Table 2).
In order to establish the link between the values of these variables, the value of Pearson’s correlation coefficient and the type of bivariate correlation between discrete quantitative characteristics, the commands Analyze, Correlate, Bivariate, and Bivariate Correlations were execute SPSS software.
After analysis, the software provided the following results about Pearson’s coefficients in the four cases: rworld = 0.998; rEU = 0.920; rUS = 0.951; rChina = 0.996. The values of these coefficients show that, in all four cases, there is a positive (direct), highly intense correlation between the variables of steel production (million tons) and apparent steel consumption (million tons), which means that if the values of one variable increase, the values of the other variables will follow the same trend.

2.3. Discussion

The research reveals that steel production was influenced by the analysed indicators for the period 2000–2015. It should be notes, however, that during the last part of the period, and particularly in 2015, steel production decreased even though independent variables increased over the previous year (Table 3).
This can be attributed to the following factors:
  • The existence of excess production capacity (the rate of use declined in 2015 by up to 64.6%);
  • Although the growth rate was positive compared to the previous year, it was lower. Therefore, China’s economy has recorded the lowest growth rate at 3.9% since 1990. In this country, a significant reduction in steel apparent consumption is also noticed (even though it experienced significant growth between 2000 and 2013, during the period 2014–2016, one may notice its inclusion on the downward path), with many experts minded that the demand and production of steel in this country reached the maximum level.
  • The completion of major investment projects, with direct implications on steel demand.
  • The trend of replacing steel with other materials.
Currently, there is a move by major steel mills to obtain advanced high-strength steels that are much lighter out of a desire to maintain their leadership within the automotive industry. Arcelor Mittal, which allocates about 30% of its research and development budget to identifying solutions for the automotive industry, is suggestive [24].

3. Qualitative Factors and Quality Management in the Steel Industry

3.1. Qualitative Determinants of Steel Production

Using steel extensively in all fields is explained by factors other than everyday living. Sustainable development is related to the rational use of resources, so that future generations will not be affected and environmental protection should be ensured. From this perspective, steel is an environmentally friendly material, as innovations in the field have led to reductions in carbon emissions. It is a recyclable material, enabling the application of recycling processes, so that the resulting steel offers similar characteristics to the material being reprocessed, but which can be improved by adding certain alloying elements or by upgrading its developing technologies.
Steel production costs are still low compared to those arising from the development of other materials that might substitute it, such as aluminium (which has a high cost due to its high energy consumption). Under these circumstances, the use of steel remains a variant that supports sustainable development amid reduced development costs, with implications on market competitiveness.
Steel production is influenced not only by the quality characteristics of this material. Manufacturers must implement new marketing strategies and move towards achieving advanced steels, use the latest knowledge and information, and seize investment opportunities. In this context, the application of quality management principles in the steel industry is a key determinant factor behind production of this material. The managers of steel producing companies must identify the quality factors that act at the level of production, such as research and design, technological process, personnel qualifications, regulations, and industry standards.

3.2. Quality Management Modelling of the Research Process in Steel Production

The obtained results from data processing demonstrate the need to improve research in the steel industry through the application of clear requirements for quality management. In this sense, one can identify a number of issues offering the possibility of developing a mathematical model, which can be used by managers in identifying these requirements so as to ensure sustainable development.
Is mathematics compatible with the epistemological simplicity required in the field of quality and quality management of the research process in steel production? While one may consider that such a path has already been built, it is possible for it to be improved and developed, especially by specialists in quality and quality management of the research process in steel production who have a mathematical background.
What is modelling in the field of quality and quality management of the research process in steel production? One may consider that it is the rational process through which a model for the analysis, control, and evaluation of quality, or for the assessment and improvement of quality management, can be created.
How can the aim of quality modelling and quality management modelling of the research process in steel production be achieved? This can be achieved by the fact that the model needs to offer a simple description of the quality characteristics of tangible or intangible products, i.e., a description of the quality levels that is easy to understand, and, similarly, for any other aspect related to quality and quality management, i.e., a description that is as close to comprehension, not to explanation, as possible.
What is the input into quality and quality management of the research process in steel production modelling? This is represented by the phenomenological and dynamic structures and the causal relations from the chosen system, which are relevant to the operational aim of the models for issues related to quality and quality management.
What is the truth value of the output of models for issues related to quality and quality management of the research process in steel production? This is a truth value of the coherency type: namely, completeness and non-contradictoriness.
On what are quality and quality management in terms of the research process in steel production based? Evidently, they are based on the principle of the intelligibility of issues related to quality and quality management, and on the principle of objectivity of the causal relations between these issues.
Over the years, the scientific substantiation of quality and quality management has been made using different types of models: schematic, normative, descriptive, graphic, iconic, mathematic etc. In this regard, the main models of quality and quality management reported in the specialist literature, with specific applications in various fields, include [20,25,26] the Deming model (for increasing quality); the Juran model (for quality management); the Feigenbaum model (the “Total Quality Control”—TQC); the Ishikawa diagram (the cause-effect or fishbone diagram); the Kaizen model; the Six Sigma model; the Kawakita Jiro model (the KJ or affinity diagram); the diagram of relations; the “Quality Function Deployment”(QFD) diagram, or “the house of quality”; the circle of quality; the correlation diagram; the Pareto diagram; the process diagram; the tree diagram; the matrix diagram; the diagram of decisions; the quality loop; the model for reducing discrepancies; the triangle of quality; the tetrahedron of quality; the model of the relation between quality, market share and the return on investment; the model for the relation between the states of quality of products; the model for the subsystems of TQC; the model for the relation between quality management and organization management; the model of broad quality assurance functions; the schematic representation of the process of applying the method of “management of objectives”; the model of the vertical interactive process of establishing objectives with regard to quality; the model of criteria focused on process and results; the model of the relation between the quality of the product and the quality of the specifications; the schematic model of the stages of applying the QFD method; the model for the processual approach to the system of quality management, from the perspective of the ISO 9000 standards (2000); the model of the objectives of cost analysis with regard to quality; graphic models of the “costs-quality” correlation; the schematic model of the general methodology of an audit of product quality; and the general model of quality management.
This section of the paper presents a mathematical quality management model of the research process in steel production. The structure of the model involves several steps and mainly refers to: research plans that focus on the desired objectives and results; requirements and expectations with regard to the fulfilment of objectives and results in intermediate steps; methods of examining and assessing the quality of the final results [20].
  • Research plans that focus on the desired objectives and results
Each member of the management or each researcher in the context of steel production defines their own specific of a particular research profile after they balance their activity with their fields of competence and the profile of the organization they work for. An important step in the research process is identifying the real needs from the social and economic field, then designing and implementing research plans appropriate to the opportunities in the labour market.
  • Requirements and expectations with regard to the fulfilment of objectives and results in intermediate steps
When designing and planning the research process in steel production, one also needs to take into consideration the competences of the management and researchers, as well as their experience, together with European and international best practice.
  • Conducting the research process
The research process is mainly conducted using classic methods.
  • Control and assessment of the obtained results
Quality assessment in all steps of the research process in steel production is made based on specific assessment criteria and procedures. In fact, assessment is a continuous process that offers the management, researchers and quality manager’s conclusions about the conduct of the research plan. This method allows for a permanent verification that can further allow the evolutions to be observed and subsequently initiate corrections on time or maintain the course of the research plan of each human resource.
  • Results
In this step, the research process in steel production represents a concrete consequence of the degree to which the research plans have been achieved as they were designed. Taking into consideration the steps and the descriptive elements of the quality management model of the research process in steel production, a mathematical model was created according to the rules and procedures that are specific to the creation of mathematical models, as displayed in Formula (6). So far, what mathematical models have been applied regarding the quality and quality management of the research process in steel production? In terms of the scientific approach to the quality and quality management of the research process in steel production, the mathematical models applied so far relate to the following:
  • Mathematical statistics: applications of the Poisson repartition in quality management [27]; Pearson’s coefficients [28]; the application of the study of correlation coefficients [29]; regression theory as a prediction instrument in quality management [30]; data processing [31].
  • Probability theory: the quality loss function [32]; Six Sigma philosophy [27]; probabilistic models, i.e., [28].
  • Information theory: entropic models i.e., [29,30,31,32,33,34,35]; pseudo-entropic models, i.e., [27].
  • Multi-criterial or multi-objective mathematical programming: optimizing product quality, i.e., [36].
  • Fuzzy systems: the dynamics of standardization processes, i.e., [37].
  • Graphic methods in qualitology: graphic representations, i.e., [28].
  • Time series: dynamic processes, i.e., [38].
  • Algebraic methods: aggregated indicators [39]; the quality loss function [31].
To extend the range of mathematical models applied in the scientific approach to the quality and quality management of the research process in steel production, the authors present their own results and create the following model. The model is a tool for the assessment of quality management in the research process in steel production, with which we can estimate and calculate the final results as a weighted mean of the indicators in each step of this type of quality management.
The mathematical quality management model of the research process in steel production is represented by the mathematical expression in Formula (6).
{ I =   I ( I 1 ,   I 2 ,   I 3 ,   I 4 ,   I 5 )   =   p 1 I 1   +   p 2 I 2   +   p 3 I 3   +   p 4 I 4   +   p 5 I 5 p 1   +   p 2   +   +   p 5   =   1 p 1 , p 2   ,   ,     p 5   0
The analytical expression of the model represents a weighted mean of a global indicator, obtained as a result of the linear combination of the quality levels I 1 ,   I 2 ,   I 3 ,   I 4 ,   I 5 , which were obtained in each step. Evidently, every manager aims to maximize the value of I and the global indicator of quality in order to sum up the maximum values for each step of the research process in steel production.
  • I 1   =   I 1 ( i 1 ,   ,     i n ) , which is the quality indicator of the research plans to achieve the desired objectives and results;   i 1 ,   ,   i n   =     the quality levels of the human resource and their results, as obtained previously during research.
  • I 2   =   I 2 ( i n + 1 ,   ,     i m ) , which is the quality indicator of the followed objectives;   i n + 1 ,   ,     i m   =   output (results) of Step 1.
  • I 3   =   I 3 ( i m + 1 ,   ,     i p ) , which is the quality indicator of the step in which the research process is conducted;   i m + 1 , , i p =   output (results) of Step 2.
  • I 4   =   I 4 ( i p + 1 ,     ,     i s ) , which is the quality indicator of partial evaluation; i p + 1 ,     ,     i s   =   output (results) of Step 3.
  • I 5   =   I 5 ( i s + 1 ,   ,     i r ) , which is the quality indicator of the final results;   i s + 1 ,     ,     i r   =   output (results) of Step 4;   p 1 , p 2   ,   ,     p 5 represent the weights or influence factors chosen by the management in the case of a simulation or real factors obtained through scientific research.
Under these conditions, what is the definition of entropy in the sustainable development of steel production? The subject of entropy and its applications in the management of sustainable development and the subject of innovation have been approached by other authors as well [40,41,42,43,44]. Through its interdisciplinary approach, this section of the paper contributes to the development of this subject.
The concept of sustainability relies heavily on the idea that human activities are dependent on the environment, economy, innovation and sociological factors. Now, more than ever, it is essential to initiate a dialogue in order to further identify pertinent measures for the future. It is well known that mathematical modelling provides useful instruments for making connections between economic, social and environmental data. Such mathematical models help create databases that can be processed by means of modern software, thus reaching pertinent and relevant conclusions for decision-making processes. The mathematical model set forth in the present paper is a probabilistic model.
In the study entitled “A mathematical theory of communication” (1948), Claude Shannon defined the concept of entropy as a measure of the quantity of indeterminacy obtained by a finite probability field [45,46]. By analogy, this study defines entropy in sustainable development of steel production (H(SP)) as the degree of the unknown regarding the accomplishment of sustainable development characteristics and innovation at time t.
For n quality characteristics, x QC 1 t ,   x QC 2 t ,   ,     x QC n t , where p 1 t = P ( ( x QC 1 t > α 1 | I t ) ) ,   p 2 t = P ( ( x QC 2 t > α 2 | I t ) ) , ,   p n t = P ( ( x QC n t > α n | I t ) represent the conditional probabilities that the values of the n characteristics of sustainable development and innovation will be higher than the values of α 1 ,   α 2 , ,   α n ; therefore one may define the SPt as the finite probability field, as expressed in the formula below:
S P t : ( x QC 1 t x QC 2 t   x QC n t p 1 t p 2 t     p n t ) ,   p 1 t + p 2 t +   + p n t = 1
Hence, mathematically, entropy in the sustainable development of steel production at a time t may be calculated as follows:
  H n ( S P t ) =   k = 1 n p k t log p k   t
where H n ( S P t ) is the entropy in sustainable development of steel production at timet; I t is the innovation level at time t [40]; log p k t is a logarithmic function in a base higher than 1, applied to the p k t value.
In order to make sure that the H n ( S P t ) definition is accurate, let us assume that the p k t log p k t term is equal to 0, when p k t = 0.
  • Entropy in the sustainable development of steel production is always positive for any probabilities higher than or equal to 0, whose sum equals 1.
  • If a probability is 1 and the others are 0, then the entropy in sustainable development is null.
Obviously, the entropy in the sustainable development of steel production at time t will be at the maximum in the case of maximum uncertainty. Studies on the quality entropy and the entropy in sustainable development are currently in an embryonic phase.

4. Conclusions

Steel production is influenced by both qualitative and quantitative factors. Meanwhile, the actions exerted by the economic environment are obvious. Thus, the pace of economic growth, the development of steel-consuming industries, and the support policies promoted by authorities in different countries impact steel production through direct or indirect channels. In addition, one should note the excessive orientation of certain countries toward achieving and exporting this material. The example of China is noteworthy in this regard as its supremacy is still undeniable. That said, in 2015, steel production fell for the first time since 1981 (2.29% compared to the previous year) amid a clear surplus (about 300 million tons per year), and losses were suffered by producers, but this was offset to some extent by massive exports to Europe due to the reduction in oil and transport prices. In this context, the application of European trade defense policies and the promotion of local competitiveness could have affected the sustainability of the steel industry.
In order to optimize, rationalize, and materialize sustainable development efforts, metallurgical engineers should improve them by means of their own efforts within the framework created by the steel industry and by applying mathematical modelling. Furthermore, the conclusions of this paper are that, in order to achieve sustainable development, new action plans are required that continuously adapt to the innovations and changes in society. The correlation and comparison between new values of the entropy in the sustainable development of the steel industry and the known ones may provide decision makers with new pieces of information, knowledge and data.

Acknowledgments

This project was financed by the Lucian Blaga University of Sibiu research grants LBUS-IRG-2016-02.

Author Contributions

Amelia Bucur was responsible for Section 2.1, Section 2.2, and Section 3.2. Amelia Bucur and Gabriela Dobrotă analysed the data. Camelia Oprean-Stan and Cristina Tănăsescu supported the analysis using SPSS software and provided some material for the bibliography. Amelia Bucur, Gabriela Dobrotă, Camelia Oprean-Stan, and Cristina Tănăsescu determined the conclusions. Amelia Bucur, Gabriela Dobrotă, Camelia Oprean-Stan, and Cristina Tănăsescu wrote the paper.

Conflicts of Interest

The authors declare no conflict of interest. The founding sponsors had no role in the design of the study, in the collection, analyses or interpretation of data, in the writing of the manuscript, nor in the decision to publish the results.

References

  1. Glosh, S. Steel consumption and economic growth: Evidence from India. Resour. Policy 2006, 31, 7–11. [Google Scholar]
  2. Rebiasz, B. Polish steel consumption, 1974–2008. Resour. Policy 2006, 31, 37–49. [Google Scholar] [CrossRef]
  3. Crompton, P. Forecasting steel consumption in South-East Asia. Resour. Policy 1999, 25, 111–123. [Google Scholar] [CrossRef]
  4. Ozkan, F. Steel industry and the sector’s impact on economical growth in Turkey. Reg. Sect. Econ. Stud. 2011, 11, 47–58. [Google Scholar]
  5. Amza, G.; Dobrotă, D. Risk estimation of air pollution produced by a welded construction company. Metalurgija 2012, 51, 494–496. [Google Scholar]
  6. Kjellstrom, T.; Lodh, M.; McMichael, T.; Ranmuthugala, G.; Shrestha, R.; Kingsland, S. Air and Water Pollution: Burden and Strategies for Control. In Disease Control. Priorities in Developing Countries, 2nd ed.; Jamison, D.T., Breman, J.G., Measham, A.R., Alleyne, G., Claeson, M., Evans, D.B., Jha, P., Mills, A., Musgrove, P., Eds.; Oxford University Press: New York, NY, USA, 2006. [Google Scholar]
  7. Mohamed, J.; Sasi, B. Air Pollution Caused by Iron and Steel Plants. Int. J. Min. Metall. Mech. Eng. (IJMMME) 2013, 1, 219–222. [Google Scholar]
  8. Wu, X.; Zhao, L.; Zhang, Y.; Zheng, C.; Gao, X.; Cen, K. Primary Air Pollutant Emissions and Future Prediction of Iron and Steel Industry in China. Aerosol Air Qual. Res. 2015, 15, 1422–1432. [Google Scholar] [CrossRef]
  9. Nicolae, A. Contributions Regarding the Development and Operationalization of Metallurgical Ecosociology Knowledge. Metal. Int. 2012, 17, 98–101. [Google Scholar]
  10. Koltun, P. Materials and sustainable development. Prog. Nat. Sci. Mater. Int. 2010, 20, 16–29. [Google Scholar] [CrossRef]
  11. Radović, N.; Kamberović, Ž.; Pania, D. Cleaner Metallurgical industry in Serbia: a road to the sustainable development. Chem. Ind. Chem. Eng. Q. 2009, 15, 1–4. [Google Scholar] [CrossRef]
  12. Mohan, S. Sustainable Development: The implications for Metallurgical Industries. In Proceedings of the International Conference Environmental Management in Metallurgical Industries, Nasirpur, India, 14–16 December 2000; pp. 13–22. [Google Scholar]
  13. Radojicic, M.; Nesic, Z.; Vesic Vasovic, J.; Spasojevic-Brkic, V.; Klarin, M. One approach to the design of an optimization model for selection of the development strategy. TTEM Tech. Technol. Educ. Manag. 2011, 6, 99–109. [Google Scholar]
  14. Radojicic, M.; Nesic, Z.; Vesic Vasovic, J.; Klarin, M.; Spasojevic-Brkic, V. One approach to improving production capacities in the function of reducing the cost. TTEM Tech. Technol. Educ. Manag. 2011, 6, 1328–1334. [Google Scholar]
  15. Bălan, G.; Ungureanu, M.D.G.; Dobrotă, G. Characteristics and tendencies in the steel industry, globally and regionally. Metalurgija 2016, 55, 511–514. [Google Scholar]
  16. Stefănescu, D.M. Science and Engineering of Casting Solidification; Springer: London, UK, 2015. [Google Scholar]
  17. Chen, M.; Wang, W. A linear programming model for integrated steel production and distribution planning. Int. J. Opt. Prod. Manag. 1997, 17, 592–610. [Google Scholar] [CrossRef]
  18. Brujan Marinescu, L.I. Mathematical Modeling of the Process of Cavity (Blister) Forming and Axial and Non-Axial Segregations in Steel Castings. Metal. Int. 2012, 17, 12–15. [Google Scholar]
  19. Wang, H.; Chu, M.; Guo, T.; Zhao, W.; Feng, C.; Liu, Z.; Tang, J. Mathematical Simulation on Blast Furnace Operation of Coke Oven Gas Injection in Combination with Top Gas Recycling. Steel Res. Int. 2016, 87, 539–549. [Google Scholar] [CrossRef]
  20. Bucur, A. Contributions to the Scientific Approach to Quality and Quality Management through Modelling and Simulation; Lucian Blaga University of Sibiu Publishing House: Sibiu, Romania, 2015. [Google Scholar]
  21. World Motor Vehicle Production. Available online: www.oica.net/category/production-statistics (accessed on 4 May 2016).
  22. World Steel in Figures 2016. Available online: https://www.worldsteel.org/en/dam/jcr:1568363d-f735-4c2c-a1da-e5172d8341dd/World+Steel+in+Figures+2016.pdf (accessed on 15 April 2016).
  23. World Economic Outlook. Available online: http://www.imf.org/en/publications/weo (accessed on 17 March 2016).
  24. Trends in Steel Usage in the Automotive Industry. Available online: https://www.trefis.com/stock/mt/articles/296912/trends-in-steel-usage-in-the-automotive-industry/2015-05-19 (accessed on 16 February 2016).
  25. Oprean, C.; Kifor, C.V. Quality Management; Callidus Publishing House: Wismar, Germany, 2008. [Google Scholar]
  26. Ridha, M.; Elgamal, M.A. A macro model of training and development: Validation. J. Eur. Ind. Train. 1997, 21, 87–101. [Google Scholar]
  27. Isaic-Maniu, A.; Vodă, V.G. A new model in the study of the reliability of products: Pseudo-entropic model. J. Qual. Manag. 2008, 7, 44–47. [Google Scholar]
  28. Isaic-Maniu, A.; Vodă, V.G. Graphic methods in qualitology. J. Qual. Access Success 2006, 6, 58–60. [Google Scholar]
  29. Vodă, V.G. Developing the idea of correlation. Applications. J. Qual. Access Success 2008, 6, 61–63. [Google Scholar]
  30. Militaru, C. Regression Theory as forecasting tool in quality management. J. Qual. Manag. 2008, 6, 44–47. [Google Scholar]
  31. Ţîţu, A.M.; Oprean, C. Experimental Research and Data Processing, Part I; Lucian Blaga University of Sibiu Publishing House: Sibiu, Romania, 2006. [Google Scholar]
  32. Dura, C.; Isac, C. Theoretic substantiation of the function of quality loss in Taguchi’s concept. J. Qual. Access Success 2007, 6, 56–59. [Google Scholar]
  33. Kifor, C.V.; Oprean, C. Quality Engineering. The 6-Sigma Improvement; Lucian Blaga University of Sibiu Publishing House: Sibiu, Romania, 2006. [Google Scholar]
  34. Petrescu, E.; Vodă, V.G. The law of small numbers in the study of product quality. J. Qual. Access Success 2009, 6, 59–63. [Google Scholar]
  35. Oprean, C.; Tănăsescu, C.; Dobrotă, G. Applying Informational Entropy to the Field of Metallurgy. Metalurgija 2016, 55, 135–138. [Google Scholar]
  36. Vasile, F. Optimising the product quality level. J. Qual. Access Success 2006, 1, 54–55. [Google Scholar]
  37. Gogoncea, D. Applying fuzzy systems in the dynamic of global standardisation processes. J. Qual. Access Success 2006, 10, 53–55. [Google Scholar]
  38. Boşcaiu, V.; Vodă, V.G. Applications of vectorial time series in quality control. J. Qual. Manag. 2008, 11, 46–47. [Google Scholar]
  39. Todoruţ, A.V. Assessing the level of quality through the quality indicators of products divisible by quality. J. Qual. Manag. 2008, 9, 54–58. [Google Scholar]
  40. Oprean, C.; Vanu, M.A.; Bucur, A. Sustainable Development Modeling. Manag. Sustain. Dev. 2009, 1, 10–18. [Google Scholar]
  41. Liping, Y.; Zhou, L. Function Based Fault Detection for Uncertain Multivariate Nonlinear Non-Gaussian Stochastic Systems Using Entropy Optimization Principle. Entropy 2013, 15, 32–52. [Google Scholar]
  42. Adamčík, M. The Information Geometry of Bregman Divergences and Some Applications in Multi-Expert Reasoning. Entropy 2014, 16, 6338–6381. [Google Scholar] [CrossRef]
  43. Jingxiong, Z.; Yang, K.; Liu, F.; Zhang, Y. Information-Theoretic Characterization and Undersampling Ratio Determination for Compressive Radar Imaging in a Simulated Environment. Entropy 2015, 17, 5171–5198. [Google Scholar]
  44. Nielsen, K.R.; Reisch, L.A.; Thogersen, J. Sustainable user innovation from a policy perspective: A systematic literature review. J. Clean. Prod. 2016, 133, 65–77. [Google Scholar] [CrossRef]
  45. Dayi, H.; Xu, J.; Chen, X. Information-Theoretic-Entropy Based Weight Aggregation Method in Multiple-Attribute Group Decision-Making. Entropy 2016, 18, 171. [Google Scholar]
  46. Sâmboan, G.; Dumitrescu, M.B. Mathematical Elements for Biologists; University of Bucharest Publishing House: Bucharest, Romania, 1984. [Google Scholar]
Figure 1. The evolution of car production.
Metals 07 00163 g001
Figure 2. Evolution of Global Steel Production.
Metals 07 00163 g002
Table 1. Evolution of car production (number of cars produced).
YearsWorldEUUSChina
200058,374,16217,142,14212,799,8572,069,069
200156,304,92517,218,93211,424,6892,334,440
200258,840,29916,948,07812,274,9173,251,225
200360,663,22517,973,32112,114,9714,443,686
200464,165,25518,326,74811,989,3875,070,527
200566,482,43918,385,31711,946,6535,708,421
200669,257,91418,673,98211,263,9867,188,708
200773,266,06119,724,77310,780,7298,882,456
200870,526,53118,432,0708,705,2399,345,101
200961,762,32415,289,9925,709,43113,790,994
201077,583,51917,078,8257,743,09318,264,761
201179,880,92017,522,3408,661,53518,418,876
201286,615,35017,522,3408,661,53518,418,876
201387,310,83416,317,79611,066,43222,116,825
201489,776,46517,127,46911,660,70223,722,890
201590,780,58318,177,48112,100,09524,503,326
Source: data from [21].
Table 2. Apparent steel consumption between 2000 and 2015 in million tons.
YearsWorldEUUSChina
2000756.6162.6114.7124.3
2001774.5159.3103.8153.6
2002814.7156.3102.7186.3
2003894.8157.8100.4247
2004974.3167.2115.6272
20051026161.4107.1326.8
20061113.2179.3119.6356.2
20071220.2199.5108.3418.4
20081226.1184.998.4446.9
20091150.7120.459.2551.4
20101308.2145.379.9587.6
20111411.8155.589.2641.2
20121439.3139.296.2660.1
20131528.4140.495.7735.1
20141537.3146.8106.9710.8
20151544.4149.9106.5707.2
Source: data from [22].
Table 3. Trends in the evolution of the analysed indicators 2015/2014 (%).
LevelQsQaRe
World −2.8 +1.1 +3.3
EU −1.83 +6.1 +1.9
US −10.58 +3.8 +3.1
China −2.29 +3.3 +6.9
Qs: steel production; Qa: automotive production; Re: economic growth rate.

