Article

Effect of Strain Range on the Low Cycle Fatigue in Alloy 617 at High Temperature

1
Department of Mechanical Design Engineering, Pukyong National University, Busan 48547, Korea
2
Korea Atomic Energy Research Institute (KAERI), Daejeon 305‐353, Korea
*
Author to whom correspondence should be addressed.
Metals 2017, 7(2), 54; https://doi.org/10.3390/met7020054
Submission received: 28 December 2016 / Accepted: 7 February 2017 / Published: 10 February 2017

Abstract

:
The aim of this study is to investigate the fully-reversed low cycle fatigue properties of Alloy 617 in the air at 950 °C; these tests were conducted at total strain ranges from 0.9% to 1.5% with a constant strain rate of 10−3/s. The result of the fatigue tests showed a decrease in fatigue resistance with an increasing total strain range. The reduction of fatigue resistance was due to the effect of the total strain range and microstructure evolution during high temperature, such as brittle oxides cracking. At all testing conditions, the cyclic softening mechanism was observed as a function of the total strain range in the current high temperature condition. An analysis of low cycle fatigue resistance was performed using the Coffin–Manson relationship and the total strain energy density; it was found that Alloy 617 followed these relationships well. In addition, this study compared well with previous work reported in the literature for a similar testing condition. Post-fracture analysis on the fracture surfaces of failed specimens revealed a more severe damage cracking at the periphery of specimens due to the increase in the total strain range. The surface connected grain boundary cracks induced by oxidation were obvious at low strain range. Thus, the primary crack propagation occurred in transgranular mode from persistent slip bands.

1. Introduction

The very high temperature gas cooled reactor (VHTR) is considered as a candidate design for Generation IV (Gen IV) reactors to authorize the eventual operation in the thermal and core outlet temperature of 950 °C. Materials of potential interest include nickel Alloy 800H, Alloy 617 and Hastelloy X of the VHTR main components, including the intermediate heat exchanger (IHX) and hot gas duct (HGD) [1,2]. The VHTR is designed for a life span of 60 years and will be exposed to a very high temperature environment. Therefore, in the high temperature design, creep resistance, creep-fatigue resistance, oxidation and corrosion resistance, and also phase stability should be satisfied. Alloy 617, a Nickel-based superalloy, is a leading candidate material for IHX and HGD because of its excellent high-temperature mechanical properties, formability, and weld ability [3]. Alloy 617 is strengthened by solid solution hardening provided by the alloy chemical compositions of chromium, cobalt, and molybdenum. The strengthening process of this Alloy 617 is granted by the hardening precipitates of Alloy carbides, which provide excellent fatigue resistance at high temperature processes [3,4]; the high temperature oxidation resistance is derived from the high nickel and chromium content. The Alloy 617 is expected to provide good thermal stability for components of power generating plants with high temperature strength up to 950 °C [5].
In mechanical design components, however, creep and fatigue damages are usually more critical than the other design parameters. Investigation into these design considerations should be carried out, because a significant degradation of mechanical strength may occur in the high temperature condition. Under this circumstance, the cyclic loadings in the low cycle fatigue (LCF) regime describe a main failure mechanism from a temperature-gradient-induced thermal strain during operation, as well as startups and shutdowns and power transients or temperature change of flowing coolant [5,6]. In the state-of-the-art, fatigue damage accumulation as a stress and strain concentration during cyclic loading is potentially causing the crack initiation site and propagation onwards [7]. Therefore, a thorough knowledge of the elastoplastic behavior is necessary in the design and life evaluation of such components that operate in the high temperature condition. Although Alloy 617 has many superior properties, many researchers have reported that the number of cycles to failure varies widely at high temperatures [5,6,7,8,9]. However, they did not provide sufficient data on the Alloy 617 in the LCF regime over a range of conditions. In fact, a draft Code Case has not been developed to qualify the Alloy 617 for design use. Various LCF data for Alloy 617 used for nuclear application are ongoing research and must be collected to complete the database. The need for fatigue data, such as the influence of total strain ranges, strain rates, and temperatures are necessary for predicting the lifetime of the reactor components. Furthermore, the LCF behavior should be investigated through life data evaluation according to the LCF temperature and total strain range controlled. However, there still remains a need for experiments on the Alloy 617 in high temperature operation with more homogeneous plastic deformation and oxidation behaviors where the cyclic strain might be localized. Thus, many data should be supplemented to provide a baseline draft Code Case to confirm the suitability.
In this study, the LCF tests of Alloy 617 in air environment have been conducted through a series of a fully-reversed strain-controlled strain ratio (Rε = −1) with different applied total strain ranges at 950 °C, according to the ASTM E606. Only the results relevant to the LCF properties and fatigue life were investigated here as a function of the total strain range. In addition, several fatigue damage parameters in the structural material were evaluated through a systematical life analysis, such as stress, strain elements, and energy dissipated during each cycle. Metallography and fatigue slip behavior were discussed so as to study the crack initiation and early micro crack growth of Alloy 617 during high temperature LCF.

2. Experimental Procedure

A commercial grade Alloy 617 is approved for construction of nuclear facility components in the ASME Boiler and Pressure Vessel Code Section III Subsection NH Class 1. The composition (wt %) of the Alloy 617 used for material chosen in this study is shown in Table 1. The initial microstructure analysis of Alloy 617 revealed the microstructure with well-uniformed equiaxed grains with the larger grain size of about 70–100 μm, and the fine smaller grain size of about 30–40 μm, as shown in Figure 1. The Alloy 617 has a fine microstructure with a fully austenitic matrix. The tensile test specimens were machined into a rectangular cross-section with a gage length of 28.5 mm, width of 6.25 mm, and thickness of 1.5 mm. LCF specimens were fabricated in cylindrical shape with a diameter of 6.0 mm in the reduced section with a gauge length of 12 mm. Figure 2 shows the tensile and LCF specimens used in this work. The gage section was parallel to the longitudinal rolling direction and the high-precision extensometer was attached axially to it for collecting the real-time data of the strain on the specimen throughout the duration of LCF testing.
A closed loop 100 kN servo hydraulic testing machine (MTS 370 Landmark, Eden Prairie, MN, USA) was used and equipped with a tube furnace for heating the specimens of Alloy 617 in open air, as shown in Figure 3. The three temperature zones (top, center, bottom zone) were measured with each thermocouple attached on the furnace to monitor the temperatures within the gage section of the specimens. Therefore, the temperature was maintained within ±2 °C of the nominal temperature throughout the test. Before the commencement of the test, the specimen was held at a target temperature with zero load for about 30 min to allow the temperature to stabilize. We performed fully-reversed (strain ratio, Rε = −1) strain control cycling tests of Alloy 617 at the 950 °C temperature condition regarding the different applied total strain ranges, i.e., 0.9%, 1.2%, and 1.5%. A triangular waveform (continuous cycling) and a constant strain rate equal to 10−3/s was applied. At least 200 data per cycle were generated using an extensometer clamped to the gage section of the specimen. The failure criterion was defined as the number of cycles, which means a 20% reduction in the stress ratio (peak tensile-compressive stress ratio) in order to separate the effect of softening or hardening behavior of the material under cyclic loading. The fracture surface of the selected specimens was examined by use of a scanning electron microscope (SEM, Hitach JEOL JSM 5610, JEOL Ltd., Tokyo, Japan), and optical microscope (OM, JP/GX51, Olympus Corp., Tokyo, Japan) in order to identify the crack nucleation and modes of propagation.

3. Results and Discussions

3.1. Monotonic and Low Cycle Fatigue Properties

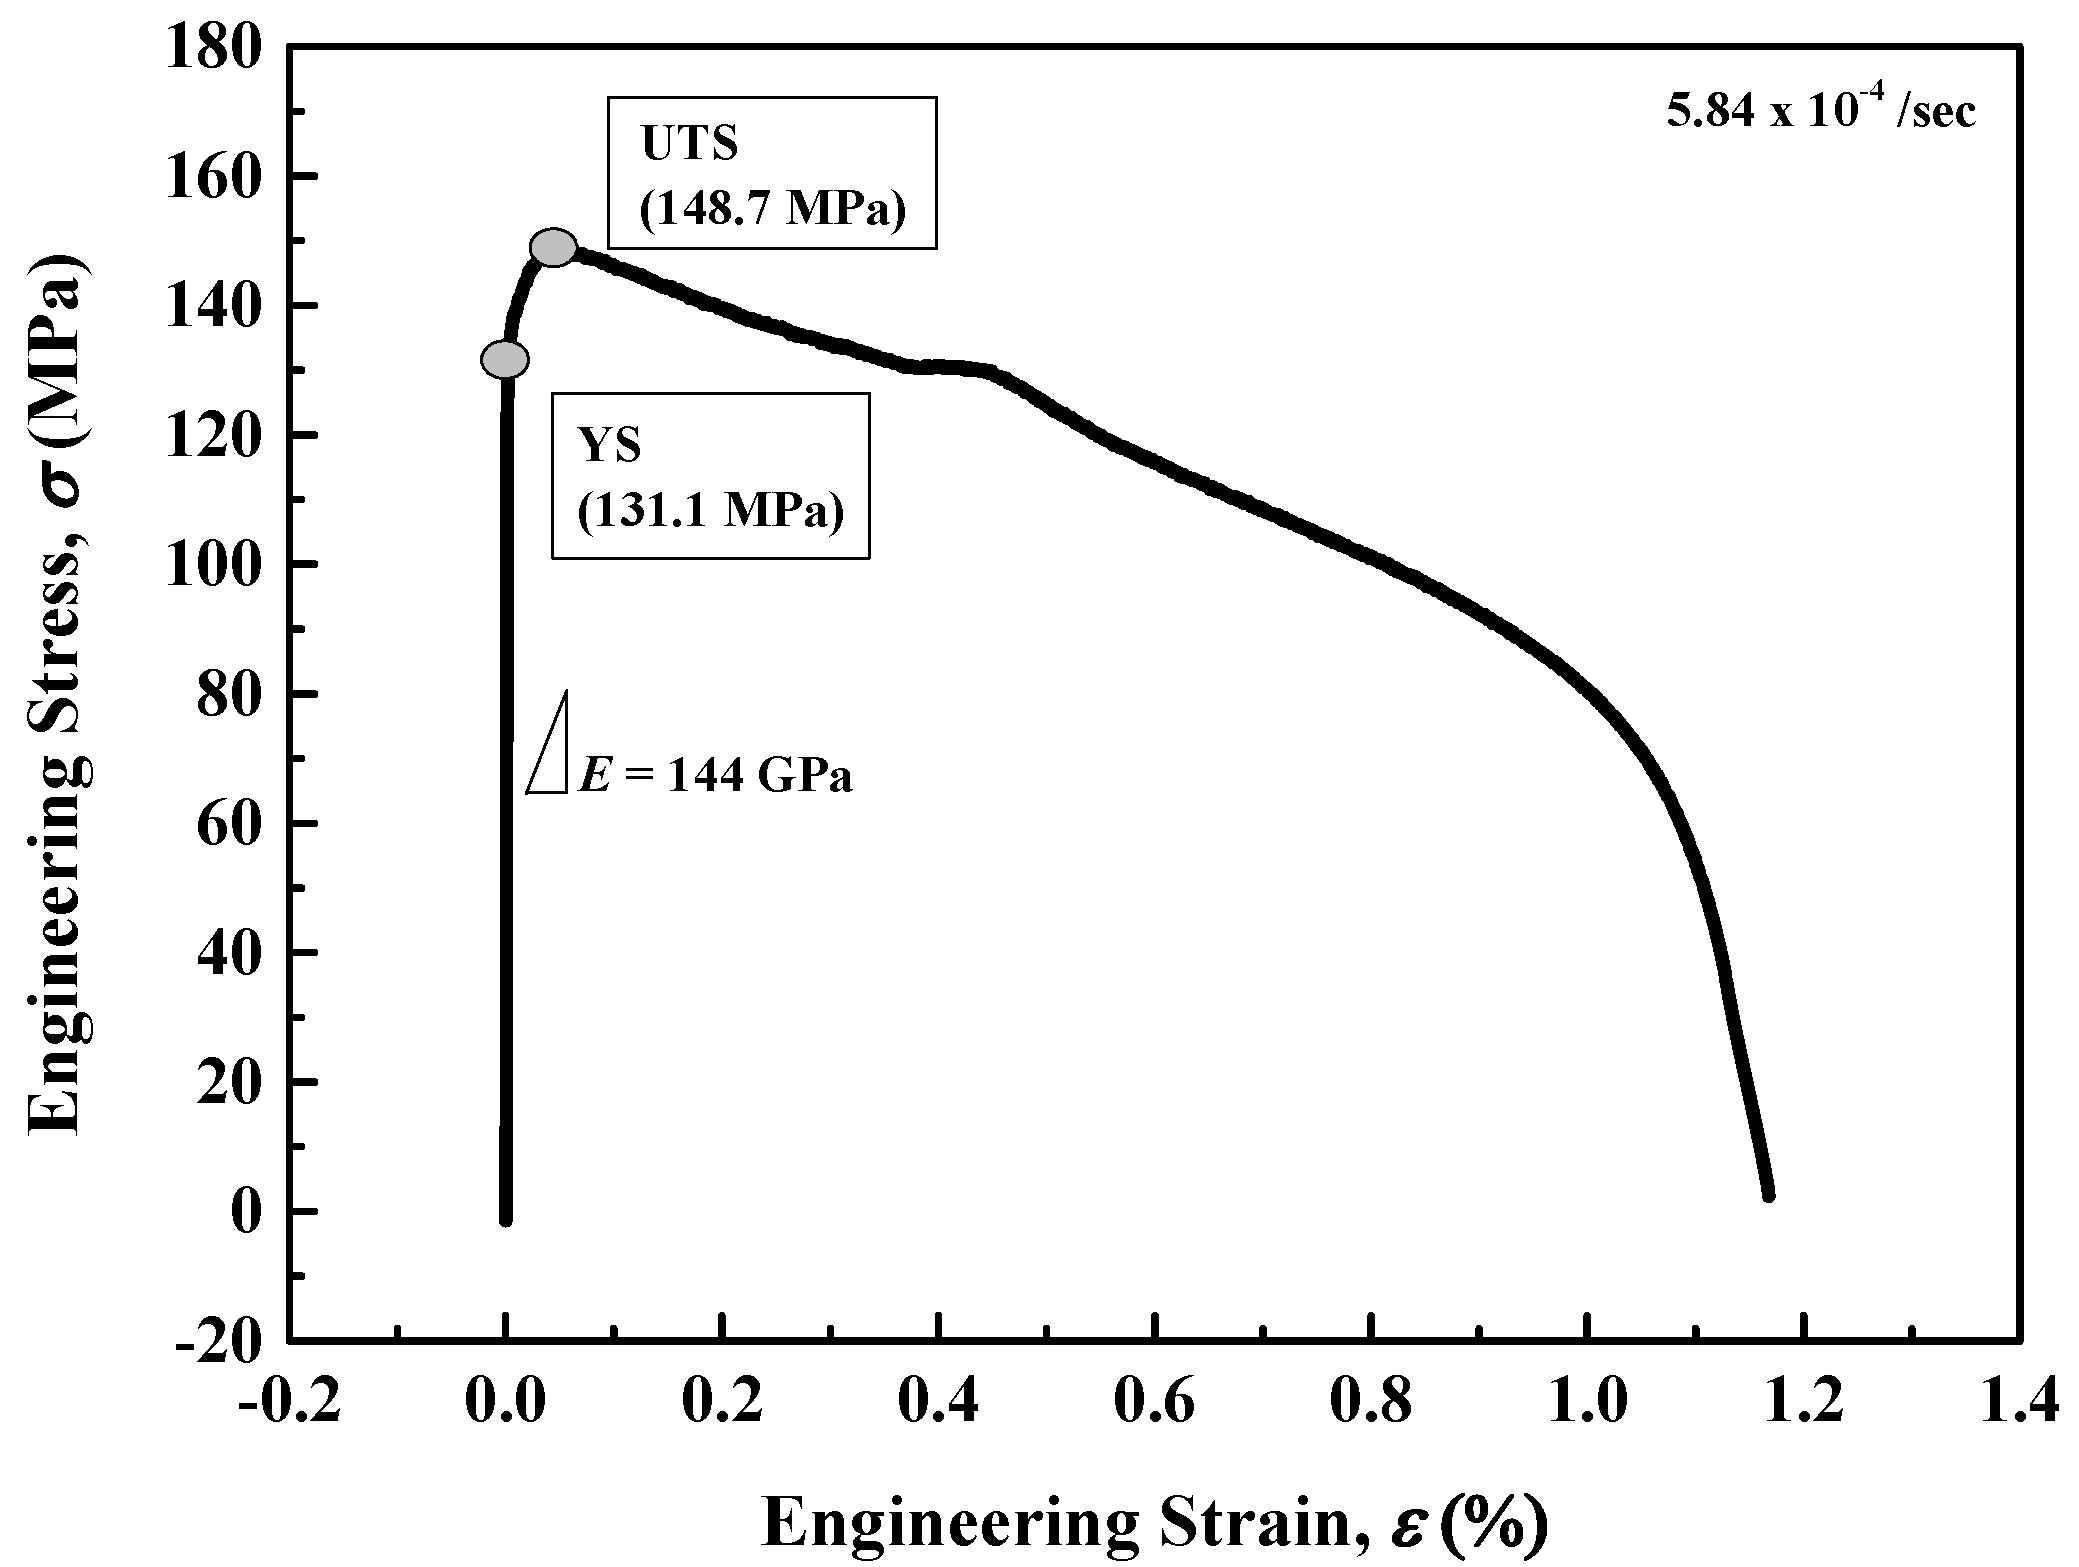
Figure 4 shows the tensile test of Alloy 617, with a strain rate of 5.85 × 10⁻⁴/s at 950 °C that was first done as a reference data for better understanding and explanation of fracture behavior. It is notable that the yield strength (YS) and the ultimate tensile strength (UTS) values were determined from the area in which the plastic deformation occurred (non-uniform) along the engineering stress–strain relationship, as well as with the highest stress magnitude during deformation behavior, respectively. The elastic modulus was calculated according to the slope in the elastic region, which is in good agreement with that reported in the literature [5]. The tensile elongation and reduction of area (as a definition of material ductility) are also in accordance with the literature.
LCF testing of Alloy 617 was completed in air at 950 °C regarding the different applied total strain ranges to provide a baseline data for the fatigue behavior. Table 2 reports the LCF test total strain condition, cycles to failure, cycles to initiation, plastic strain range, and stress range at half-life cycle. The results of fatigue tests consistently showed an appropriate decrease of fatigue life as a number of cycles according to the increase in the total strain range. We could find relatively higher plastic strain magnitude results in large plastic deformation which probably induced early crack nucleation. Most of fatigue life is spent in micro crack nucleation. These results could suggest that at higher total strain ranges, the reduction in fatigue life can be taken as being superior to cyclic plastic deformation. However, the stress response behavior was decreased when the total strain range was elevated, which is a definition of the cyclic softening mechanism. This point of view will be explained in the next section according to the cyclic damage mechanism at the very high temperature process.
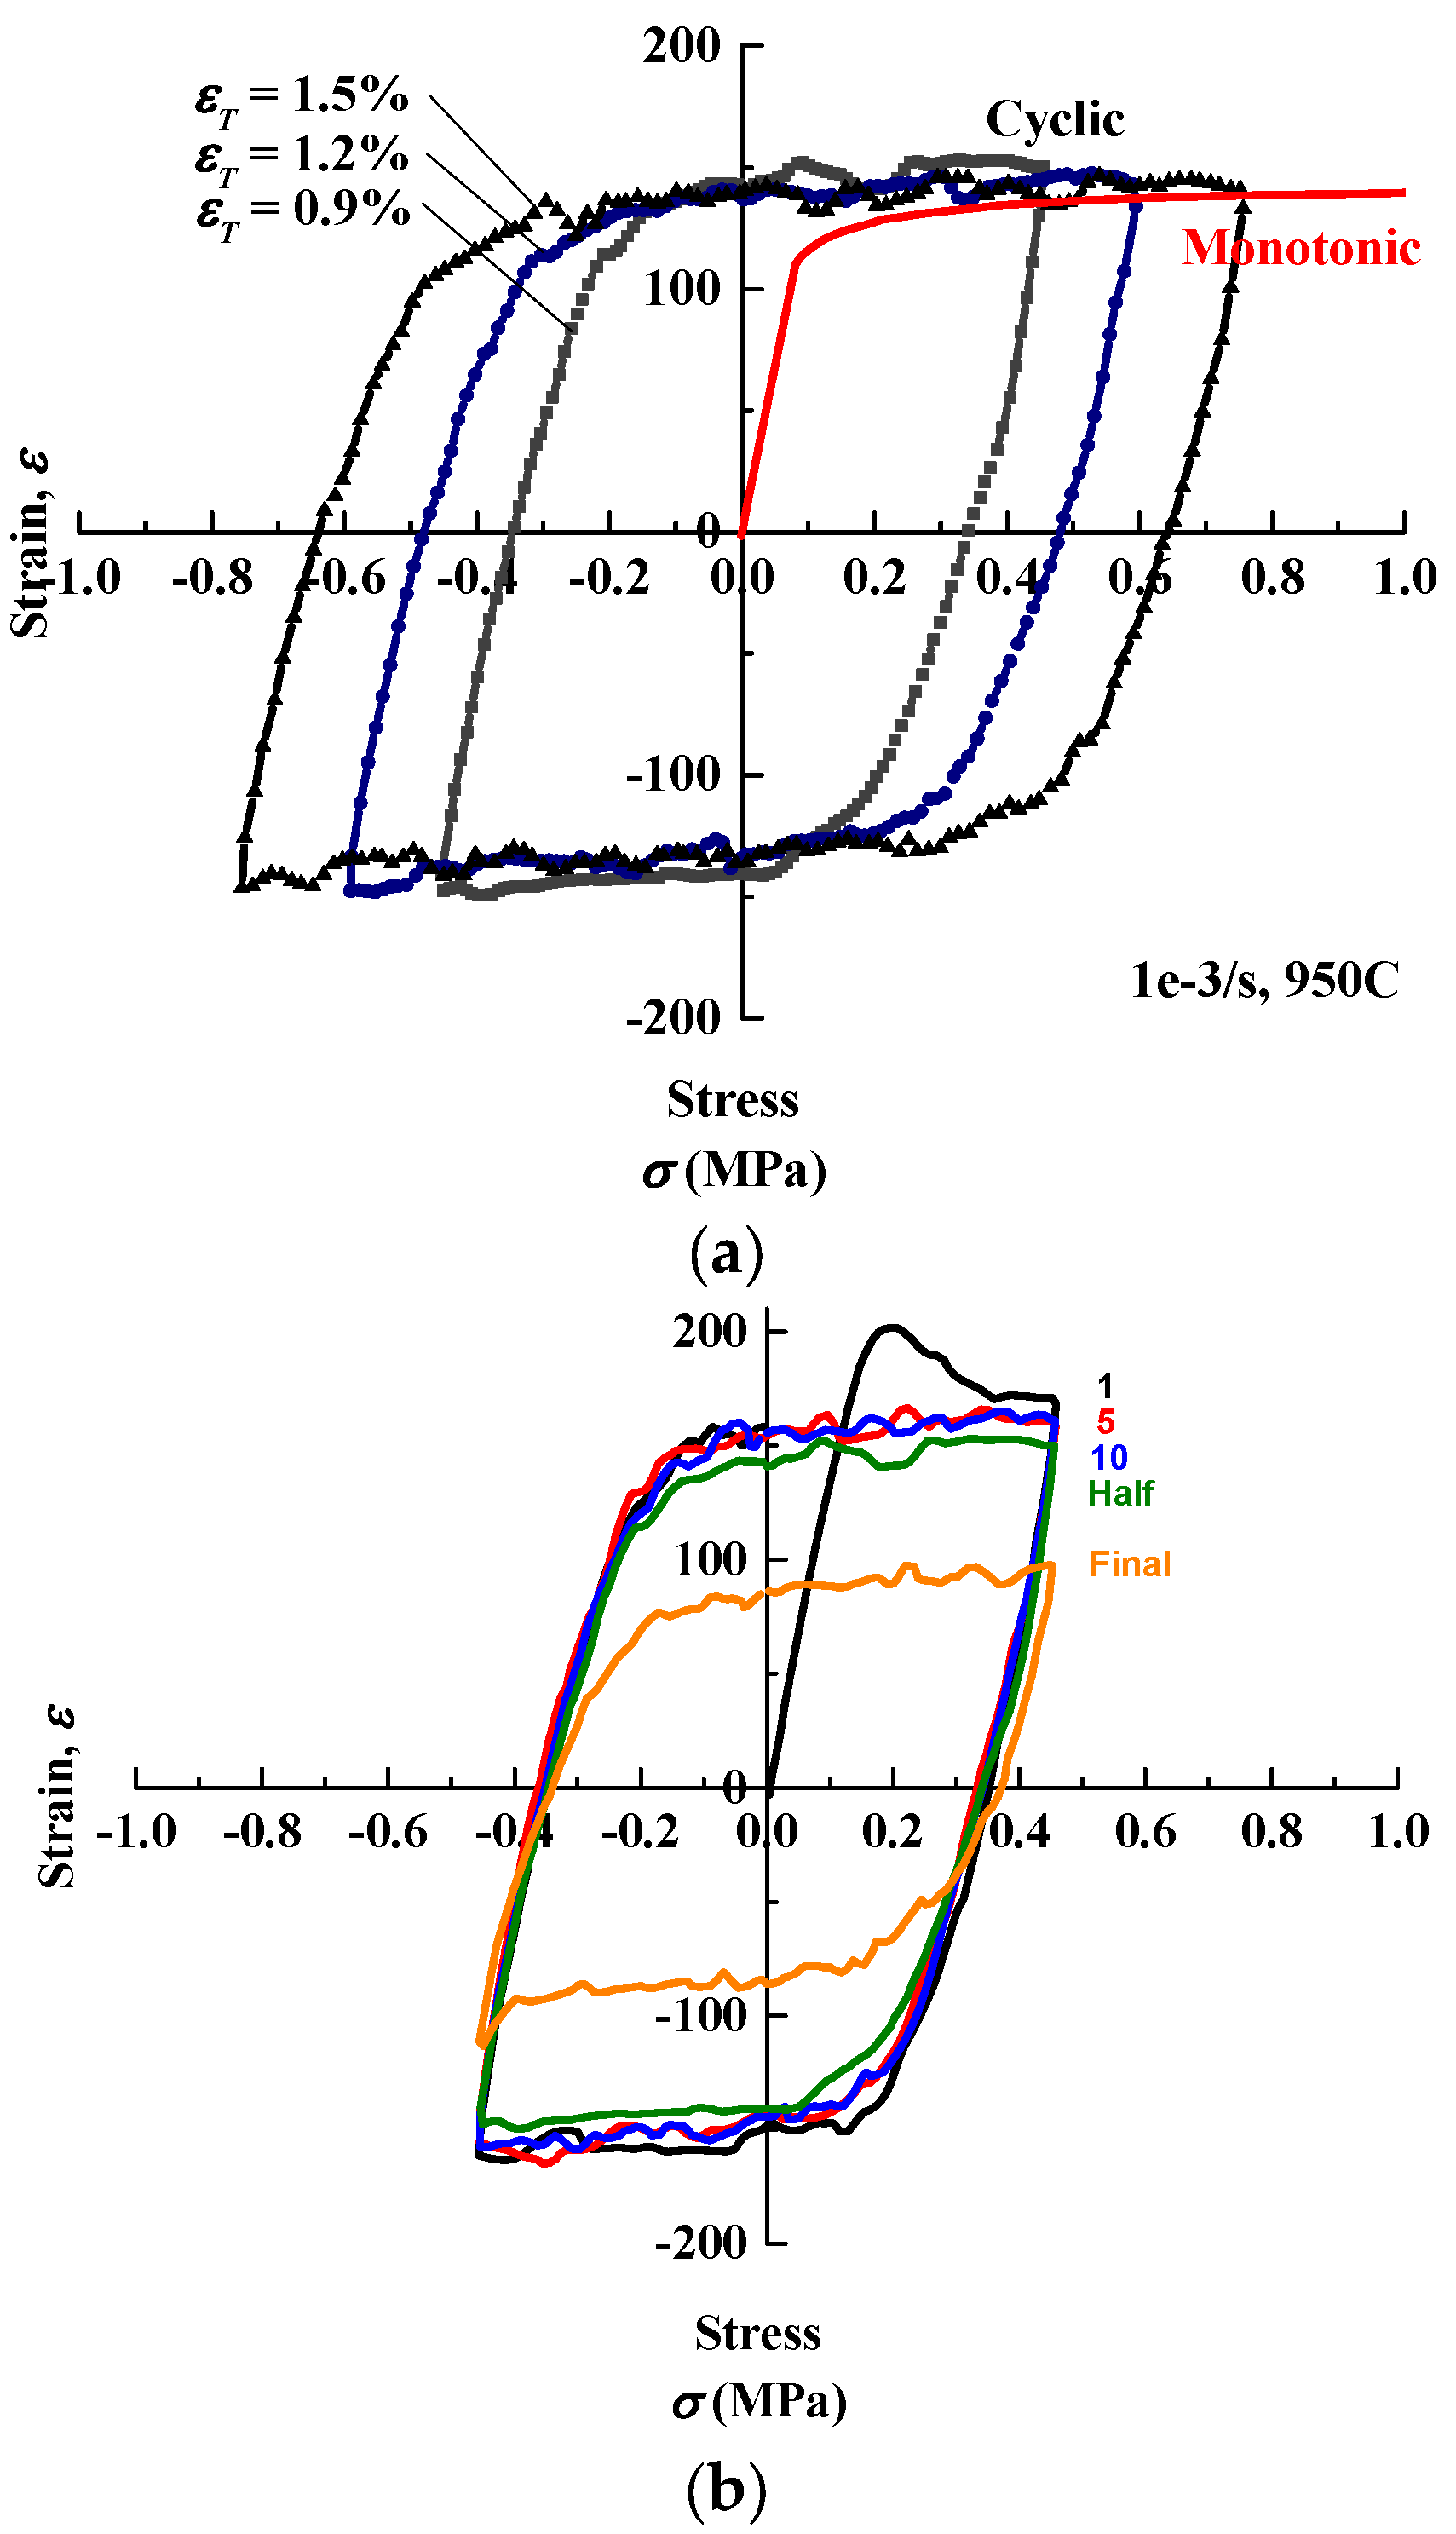
Figure 5a shows the hysteresis loops that represented a reduction in the peak stress response with the increasing total strain range. However, the plastic strain also becomes significantly higher as the shape of the hysteresis loops is wider. Figure 5b shows the interval cycles in the hysteresis loops as a stress–strain response of Alloy 617 tested at 0.9% total strain range. In this phenomenon, a cyclic softening mechanism was observed as the stress response was decreased with the increasing of the number of cycles. The stable cycle phase was reached generally above 10 cycles, therefore, the half-life value is appropriate as the stable behavior during LCF loadings. 
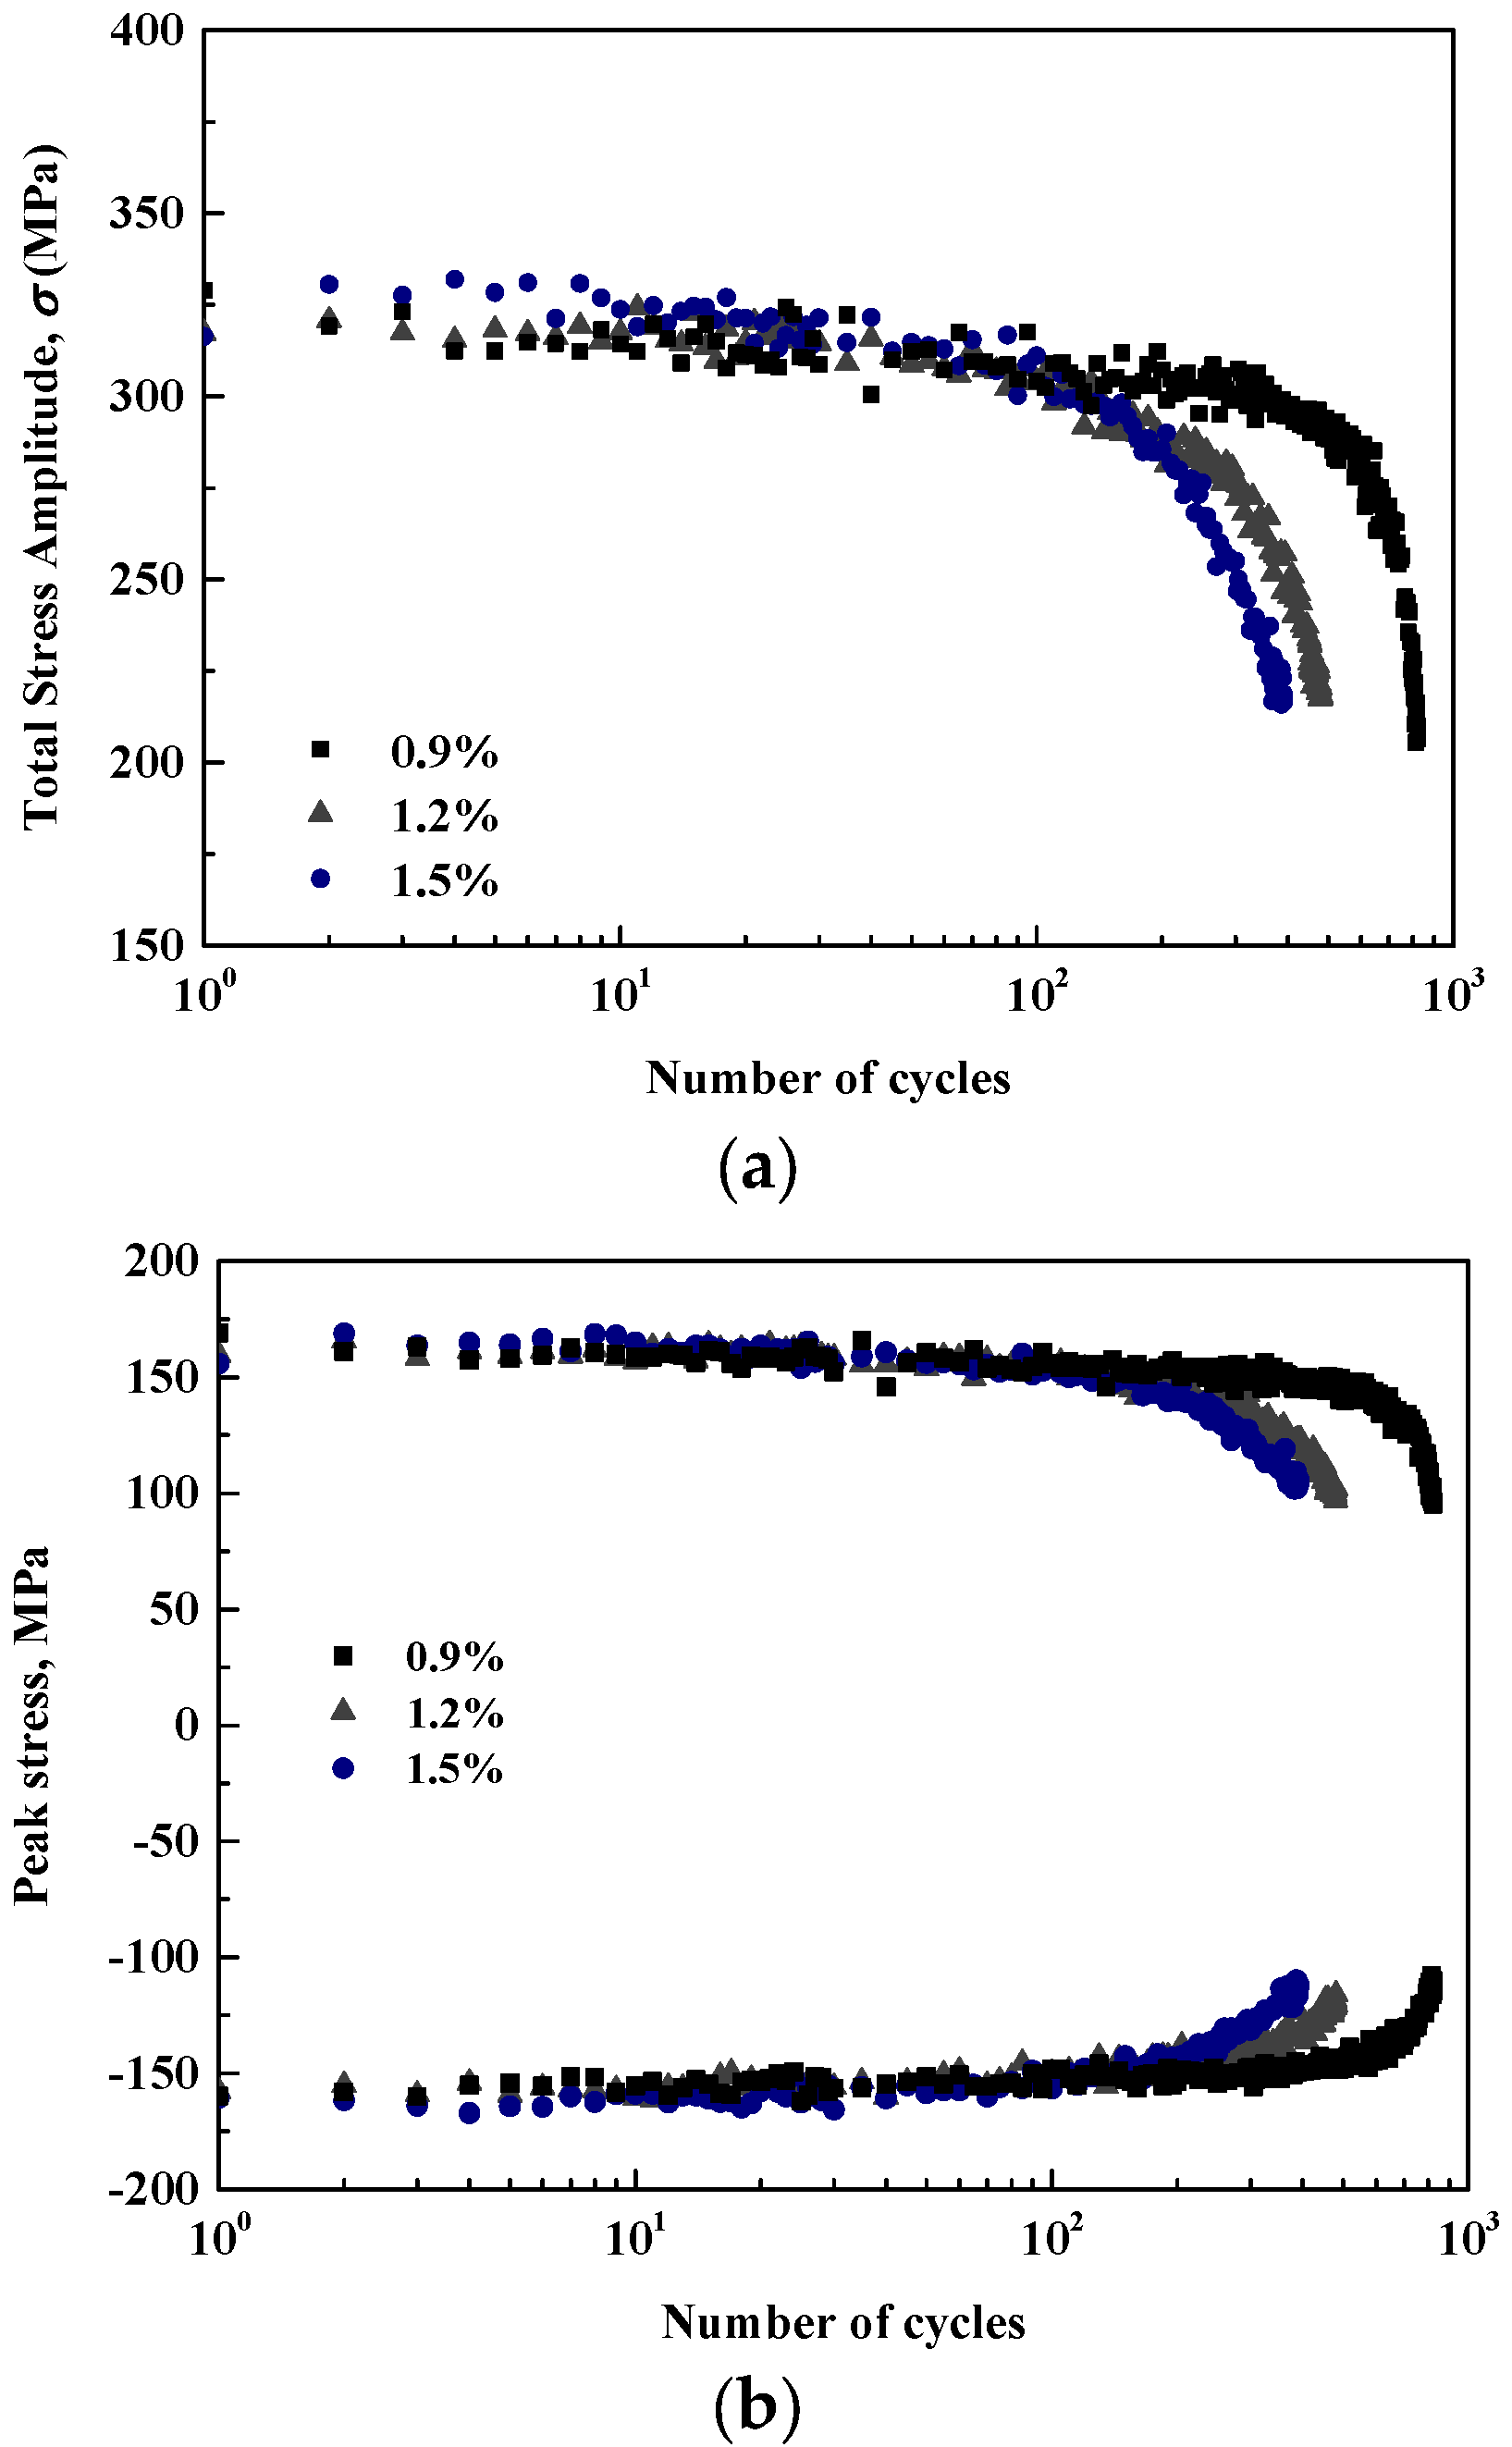
Figure 6 shows the cyclic stress response behavior of Alloy 617 at different applied total strain ranges. Almost all of the stress amplitude paths of Alloy 617 at 950 °C exhibit a cyclic softening region for the major portion of the life, as shown in Figure 6a. At the end of the test, the stress amplitude was decreased rapidly as a formation of macro-crack initiation or just prior to failure. Under the lowest total strain range, i.e., 0.9%, a short saturation phase was also observed with a longer fatigue resistance. Figure 6b shows that the peak tensile and compressive stress response under different applied total strain ranges were of the same magnitude. At all the testing conditions, the peak tensile and compressive stresses as a function of cycle (Figure 6b) reached a stable value within less than 30 cycles. Also, it is noted that the cyclic stress response behavior is consistent with the shape of the cyclic stress–strain hysteresis loops shown in Figure 5.
In this section, the LCF data are systematically analyzed to describe the material properties. The total strain can be determined as plastic and elastic strain elements through the cyclic stress–strain relationship, as described in Equation (1):
Δ ε T 2 = Δ ε e 2 + Δ ε P 2 = Δ σ 2 E + ( Δ σ 2 K ) 1 / n
where ΔεT/2 is the total strain amplitude, Δεe/2 is the elastic strain amplitude, Δεp/2 is the plastic strain amplitude, Δσ is the stress magnitude, E is the elastic modulus, K′ and n′ are the cyclic strength coefficient and cyclic strain hardening exponent, respectively.
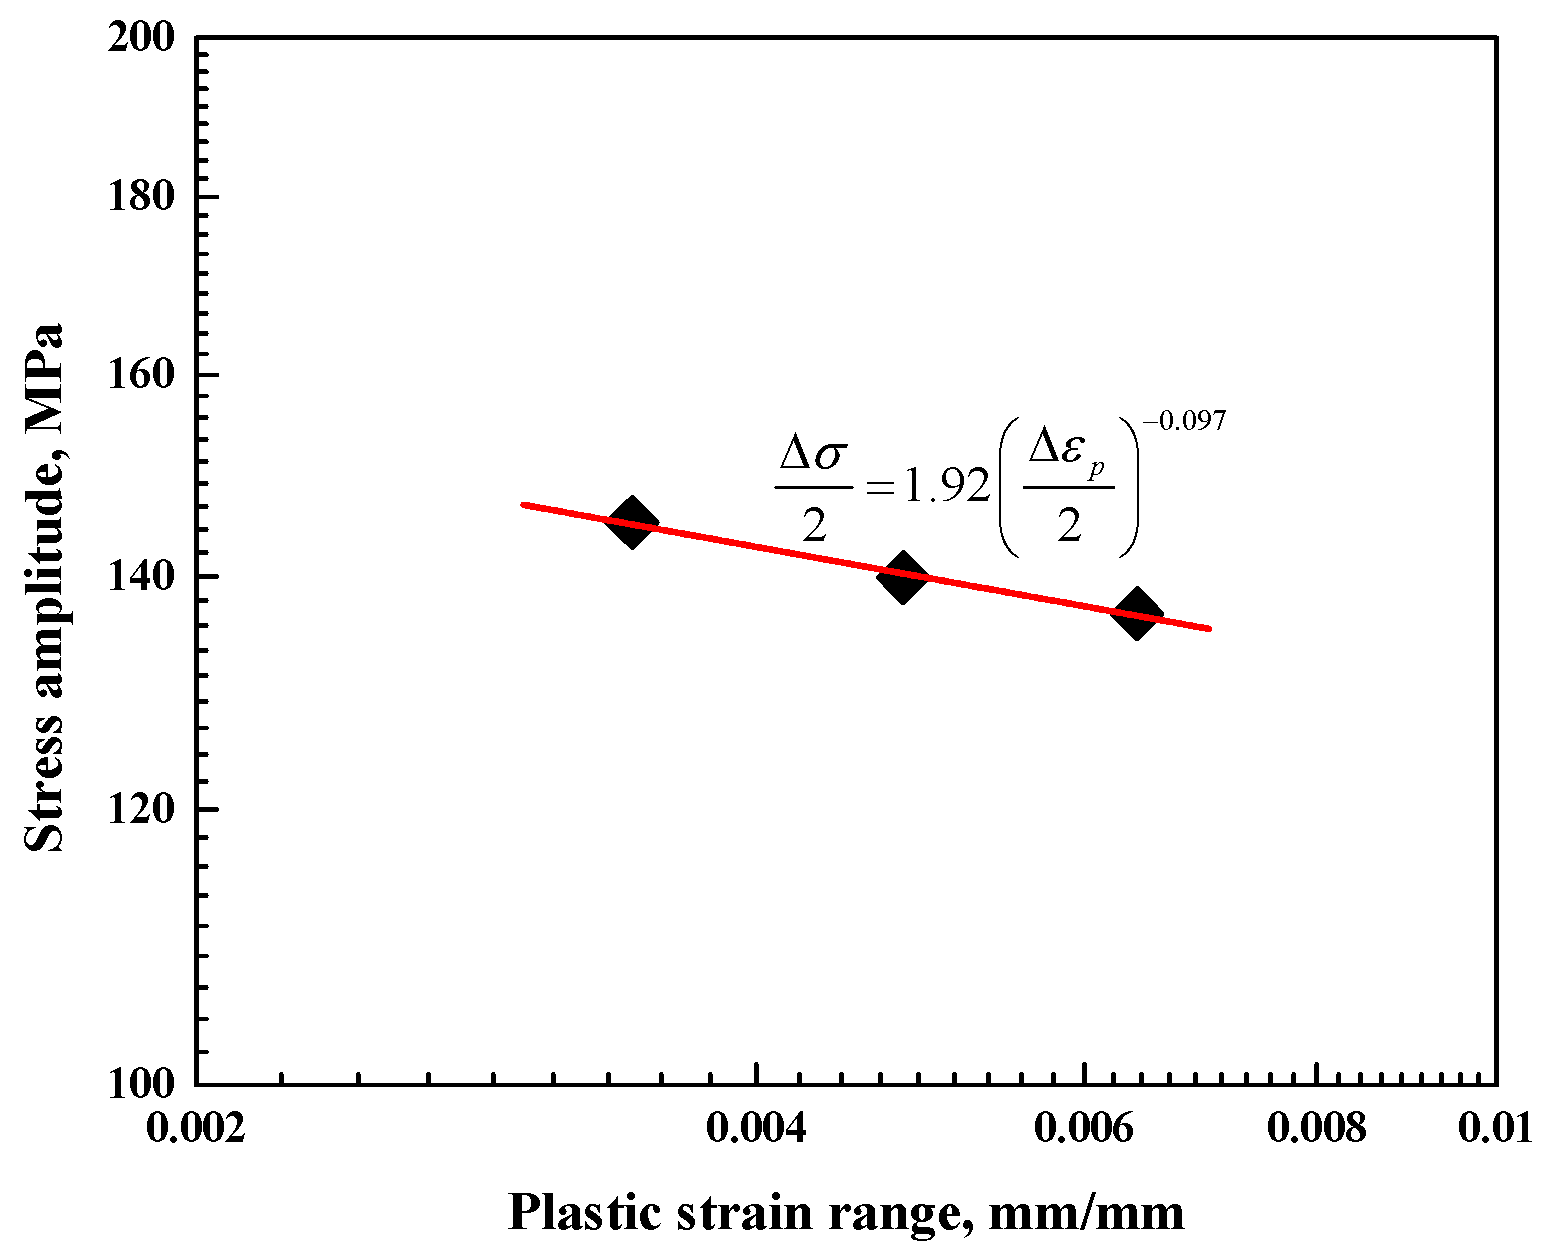
The above equation can be simplified between the stress magnitude and plastic strain components for describing the material response behavior. Using the well-known Ramberg–Osgood relationship, the linear regression can be taken and is provided as a measure to cyclic straining as follows:
Δ σ 2 = K ( Δ ε p 2 ) n
Figure 7 shows the cyclic stress response versus plastic strain amplitude at half-life. The material constants of the Ramberg–Osgood relationship, K′ and n′, can be reasonably obtained through the cyclic stress–strain curves by linear regression of log–log scale. The K′ value was obtained with about 83.2 (MPa), and n′ value was −0.097. The negative sign in the slope means that the stress flow was decreasing continuously with an increase in plastic flow. This cyclic behavior of Alloy 617 indicates the cyclic softening mechanism as a function of the total strain range. This finding is in good agreement with that of the empirical rule (σutsys < 1.2), in which metallic materials will cyclically soften; in this study, we found that (σutsys = 1.134). According to Wright et al. [6], they confirmed that a decrease in peak flow stress followed by an increase in the strain range is characteristic of a solute drag creep deformation mechanism. Also, it has been reported in previous work that a consequence of the solute drag creep mechanism operating during LCF of Alloy 617 at high temperature ranges of 900–950 °C [6,7] was due to the amount of solute atoms motion, which reduces the flow stress.
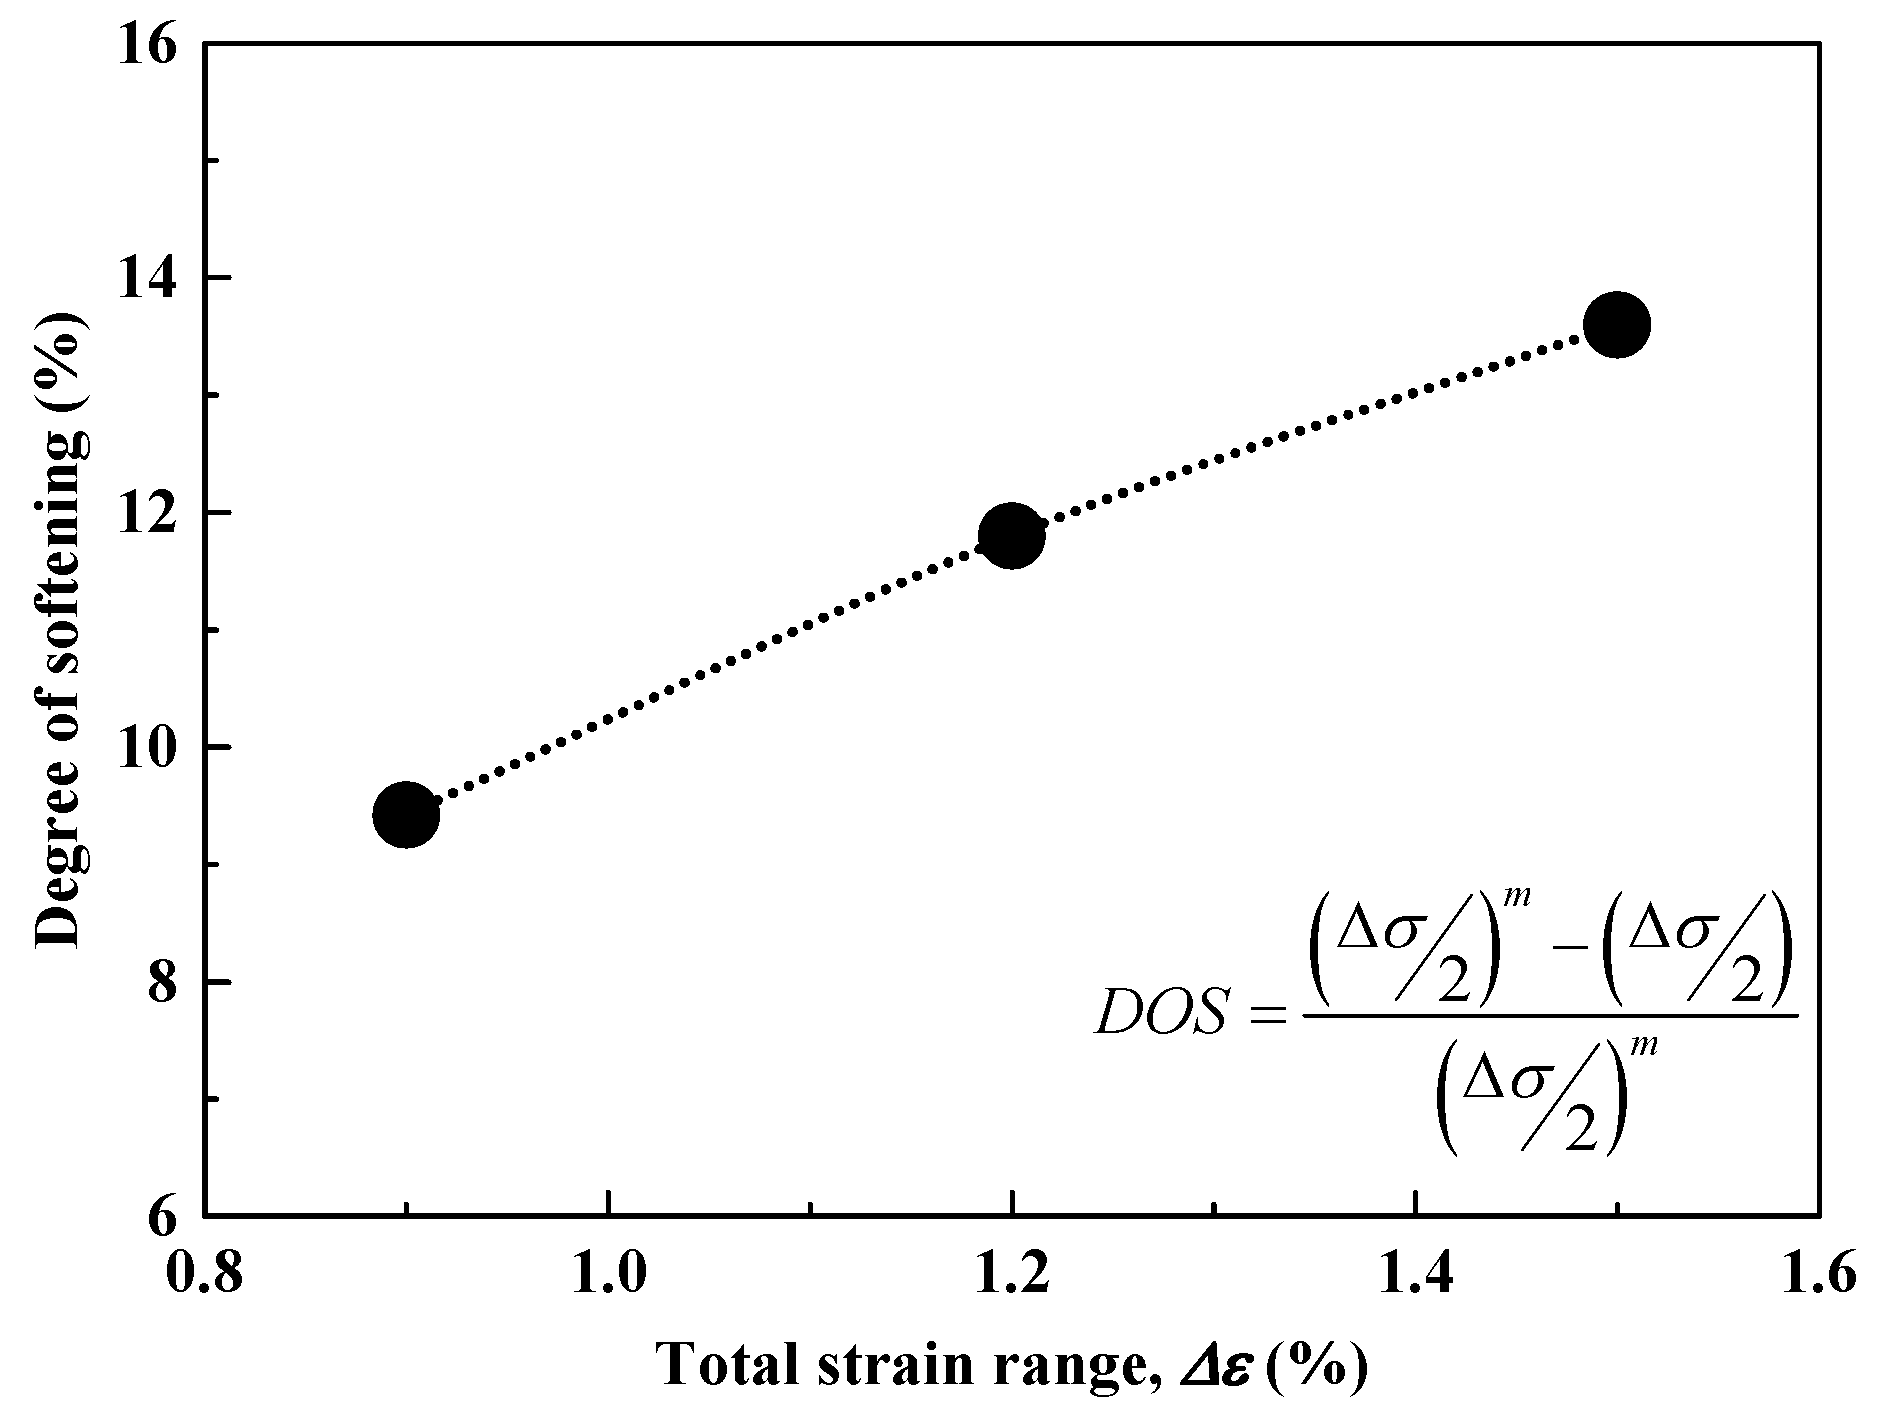
Branco et al. [10] reported that evaluation of the variation of the cyclic softening with the total strain range during cyclic loading can be done through the characterization of the degree of softening (DOS), as given in Equation (3):
DOS = ( Δ σ / 2 ) max ( Δ σ / 2 ) ( Δ σ / 2 ) max
where Δσ/2max and Δσ/2 represent the maximum stress amplitude and the stress amplitude at the half-life, respectively. Figure 8 shows the degree of softening calculated as the total strain range dependency. According to the result, a continuous increase in the softening rate acts as a function of total strain ranges. This mechanism occurred as a decrease in flow stress to enforce the total strain range in the high temperature regime, and thus an increase in the magnitude of the softening rate.

3.2. Low Cycle Fatigue Damage Evaluation

The axial strain control cycling test provides the important information on the strain–life relationship. Therefore, the Alloy 617 may represent a typical Coffin–Manson life dependence on the total strain range. The well-known Coffin–Manson fatigue design method, or strain–life relationship, correlates the number of cycles, Nf, with the strain profile during LCF loadings. This model can be used to model the LCF problem, when the plastic strain range, Δεp, is the same or even larger than the elastic strain range, Δεe. The Coffin–Manson method can be worked out with the stress–strain (log scale) relationship to describe the hysteresis loop and considers the cyclic softening or hardening of the material.
The Coffin–Manson relationship consists of elastic and plastic strain elements. The first approach is the relation between stress amplitude and fatigue life, which in turn determines the elastic strain definition. Equation (4) is proposed:
Δ σ 2 E = σ f E ( 2 N f ) b Δ ε e 2 = σ f E ( 2 N f ) b
where σf is the fatigue strength coefficient, b is the fatigue strength exponent, and 2Nf is the number of reversals to failure. From Equation (4), the material constants can be determined through the linear relationship in a log–log scale using a least square fit method based on experimental data.
The strain based as a dependence parameter can be separated into the plastic and elastic strain ranges. In the LCF regime, the correlation between the plastic strain amplitude and the fatigue life is expressed by:
Δ ε P 2 = ε f ( 2 N f ) c
where εf′ is the fatigue ductility coefficient and 
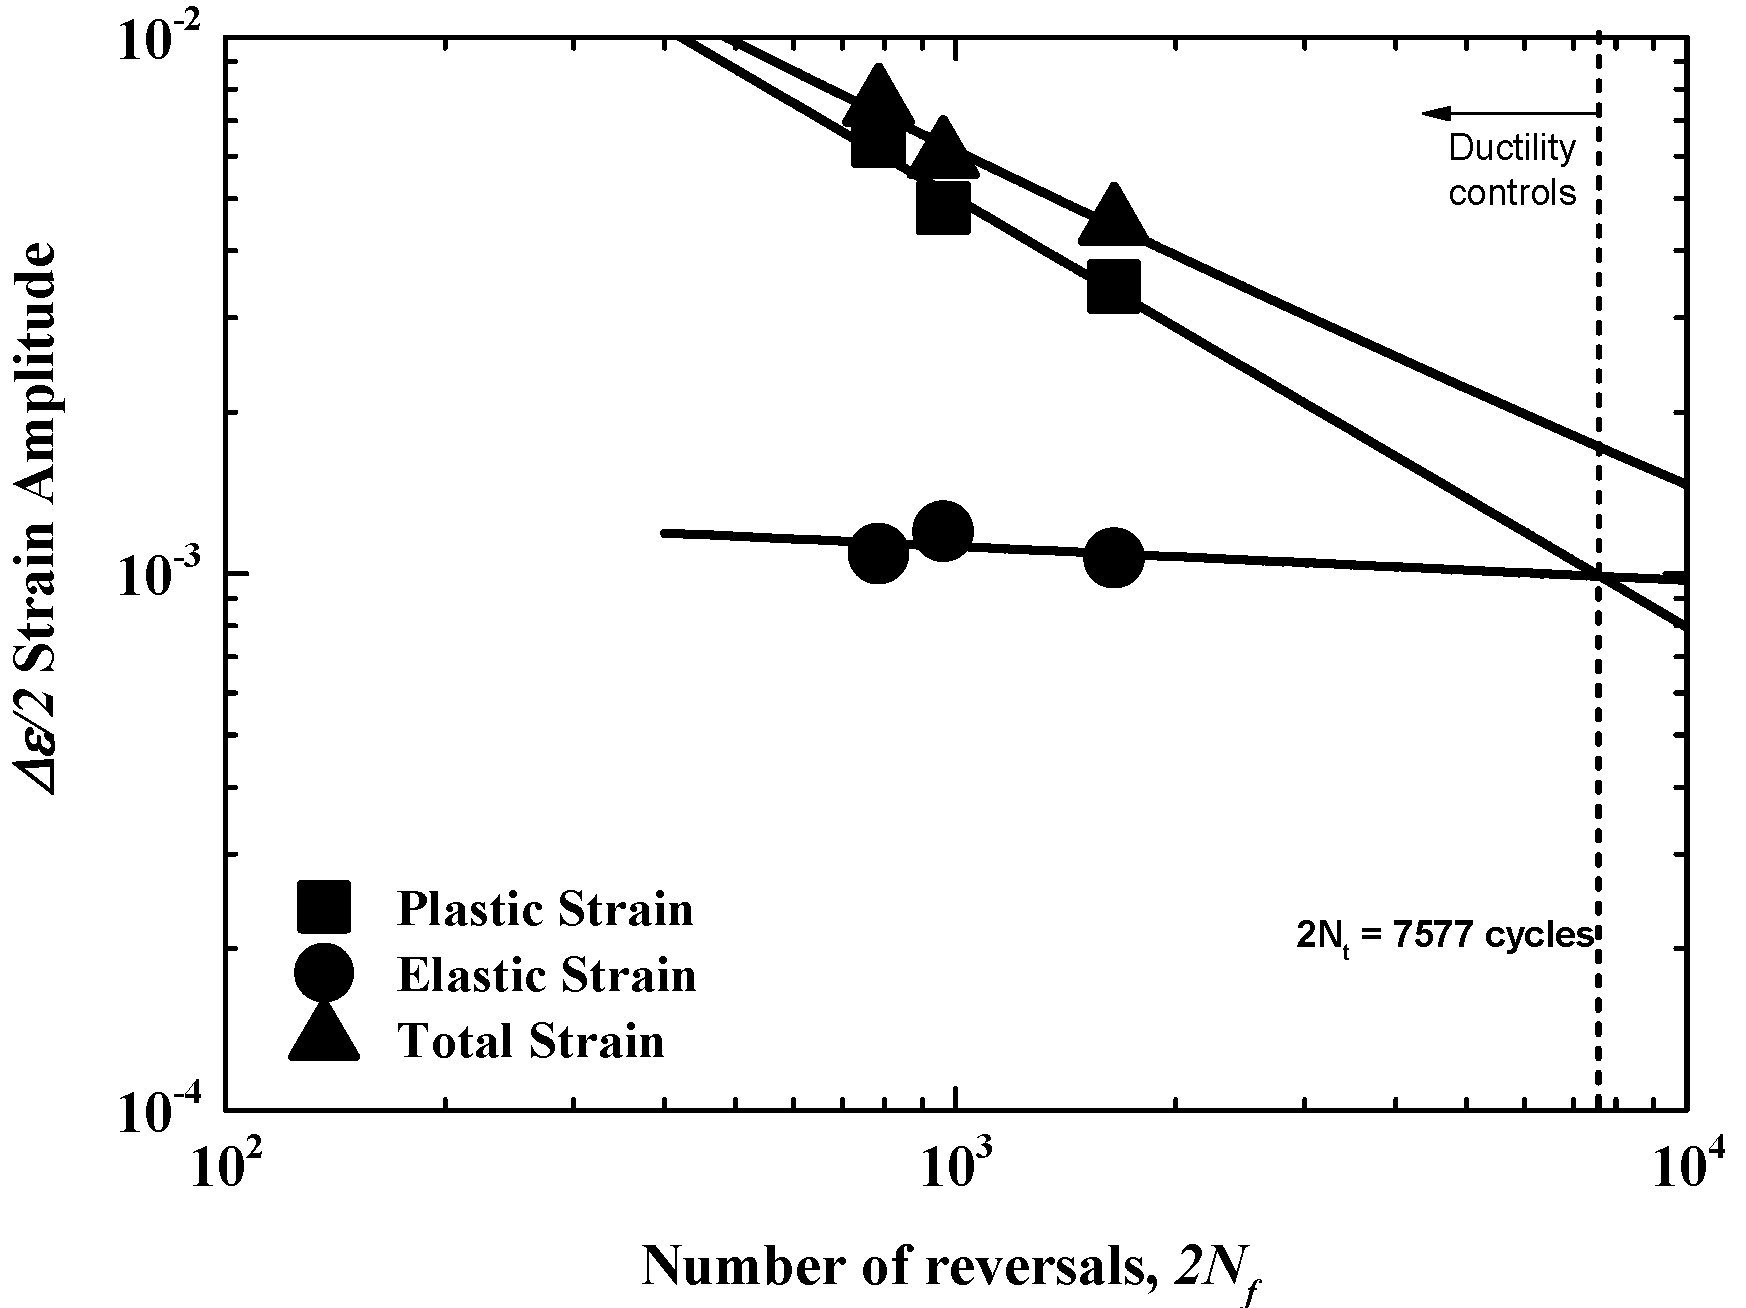
c is the fatigue ductility exponent. The material constants can be determined through the least square fit method as well. Alloy 617 resistance to the total strain ranges can be defined by the summation of its elastic and plastic deformation, which are expressed by Coffin–Manson relationships. Equation (6) graphically represents the Coffin–Manson curves of strain amplitude and the number of reversals to failure, as shown in Figure 9. All material constants are listed in Table 3. The c slope value was determined as about −0.80. This value is comparable to the literature review [6], where they found the c slope of ≈−1 at 950 °C. At all total strain ranges, it could be seen that the plastic regime controlled the fatigue deformation. The domain is in the intersection between the plastic and elastic strain line, called by the transition of the fatigue life, (Nt = 3789 cycles). When 2Nf is lower than Nt, a plastic strain is dominant and the ductility governs the fatigue resistance. Otherwise, when 2Nf is higher than Nt, the elastic strain is dominant and the strength governs the fatigue resistance. Furthermore, an excellent correlation between predicted life and experimental data through the Coffin–Manson relationship can be observed of Alloy 617 under the isothermal condition with a value of 5.11% error variance.
Δ ε T 2 = Δ ε P 2 + Δ ε e 2 = 1.74 × 10 3 ( 2 N f ) 0.063 + 1.249 ( 2 N f ) 0.80
One of the proposed models that seems to be more complex, is the so-called strain energy density based model. The fatigue of materials is a specific energy consuming process with an absorption of the cyclic deformation, and the fatigue life can be characterized by this absorbed mechanical energy [11]. The fatigue life analysis procedure based on total strain energy density has been used to separate the effect of microstructures on the fatigue life. The total dissipated energy is the sum of the plastic energy and the elastic energy in (MJ/m3). This parameter model has been found to play an important role in the LCF damage process [10,11,12,13]. 
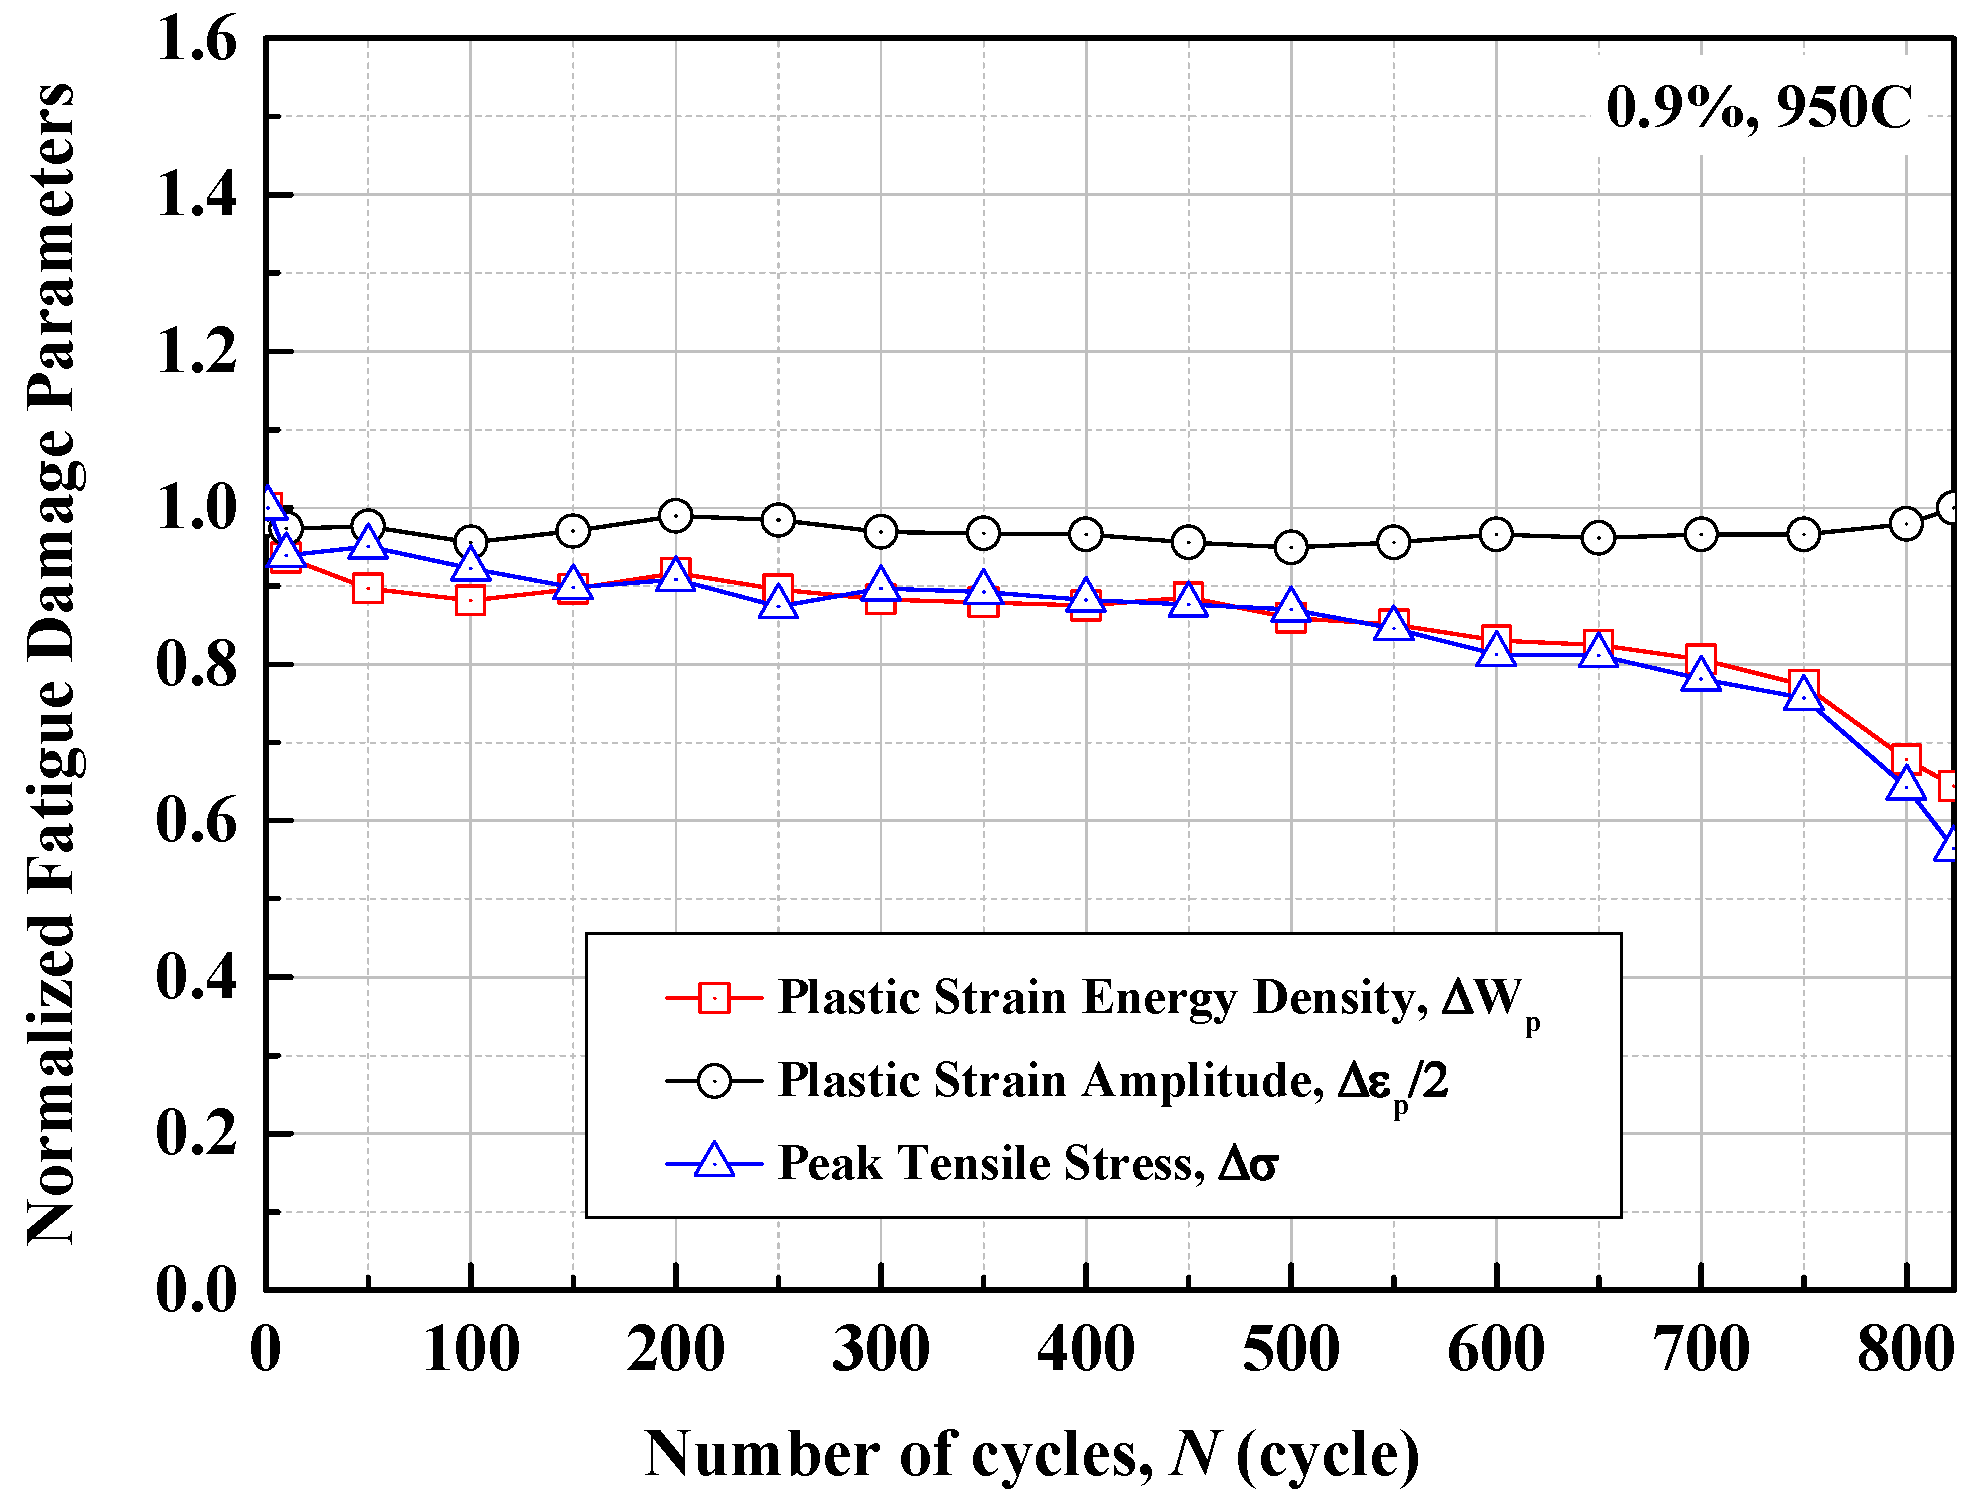
Figure 10 represents the evolutions of several fatigue damage parameters with the number of cycles on Alloy 617 where each parameter is normalized by its maximum value. As is seen, the peak stress amplitude and plastic strain energy density experienced variation at the ultimate phase. On the other hand, the plastic strain is more homogeneous during cycles at high temperature. In this case, the magnitude of stress and plastic strain are related to the active slip movement and its resistance, respectively.
The plastic strain energy density is characterized by the inside area of the hysteresis loop. Hence, the plastic strain energy density is related to the absorption of plastic deformation during cyclic loading. The inside area can be integrally evaluated through the empirical equation or based on the previous material constants obtained in the strain–life relationship. Therefore, the plastic strain energy, ΔWp, and number of reversals can be satisfied using the following Equation:
Δ W p = 0 ε Δ σ d ε p = ( 1 n ' 1 + n ' ) Δ σ Δ ε p = 4 ( 1 n ' 1 + n ' ) σ f ε f ( 2 N f ) b + c
To consider the effect of mean stress, especially during the tensile portion, S. Hyuk et al. [13] adopted the tensile mean stress effect, i.e., a tensile elastic strain energy density, ΔWe. In the case of longer fatigue life, the plastic deformation is difficult to measure. The summation of this can be used to our advantage for parameter determination. The elastic strain energy is related to the material properties such as the elastic modulus and the stress of material during LCF. Thus, the relation can be determined through the following Equation:
Δ W e = 0 ε Δ σ d ε e = 1 2 E ( Δ σ 2 ) 2
As mentioned above, the total strain energy density, ΔWT, is the summation of the plastic strain energy and the elastic strain energy density (ΔWT = ΔWp + ΔWe). This formulation is more suitable for fully reversed tests. From this point of view, the strain energy density is related to the number of cycles (or number of reversals) through power law, and can be estimated by the following equation:
Δ W T = 0 ε Δ σ d ε p + 0 ε Δ σ d ε e
Δ W T = A ( 2 N f ) α Δ 2 N f = ( Δ W T A ) 1 / α
where the material constants A and α are the material energy absorption capacity and the fatigue exponent, respectively. These material constants can be determined from the universal slope based on the experimental data. 
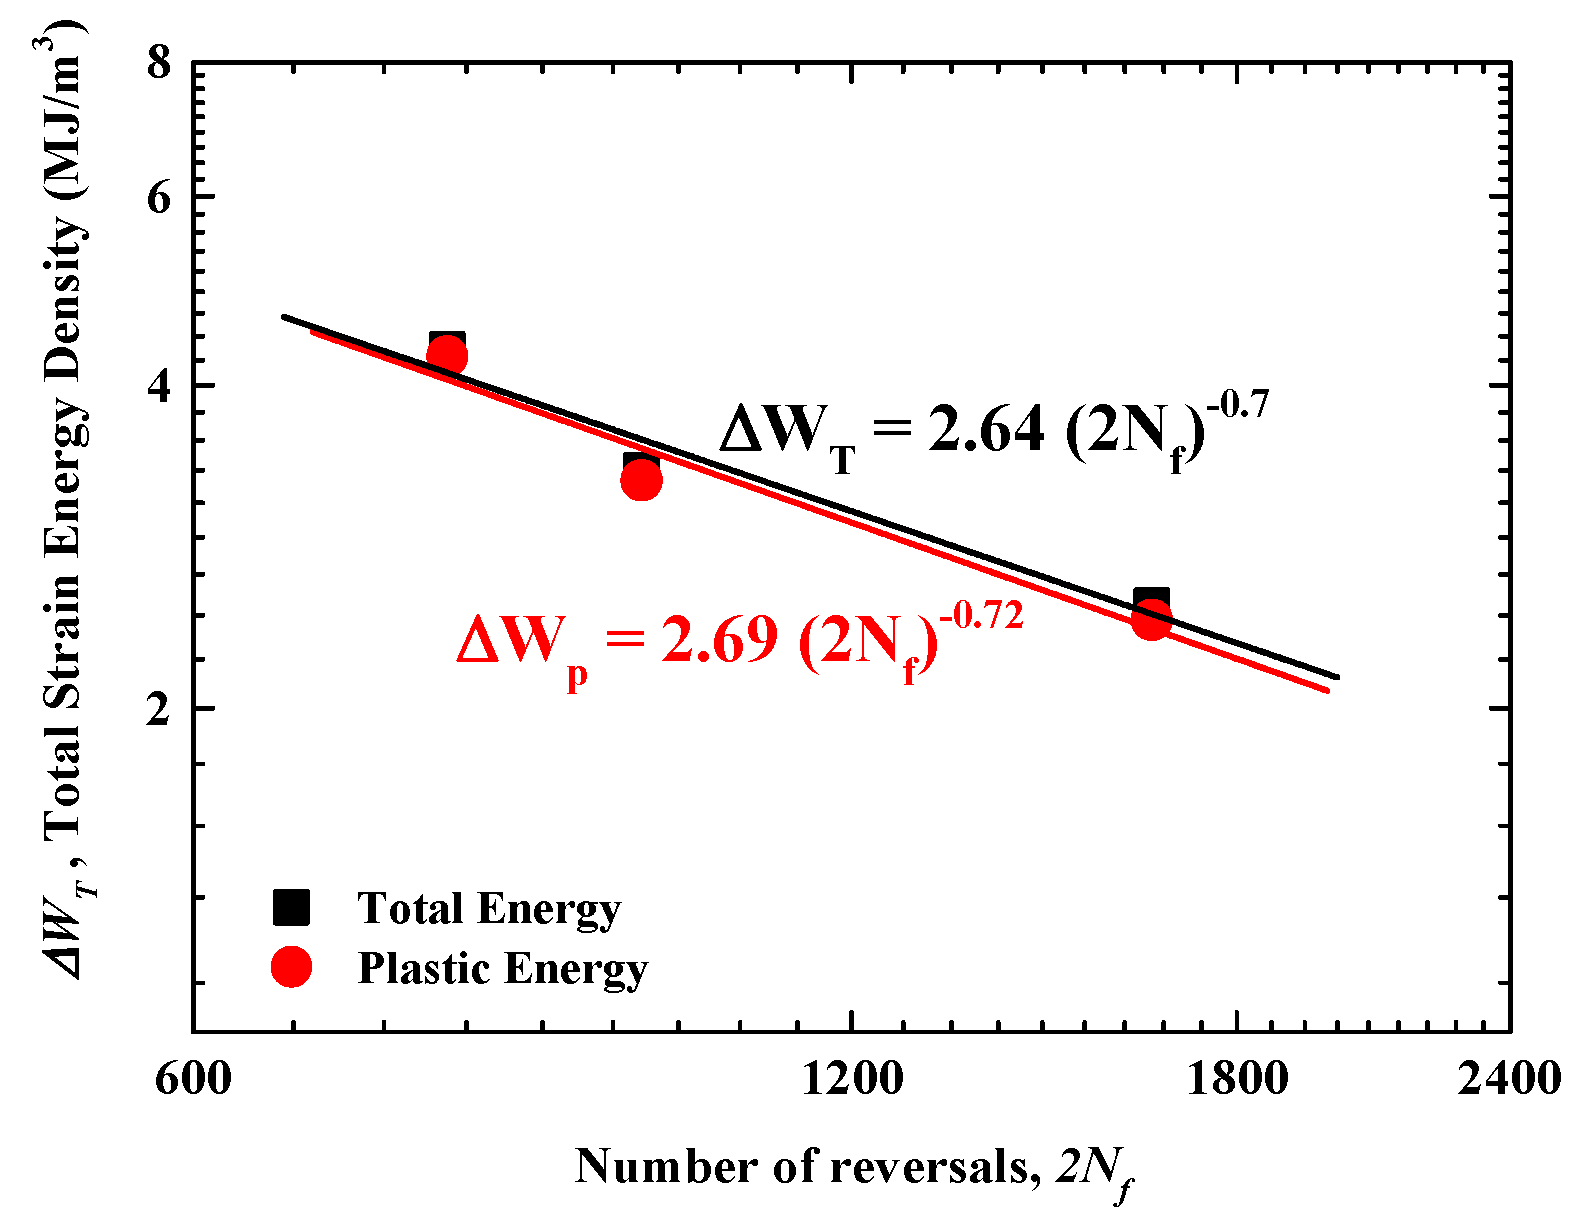
Figure 11 shows the fatigue life curves based on the total and plastic strain energy dissipated per cycle. There was no significant difference of the related constants, and both the curves exhibit good linearity and can be satisfied through the linear regression. From that, the existing energy absorbed during the mean strain is very small, thus the effect of the mean strain is noticed to be the minor influence. Specifying the total strain energy per cycle is used for the fatigue life studied at hand. The A value was obtained with about 436.5, and the α value was −0.7 from the best fit to the experimental data. The prediction of service lifetime based on the total strain energy density-based model is very close to the proposed function with a scattering value of 6.61%. Using a similar approach and universal slope, the prediction of service lifetime can be derived in a particular operation.

3.3. Microstructural Investigations

Figure 12 shows the comprehensive SEM images of the LCF cracking of Alloy 617 at (a) 0.9 and (b) 1.5% total strain range, where the fracture was visible within the gage section. From Figure 12, the LCF cracks of Alloy 617 illustrate a primary crack and some secondary cracks at the periphery of the fatigued specimens. The total strain range obviously played an important role in the crack initiation mechanism. It indicates that the low total strain range, which contains fewer secondary cracks, is probably due to the lower plastic deformation during LCF testing. The LCF cracks induced by oxidation levels was also dominant due to the longer time exposed to high temperature at the low total strain range. Otherwise, the higher total strain ranges that induced the higher plastic deformation must have favored the higher occurrence of secondary cracks initiating. A thin oxide layer makes it difficult to observe the crack initiation. The cracking of surface brittle oxides at the periphery specimen was developed on the grain boundary, and this may induce a weak stress response, see [5,6]. The reduction in fatigue life under higher total strain ranges is clearly acquired partly from the activation of the slip system and an increase in plastic deformation in a cycle, and is evidenced by those non-linear cracks.
In this study, there are two types of crack initiation mechanisms that occur in this Alloy at high temperature. Crack initiation is formed by precipitate shearing and the slip band inducing pile-up dislocations at high strain range (transgranular nature cracking), while crack initiation is induced by oxidation interactions owing to carbide diffusion from the matrix which is dominant at low strain range (intergranular oxide cracking) [14]. This phenomenon on the LCF test at 950 °C is similar to the author’s previous study observed at 900 °C [7]. Figure 13 shows typical OM micrographs on top-side photos that are for stage I crack initiation and bottom-side photos that are for stage II crack propagation of the fatigued specimens for (a) the 0.9% total strain range and (b) the 1.5% total strain range. Most of the crack initiation sites were found at the free surface through the intergranular cracking resulting from the oxidation of surface-connected precipitates, formed on the grain boundary during high temperature exposure time. These precipitates were formed due to the high temperature process and distributed along the grain boundary where cyclic strain is localized [15]. Some damage mechanisms induced by the slip band can also be found for the high strain range, resulting in transgranular cracking in the interior grain. LCF failure was finally generated by the incorporation of these crack paths.
The bottom-side photos of Figure 13 additionally show the stage II crack propagation of the fatigued specimens. In the propagation region, the LCF cracks were propagated in predominantly transgranular nature. The strengthening of carbides creates a barrier to prevent intergranular creep by persecution of grain boundary movement. The higher ductility of grain boundary carbides also imposed the transgranular cracking. In addition, the as-received microstructure of Alloy 617 is known to be uniform and stable. Thus, the grain boundary sliding is restricted and the plastic cyclic strain is provided by transgranular cracking. However, the crack branching over the grain boundary was still observed. For the high total strain range (Figure 13b), fatigue damage is more obvious due to the presence of more parallel slip bands. These slip orientations are different from each grain. Therefore, the LCF cracks for the high total strain range have a greater degree of surface cracking and more branches than in the specimens tested at low total strain range. The fatigue damage process of the propagation mode is identified by the result of the slip band containing extrusions and intrusions leading to the propagation of a macro-crack within the grain on the specimen surface; finally, at the critical stage, the coalescence of the macro-cracks was just about to fail [16]. The fracture modes are not different in either of the total strain range conditions.

3.4. High Temperature Effects on Low Cycle Fatigue

It is well known that when over exposed to high temperature applications, metal alloys are oxidized, which significantly reduces their mechanical properties. Figure 14 shows typical micrographs showing (a) precipitates and cavities formed, and (b) cracks of surface brittle oxides along the grain boundary during the high temperature LCF testing. The cracks’ opening will appear after the LCF test due to intergranular precipitations. EDX spectroscopy shows that the primary carbides of Ti-rich M6C, with large precipitations, were formed in the body of the grain structure and the carbides of Mo, Cr-rich M23C6 were developed mainly on the grain boundary. These precipitates (especially Mo, Cr-rich M23C6) were diffused with oxygen ions simultaneously and adapted with metal ions to create a protective oxide layer, namely Cr2O3 on the surface of Alloy 617. The internal-oxide layers were generated between the surface oxide layer and the bulk material, in which the precipitates were coarsened. The second layer was observed as the carbide depleted zone, and it is mainly composed of Al-oxide (Al2O3) [16,17]. When the cracks are initiated, it was filled with alumina oxide and this oxygen dissolution was developed in front of the crack tip. Cracks were following this path preferentially through those brittle alumina [17]. These brittle oxides on the surface-connected grain boundary became potential sites for crack initiation where cyclic strain is localized and to form a critical zone of fatigue failure, which may accelerate crack initiation and the propagation rate.

4. Conclusions

Fully reversed strain control tests were conducted at 950 °C in open air under different applied total strain ranges for Alloy 617. The experimental data analysis of the monotonic and LCF properties were in accordance with the other work reported. The results of fatigue tests consistently showed that the fatigue life was reduced according to the increase in the total strain range, acquired partly from the activation of the slip system and an increase in plastic deformation. The cyclic stress response was continuously decreased as the total strain range increased. The decrease in peak flow stress as cyclic softening is characteristic of a solute drag creep deformation. Also, this finding is in good agreement with that of the empirical rule. It was observed that Alloy 617 followed the Coffin–Manson relationship and the total strain energy density model well, with scattering value of 5.11% and 6.61%, respectively. Plastic strain, as a damage parameter, was found to be more promising for the Alloy 617 with its consistency of properties at hand. Crack initiation is generated in two ways; by precipitate shearing and the slip band at high strain range, and by oxidation interactions owing to carbide diffusion from the matrix, which is dominant at low strain range. In the propagation region, the LCF cracks were propagated in predominantly transgranular nature.

Acknowledgments

The authors would like to recognize KAERI, and acknowledge that this research was supported by Nuclear Research & Development Program through the National Research Foundation of Korea (NRF) funded by the Ministry of Science, ICT & Future Planning (NRF-2016M2A8A2902895).

Author Contributions

Seon Jin Kim formulated this research with cooperation from Woo Gon Kim and Eung Seon Kim; Rando Tungga Dewa performed the experiment works, with the help of Seon Jin Kim, interpreted the results and prepared the manuscript. All co-authors contributed to the manuscript proof and submissions.

Conflicts of Interest

The authors declare no conflict of interest.

References

  1. Dewa, R.T.; Kim, S.J.; Kim, W.G.; Kim, E.S. Low cycle fatigue behaviors of Alloy 617 (INCONEL 617) weldments for high temperature applications. Metals 2016, 6, 100. [Google Scholar] [CrossRef]
  2. Kim, S.J.; Dewa, R.T.; Kim, W.G.; Kim, M.H. Cyclic stress response and fracture behaviors of Alloy 617 base metal and weldments under LCF loading. Adv. Mater. Sci. Eng. 2015, 2015, 207497. [Google Scholar] [CrossRef]
  3. Wright, R.N.; Carroll, L.J.; Benz, J.K.; Wright, J.K.; Lillo, T.M.; Lybeck, N.J. Properties of Alloy 617 for heat exchanger design. In Proceedings of the 7th International Topical Meeting on High Temperature Reactor Technology (HTR 2014), Weihai, China, 27–31 October 2014.
  4. Smith, G.D.; Yates, D.H. Optimization of the fatigue properties of INCONEL Alloy 617. In Proceedings of the International Gas Turbine and Aeroengine Congress and Exposition, Orlando, FL, USA, 3–6 June 1991.
  5. Wright, J.K.; Carroll, L.J.; Cabet, C.; Lillo, T.M.; Benz, J.K.; Simpson, J.A.; Lloyd, W.R.; Chapman, J.A.; Wright, R.N. Characterization of elevated temperature properties of heat exchanger and steam generator alloys. Nucl. Eng. Des. 2012, 251, 252–260. [Google Scholar] [CrossRef]
  6. Wright, J.K.; Carroll, L.J.; Simpson, J.A.; Wright, R.N. Low cycle fatigue of Alloy 617 at 850 °C and 950 °C. J. Eng. Mater. Technol. 2013, 135, 031005. [Google Scholar] [CrossRef]
  7. Dewa, R.T.; Kim, S.J.; Kim, W.G.; Kim, E.S. Understanding low cycle fatigue behavior of Alloy 617 base metal and weldments at 950 °C. Metals 2016, 6, 178. [Google Scholar] [CrossRef]
  8. Lee, H.Y.; Kim, Y.W.; Song, K.N. Preliminary application of the draft code case for alloy 617 for a high temperature component. J. Mech. Sci. Technol. 2008, 22, 856–863. [Google Scholar] [CrossRef]
  9. Breitling, H.; Dietz, W.; Penkalla, H.J. Evaluation of mechanical properties of the Alloy NiCr22Co12Mo (Alloy 617) for heat exchanging components of HTGRs. In Proceedings of the Specialists’ Meeting on High-Temperature Metallic Materials for Gas-Cooled Reactors, Cracow, Poland, 20–23 June 1988.
  10. Branco, R.; Costa, J.D.M.; Antunes, F.V.; Perdigão, S. Monotonic and cyclic behavior of DIN 34CrNiMo6 tempered alloy steel. Metals 2016, 6, 98. [Google Scholar] [CrossRef]
  11. Song, M.S.; Kong, Y.Y.; Ran, M.W.; She, Y.C. Cyclic stress–strain behavior and low cycle fatigue life of cast A356 alloys. Int. J. Fatigue 2011, 33, 1600–1607. [Google Scholar] [CrossRef]
  12. Lee, K.O.; Hong, S.G.; Lee, S.B. A new energy-based fatigue damage parameter in life prediction of high-temperature structural materials. Mater. Sci. Eng. A 2008, 496, 471–477. [Google Scholar] [CrossRef]
  13. Park, S.H.; Hong, S.G.; Lee, B.H.; Bang, W.; Lee, C.S. Low-cycle fatigue characteristics of rolled Mg-3Al-1Zn alloy. Int. J. Fatigue 2010, 32, 1835–1842. [Google Scholar] [CrossRef]
  14. Fleury, E.; Rémy, L. Low cycle fatigue damage in nickel-base superalloy single crystals at elevated temperature. Mater. Sci. Eng. A 1993, 167, 23–30. [Google Scholar] [CrossRef]
  15. Kim, W.G.; Ekaputra, I.M.W.; Park, J.Y.; Kim, M.H.; Kim, Y.W. Investigation of creep rupture properties in air and He environments of alloy 617 at 800 °C. Nucl. Eng. Des. 2016, 306, 177–185. [Google Scholar] [CrossRef]
  16. Jang, C.; Lee, D.; Kim, D. Oxidation behaviour of an Alloy 617 in very high-temperature air and helium environments. Int. J. Press. Vessels Pip. 2008, 85, 368–377. [Google Scholar] [CrossRef]
  17. Cabet, C.; Carroll, L.; Wright, R. Low cycle fatigue and creep-fatigue behavior of Alloy 617 at high temperature. J. Press. Vessel Technol. 2013, 135, 061401. [Google Scholar] [CrossRef]
Figure 1. Microstructure of the cross-view of Alloy 617.
Metals 07 00054 g001
Figure 2. Specimen’s geometry of the (a) Tensile and (b) LCF test. LCF, Low Cycle Fatigue.
Metals 07 00054 g002
Figure 3. Apparatus and experimental setup of the LCF test.
Metals 07 00054 g003
Figure 4. Engineering stress–strain curve of Alloy 617 at 950 °C. UTS, Ultimate Tensile Strength. YS, Yield Strength.
Metals 07 00054 g004
Figure 5. Stress–strain hysteresis loops plotted at: (a) Half-life cycle under different total strain ranges; (b) Interval hysteresis loops for the 0.9% total strain range of Alloy 617 at 950 °C.
Metals 07 00054 g005
Figure 6. Cyclic stress response curves of Alloy 617 at 950 °C: (a) Stress amplitude path behavior; (b) Peak and tensile compressive stresses response as a function of the number of cycles.
Metals 07 00054 g006
Figure 7. The cyclic stress–strain behavior of Alloy 617 at 950 °C determined through the Ramberg–Osgood relationship.
Metals 07 00054 g007
Figure 8. Degree of softening as a function of the total strain range of Alloy 617 at 950 °C.
Metals 07 00054 g008
Figure 9. The Coffin–Manson curves of Alloy 617 at the 950 °C condition.
Metals 07 00054 g009
Figure 10. Evolutions of fatigue damage parameters: plastic strain energy absorbed per cycle, plastic strain amplitude, and peak tensile stress.
Metals 07 00054 g010
Figure 11. Fatigue life curves based on total and plastic strain energy dissipated per cycle of Alloy 617 at the 950 °C condition.
Metals 07 00054 g011
Figure 12. General view of LCF cracking of Alloy 617 fatigued specimens at 950 °C conditions were within the gage section: (a) for the 0.9% total strain range; and (b) for the 1.5% total strain range.
Metals 07 00054 g012
Figure 13. Typical OM micrographs of the fatigued specimens of Alloy 617 at 950 °C conditions showing Stage I and Stage II of LCF cracking: (a) for the 0.9% total strain range; and (b) for the 1.5% total strain range. OM, Optical Microscopy.
Metals 07 00054 g013
Figure 14. Typical micrographs structure of Alloy 617 fatigued specimens at 950 °C conditions showing: (a) precipitates formed on the grain boundary; and (b) surface brittle Cr-oxides cracks.
Metals 07 00054 g014
Table 1. The chemical compositions of Alloy 617 (wt %).
CNiFeSiMnCoCrTiPSMoAlBCu
0.0853.110.9490.0840.02912.322.20.410.0030.0029.51.06<0.0020.0268
Table 2. LCF test reports of Alloy 617 completed at 950 °C and at a strain rate of 10−3/s.
Total Strain Range (mm/mm)Cycles to FailureCycles to InitiationPlastic Strain Range at Half-Life (mm/mm)Stress Range at Half-Life (MPa)
0.00753923000.00641136.6
0.00604812920.0048139.9
0.00458238030.00343148.9
Table 3. The Coffin–Manson coefficients of Alloy 617 completed at 950 °C and a strain rate of 10−3/s.
ParametersValues
Fatigue ductility coefficient, εf1.249
Fatigue ductility exponent, c−0.80
Fatigue strength coefficient, σf′ (MPa)250.4
Fatigue strength exponent, b−0.063

