Article

Structure and Physical Properties of NiO/Co3O4 Nanoparticles

1
Department of Physics, Faculty of Science, Malayer University, Malayer 65719-95863, Iran
2
Center for Quantum Devices, Department of Electrical Engineering and Computer Science, Northwestern University, Evanston, IL 60208, USA
3
Department of Physics, Universiti Putra Malaysia, Serdang 43400, Malaysia
4
Department of Chemistry, Azad University, Shahre-Ghods Branch, Tehran 37541-374, Iran
5
Institute of Micro Engineering and Nano Electronics (IMEN), Universiti Kebangsaan Malaysia, Bangi 43600, Malaysia
6
Department of Physics, Farhangian University, Shiraz 71456-15515, Iran
*
Author to whom correspondence should be addressed.
Metals 2016, 6(8), 181; https://doi.org/10.3390/met6080181
Submission received: 24 March 2016 / Revised: 8 June 2016 / Accepted: 28 June 2016 / Published: 5 August 2016

Abstract

:
The thermal treatment method was employed to prepare nickel-cobalt oxide (NiO/Co3O4) nanoparticles. This method was attempted to achieve the higher homogeneity of the final product. Specimens of nickel-cobalt oxide were characterized by various experimental techniques, including X-ray diffraction (XRD), transmission electron microscopy (TEM) and Fourier transform infrared spectroscopy (FTIR). X-ray diffraction results showed that there was no crystallinity in the predecessor, and it still had the amorphous phase. The formations of the crystalline phases of the nickel-cobalt oxide nanoparticles started from 350–500 °C, and the final products had different crystallite sizes ranging from 11–35 nm. Furthermore, the variation of DC conductivity (σdc), impedance, tangent loss (tgδ) and dielectric constant (ε′) of the calcined specimens with frequency in the range of 102–106 Hz was investigated. σdc showed a value of 1.9 × 10⁻⁶ S/m, 1.3 × 10⁻⁶ S/m and 1.6 × 10⁻⁶ S/m for the specimens calcined at 350, 400 and 450 °C, respectively. Additionally, a decrease in tgδ values with an increase in temperature was observed. Finally, the formed nanoparticles exhibited ferromagnetic behaviors, which were confirmed by using a vibrating sample magnetometer (VSM).

Graphical Abstract

1. Introduction

Nanocrystalline materials have attracted much attention because of their different magnetic, electric, dielectric, thermal, optical and catalytic properties in comparison to their bulk counterparts [1]. Nanostructured metal oxides have been extensively studied due to both scientific interests and potential applications [2]. Metal oxide nanoparticles (NPs) can adopt a large variety of structural geometries. Furthermore, they incur electronic structures that may exhibit metallic, semiconducting or insulating characteristics, endowing them with diverse chemical and physical properties. Therefore, metal oxides are among the most important functional materials used for chemical and biological sensing and transduction.
In the present work, we implemented a simple thermal treatment method for preparing magnetic metal oxide nanoparticles; the method is a much more convenient procedure and is completely environmental friendly. The nickel and cobalt oxide material has several applications, such as being active electro catalysts for oxygen evolution, as well as reduction in alkaline electrolytes [3,4], being used for the cathode material of rechargeable batteries [5] or in supercapacitor applications [6]. In light of our synthesizing method, we try to give a comprehensive characterization focusing on the physical property of the material to give more information about different aspects of the material property. We believe that our work can add a contribution, even though small, to all valuable previous works and can be listed as a good reference for future work; especially the work that tries to investigate more affordable and less complicated methods of fabrication for magnetic metal oxide nanoparticles. The acquirement of the desired physical and chemical properties from metal oxide NPs requires an effective preparation method and has become a significant subject of research. There are several nonconventional techniques in order to achieve high quality metal oxide nanoparticles that have been used or are under development for preparing ultrafine nanostructures [7,8,9,10,11,12,13,14,15,16,17,18]. Numerous factors and various precipitation agents were utilized to synthesis magnetic metal oxide nanocrystals with specific structures. On the whole, all of these methods require two basic production operations: the mixing of initial components either mechanically or chemically and a subsequent heat treatment of the obtained mixture: the temperature usually near 1400 °C [19]. Therefore, the formation of metal oxide nanostructure at temperatures lower than 1400 °C is an advantage for their preparation. Because of the annealing at high temperatures, the grain size of the metal oxides increases, which limits the possibilities of obtaining ultrafine particles for the desired applications, especially basic research. On the other hand, it is reported that the saturation magnetization for magnetic materials decreases with decreasing particle size, which will also limit the applications of nanostructured magnetic materials in magnetic recording [20]. Non-magnetic and died layers on the surfaces of fine particles and a fraction of finer particles in the superparamagnetic range have been suggested to be responsible for the decrease of the saturation magnetization in nanostructured magnetic materials [20,21]. Moreover, some of them may produce several by-products that are harmful to the environment [21]. Accordingly, in this article, the novel synthesis of nickel-cobalt oxide nanoparticles with high homogeneity was described. The effects of calcination temperature on the structural and physical properties of the nickel-cobalt oxide nanoparticles investigated were the significant extension and improvement of the thermal-treatment method [22].

2. Experimental Procedure

2.1. Materials

Metal nitrate reagents, poly(vinyl pyrrolidone) (PVP) and deionized water were used as precursors, a capping agent to reduce the agglomeration of particles and a solvent, respectively. Nickel nitrate (Ni (NO3)2·6H2O) and cobalt nitrate (Co (NO3)2·6H2O) were from Acros Organics with a purity exceeding 99%. PVP (MW = 29,000) was from Sigma Aldrich (Darmstadt, Hesse, Germany) and was used with no further purification. An aqueous solution of PVP was prepared by dissolving 3.5 g of the polymer in 100 mL of deionized water at 85 °C. Subsequently, 0.1 mmol nickel nitrate and 0.3 mmol cobalt nitrate (Ni:Co = 1:3) were mixed into the polymer solution, which was constantly stirred for 3 h using a magnetic stirrer until obtaining a purple color solution. The solution had a pH ranging from 3–4, which was measured by a glass electrode. No precipitation of materials occurred before the heat treatment. The mixed solution was poured into a glass petri dish and heated at 90 °C in an oven for 36 h to evaporate its water content. The dried purple solid was crushed and ground in a mortar for 30 min to form a powder. The calcinations of this powder were carried out at 350, 400, 450 and 500 °C for 3 h for the decomposition of the organic compounds and the crystallization of the nanoparticles.

2.2. Characterization

The crystalline phases and crystal structure existing in the NiO/Co3O4 nanostructure were examined by X-ray diffraction analysis (XRD; Philips X-pert type instrument, Eindhoven, Netherland). The X-ray source was Cu-Kα radiation (λ = 1.54056 Å), and XRD data were collected from 10°–80° (2θ). The structure and particle size of the nanocrystals were determined from transmission electron microscopy (TEM) images obtained using a JEOL 2010F UHR electron microscope (JEOL, Pleasanton, CA, USA) at an accelerating voltage of 200 kV.
The resulting NiO/Co3O4 nanostructures were analyzed by means of a Fourier-transform infrared (FTIR) spectrophotometer (PerkinElmer FTIR model 1650 spectrometer, Michigan City, IN, USA).
The dielectric properties were measured using a Precision LRC meter (Agilent-4284A, keysight, Chicago, IL, USA) in the frequency range from 20 Hz–1 MHz and at room temperature. A vibrating sample magnetometer (Lake Shore 4700, Tokyo, Japan) was used for analyzing the magnetic properties of the prepared NiO/Co3O4 nanoparticles at room temperature, with a maximum field of 15 kOe. For vibrating sample magnetometer (VSM) measurements, the powder was dispersed in paraffin wax, and the powder wax composites were put into a cylindrical cell.

3. Results and Discussion

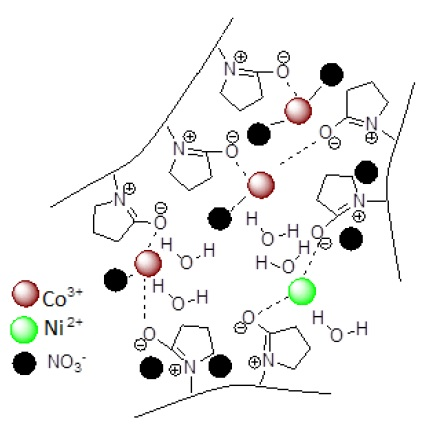
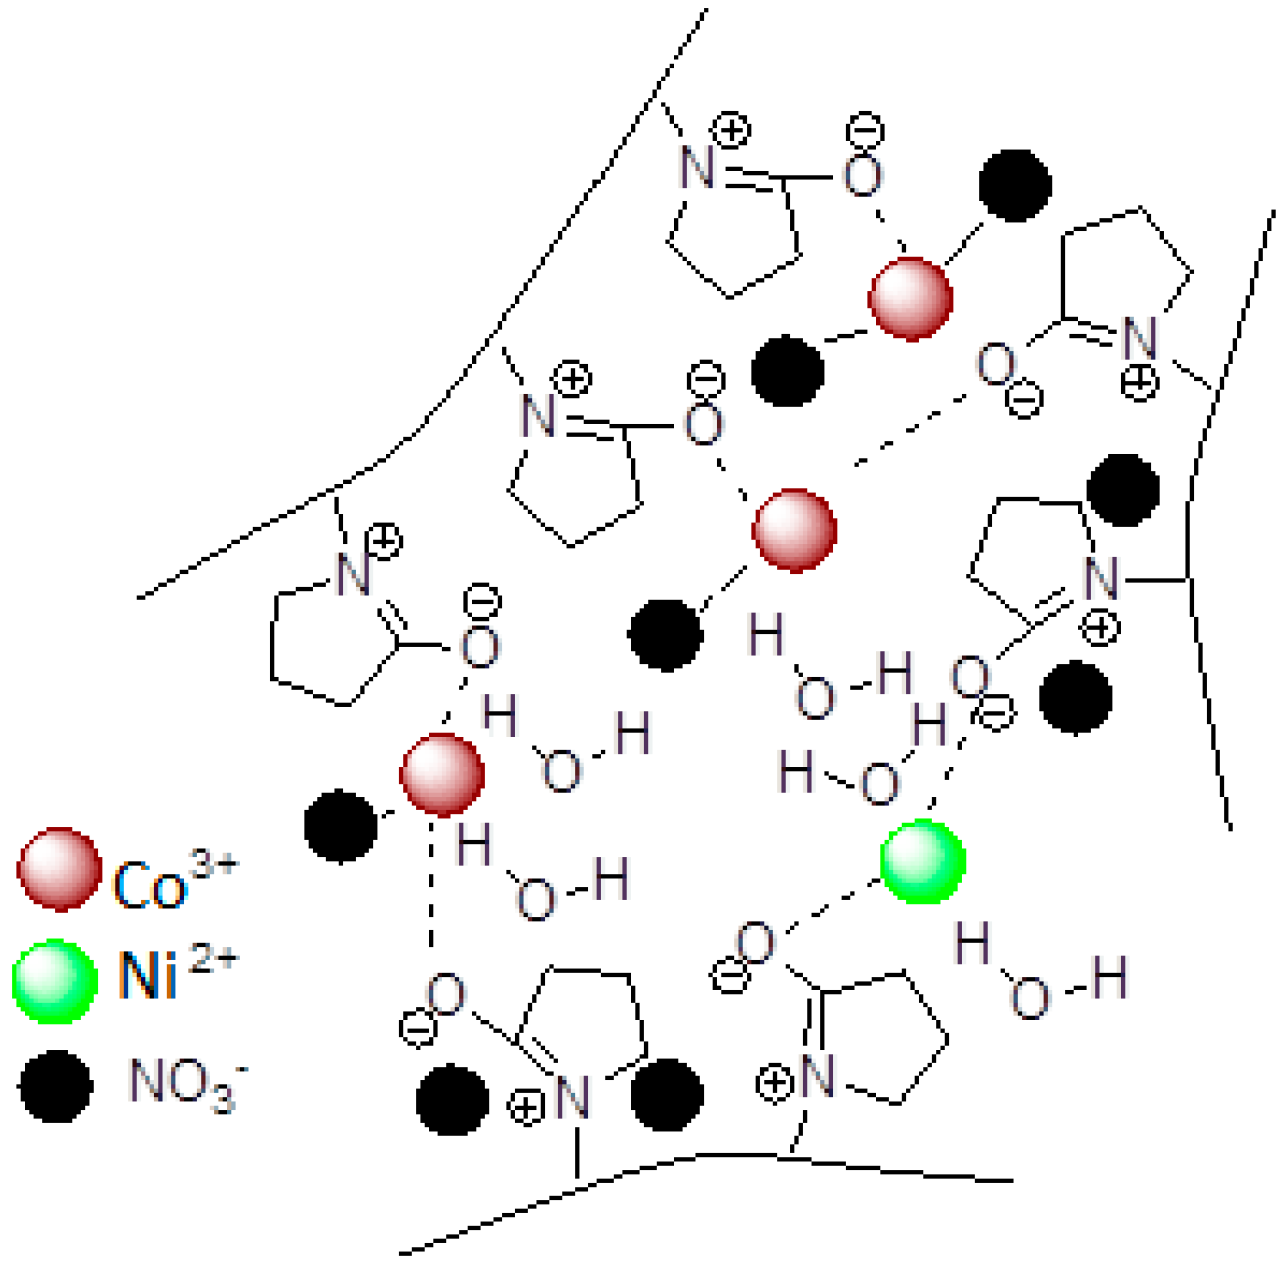
3.1. Mechanism of the Formation of Nanoparticles

Interactions between the PVP capping agent [23] and metal ions are shown schematically in Figure 1, which shows that the nickel (II) and cobalt (III) ions are bound by the strong ionic bonds between the metallic ions and the amide group in a polymeric chain. PVP acts as a stabilizer for dissolved metallic salts through steric and electrostatic stabilization of the amide groups of the pyrrolidine rings and the methylene groups. Initially, the PVP stabilizer may decompose to a limited extent, thereby producing shorter polymer chains that are capped when they are adsorbed onto the surfaces of metallic ions [24]. The metallic ions, which are well dispersed in the cavities and networks, are created as a result of the shorter polymer chains. These mechanisms continue until they are terminated by the drying step. The influence of PVP is not restricted only to the solution and the drying step; PVP also affects the formation of the nuclei (i.e., nucleation) of the nickel ferrite nanoparticles in the calcination step. In this step, the small nanoparticles with high surface energy levels would become larger via the Ostwald ripening process [25] without the presence of PVP, disrupting steric hindrance, thereby preventing their aggregation.

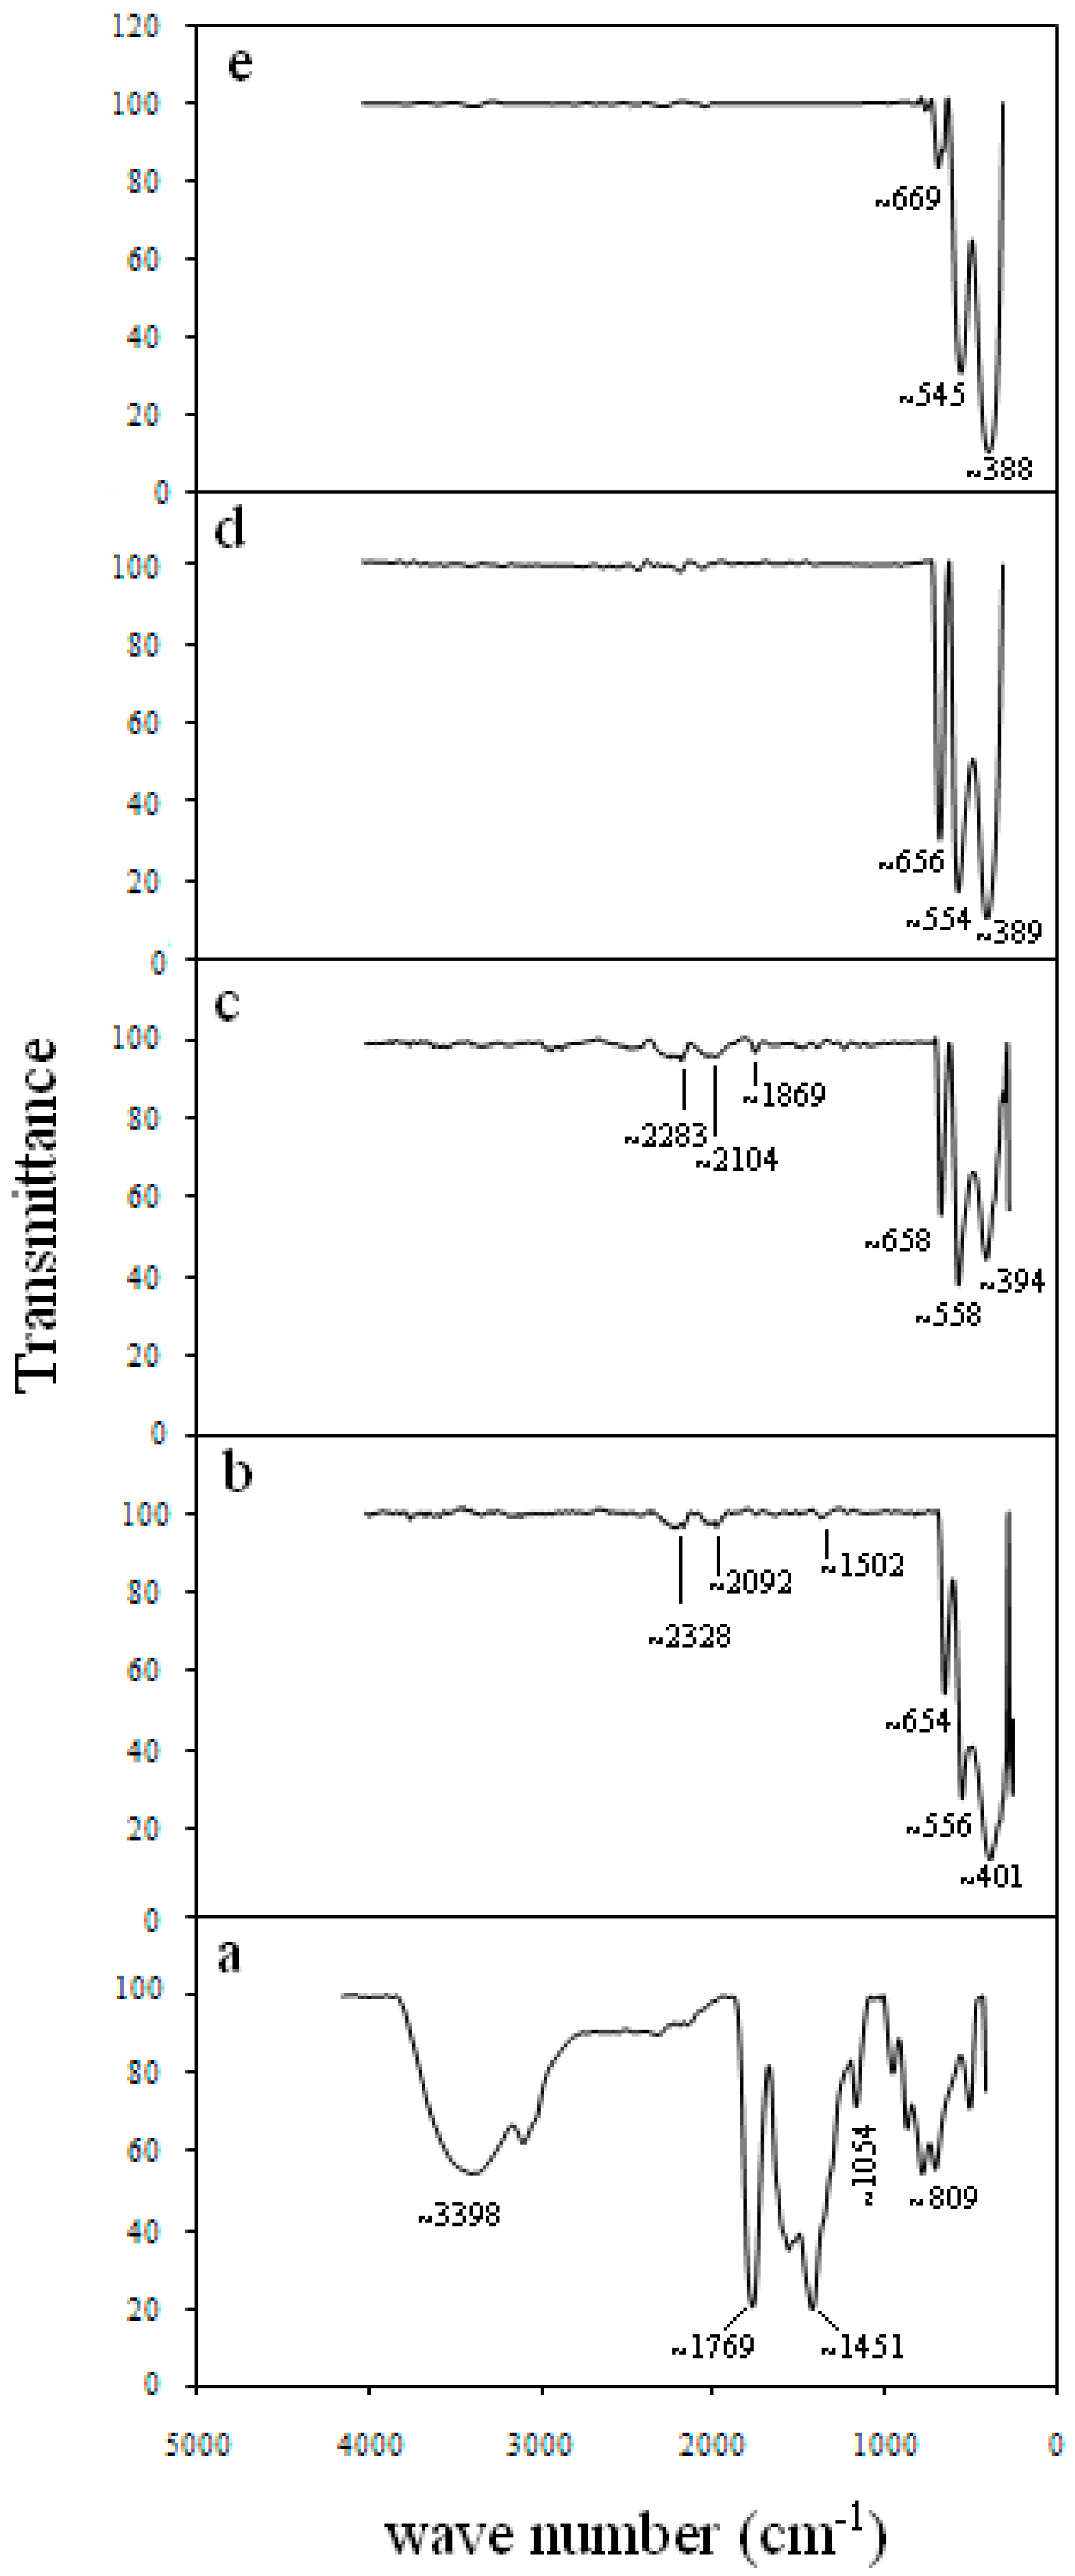
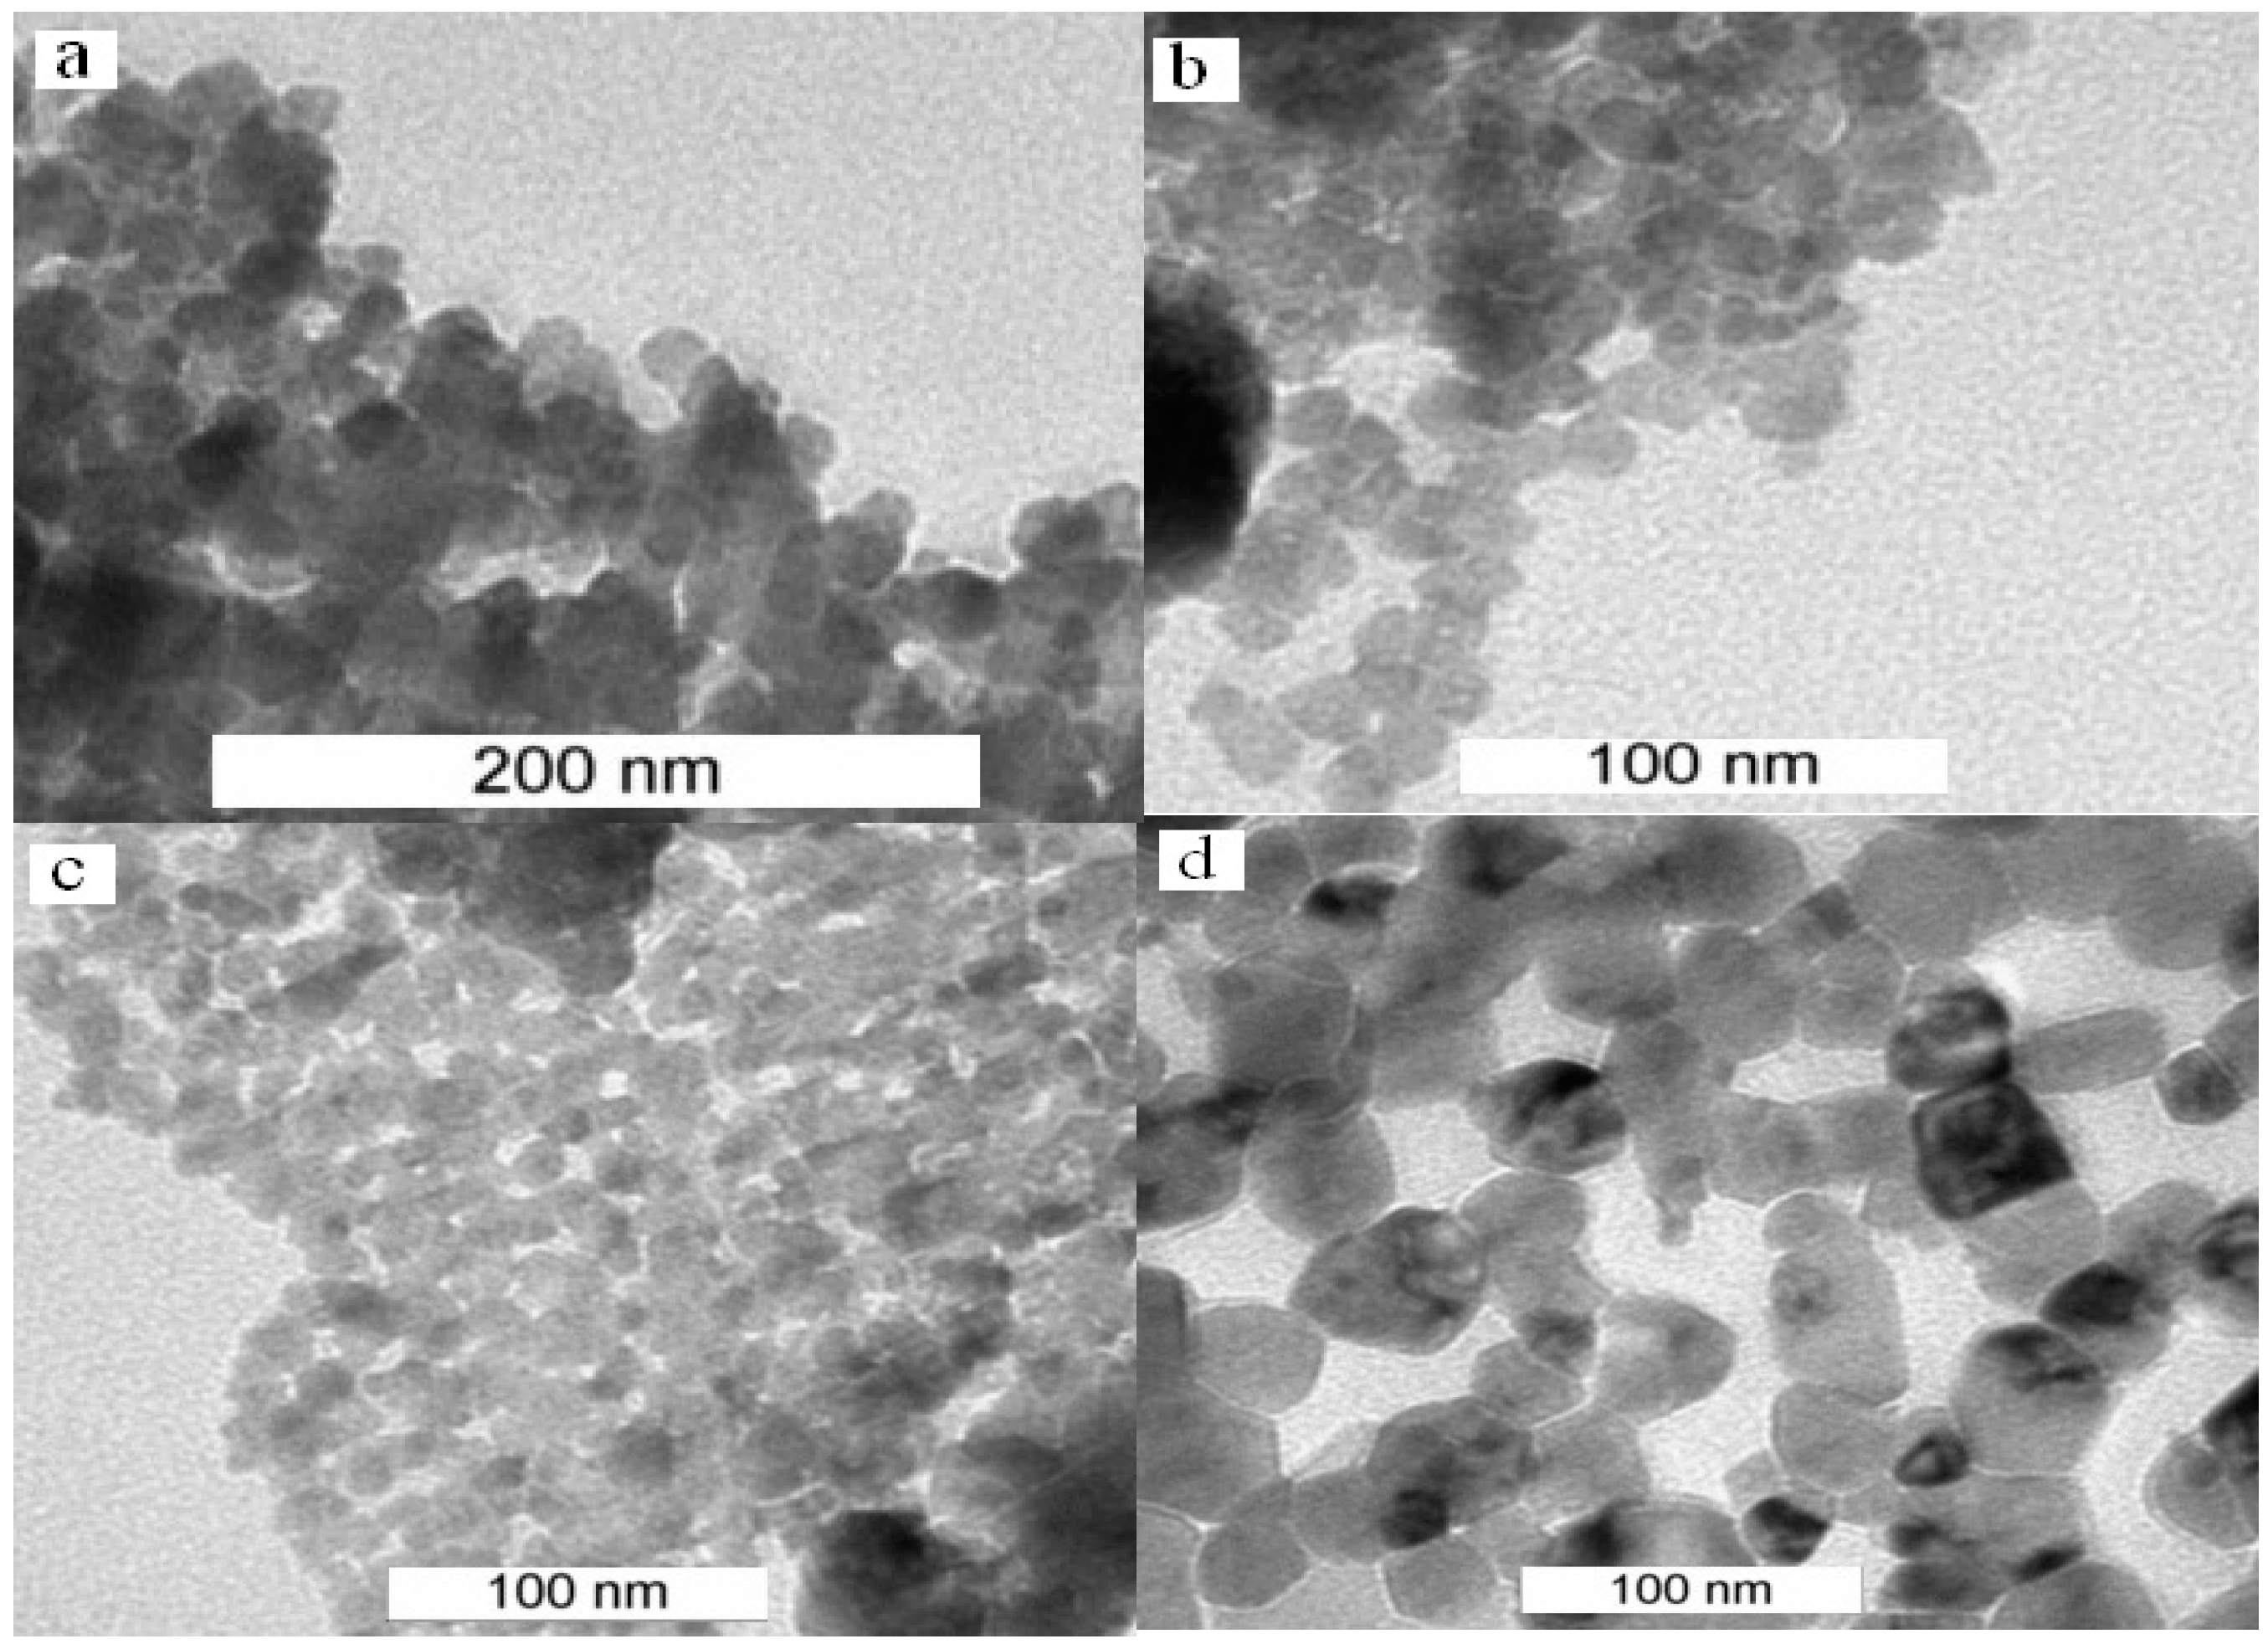
3.2. Degree of Crystallization, Morphology and Phase Composition of Nickel-Cobalt Oxide Nanoparticles

The XRD results of the Ni-Co oxide nanoparticles are shown in Figure 2. The corresponding results demonstrate that nickel and cobalt oxides exist as NiO (JCPDS, No. 47-1049) and Co3O4 (JCPDS, No. 09-0418), respectively. The main diffraction peak positions of NiO are Lines C (311), D (200), G (220) and I (620), and the main diffraction peaks positions of Co3O4 are Lines A (111), B (220), C (311), E (400), F (511) and H (440). The XRD patterns of the calcined samples confirm the presence of Ni-Co oxide nanoparticles with a face centered cubic structure, which supported the TEM images, as shown in Figure 3. Broad and low intensity peaks indicate a low crystallization degree and the small size of the crystalline grain. The average particle size was determined from full width at half maximum (FWHM) using the well-known Debye-Scherer:
D = 0.9   λ / β cos θ
where D is the crystallite size (nm), β is the full width of the diffraction line at half of the maximum intensity measured in radians, λ = 0.154 nm and is the X-ray wavelength of Cu Kα and θ is the Bragg angle [26]. The results show an increase in particle size with the increase of calcination temperatures of 350, 400, 450 and 500 °C, as is demonstrated in Table 1.
The TEM images in Figure 3, show the morphology and structure of the nickel cobalt oxide NPs calcined from 350–500 °C. The figure shows that the NPs obtained by this method are uniform in both morphology and particle size distribution. At the calcination temperatures of 350–500 °C, the particles had sizes of 11–35 nm, respectively (Table 1). These sizes are relatively consistent with the estimations from the XRD method and by applying Scherer’s formula (Equation (1)). The enhancement in particle size, caused by an increase in the calcination temperature, suggests that the surfaces of several neighboring particles were melted during the procedure due to high temperatures. This may cause the particles to be fused together, and the consequent increase of the particle size is attained [27]. Moreover, grain growth has been previously observed to enlarge the particle size for higher calcination temperatures in the synthesis of nanomaterials [28,29].
Figure 4a shows the FTIR spectrum of the precursor in the wave number range of 250–4000 cm−1. The band with a peak at 1054 cm−1 is assigned to the bands related to the C–O–C group. The other important peaks are at 3398, 1769, 1451 and 852 cm−1 corresponding to the stretching and bending vibrations of O–H, C=O, H–C–H and C–C, respectively [30]. The absence of the peaks from 1000–1500 cm−1 in the specimens at 350 °C and higher indicates the nonexistence of the C–O mode of organic sources (Figure 4b,e) [31]. The presence of the peaks from 1800–2500 cm−1 in the calcined specimens at 350 and 400 °C is related to the C=H stretching-mode of organic sources [32]. The spectra (Figure 4b,e) also contain three strong absorption bands in the range of 380–670 cm−1 with the first band (ν1) around 390 cm−1, the second band (ν2) around 550 cm−1 and the third band (ν3) around 660 cm−1 (Table 1). The first strong absorption bands (ν1) of all of the calcined specimens are related to the structure of NiO nanoparticles. Moreover, the two absorption bands (ν2 and ν3) confirm the spinel structure of Co3O4 nanoparticles [33]. The bands around 550 and 660 cm−12 and ν3) are attributed to the stretching vibration mode of Mtetra↔O, in which M may be Ni2+ or Co2+ and is tetrahedrally coordinated [34,35]. The bands around 390 cm−11) are assigned to the Mocta↔O in which M is Co3+, and it coordinates octahedrally [36,37].

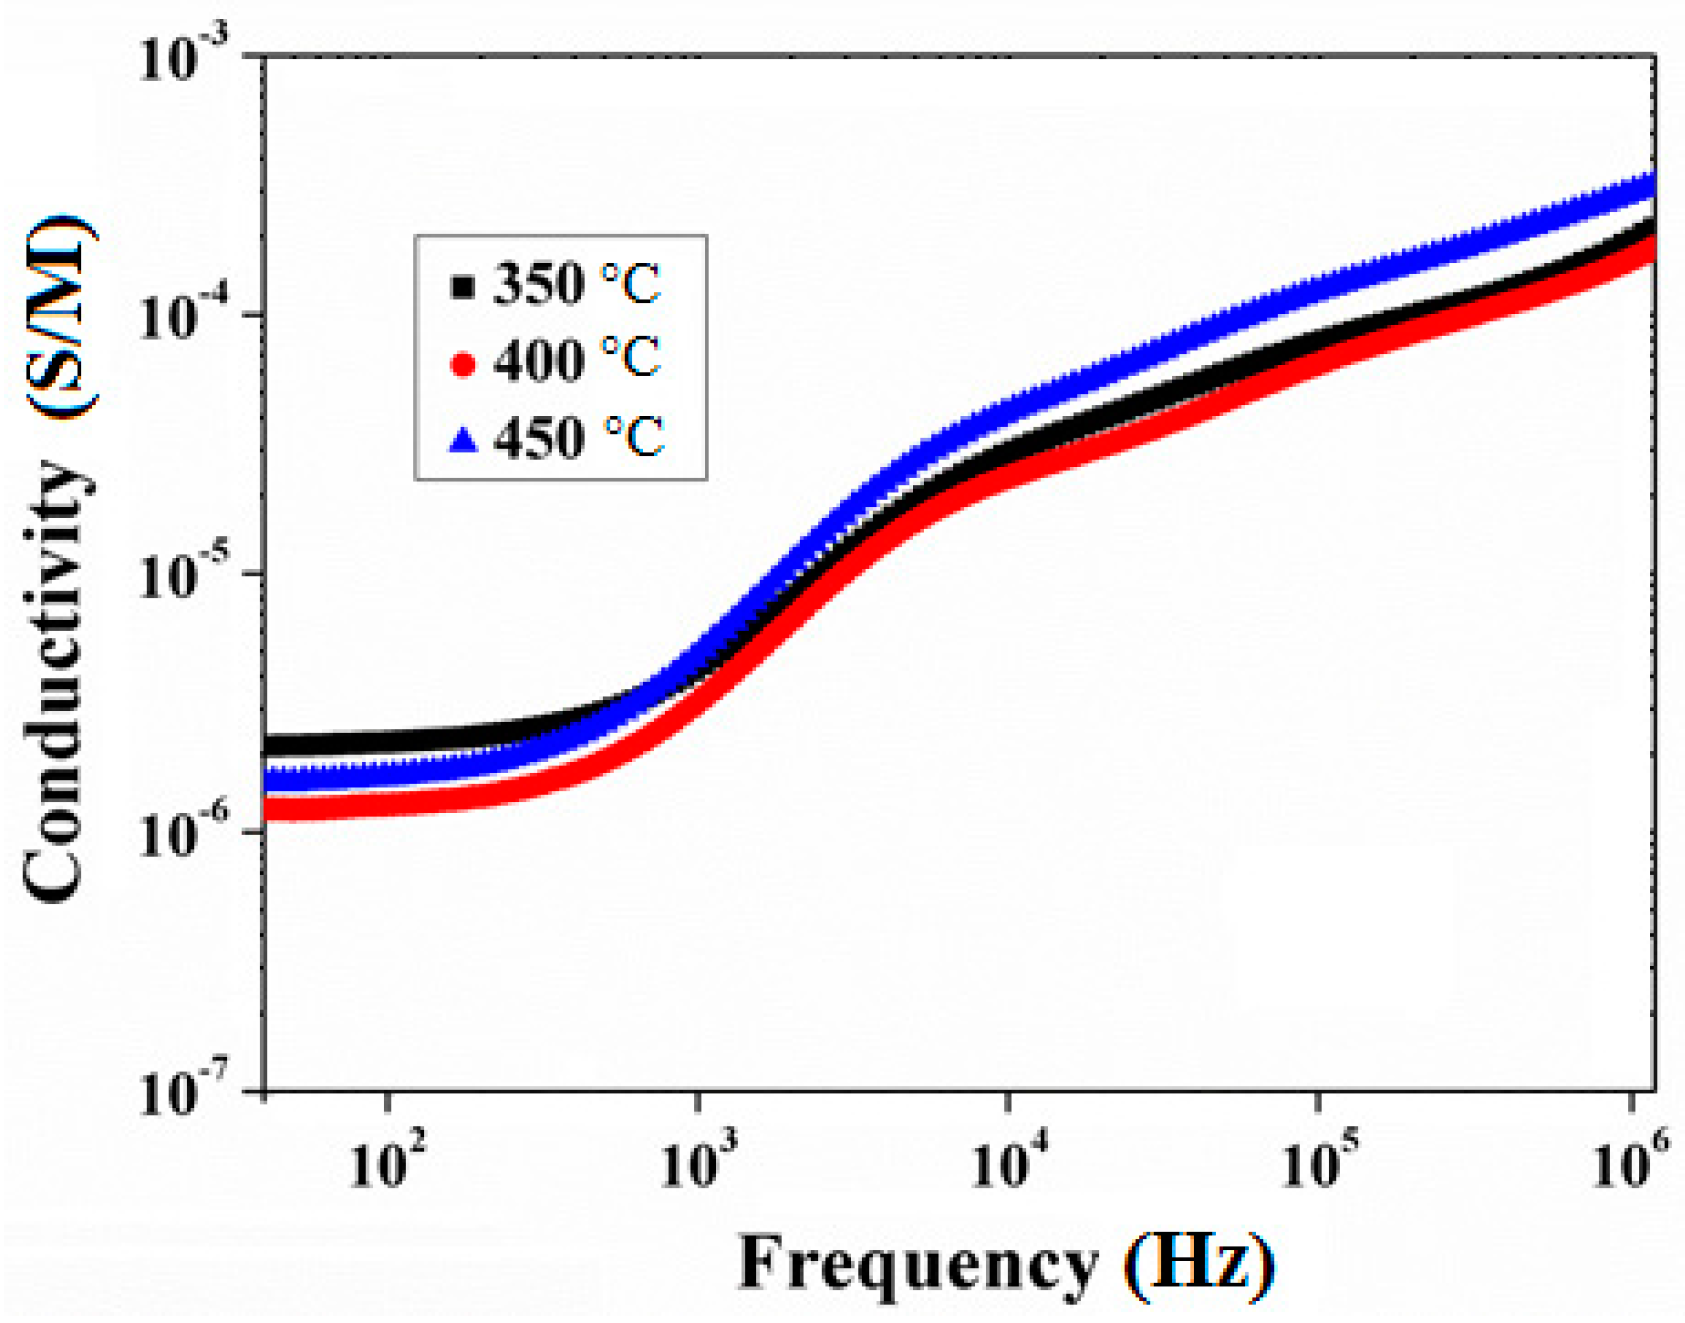
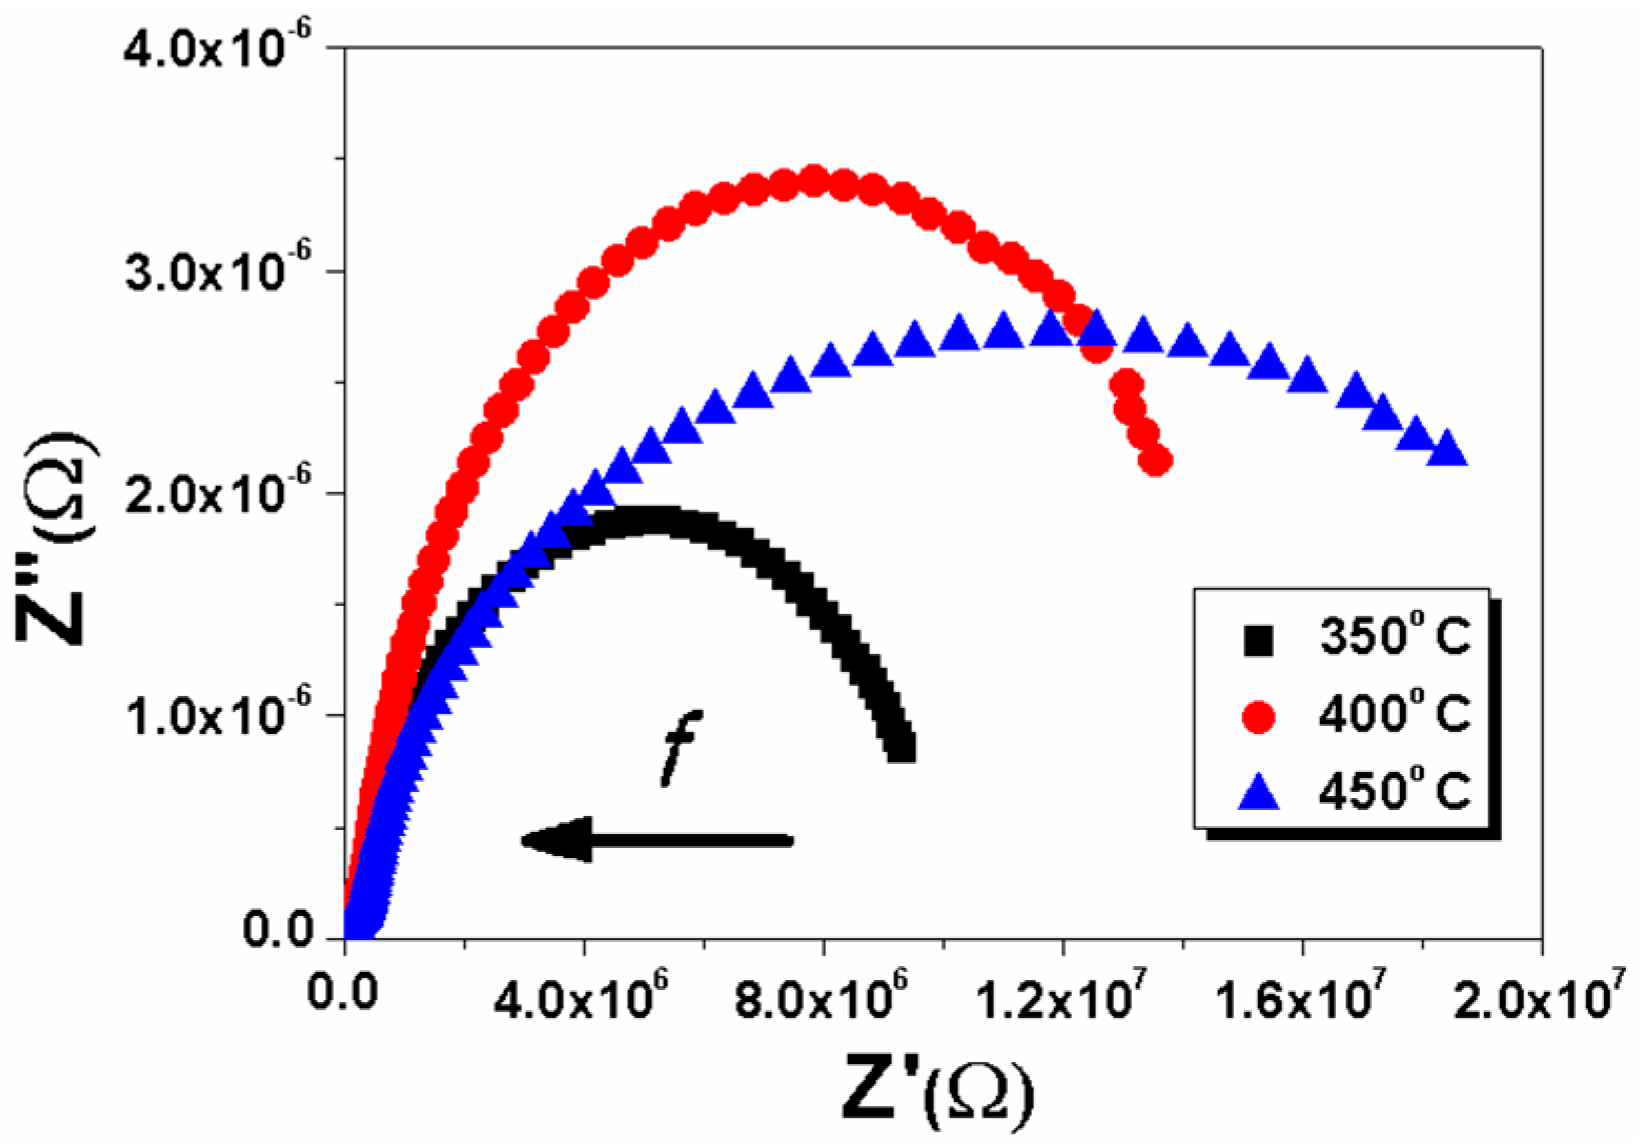
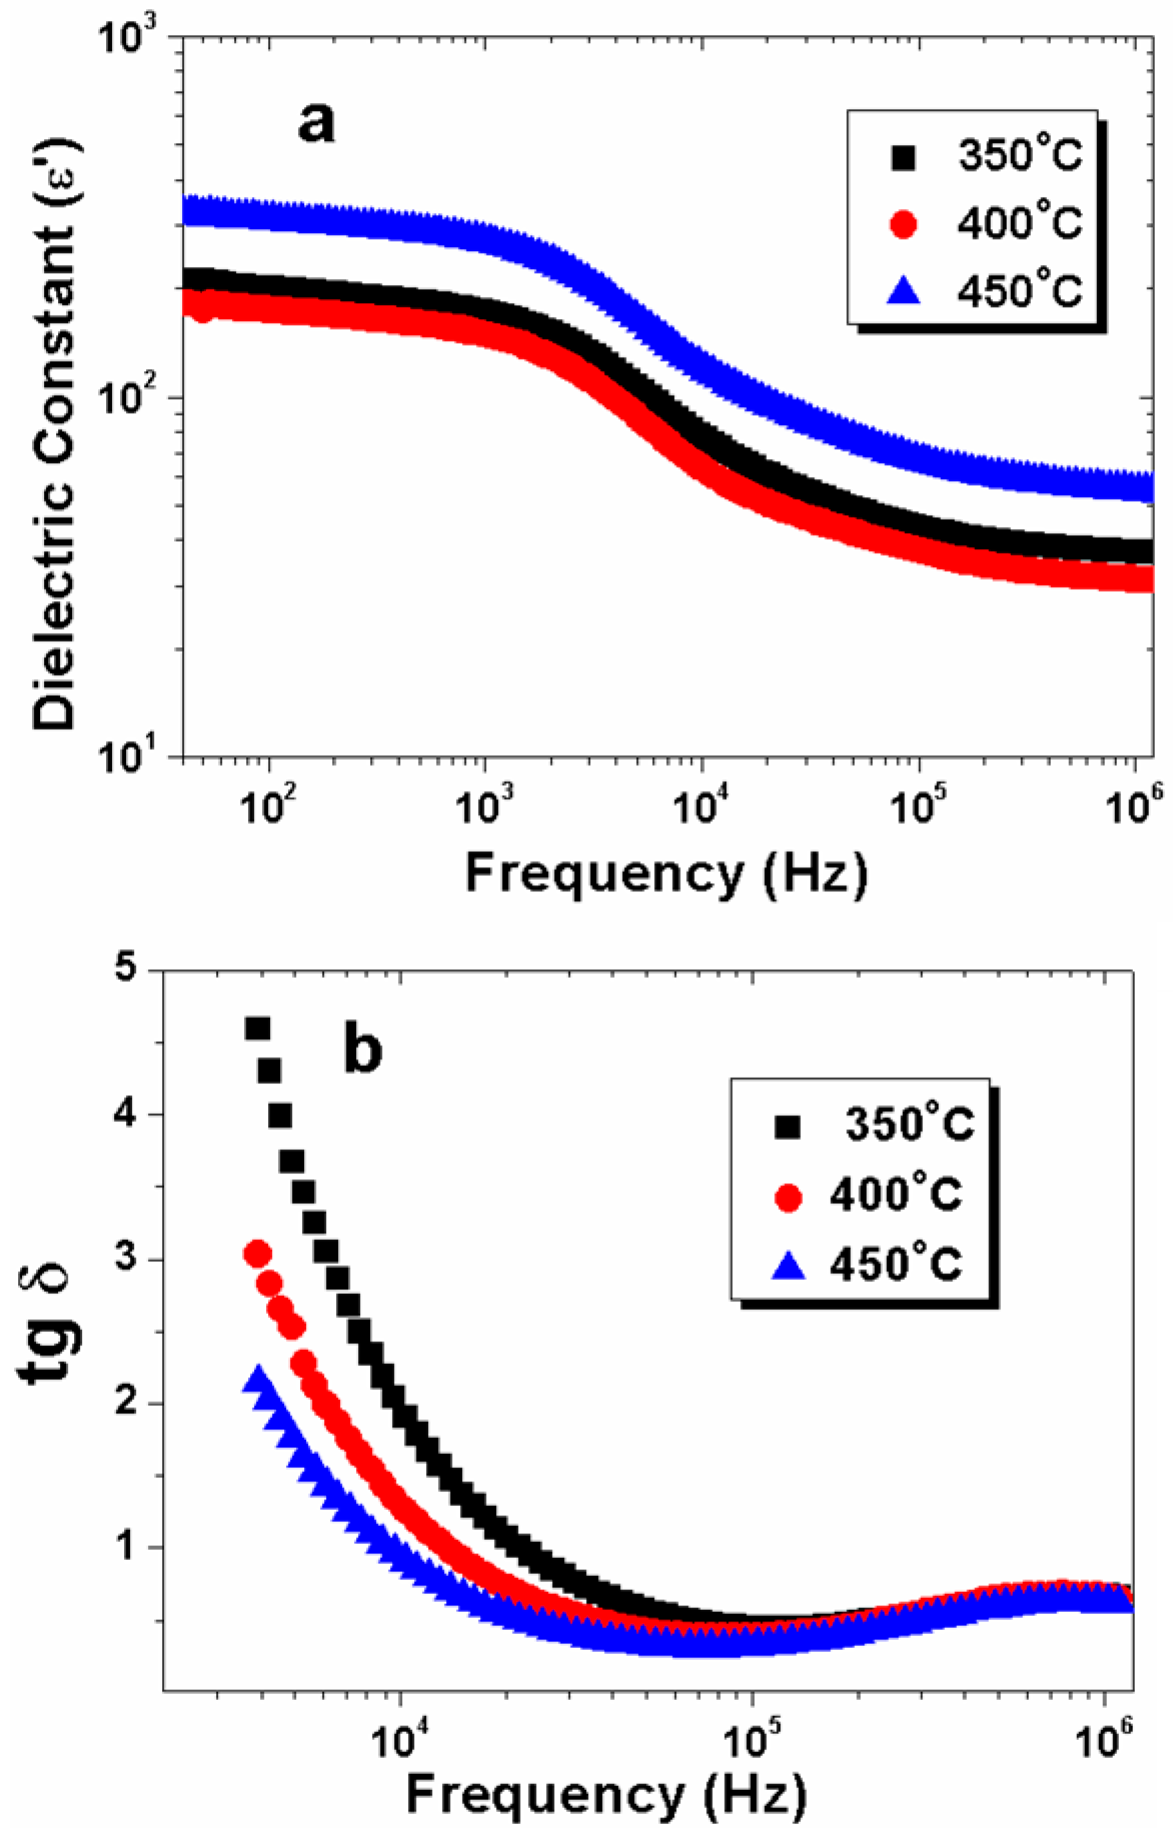
3.3. Electric and Dielectric Properties of Nickel-Cobalt Oxide Nanoparticles

Figure 5 shows the frequency variation of general conductivity σ (ω) for Ni-Co oxide NPs prepared at different temperatures. General conductivity can be calculated by the following equation:
σ = G d A
where G is the material conductance, d is the thickness and A is the surface area.
When a frequency-dependent field is applied to a dielectric material, the polarization process also depends on the frequency [38]. As is shown in Figure 5, for all of the specimens, DC conductivity (σdc) exhibits a flat frequency plateau at lower frequencies, while AC conductivity, as a frequency-dependent behavior, presents itself at higher frequencies. This may be attributed to a hopping-type conduction at a high frequency range [39]. The general conductivity shows dispersion around the frequency of 103 Hz. For the NPs, the general conductivity is an ascending function of frequency. The direct extrapolated σdc showed the value of 1.9 × 10⁻⁶ S/m, 1.3 × 10⁻⁶ S/m and 1.6 × 10⁻⁶ S/m for the NPs prepared at 350, 400 and 450 °C, respectively. These values are in the same range as that of typical insulating materials and indicate negligible change in DC conductivity by increasing the sintering temperature. However, the variation of σ (ω) with frequency indicates an overall AC behavior, which is especially more pronounced for the NPs prepared at 450 °C, whose conductivity value is the largest at high frequency ranges. This originates from the higher crystallinity in this particular sample and is consistent with the TEM and FTIR results. As illustrated by the XRD graph (Figure 2), the crystallinity is increased by raising the synthesis temperature for Ni-Co oxide NPs, which leads to less crystal defects and/or possible trapped ions. According to the decrement of these trapped ions (crystal defects), general conductivity values in Figure 2 showed more AC behavior than DC behavior, which is basically related to the reduction of free carriers to conduct the DC current [40]. For instance, the sample prepared at 350 °C showed the highest σdc, which can be due to the presence of higher free charges originated from the crystal defects to provide a slight motion to present a higher DC behavior for this sample.
The impedance of Ni-Co oxide NPs was measured at room temperature under zero bias with an applied small signal voltage of 0.5 V in the frequency range of 40 Hz–1 MHz. The total complex impedance can be expressed by:
Z = Z j Z
where Z′ and Z″ are the real and imaginary part of total impedance, respectively. The equation for the imaginary part of impedance is as follows:
Z = ω 2 C 2 G 2 + ω 2 C 2
where C, G and ω are the capacitance, admittance and frequency, respectively.
The complex impedance relation for Z′ and Z″ is plotted in the Nyquist diagram [41] indicated in Figure 6. The variation of semi-circle radii reflects the influence of different thermal treatments on crystallinity. The NPs prepared at 350 °C and 400 °C show a similar behavior. The lowest radius appears for the sample prepared at 350 °C, showing low resistance. The radius then increases for the one prepared at 400 °C that incurs the highest resistance (Z″) among the specimens. The peak resistance for both specimens occurs at high frequency ranges, implying a larger capacitive loss for these specimens with a poor polarization. In contrast, for the sample prepared at 450 °C, a different trend is detected; the peak of the semicircle is shifted toward the low frequency ranges (right side of the plot). Furthermore, a reduction in Z″ height shows that capacitance loss in the sample prepared at 450 °C is reduced, as may also be seen regarding Equation (4) for this case. This leads to a better polarization for this sample.
The dielectric response is defined by a complex permittivity as:
ε ( ω ) = ε ( ω ) i ε ( ω )
where the real and imaginary components ε′(ω) and ε′′(ω) are the storage and loss energies, respectively. Due to a resistance against the motion of atoms in the material, there exists a phase delay between alterations of the field and polarization, which is stated as a loss factor or tgδ = ε″/ε′. The energy that is absorbed from the frequency-dependent field, by the dielectric material per cycle, is directly proportional to the loss factor from the frequency-dependent field [42]. In crystalline defects, charge carriers, such as free charges, cavities and polar groups, can affect the dielectric constant [43]. For NiCo oxide NPs, the variations of frequency with dielectric constant ε′ and tgδ at room temperature are shown in Figure 7a,b. A large dispersion can be seen for ε′ in the frequency range of 40 Hz–10 MHz, where the fractional power law (ωn, n is the fractional quantity) is followed by the “universal dielectric response” [44].
As is shown in Figure 7a, the ε′ value for all specimens is higher at the low frequency range and starts to decline around the frequency of 103 Hz. The relaxation, defined as a gradual decrease in ε′ with increasing frequency, is recognizable for all of the specimens. At low frequencies, dipoles in atomic structure are able to follow the rate of external field oscillations. Nevertheless, for a high range of frequency, these dipoles begin to lag the external field, and the value of ε′ tends to change slightly. This indicates a saturation state in the polarization [45]. The ε′ values are increasing by raising synthesis temperature, whereas they are decreasing by an increase in the frequency. For all frequency ranges, the ε′ value is higher when the particle size increases due to higher crystallinity. The highest value of ε′ in all frequency ranges occurs for the sample prepared at 450 °C, which agrees with the result extracted for impedance shown in Figure 6 as better polarization for this sample.
Figure 7b shows the tgδ value for all nanoparticles, which decreases at a higher frequency range. Furthermore, it indicates a decline in tgδ values for the Ni-Co oxide NPs with a higher preparation temperature. It reaches its lowest value for the sample prepared at the highest temperature (450 °C). This phenomenon is related to low numbers of charge carriers (lack of free charge motion) in specimens prepared at higher temperature that in turn leads to a decrease in the dielectric loss value [45,46,47]. Interestingly, the high observed value of ε′ at a low frequency range may be the consequence of the interfacial effect of the electrodes and the sample (DC barrier effect) [48]. At higher frequencies, the tgδ value for all of the specimens is much smaller than the low frequency range, and there is no appreciable variation with different synthesis temperatures (Figure 7b).

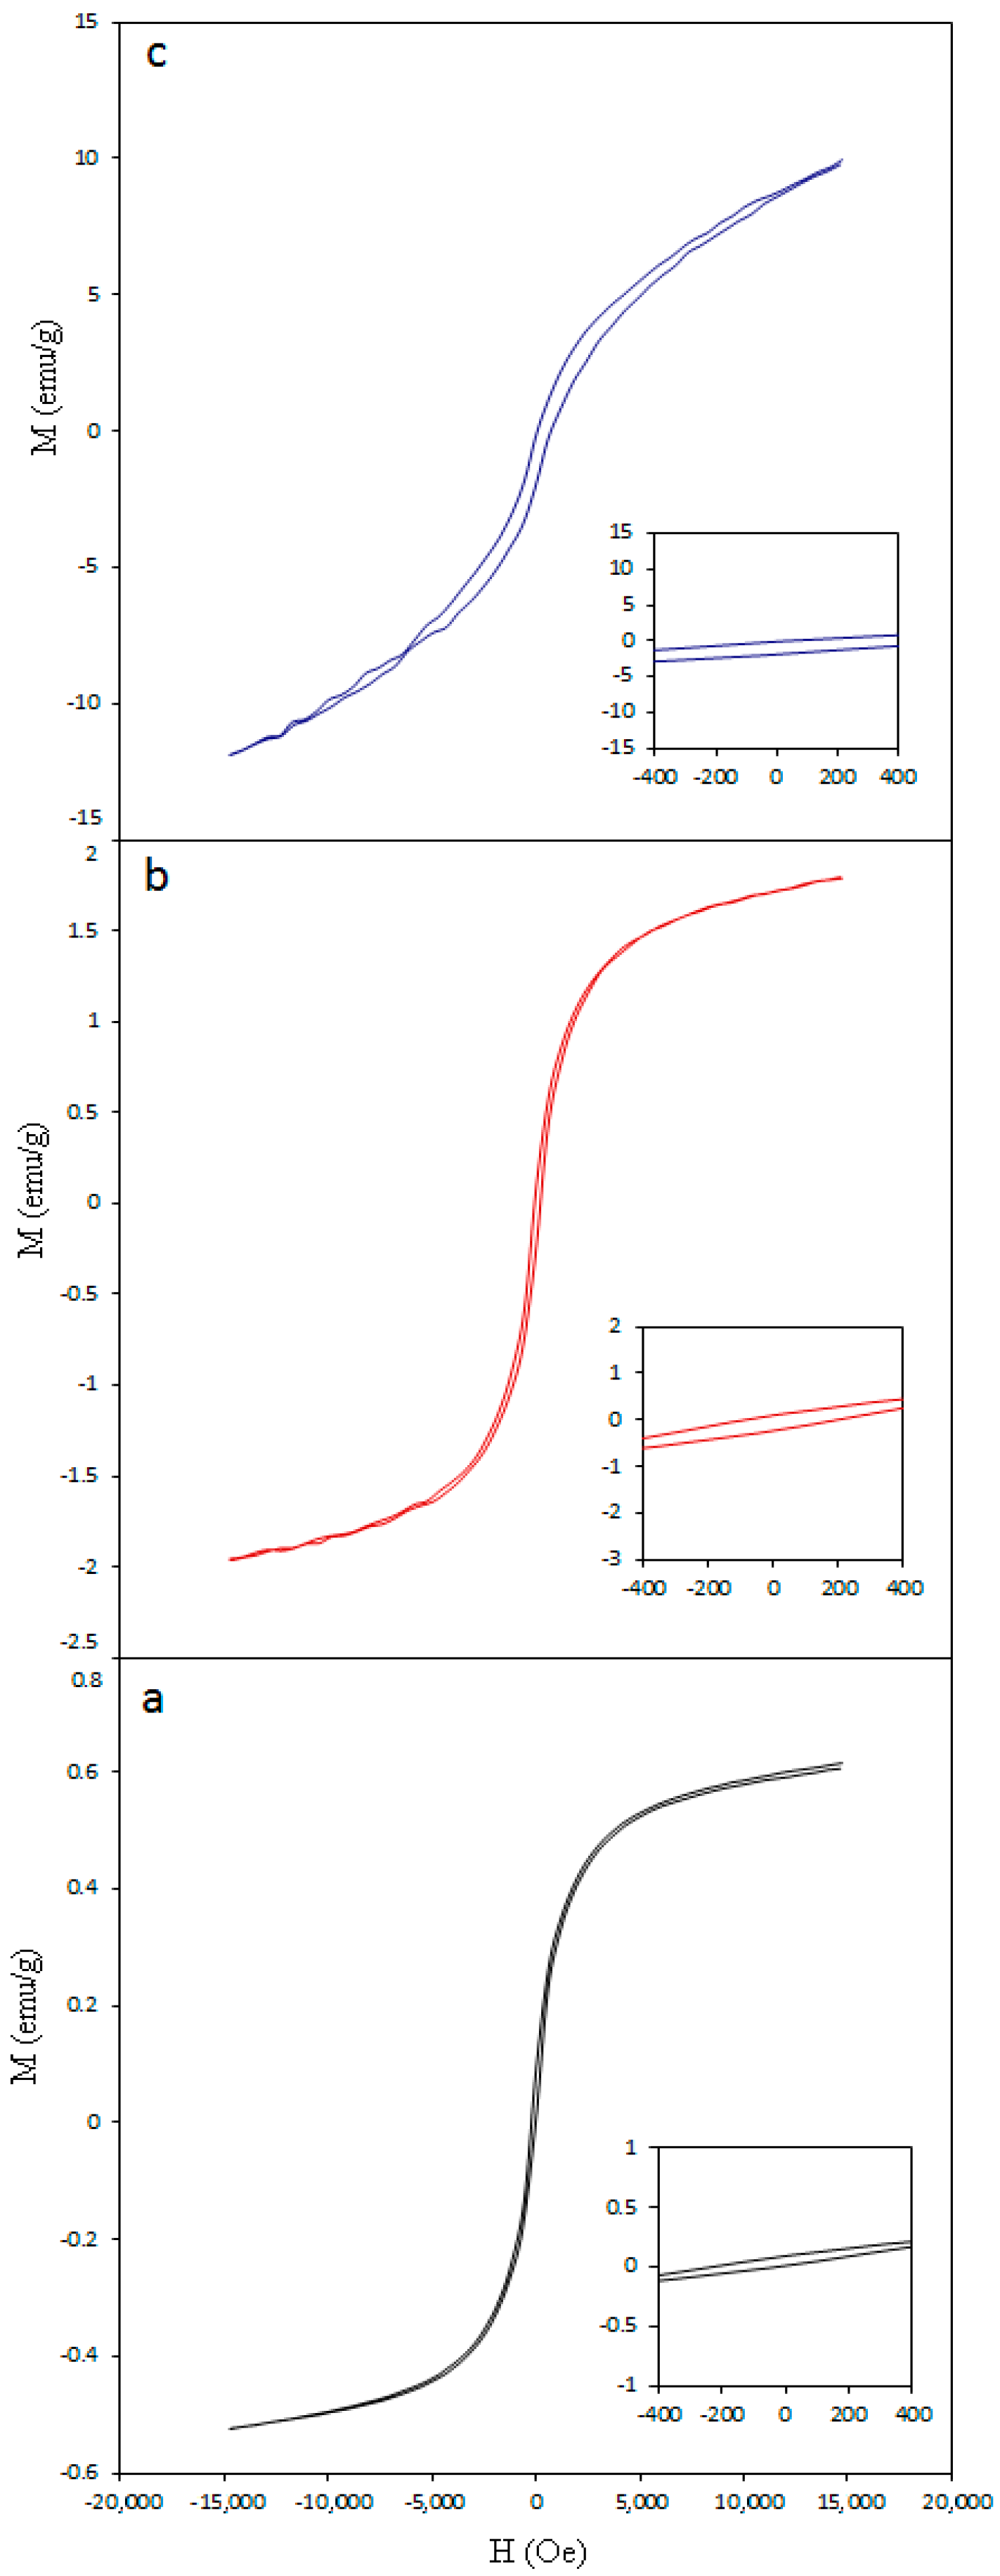
3.4. Magnetic Properties of Nickel-Cobalt Oxide Nanoparticles

Figure 8 shows the magnetization curves (M (H)) that were measured at room temperature in the range of approximately −15–+15 kOe. All of the specimens after calcinations exhibited ferromagnetic behaviors. Table 1 depicts the values of saturation magnetization (Ms) that are about 0.61, 1.79 and 9.66 electromagnetic unit per gram (emu/g) for the calcined nickel-cobalt specimens at 350, 400 and 450 °C, respectively. It was found that the values of Ms for the nickel-cobalt oxide nanoparticles were observed to increase with increasing temperature (or decreasing polymer) and particle size. The saturation magnetization values of the calcined specimens increase with increasing particle size, which may be attributed to the surface effects in these nanoparticles. The surface of the nanoparticles seems to be composed of some distorted or slanted spins that repel the core spins to align the field direction. Consequently, the saturation magnetization decreases for smaller sizes [22,29]. Furthermore, the surface is likely to behave as an inactive and dead layer with inconsiderable magnetization [28]. Figure 8 (right) shows the expanded coercivity field (Hc) of the region around the origin for clear visibility at room temperature in the range of approximately −200–+200 Oe. The coercivity field values are listed in Table 1, and the curve of their variations with the particle size of the nickel-cobalt oxide nanoparticles is also shown in Figure 8. These variations are similar to saturation magnetization because, when the particle size increases from 11–19 nm, the coercivity field increases from 98–714 Oe at room temperature. Variations of the coercivity field with the particle size of metal oxides nanoparticles can be elucidated on the basis of the domain structure, critical size and the anisotropy of the crystal [30,31,49].

4. Conclusions

The nanocrystalline form of nickel-cobalt oxide (NiO/Co3O4) was successfully fabricated using a simple thermal treatment method. The influence of the calcination temperature on the degree of crystallinity, morphology and phase composition was investigated by using different characterization techniques, i.e., XRD, TEM and FTIR, respectively. The increase in particle size from 11–35 nm was observed when the calcination temperature was increased from 350–500 °C. Variation of the general conductivity (σ), the loss factor and the dielectric constant (ε′) of all of the calcined specimens with frequency in the range of 102–106 Hz was investigated. The magnetic studies showed that the saturation magnetization and coercivity field of the nickel cobalt oxide nanoparticles increased as temperature increased.

Author Contributions

M.N. and A.D. conceived the project, designed and carried out the experimental work, conducted basic characterizations of the samples, analyzed all the data and wrote the manuscript together. H.M.K. J.H. and B.Y.M. supervised the research work and provided measurement and testing equipment, A.S. participated in writing and experimental characterization, M.A., A.N.G.-K. and R.S. synthesized, participated in sequence alignment and analyzing the data, P.D and A. K. critically revised the manuscript and participated in analyzing the data, F.L and A.A. participated in preparation and electrical characterization of the samples.

Conflicts of Interest

The authors declare no conflict of interest.

References

  1. Li, Q.; Wang, L.S.; Hu, B.Y.; Yang, C.; Zhou, L.; Zhang, L. Preparation and characterization of NiO nanoparticles through calcination of malate gel. Mater. Lett. 2007, 61, 1615–1618. [Google Scholar] [CrossRef]
  2. Xin, X.; Zhe, L.; Zhou, B.; Huang, X.; Zhu, R.; Sha, X.; Zhang, Y.; Su, W. Effect of synthesis conditions on the performance of weakly agglomerated nanocrystalline NiO. J. Alloy. Compd. 2007, 427, 251–255. [Google Scholar] [CrossRef]
  3. Hu, C.C.; Chang, K.H.; Lin, M.C.; Wu, Y.T. Design and tailoring of the nanotubular arrayed architecture of hydrous RuO2 for next generation supercapacitors. Nano Lett. 2006, 6, 2690–2695. [Google Scholar] [CrossRef] [PubMed]
  4. Hu, C.C.; Chen, W.C.; Chang, K.H. How to achieve maximum utilization of hydrous ruthenium oxide for supercapacitors. J. Electrochem. Soc. 2004, 151, A281–A290. [Google Scholar] [CrossRef]
  5. Li, C.; Zhang, H.P.; Fu, L.J.; Liu, H.; Wu, Y.P.; Rahm, E.; Holze, R.; Wu, H.Q. Cathode materials modified by surface coating for lithium ion batteries. Electrochim. Acta 2006, 51, 3872–3883. [Google Scholar] [CrossRef]
  6. Wei, T.Y.; Chen, C.H.; Chien, H.C.; Lu, S.Y.; Hu, C.C. A cost-effective supercapacitor material of ultrahigh specific capacitances: Spinel nickel cobaltite aerogels from an epoxide-driven sol-gel process. Adv. Mater. 2010, 22, 347–351. [Google Scholar] [CrossRef] [PubMed]
  7. Gibot, P.; Vidal, L. Original synthesis of chromium (III) oxide nanoparticles. J. Eur. Ceram. Soc. 2010, 30, 911–915. [Google Scholar] [CrossRef]
  8. Xu, L.; Xu, Z.; Su, C.; Zhou, N.; Zhu, X.; He, H.; Zhang, C. Solvothermal synthesis of nanosheet-like lithium manganese phosphate cathode material with the improved electrochemical performance. Mater. Res. Express 2015, 2, 035004. [Google Scholar] [CrossRef]
  9. Kim, G.P.; Nam, I.; Park, S.; Park, J.; Yi, J. Preparation via an electrochemical method of graphene films coated on both sides with NiO nanoparticles for use as high-performance lithium ion anodes. Nanotechnology 2013, 24, 475402. [Google Scholar] [CrossRef] [PubMed]
  10. Rajjab, A. Structural, magnetic and dielectric behavior of Mg1−xCaxNiyFe2−yO4 nano-ferrites synthesized by the micro-emulsion method. Ceram. Int. 2014, 40, 3841–3846. [Google Scholar]
  11. Rashad, M.M.; Mohamed, R.M.; Ibrahim, M.A.; Ismail, L.F.M.; Abdel-Aal, E.A. Magnetic and catalytic properties of cubic copper ferrite nanopowders synthesized from secondary resources. Adv. Powder Technol. 2012, 23, 315–323. [Google Scholar] [CrossRef]
  12. Medeiros, A.M.L.; Miranda, M.A.R.; de Menezes, A.S.; Jardim, P.M.; da Silva, L.R.D.; Gouveia, S.T.; Sasak, J.M. Synthesis and Characterization of Cr2O3 Nanoparticles Obtained by Gelatin. J. Metastable Nanocrystalline Mater. 2004, 20–21, 399–406. [Google Scholar] [CrossRef]
  13. Mazarío, E.; Herrasti, P.; Morales, M.P.; Menéndez, N. Synthesis and characterization of CoFe2O4 ferrite nanoparticles obtained by an electrochemical method. Nanotechnology 2012, 23, 355708–355713. [Google Scholar] [CrossRef] [PubMed]
  14. Luther, S.; Brogfeld, N.; Kim, J.; Parsons, J.G. Study of the thermodynamics of chromium(III) and chromium(VI) binding to iron(II/III) oxide or magnetite or ferrite and manganese(II) iron(III) oxide or jacob site or manganese ferrite nanoparticles. J. Colloid Interface Sci. 2013, 400, 97–103. [Google Scholar] [CrossRef] [PubMed]
  15. Guo, G.; Song, D.; Jiang, J.; Ma, A.; Zhang, L.; Cheng, L. Effect of Synthesizing Temperature on Microstructure and Electrochemical Property of the Hydrothermal Conversion Coating on Mg-2Zn-0.5Mn-Ca-Ce Alloy. Metals 2016, 6, 44. [Google Scholar] [CrossRef]
  16. Chaubey, A.K.; Scudino, S.; Khoshkhoo, M.S.; Prashanth, K.G.; Mukhopadhyay, N.K.; Mishra, B.K.; Eckert, J. Synthesis and Characterization of NanocrystallineMg-7.4%Al Powders Produced by Mechanical Alloying. Metals 2013, 3, 58–68. [Google Scholar] [CrossRef]
  17. Vasoya, N.H.; Vanpariya, L.H.; Sakariya, P.N.; Timbadiya, M.D.; Pathak, T.K.; Lakhani, V.K.; Modi, K.B. Synthesis of nanostructured material by mechanical milling and study on structural property modifications in Ni0.5Zn0.5Fe2O4. Ceram. Int. 2010, 36, 947–954. [Google Scholar] [CrossRef]
  18. Mohamed, H.; Naseri, M.G.; Sadrolhosseini, A.R.; Dehzangi, A.; Kamalianfar, A.; Saion, E.B.; Zamiri, R.; Ahangar, H.A.; Majlis, B.Y. Silver Nanoparticle Fabrication by Laser Ablation in Polyvinyl Alcohol Solutions. Chin. Phys. Lett. 2014, 31, 077803. [Google Scholar] [CrossRef]
  19. Naseri, M.; Ghasemi, R. Structure and physical properties of Fe6O8/baFe6O11 nanostructure. J. Magn. Magn. Mater. 2016, 406, 200–206. [Google Scholar] [CrossRef]
  20. Che, S.; Wang, J.; Chen, Q. Soft magnetic nanoparticles of BaFe12O19 fabricated under mild conditions. J. Phys. Condens. Mater. 2003, 15, L335–L339. [Google Scholar] [CrossRef]
  21. Maaz, K.; Mumtaz, A.; Hasanain, S.K.; Ceylan, A. Synthesis and magnetic properties of cobalt ferrite (CoFe2O4) nanoparticles prepared by wet chemical route. J. Magn. Magn. Mater. 2007, 308, 289–295. [Google Scholar] [CrossRef]
  22. Naseri, M.G.; Halimah, M.K.; Dehzangi, A.; Kamalianfar, A.; Saion, E.B.; Majlis, B.Y. A comprehensive overview on the structure and comparison of magnetic properties of nanocrystalline synthesized by a thermal treatment method. J. Phys. Chem. Solids 2014, 75, 315–327. [Google Scholar] [CrossRef]
  23. Sivakumar, P.; Ramesh, R.; Ramanand, A.; Ponnusamy, S.; Muthamizhchelvan, C. Synthesis and characterization of NiFe2O4 nanosheet via polymer assisted co-precipitation method. Mater. Lett. 2011, 65, 483–485. [Google Scholar] [CrossRef]
  24. Koebel, M.M.; Jones, L.C.; Somorjai, G.A. Preparation of size-tunable, highly monodisperse PVP-protected Pt-nanoparticles by seed-mediated growth. J. Nanopart. Res. 2008, 10, 1063–1069. [Google Scholar] [CrossRef]
  25. Roosen, A.R.; Carter, W.C. Simulations of microstructural evolution: Anisotropic growth and coarsening. Phys. A Stat. Mech. Appl. 1998, 261, 232–247. [Google Scholar] [CrossRef]
  26. Cullity, B.D. Elements of X-ray Diffraction, 2nd ed.; Addison-Wesley: London, UK, 1978; p. 102. [Google Scholar]
  27. Naseri, M.G.; Saion, E.B.; Hashim, M.; Shaari, A.H.; Ahangard, H.A. Synthesis and characterization of zinc ferrite nanoparticles by a thermal treatment method. Solid State Commun. 2011, 151, 1031–1035. [Google Scholar] [CrossRef]
  28. Naseri, M. Optical and magnetic properties of monophasic cadmium ferrite (CdFe2O4) nanostructure prepared by thermal treatment method. J. Magn. Magn. Mater. 2015, 392, 107–113. [Google Scholar] [CrossRef]
  29. Naseri, M.G.; Saion, E.B.; Ahangard, H.A.; Hashim, M.; Shaari, A.H. Synthesis and characterization of manganese ferrite nanoparticles by thermal treatment method. J. Magn. Magn. Mater. 2011, 323, 1745–1749. [Google Scholar] [CrossRef]
  30. Naseri, M.G.; Saion, E.B.; Ahangard, H.A.; Hashim, M.; Shaari, A.H. Simple preparation and characterization of nickel ferrite nanocrystals by a thermal treatment method. Powder Technol. 2011, 212, 80–88. [Google Scholar] [CrossRef]
  31. Naseri, M.G.; Saion, E.B.; Ahangar, H.A.; Shaari, A.H. Fabrication, characterization, and magnetic properties of copper ferrite nanoparticles prepared by a simple, thermal-treatment method. Mater. Res. Bull. 2013, 48, 1439–1446. [Google Scholar] [CrossRef]
  32. Naseri, M.G.; Ara, M.H.M.; Saion, E.B.; Shaari, A.H. Superparamagnetic magnesium ferrite nanoparticles fabricated by a simple, thermal-treatment method. J. Magn. Magn. Mater. 2014, 350, 141–147. [Google Scholar] [CrossRef]
  33. Salavati-Niasari, M.; Khansari, A.; Davar, F. Synthesis and characterization of cobalt oxide nanoparticles by thermal treatment process. Inorg. Chim. Acta 2009, 362, 4937–4942. [Google Scholar] [CrossRef]
  34. Naseri, M.G.; Saion, E.B.; Ahangar, H.A.; Shaari, A.H.; Hashim, M. Simple synthesis and characterization of cobalt ferrite, nanoparticles by a thermal treatment method. J. Nano Mater. 2010, 2010, 1–8. [Google Scholar]
  35. Naseri, M.G.; Saion, E.B.; Zadeh, N.K. The amazing effects and role of PVP on the crystallinity, phase composition and morphology of nickel ferrite nanoparticles prepared by thermal treatment method. Int. Nano Lett. 2013, 3, 1–8. [Google Scholar]
  36. Naseri, M.G.; Kamari, H.M.; Dehzangi, A.; Kamalianfar, A.; Saion, E.B. Fabrication of a novel chromium-iron oxide (Cr2Fe6O12) nanoparticles by thermal treatment method. J. Magn. Magn. Mater. 2015, 389, 113–119. [Google Scholar] [CrossRef]
  37. Kamari, H.M.; Naseri, M.G.; Saion, E.B. A Novel Research on Behavior of Zinc Ferrite Nanoparticles in Different Concentration of Poly(vinyl pyrrolidone) (PVP). Metals 2014, 4, 118–129. [Google Scholar] [CrossRef]
  38. Kittel, C.; McEuen, P. Introduction to Solid State Physics; Wiley: New York, NY, USA, 1996; Volume 7. [Google Scholar]
  39. Chisca, S.; Musteata, V.E.; Sava, I.; Bruma, M. Dielectric behavior of some aromatic polyimide films. Eur. Polym. J. 2011, 47, 1186–1197. [Google Scholar] [CrossRef]
  40. Soltani, N.; Dehzangi, A.; Saion, E.; Majlis, M.Y.; Zare, M.R.; Kharazmi, A.; Navasery, M. Influence of exposure time on structural, optical and electrical properties of zinc sulphide nanoparticles synthesized by microwave technique. Chalcogenide Lett. 2013, 10, 27–37. [Google Scholar]
  41. Cole, K.S.; Cole, R.H. Dispersion and absorption in dielectrics I. Alternating current characteristics. J. Chem. Phys. 1941, 9, 341. [Google Scholar] [CrossRef]
  42. Tripathi, R.; Kumar, A.; Sinha, T.P. Dielectric properties of CdS nanoparticles synthesized by soft chemical route. Pramana 2009, 72, 969–978. [Google Scholar] [CrossRef]
  43. Wan, W.; Yu, D.; Xie, Y.; Guo, X.; Mao, Z.; Huang, L. Effects of Nanoparticle Surface Treatment on the Crystalline Morphology and Dielectric Property of Polypropylene/Calcium Carbonate Nanocomposites. In Proceedings of the 1st IEEE International Conference on Nano/Micro Engineered and Molecular Systems, Zhuhai, China, 18–21 January 2006; pp. 387–390.
  44. Jonscher, A.K. The universal dielectric response. Nature 1977, 267, 673–679. [Google Scholar] [CrossRef]
  45. Dutta, P.; Biswas, S.; de, S.K. Dielectric relaxation in polyaniline-polyvinyl alcohol composites. Mater. Res. Bull. 2002, 37, 193–200. [Google Scholar] [CrossRef]
  46. Soltani, N.; Dehzangi, A.; Kharazmi, A.; Saion, E.; Yunus, W.M.; Majlis, B.Y.; Zare, M.R.; Gharibshahi, E.; Khalilzadeh, N. Structural, optical and electrical properties of ZnS nanoparticles affecting by organic coating. Chalcogenide Lett. 2014, 11, 79–9. [Google Scholar]
  47. Tharayil, N.J.; Sagar, S.; Raveendran, R.; Vaidyan, A.V. Dielectric studies of nanocrystalline nickel-cobalt oxide. Phys. B Condens. Matter 2007, 399, 1–8. [Google Scholar] [CrossRef]
  48. Kraus, M.; Eliasson, B.; Kogelschatz, U.; Wokaun, A. CO2 reforming of methane by the combination of dielectric-barrier discharges and catalysis. Phys. Chem. Chem. Phys. 2001, 3, 294–300. [Google Scholar] [CrossRef]
  49. Laokul, P.; Amornkitbamrung, V.; Seraphin, S.; Maensiri, S. Characterizationand magnetic properties of nanocrystalline CuFe2O4, NiFe2O4, ZnFe2O4 powders prepared by the Aloe vera extract solution. Curr. Appl. Phys. 2011, 11, 101–108. [Google Scholar] [CrossRef]
Figure 1. Mechanism of interactions between poly(vinyl pyrrolidone) (PVP) and metal.
Metals 06 00181 g001
Figure 2. XRD results of (a) precursor and the Ni-Co oxide NPs calcined at (b) 350, (c) 400, (d) 450 and (e) 500 °C.
Metals 06 00181 g002
Figure 3. TEM images of Ni-Co oxide NPs calcined at (a) 350, (b) 400, (c) 450 and (d) 500 °C.
Metals 06 00181 g003
Figure 4. FTIR spectra of (a) precursor and Ni-Co oxide NPs calcined at (b) 350, (c) 400, (d) 450 and (e) 500 °C.
Metals 06 00181 g004
Figure 5. Variation of general conductivity with frequency for the Ni-Co oxide NPs.
Metals 06 00181 g005
Figure 6. Nyquist diagram of Ni-Co oxide NPs for impedance.
Metals 06 00181 g006
Figure 7. Variation of dielectric constant (a) and tgδ (b) with frequency for Ni-Co oxide NPs.
Metals 06 00181 g007
Figure 8. The magnetization curves of the nickel-cobalt oxide nanoparticles calcined at (a) 350, (b) 400 and (c) 450, which were measured at room temperature in the range of approximately −15 k–+15 kOe; (right) the expanded field region around the origin for clear visibility for the readers, in the range of approximately −400–+400 Oe.
Metals 06 00181 g008
Table 1. Average particle sizes calculated from XRD results, average particle sizes observed from TEM images, as well as the wave number determined from FTIR spectroscopy and magnetic properties measured from the vibrating sample magnetometer (VSM) technique at room temperature for nickel-cobalt oxide nanoparticles.
Ni-Co Oxide Nanoparticles Calcined at (°C)Average Particle Size XRD (nm)Average Particle Size TEM (nm)Wave Number (cm−1)Saturation Magnetization Ms (emu/g)Coercivity Field (Oe)
ν1ν2ν3
3501411 ± 44015566540.6198
4001712 ± 43945586581.79157
45018.519 ± 3.53895546569.66714
5003235 ± 9388545669--

