Article

First-Principles Study on the Structural Stability and Segregation Behavior of γ-Fe/Cr2N Interface with Alloying Additives M (M = Mn, V, Ti, Mo, and Ni)

1
College of Materials Science and Engineering, Taiyuan University of Technology, No. 79, Yingze Street, Wanbolin District, Taiyuan 030024, China
2
Key Laboratory of Interface Science and Engineering in Advanced Materials, Taiyuan University of Technology, Ministry of Education, Taiyuan 030024, China
3
College of Materials Science and Engineering, Taiyuan University of Science and Technology, Taiyuan 030024, China
4
Taiyuan Iron & steel Co., Ltd., Taiyuan 030003, China
*
Author to whom correspondence should be addressed.
Metals 2016, 6(7), 156; https://doi.org/10.3390/met6070156
Submission received: 10 April 2016 / Revised: 31 May 2016 / Accepted: 29 June 2016 / Published: 9 July 2016

Abstract

:
This study investigated the structural stability and electrochemical properties of alloying additives M (M = Mn, V, Ti, Mo, or Ni) at the γ-Fe(111)/Cr2N(0001) interface by the first-principles method. Results indicated that V and Ti were easily segregated at the γ-Fe(111)/Cr2N(0001) interface and enhanced interfacial adhesive strength. By contrast, Ni and Mo were difficult to segregate at the γ-Fe(111)/Cr2N(0001) interface. Moreover, the results of the work function demonstrated that alloying additives Mn reduced local electrochemical corrosion behavior of the γ-Fe(111)/Cr2N(0001) interface by cutting down Volta potential difference (VPD) between clean γ-Fe(111) and Cr2N(0001), while alloying additives V, Ti, Mo, and Ni at the γ-Fe(111)/Cr2N(0001) interface magnified VPD between clean γ-Fe(111) and Cr2N(0001), which were low-potential sites that usually serve as local attack initiation points.

Graphical Abstract

1. Introduction

High-nitrogen austenitic steels (HNAS) are widely used in many industrial fields owing to their excellent corrosion resistance and mechanical properties. As an interstitial element, nitrogen dissolved in solid solution holds several beneficial effects on the mechanical properties of steels, especially related to an excellent combination of high yield strength and high fracture toughness. The excellent properties of HNAS are damaged by nitride precipitation during thermal progress such as hot forming, heat treatment, and welding, etc. [1,2,3,4,5,6,7].
Precipitation behavior of HNAS has been studied mainly focusing on the effect of nitrogen addition on the precipitation of the second phases, and properties of HNAS. Cr2N precipitaion deteriorated the toughness, especially in the presence of cellular-type Cr2N, and decreased corrosion resistance by forming Cr- and N- depleted regions in the vicinity of the Cr2N [8,9,10,11]. HNAS not only contains a certain amount of Cr, Ni, Mn, and nitrogen, but is also composed of a number of microalloys, e.g., Mo, Nb, V, Ti, and carbon, which can form carbide, nitride, or carbonitride. However, the effect of alloy elements on the properties of steel depends on the type and characteristics. V, as a strong nitride former, improves wear resistance by promoting nitride dispersion in the austenite matrix [12]. Mo can improve creep strength by solid solution hardening [13]. However, grain boundary is considered as the most favored segregation site because of its high interfacial energy [14]. Segregation of alloy additions at grain boundaries substantially affects microstructural evolution and the mechanical properties of HNAS. Many studies have been carried out related to the precipitation behavior and corrosion resistance in the HNAS, while only a few investigations exist for the effect of alloy elements on phase interfaces that formed by precipitation and the austenite matrix. Additionally, finding published data on the γ-Fe/Cr2N interface with alloy elements, which is examined in this study, is difficult to accomplish.
The present study aims to examine the structural stability and electrochemical properties of different alloying additives M (M = Mn, V, Ti, Mo, or Ni) on the γ-Fe/Cr2N interface using the first-principles method. We pursue such a goal to provide some theoretical basis for the alloy design and heat processes.

2. Calculation Method

First-principles calculations were carried out using the CASTEP (Cambridge Sequential Total Energy Package) code, which is based on density functional theory [15,16]. We used local density approximation with the Ceperle-Alder-Perdew-Zunger (CAPZ) functional [17,18] as the exchange correlation functional. All the atoms in the slabs were allowed to relax freely to the ground state by minimizing Hellmann-Feynman forces. Ultrasoft pseudopotentials, which are known for their high efficiency in calculating structural and electronic properties, were expanded within a plane-wave basis set. A cut-off kinetic energy of 340 eV was adopted in our calculations. The Brillouin zone was sampled with Monkhorst-Pack k-point grid [19], and a [4 × 4 × 1] k-point mesh was employed for the slabs. The convergence parameters used in the calculations were as follows: total energy tolerance, 1.0 × 10⁻⁵ eV/atom; maximum force tolerance, 0.03 eV/Å; maximal stress component, 0.03 GPa; and maximal displacement, 1 × 10⁻⁵ Å. Full relaxation was allowed, and structural relaxation was terminated when the four convergence parameters were satisfied simultaneously.
To validate the accuracy of the current theoretical scheme, the crystal lattice constants of γ-Fe (fcc) and Cr2N were calculated. Cr2N exhibits a trigonal crystal structure and includes six Cr atoms and three N atoms on the basis of the Wyckoff positions of the atoms, in particular, close-packed array of Cr atoms with octahedral sites filled with N atoms [20]. As an austenitic stainless steel, Fe crystallizes in the fcc structure, so the magnetic effects were not considered and calculations were non-spin polarized, we discuss only the role of chemical interactions in this paper. These results were shown in Table 1, the deviations between the simulated results and experimental data were also shown in Table 1. Our results are very close to the experimental results and the other calculated values for γ-Fe [21,22,23] and Cr2N [24,25]. Good agreement between the crystallattice constants obtained validates the applicability of the selected methodology for studying interfacial adhesion.

3. Results and Discussion

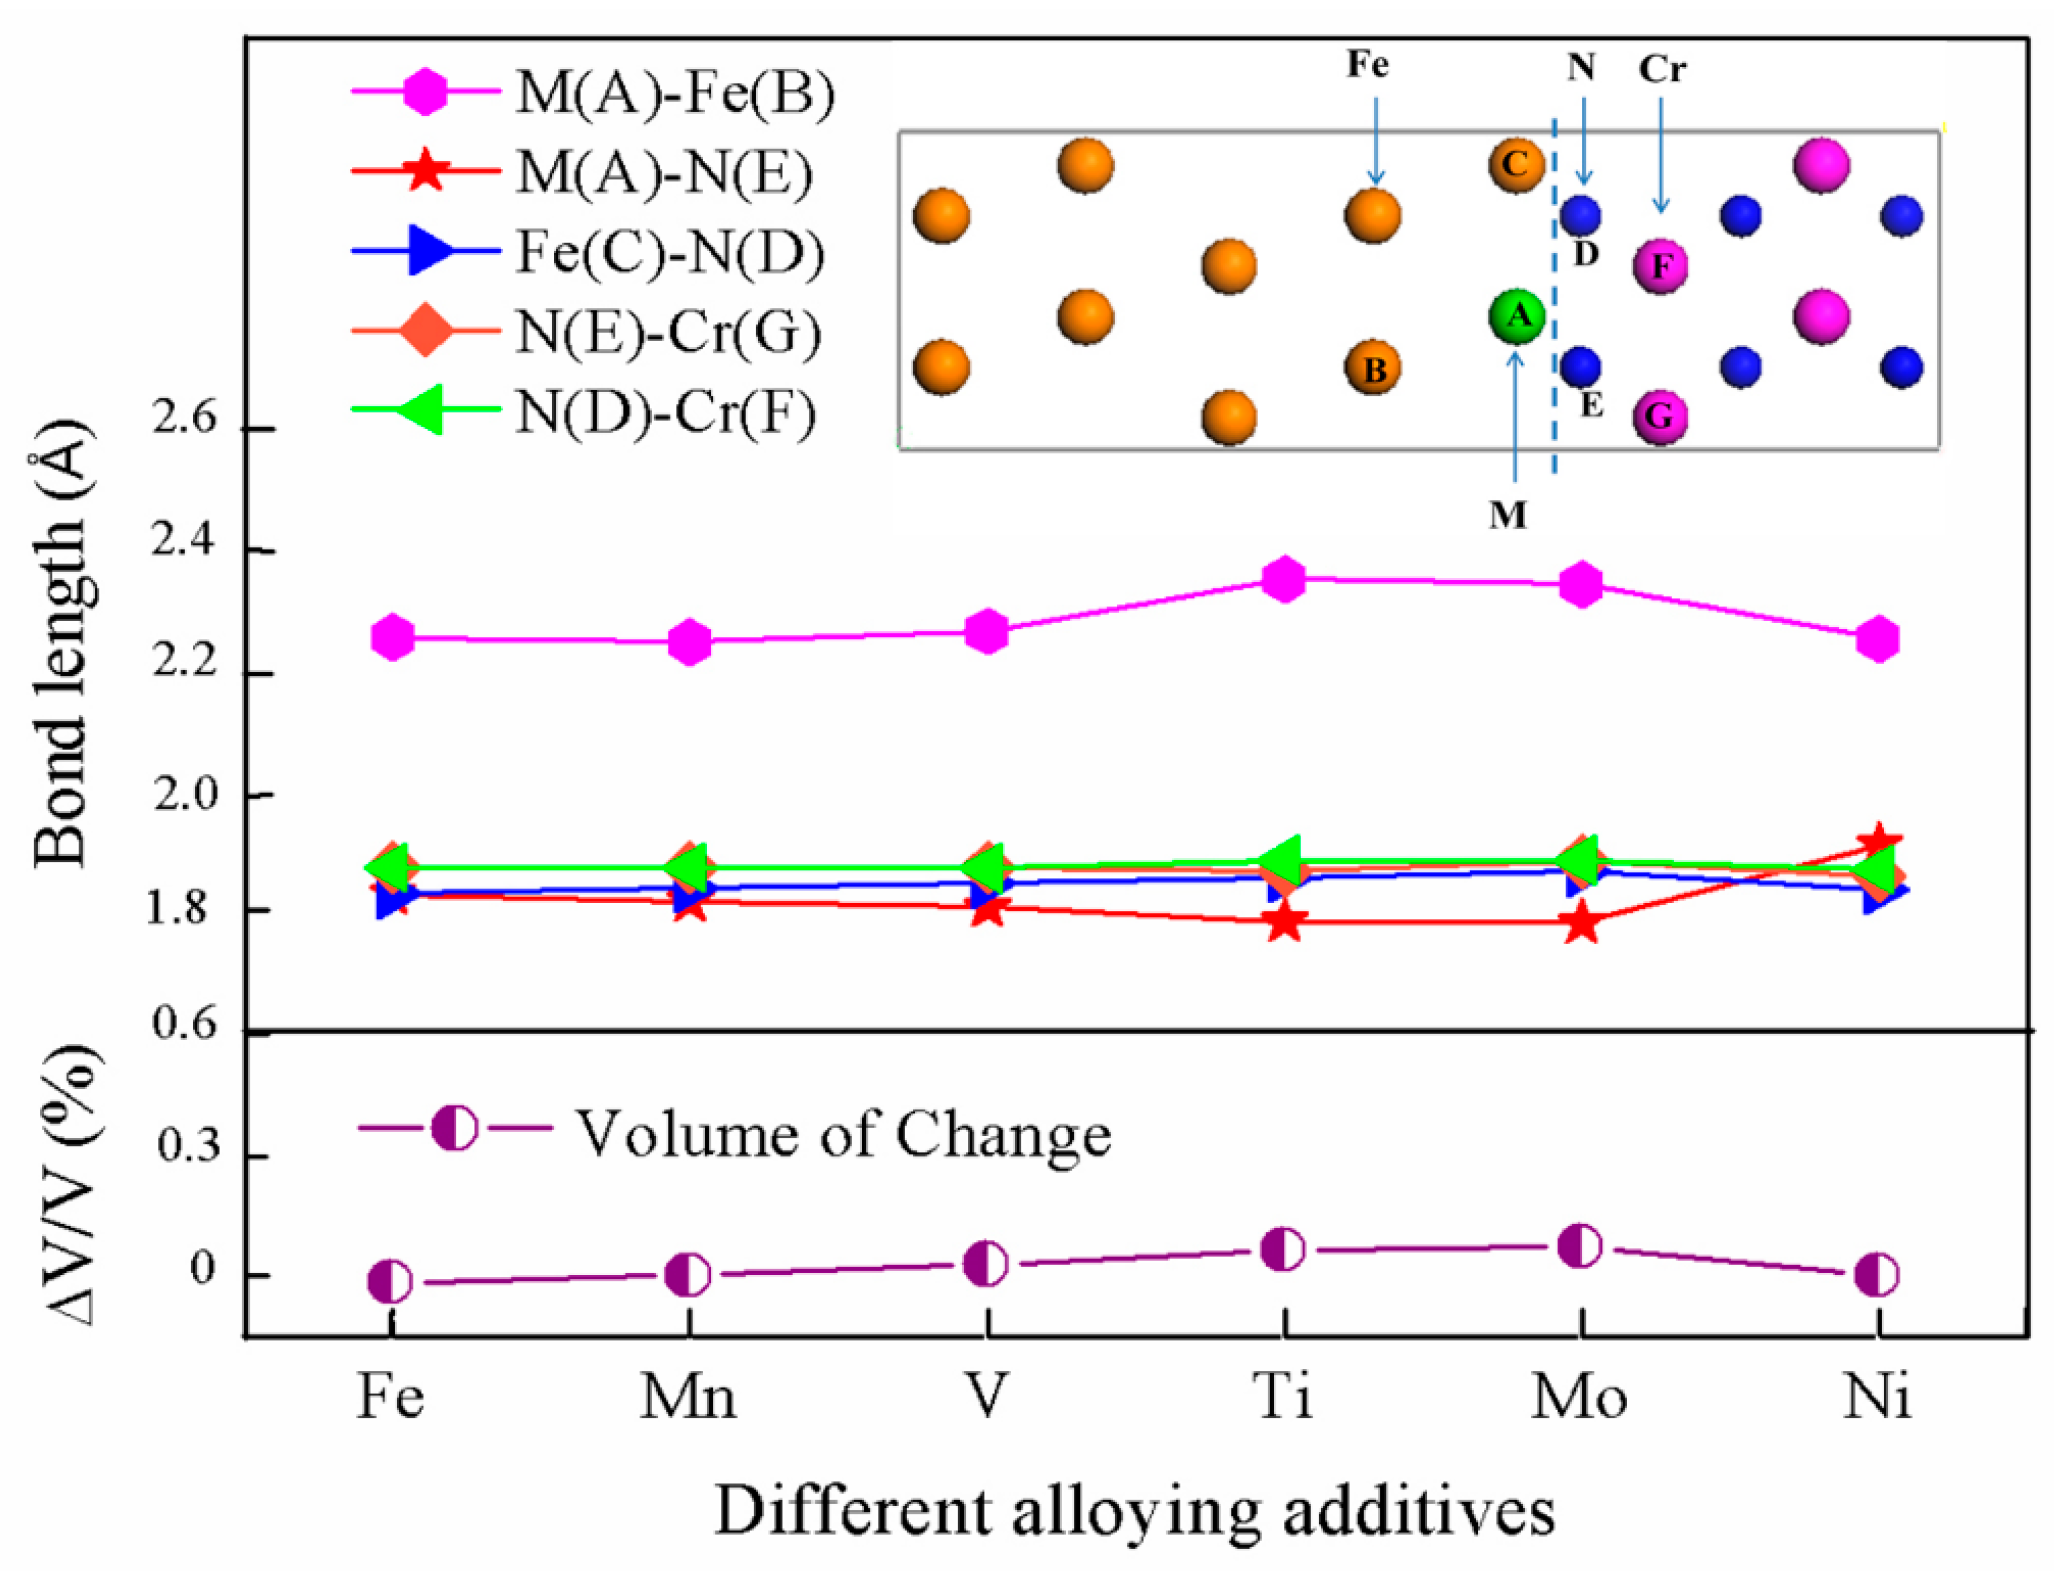
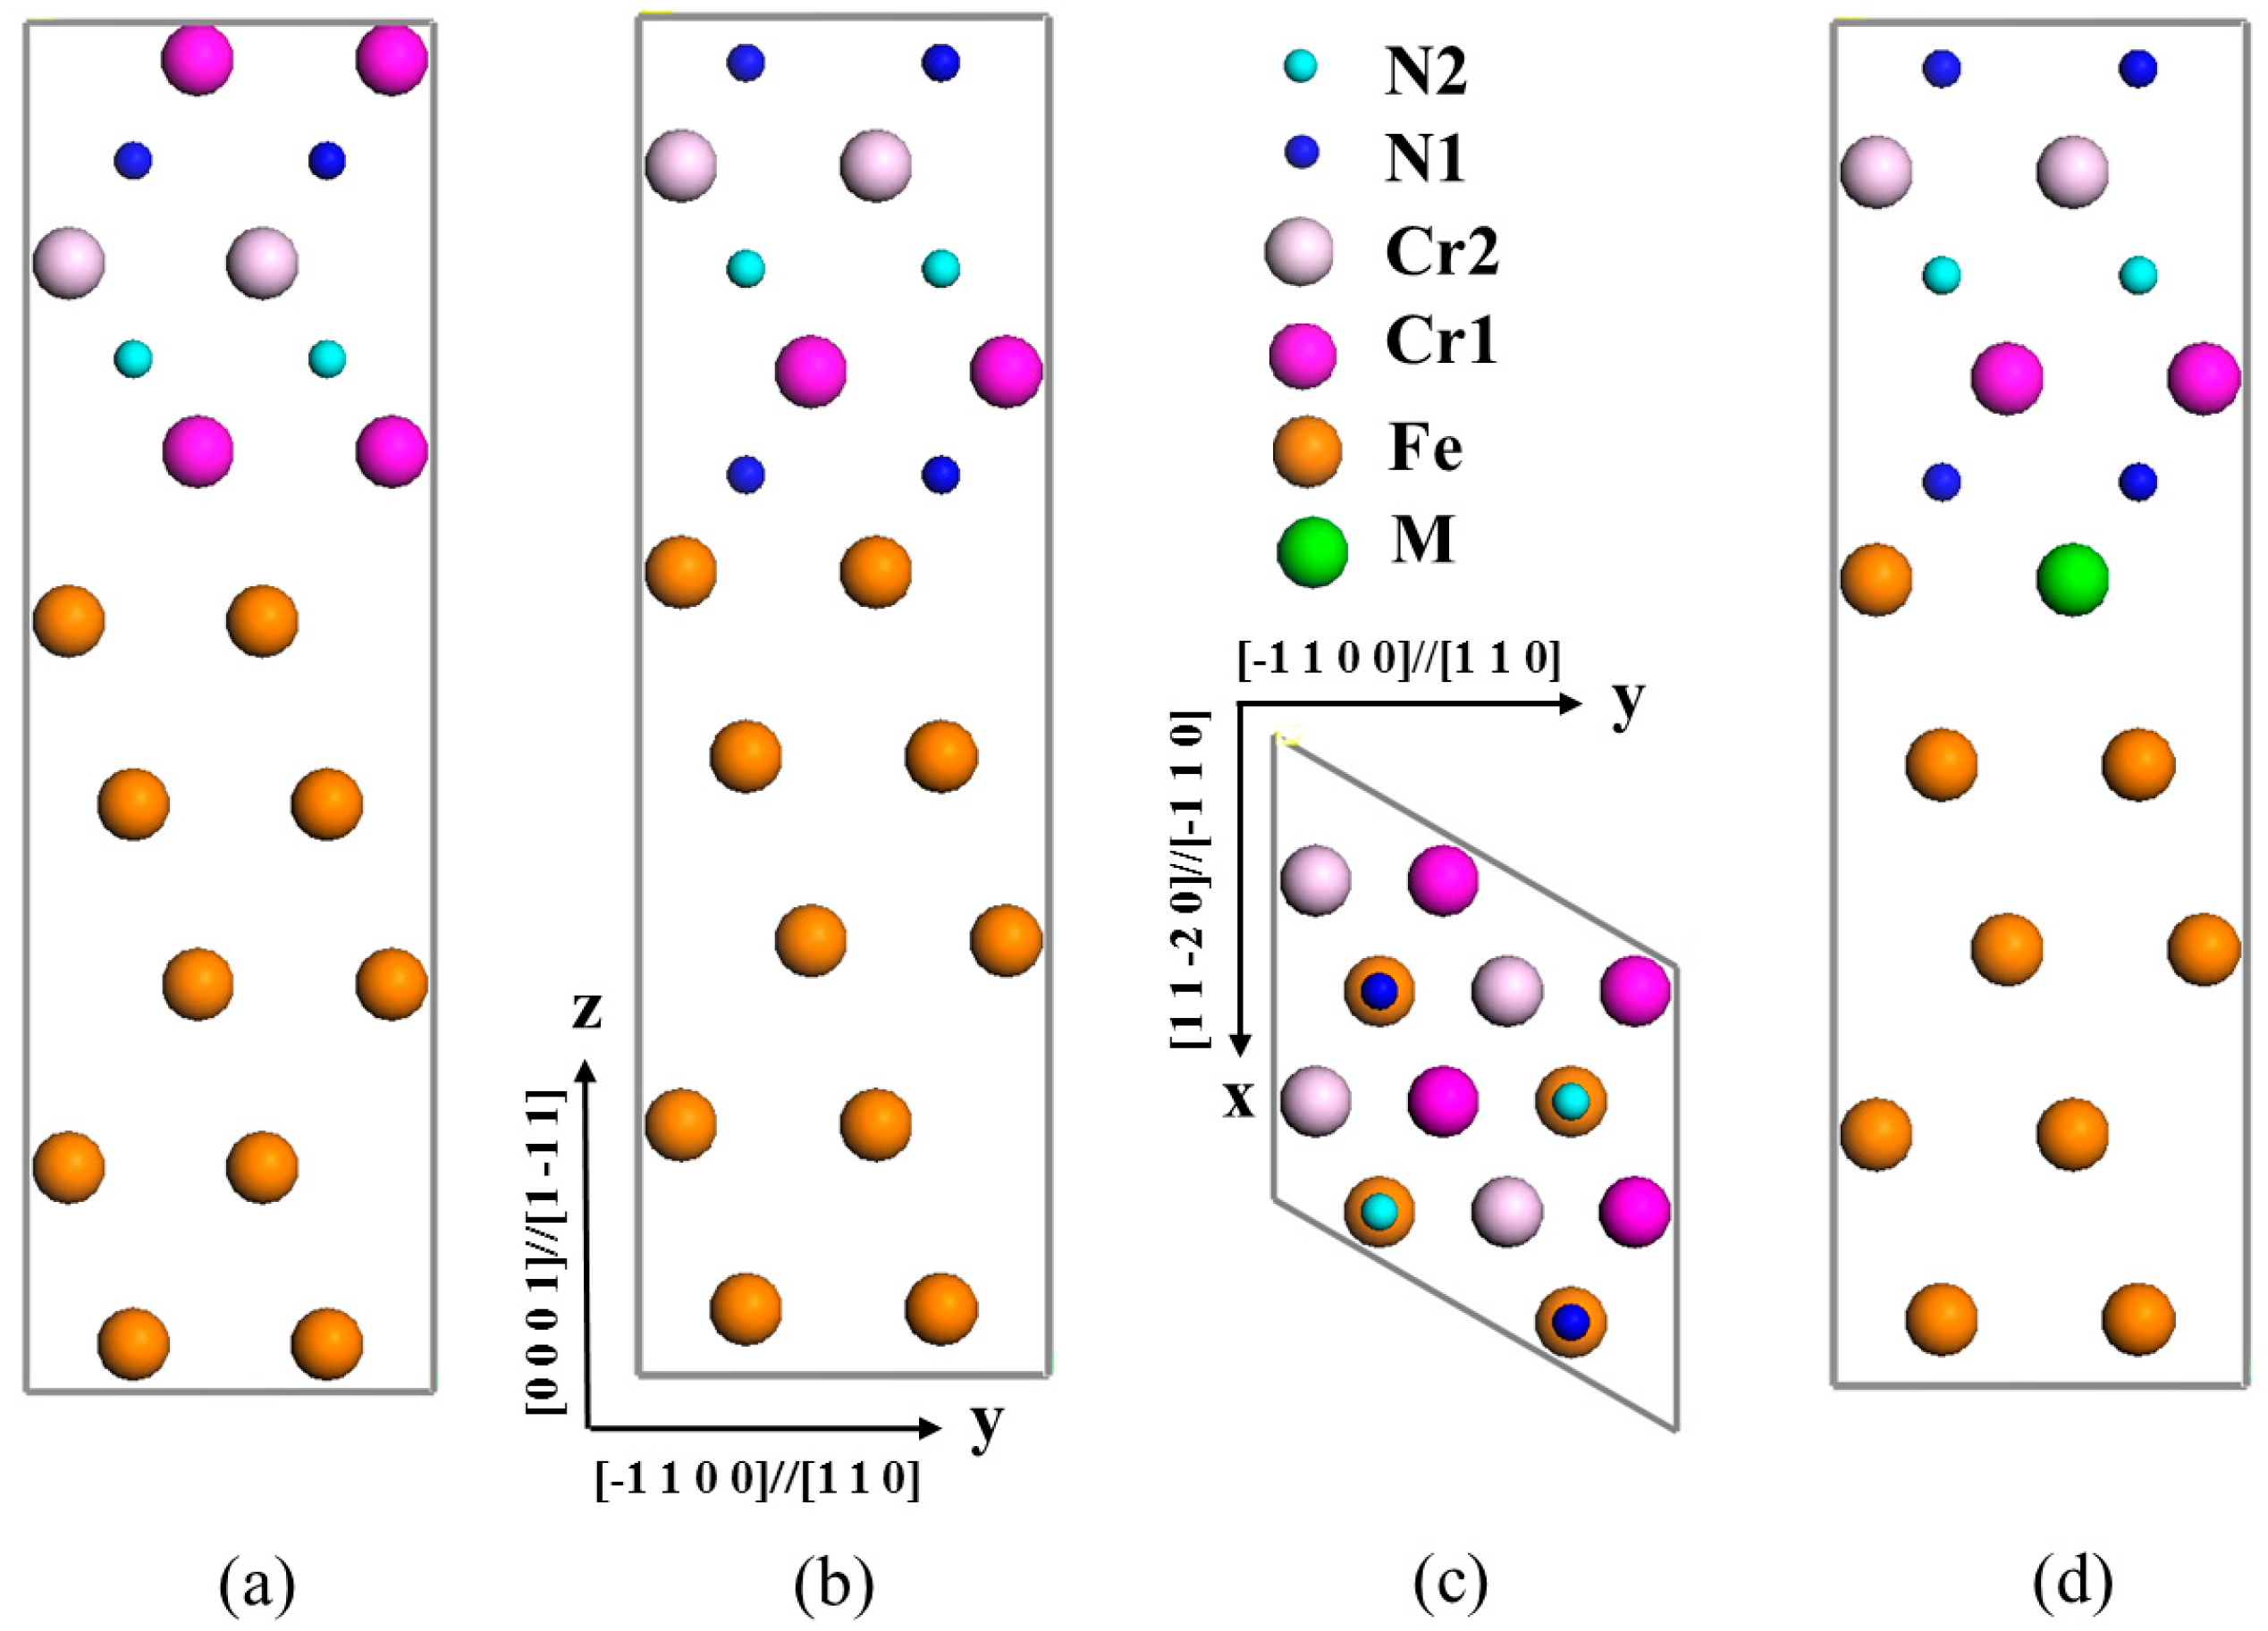
3.1. Interface Structure of γ-Fe/Cr2N

Cr2N in the trigonal unit cell are stacked along the [0001] direction following the sequence R-Cr4-N2-Cr4-N2-R, where R represents the continuing sequence in the bulk. Two unique stoichiometric slice planes, namely, Cr-terminated and N-terminated can be found in Cr2N(0001) stacking sequence. Considering the experimental results, we noted that the orientation relationship between Cr2N and γ-Fe was that of Burgers [26,27]: [110]γ-Fe// [ 1100 ] Cr 2 N and (111)γ-Fe// ( 0001 ) Cr 2 N . At first, we calculated surface energies σsurf of γ-Fe(111) and Cr2N(0001):
σ surf = 1 2 A [ E slab n n Δ E ]
where E slab n is the total energy of an n-layer slab, ΔE is the incremental energy determined by ( E slab n E slab n 2 ) / 2 , and A is the total surface area.
To prevent the interactions between the slab and its periodic images, a vacuum region of at least 10 Å was included in a 2 × 2 supercell. The calculated surface energy of the clean γ-Fe(111) is 3.581 J/m2, which is in agreement with available theoretical value of 3.62 J/m2 for γ-Fe(111) [28]. The calculated surface energies for N-terminated Cr2N(0001) and Cr-terminated Cr2N(0001) are 2.824 J/m2 and 1.913 J/m2, respectively. The calculated surface energies of the N-terminated Cr2N(0001) is slightly larger than that of Cr-terminated Cr2N(0001), implying that the N-terminated surface is energetically favorable to form the γ-Fe/Cr2N interface.
To investigate the interfacial property, we focus on studying the interfacial structure. To simplify the model, we addressed the Cr-terminated and N-terminated γ-Fe(111)/Cr2N(0001) interfaces shown in Figure 1a,b. A five-layer γ-Fe(111) slab was placed on the Cr2N(0001) slab in a 2 × 2 supercell. A substantial amount of lattice mismatch (2.1%) was present between γ-Fe(111) and Cr2N(0001) slabs, we obtained the average lattice constants of γ-Fe and Cr2N slabs as interface lattice constants. In Figure 1a, a 36-atom supercell was built to simulate the γ-Fe/Cr2N interface, which contain two Fe/N boundaries as follows: one is in the middle, and the other is on the top/bottom edge. In Figure 1b, the γ-Fe/Cr2N interface was modeled by a 34-atom supercell containing two Fe/Cr boundaries. The supercell area was calculated as 0.214 nm2. Considering the atomic matching of two phases, numerous constructions in the interface model were expected. However, after relaxation, most of the constructions converged into the same structure. Therefore, by adopting the adhesion energy criterion, we calculated the Cr- and N-terminated interface, respectively.
Adhesion energies were then calculated for all the geometries after allowing for atomic relaxations. The ideal work of adhesion, Wad is defined as the reversible work needed to separate an interface into two free surfaces in a theoretical experiment, and characterizes the strength of the metal/ceramic interface [29]. In this simulation, the Wad related to the adhesive properties of the γ-Fe(111)/Cr2N(0001) interface can be easily calculated in the slab model as follows:
W ad = ( E Fe + E Cr 2 N E Fe / Cr 2 N ) / 2 A
where EFe and E Cr 2 N are the total energy of fully relaxed, isolated γ-Fe and Cr2N slabs in the same supercell when one of the slab is retained and the other is replaced by a vacuum. E Fe / Cr 2 N denotes the total energy of γ-Fe(111)/Cr2N(0001) interface system. A is the interface area of the unit cell. In general, the experimental cleavage energy values exceed Wad because of plasticity and diffusion. Larger Wad requires a higher energy for cleavage. Hence, the work of adhesion provides a useful quantity readily accessible to theoretical calculation or simulation.
We calculate the total energies of the relaxed interfaces. The total energy of N-terminated and Cr-terminated Cr2N/γ-Fe interfaces are −38559.821, and −47873.051 eV, respectively. A difference exists between total energy of N-terminated and Cr-Cr2N/γ-Fe interfaces. Wad values obtained from N-terminated Cr2N/γ-Fe configuration (4.396 J/m2) is slightly larger than that of the Cr-terminated one (4.178 J/m2), suggesting that N-terminated interface is energetically favorable. This discrepancy of adhesion work value can be attributed to the weak hybridization and negligible interfacial charge transfer of the Cr-terminated interface compared with strong ionic-covalent interactions and significant charge transfer of the N-terminated interface. Similar simulations were reported for the adhesion of different stoichiometric metal/nonmetal interfaces [30,31,32]. Thus, we chose (b) the N-terminated interface configuration was chosen as our initial γ-Fe(111)/Cr2N(0001) interface structure in the subsequent calculations.

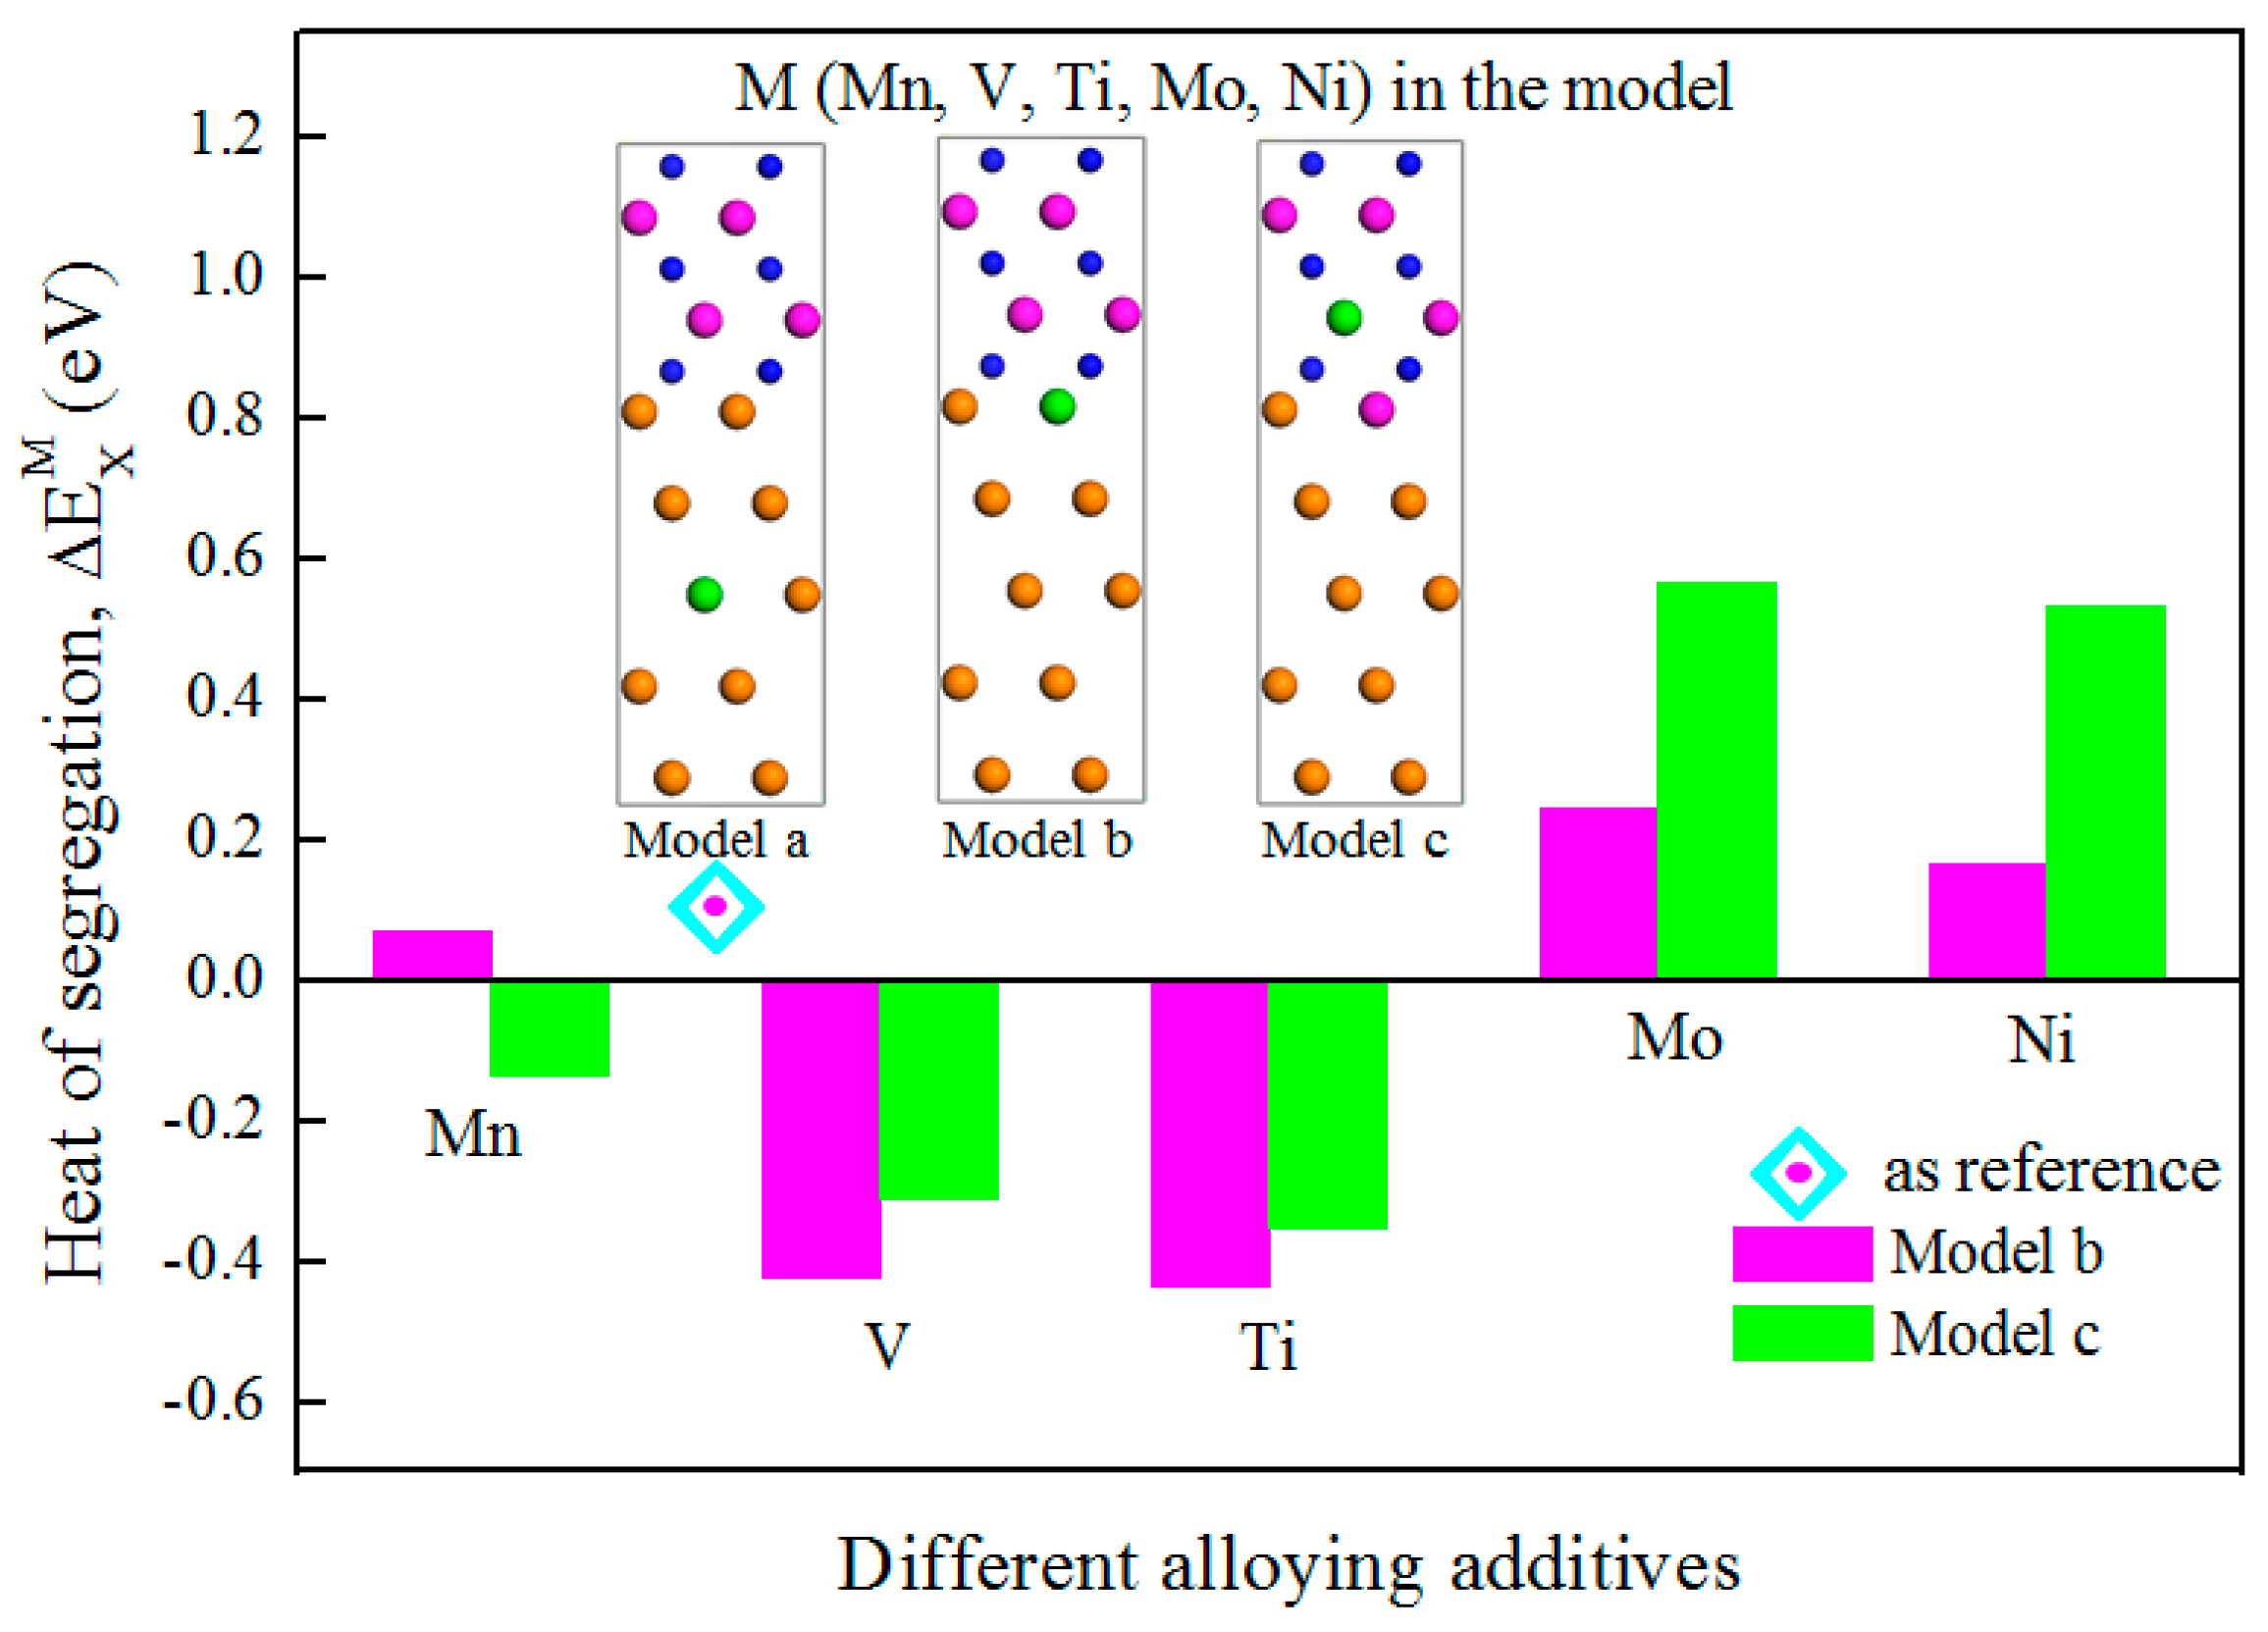
3.2. Segregation Behavior

Given the Section 3.1 interface structure of γ-Fe/Cr2N, we further studied the γ-Fe(111)/Cr2N(0001) interface after introducing M (M = Mn, V, Ti, Mo, or Ni) shown in Figure 1d. To investigate the preferred site and segregation behavior of different alloying additives on the γ-Fe(111)/Cr2N(0001) interface, the heats of segregation ( Δ E X M ) of the γ-Fe/Cr2N interfaces after introduction of M (M = Mn, V, Ti, Mo, or Ni) were investigated. The segregation energy Δ E X M of M at site X can be written as [33]:
Δ E X M = E M X tot E M matrix tot
where E M X tot and E M matrix tot are total energies of the supercells for M at site X (X is in the interface or in precipitated phase) and that for M in the matrix, respectively. In this method, we adopt the state with M embodied in the matrix as reference, and avoid calculating the pure-element reference states. A negative segregation energy indicates that M can transfer from the matrix to site X, whereas a positive segregation energy indicates that M prefers to dissolve within the matrix. The segregation energy reflects the competitive capacity of trapping M between the matrix, the interface, and the precipitated phase. This strategy has been previously used to predict segregation behavior in the α-Fe/Cu interface [33] and partition behavior between cementite and ferrite [34]. Moreover, the method has been verified to be appropriate.
Herein, we use the state with M (M = Mn, V, Ti, Mo, or Ni) embodied in Model A as reference. The calculated value of Δ E X M are shown in Figure 2. For T-, V- alloying additive systems, Δ E X M < 0, indicate that Ti and V more easily transfer from the matrix to the interface than other atoms. For Mo-, Ni- alloying additive systems, Δ E X M > 0, indicating that these alloying additives prefer to dissolve within the γ-Fe matrix. By contrast, the Δ E X M of Mn- alloying additive systems reflect that Mn prefers to dissolve within the Cr2N precipitated phase or the γ-Fe matrix rather than segregate at the γ-Fe(111)/Cr2N(0001) interface.

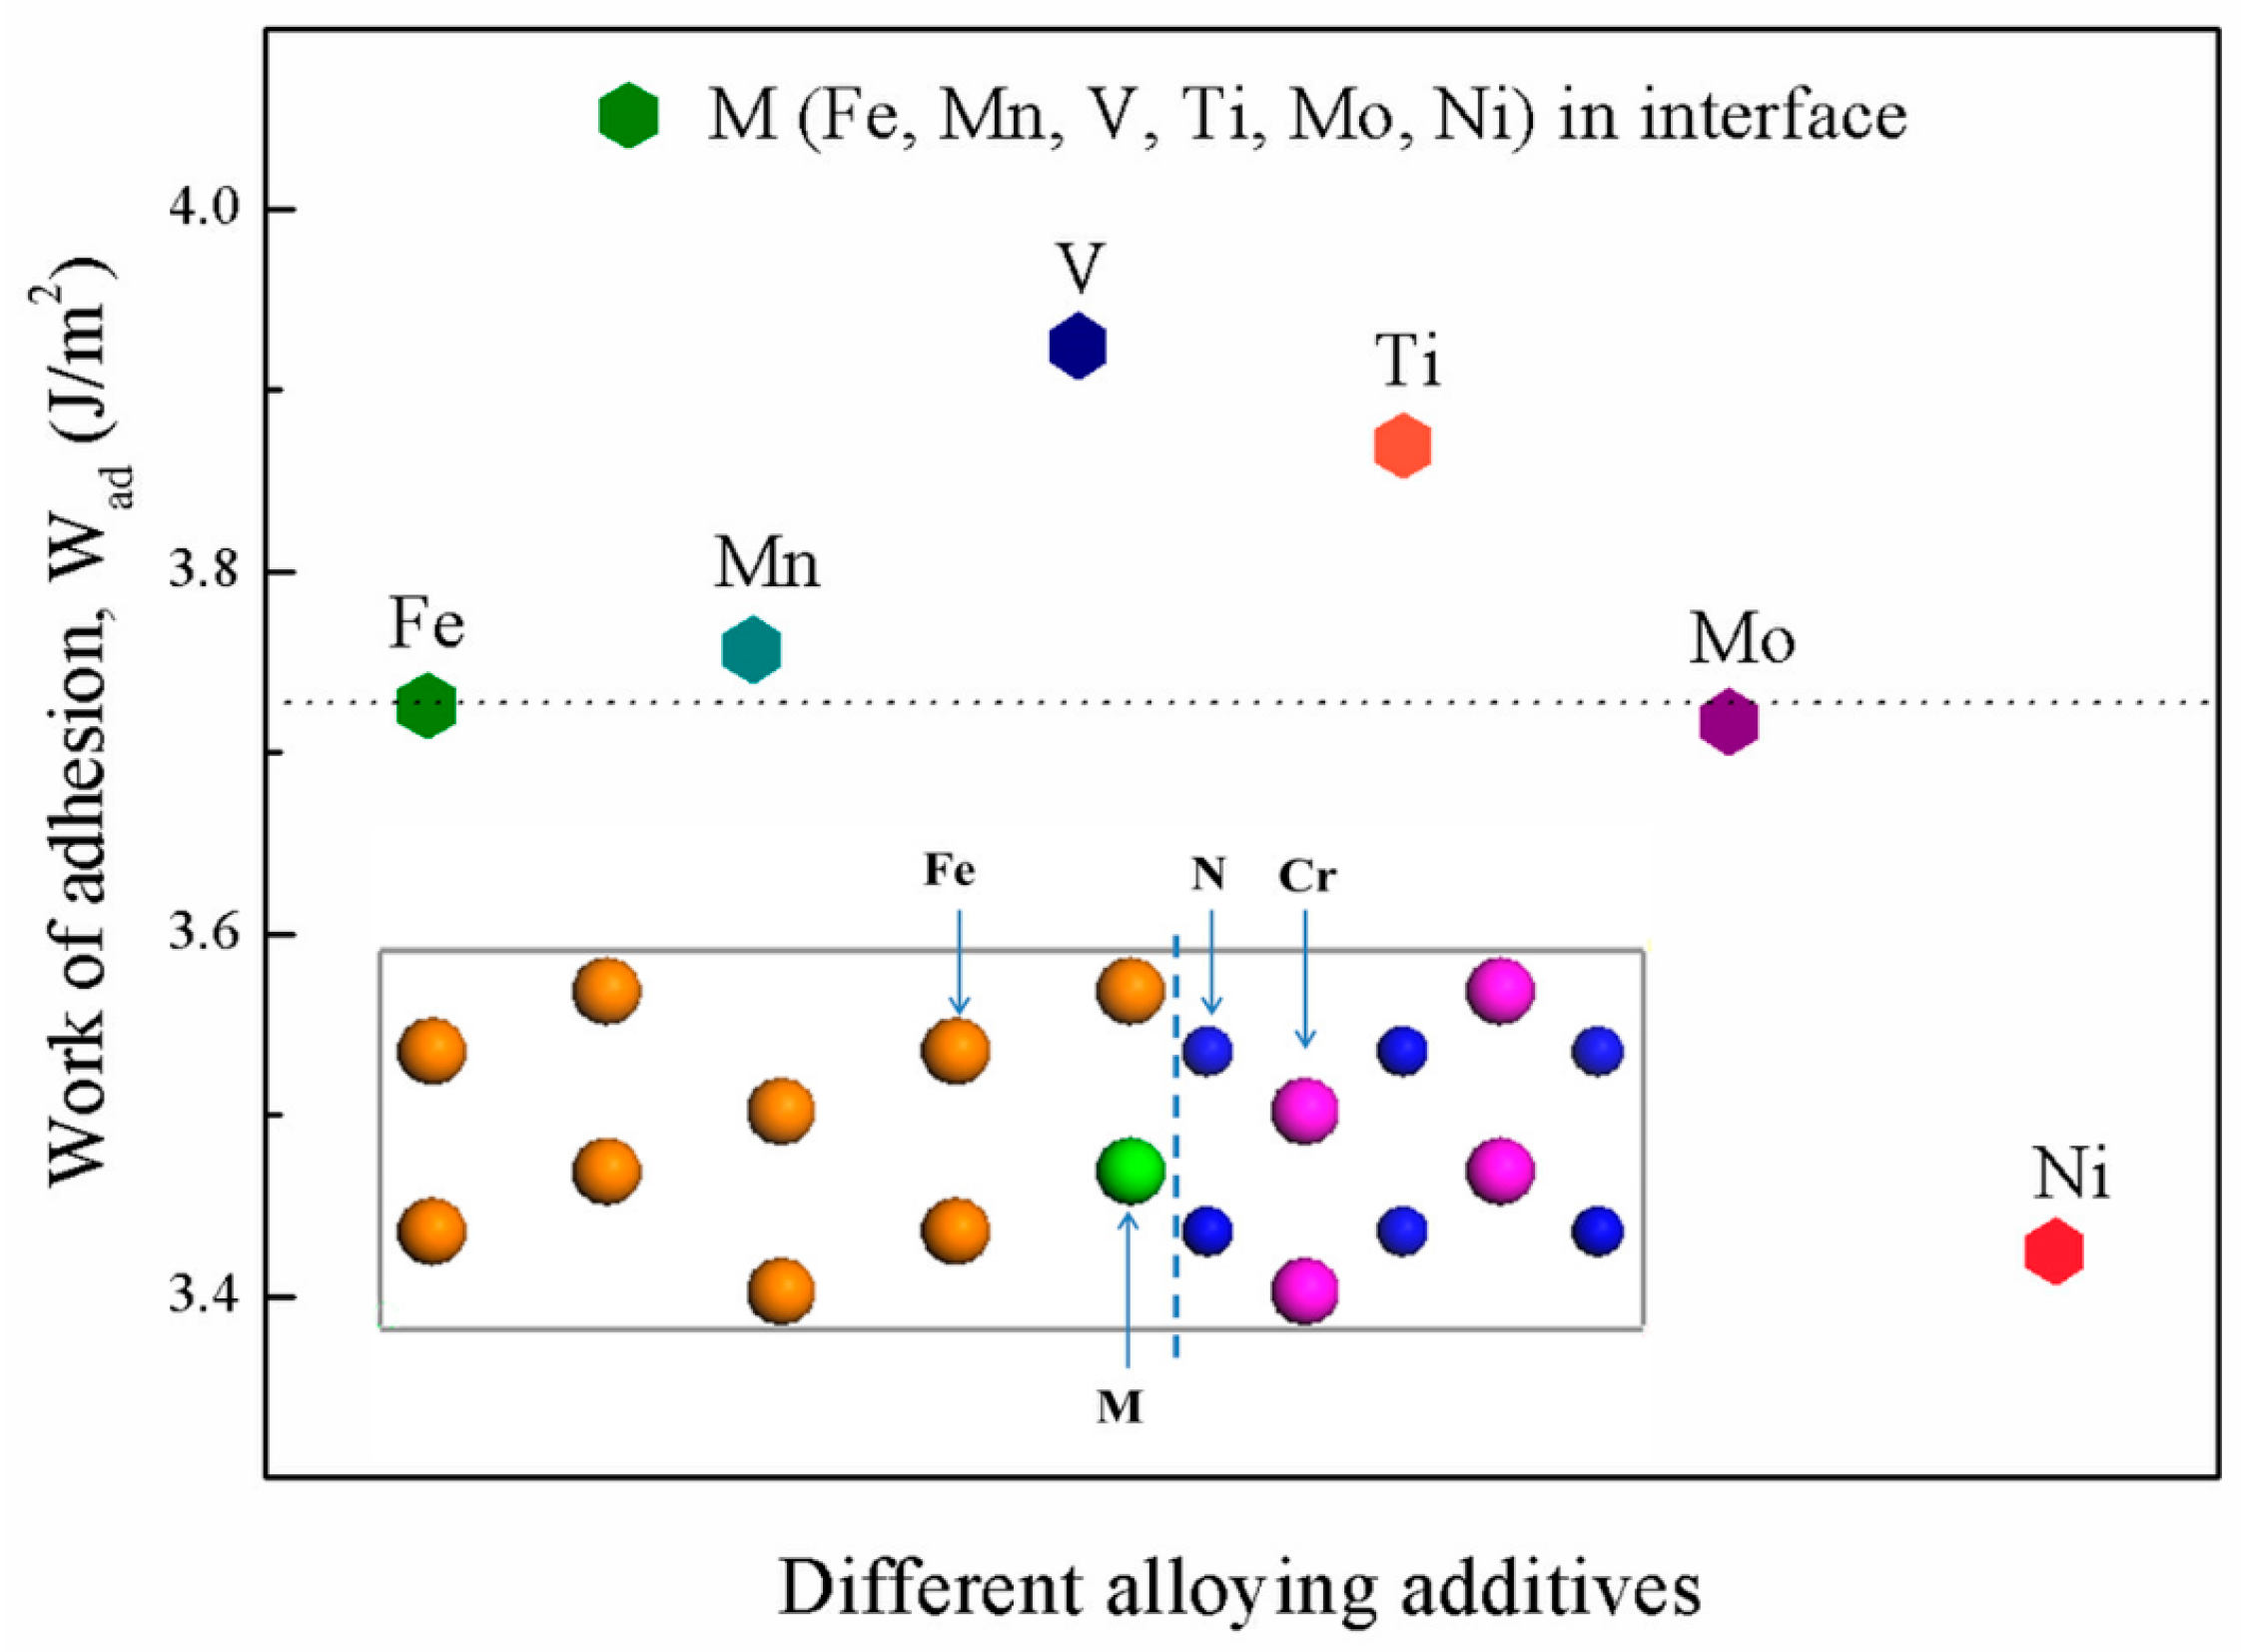
3.3. Interfacial Adhesive Behavior

The adhesive behavior and bonding characteristic of an interface can be partly described by its adhesion. We still choose the formula of Wad in Section 3.1 to explore the clean the γ-Fe(111)/Cr2N(0001) interface and after introduction of M (M = Mn, V, Ti, Mo, and Ni).
W ad = ( E Fe : n M + E Cr 2 N E Fe / Cr 2 N : n M ) / 2 A
Here, when alloying additives are introduced to the relaxed clean interface, we suppose that the alloying additives located at the Fe slab after the adhesion process. What’s more, E Fe : n M is the total energy of fully relaxed, Fe slabs after introduction of M (M = Mn, V, Ti, Mo, and Ni) in the same supercell when one of the slabs is retained and the other is replaced by a vacuum. E Fe / Cr 2 N : n M denotes the total energy of γ-Fe/Cr2N interface when alloying additives M (M = Mn, V, Ti, Mo, and Ni) are introduced. n is the number of M atoms; here n = 1.
The Wad values obtained for the clean γ-Fe(111)/Cr2N(0001) interface and after introducing M (M = Mn, V, Ti, Mo, and Ni) are listed in Figure 3. Figure 3 clearly shows that the Wad of the new interface γ-Fe/Cr2N:M (M = Mn, V, Ti, Mo, and Ni) after introducing alloying additives to the relaxed clean interface is significantly different from that of the clean γ-Fe/Cr2N interface. Furthermore, the work of adhesion characterizes the strength of the whole metal/nitride interface containing the adhesion of all atoms at the interface, but the effects of only one alloying atom on the adhesion behavior of the γ-Fe(111)/Cr2N(0001) interface is apparent. In particular, for V-, Ti-, and Mn-additive systems, the Wad of the new interface γ-Fe/Cr2N:M is larger than the clean case, which indicates that interactions between V (or Ti or Mn) and nitrogen were reinforced. Therefore, V, Ti, or Mn can improve the γ-Fe(111)/Cr2N(0001) interfacial strength. Figure 3 also clearly shows that the Wad of the new interface γ-Fe/Cr2N:Mo to the relaxed clean interface was similar to that of the clean interface. For Ni additive systems, the Wad of the new interface Fe/Cr2N:Ni was lower than the clean case, which indicates that interactions between Ni and nitrogen were weakened. To understand the small effect of different alloying additives on the adhesive behavior of interfaces more clearly, we carefully analyzed the interfacial structure of atomic bond-length and volume change.
The adhesive properties of an interface are closely related to interfacial atomic bonding, the atomic bond-length reflects bond-strength. Thus, in this part, atomic bond-length and volume change of the interface model were thoroughly investigated to reveal possible atomic-scale mechanisms.
To understand the effect of alloying additives M (M = Mn, V, Ti, Mo, Ni) on the adhesive behavior of the γ-Fe(111)/Cr2N(0001) interface, we measured the model volume and atomic bond length near the interface. In Figure 4, introduction of Mn, V, Ti, Mo, or Ni makes no apparent change for the volume of the model compared with the clean interface. For the atomic bond length near the interface, the pink line represents the atomic bond length between Fe and M. The red line (or blue line) represents the atomic bond length between M (or Fe) and nitrogen. The orange and green lines correspond to the atomic bond length between nitrogen and Cr. The behavior of the interfacial bonds in Figure 4 clearly suggests that the different alloying additives obviously altered the M(A)-Fe(B) and M(A)-N(E) bond lengths near the interface but negligibly changed the Fe(C)-N(D), N(D)-Cr(F), and N(E)-Cr(G) bond lengths. Therefore, the alloying additives mainly affected the M(A)-Fe(B) and M(A)-N(E) bond lengths near the interface. Introducing V, Ti, and Mo rapidly decreases the M(A)-N(E) bond length from 1.832 Å (Clean) to 1.811 Å (V), 1.787 Å (Ti), and 1.785 Å (Mo), but increases the M(A)-Fe(B) bond length from 2.257 Å (Clean) to 2.268 Å (V), 2.354 Å (Ti), and 2.346 Å (Mo). On the contrary, Ni increases the M(A)-N(E) bond length from 1.832 Å (Clean) to 1.914 Å (Ni) but slightly decreases the M(A)-Fe(B) bond length from 2.257 Å (Clean) to 2.256 Å (Ni). This finding implies that the interactions of V, Ti, and Mo with N(E) were slightly reinforced, whereas Ni with N(E) was slightly weakened. Meanwhile, the alloying additives Mn, presented with no remarkable change in the bond length of the model when compared with the clean interface. In conclusion, Ti, V atoms easily segregated at the interface, which improves the interfacial adhesive strength. Meanwhile, Ni decreases the γ-Fe(111)/Cr2N(0001) interfacial strength. Introducing Mn does not remarkably change the γ-Fe(111)/Cr2N(0001) interfacial bond length.
To understand the effect of different alloying elements on the adhesive behavior of interfaces more clearly, we further analyzed the interfacial electronic properties in Section 3.4.

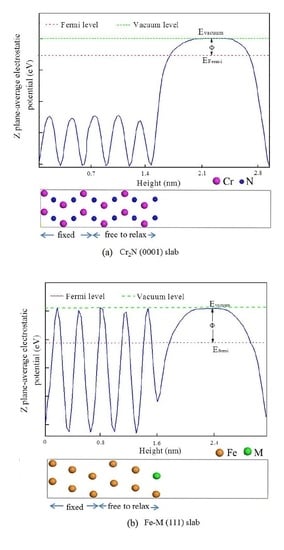
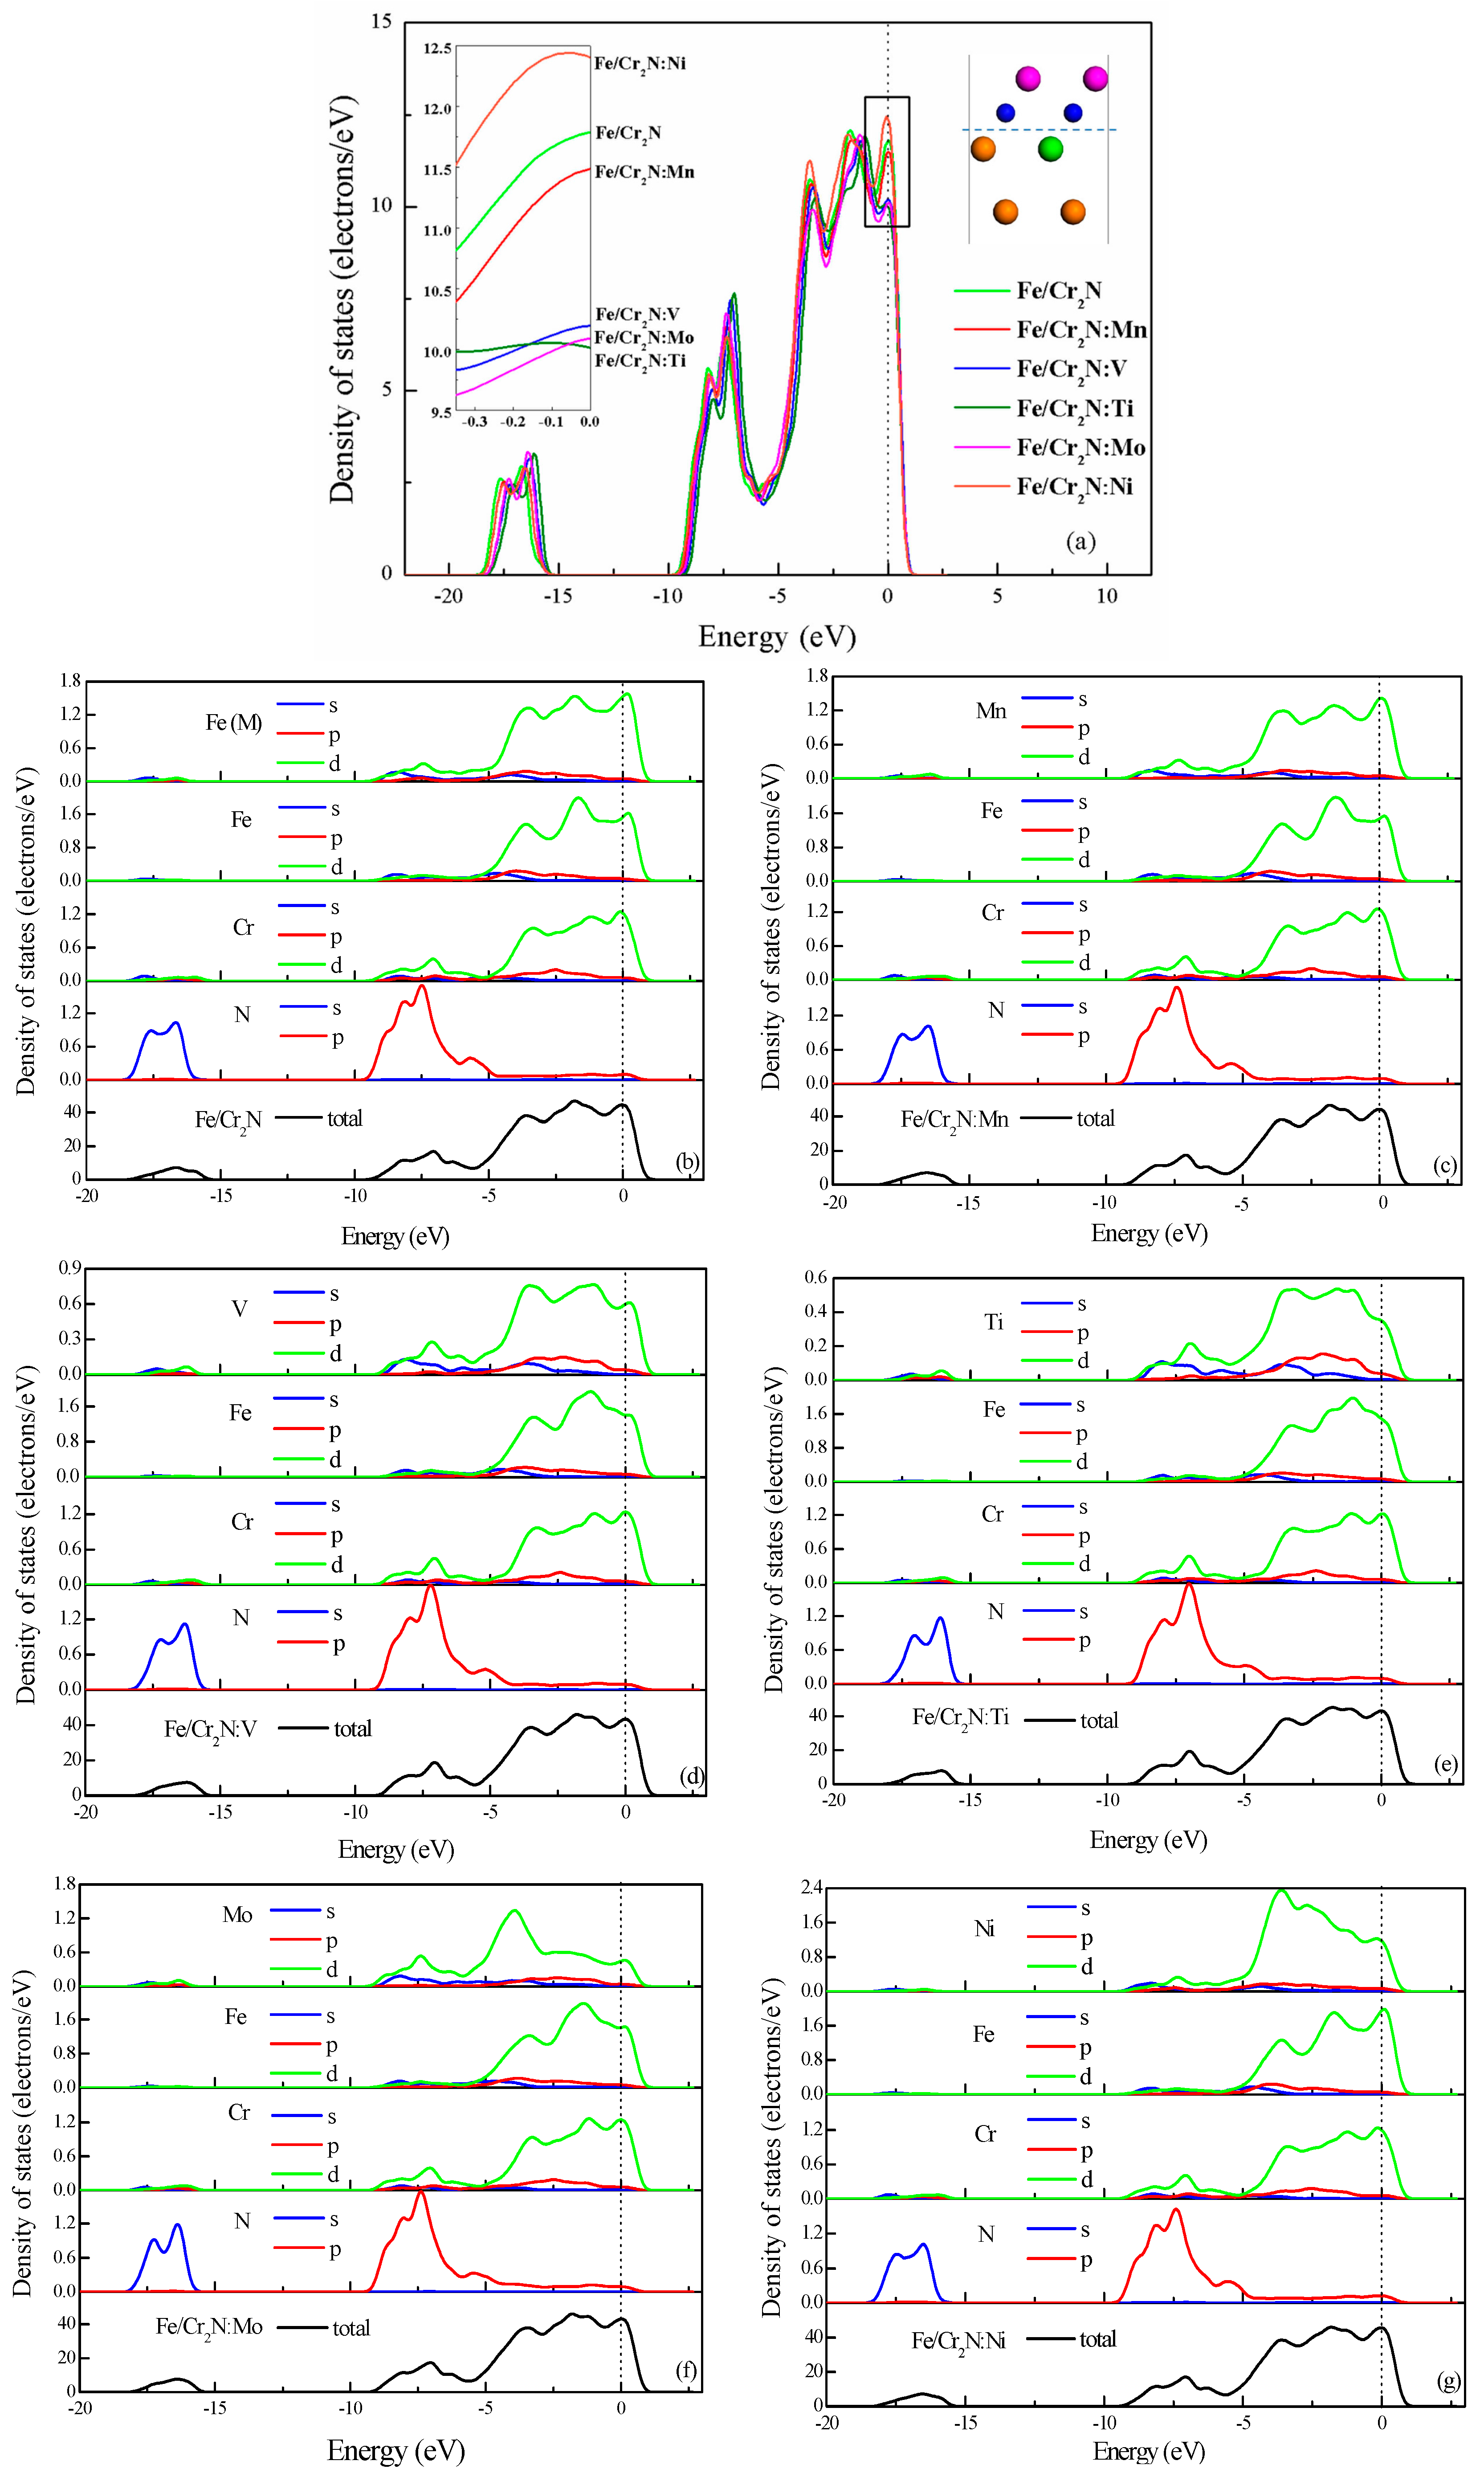
3.4. Electronic Structure

The adhesive properties of the interface is unavoidably determined by the atomic bonding strength. Thus, the electronic structure and bonding nature of the γ-Fe(111)/Cr2N(0001) interface must be investigated. Therefore, we used the density of states (DOS) and Mulliken population to investigate the interfacial electron properties and the effect of different alloys M (M = Mn, V, Ti, Mo, and Ni) on the Fe/Cr2N:M interfacial structure.
The DOS and partial DOS (PDOS) analysis of the effect of different alloying additives on γ-Fe(111)/Cr2N(0001) interface are shown in Figure 5. For the clean Fe/Cr2N interface (Figure 5b), we can clearly see that the range from −9.73 eV to 1.61 eV is filled by valence electrons. In addition, some charges in the region ranging from −18.62 eV to −15.28 eV are mainly dominated by N-2s and Fe-3d orbitals. Owing to the Fe-3d, Cr-3d, N-2s charge, the clean interface holds the strongest peak (46.91 electrons/eV) at −1.78 eV, resulting in the value (44.60 electrons/eV) of the DOS at the Fermi energy (at 0 eV). Given the participation of different alloying atoms M (M = Mn, V, Ti, Mo, and Ni), resonance is achieved with the formation of the polar covalent bond between M and nitrogen atoms in the region from −18.05 eV to −15.11 eV and from −9.73 eV to −4.81 eV. Reactions occur between M and nitrogen at the interface. However, for the interfacial system of different alloying additives, the PDOS shows that the patterns obtained are similar. To distinguish small gaps from the DOS of different alloying additives M, the total DOS (TDOS) near the interface was measured. We focused on the value of TDOS at the Fermi level. The change in the TDOS value at the Fermi level is the most significant factor in evaluating phase stability and electrochemical activity. A low Fermi level indicates a stable corresponding phase [35]. In other words, lower TDOS value at the Fermi level, yield more stablestructures. Compared with electronic structure of the Fe/Cr2N:M (M = Mn, V, Ti, Mo, Ni) interface, the change in TDOS value at the Fermi level is highly apparent (Figure 5a). The TDOS at the Fermi level of Ti-, Mo-, V-, and Mn-doped interfaces was lower than that of the clean and Ni-doped interfaces. Thus, doping with these elements resulted in increased structural stability compared with that of the clean and Ni-doped interfaces.
Although DOS analyses can reveal valuable information about the nature of covalent bonding, such an approach provides limited insight into matters related to charge transfer. However, such data are important for understanding the characteristics of interfacial bonding. A common tool used to provide semi-quantitative measurements of charge transfer is Mulliken population analysis [36]. Table 2 lists atomic charges on the alloying additives M (M = Mn, V, Ti, Mo, and Ni) and nitrogen close to the γ-Fe(111)/Cr2N(0001) interface. In the clean interface, the transfer charges of Fe and nitrogen close to the interface were 0.09 and −0.55. As alloying elements were introduced to the interface, significant changes in charge transfer and atomic interaction were observed. In Ti-, Mo-, V-, and Mn- additive systems, the transfer charges of Ti, Mo, V, and Mn were 1.01, 0.93, 0.77, and 0.63, respectively, and the transfer charges of nitrogen close to Ti, Mo, V, and Mn were −0.58, −0.58, −0.58, and −0.55, respectively. These results indicate that the alloying atoms produce a strong positive electric field, which provides additional attractive forces for nitrogen anions, acting as acceptors. This hypothesis is supported by the high electronegativity of nitrogen atoms close to Ti, Mo, V, and Mn. In Ni- additive systems, when Ni replaced Fe, the transfer charges of Ni and nitrogen close to Ni were 0.03 and −0.51. This result confirms that nitrogen atoms close to Ni exhibited low electronegativity, and Ni generated a weak positive electric field that provided small additional attractive forces for nitrogen. This hypothesis showed that the interaction between Ni and nitrogen was weak. Thus, interfacial strength decreased after Ni introduction.
Based on our analysis of atomic charges on the alloying element M and nitrogen close to the interface, we further carefully analyzed a more thorough investigation of the atomic charges and the charge transfers, where the clean interface and representative alloys Fe/Cr2N:M (M = Ti, Ni) were cited as examples. Table 3 indicates atomic charges on all the Fe (Ti, Ni) and Cr atoms, and nitrogen atoms in the models, which hold considerable changes in the presence of Ti or Ni atom. We found that for the clean interface, the transfer charges of the four Fe atoms near the interface were 0.09, 0.09, 0.09, 0.09, and the transfer charges of the two nitrogen atoms near the interface were −0.55, −0.55. Meanwhile, when a Ti atom represents an Fe atom, the transfer charges of three Fe atoms and a Ti atom near the interface increase to −0.08, −0.08, −0.08 and 1.01, respectively. The transfer charges of the two nitrogen atoms near the interface were −0.58 and −0.55. This result shows that Ti atom carried more positive charges, and the neighboring Fe and nitrogen atoms near the interface carried more negative charges. These atoms should accept electrons from the Ti atom. The interactions between Fe atoms and other atoms near the interface were strengthened, and the entire system reached the charge transfer conservation. Meanwhile, when a Ni atom presents to represent Fe, the transfer charges of three Fe atoms and a Ni atom near the interface were 0.09, 0.09, 0.09, and 0.03, and the transfer charges of the two nitrogen atoms near the interface were −0.51 and −0.52. This result shows that Ni atom produced a smaller positive electric field, which provided additional attractive weak forces for nitrogen. By contrast, the neighboring Fe atoms near the interface carried positive charges. As a result the interactions between Fe atoms and other atoms near the interface were weakened, and the whole system satisfied the charge transfer conservation.
This conclusion is consistent with TDOS, revealing that Ti, Mo, V, and Mn can improve the structural stability of the γ-Fe(111)/Cr2N(0001) interface. By contrast, Ni weakened the interfacial structural stability. Which is in good agreement with our calculated the work of adhension (Wad) in Section 3.3 for the γ-Fe(111)/Cr2N(0001) interface.

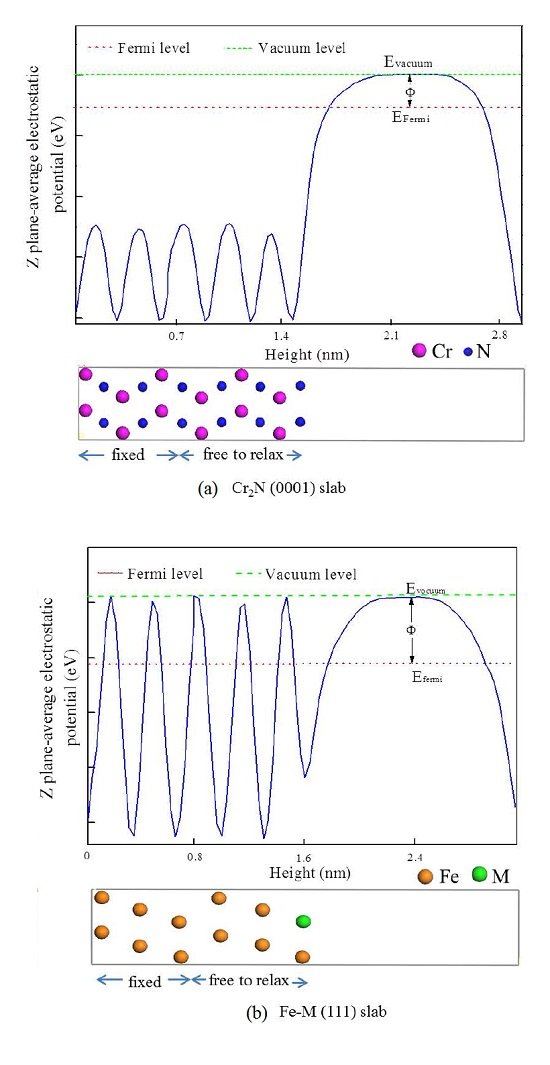
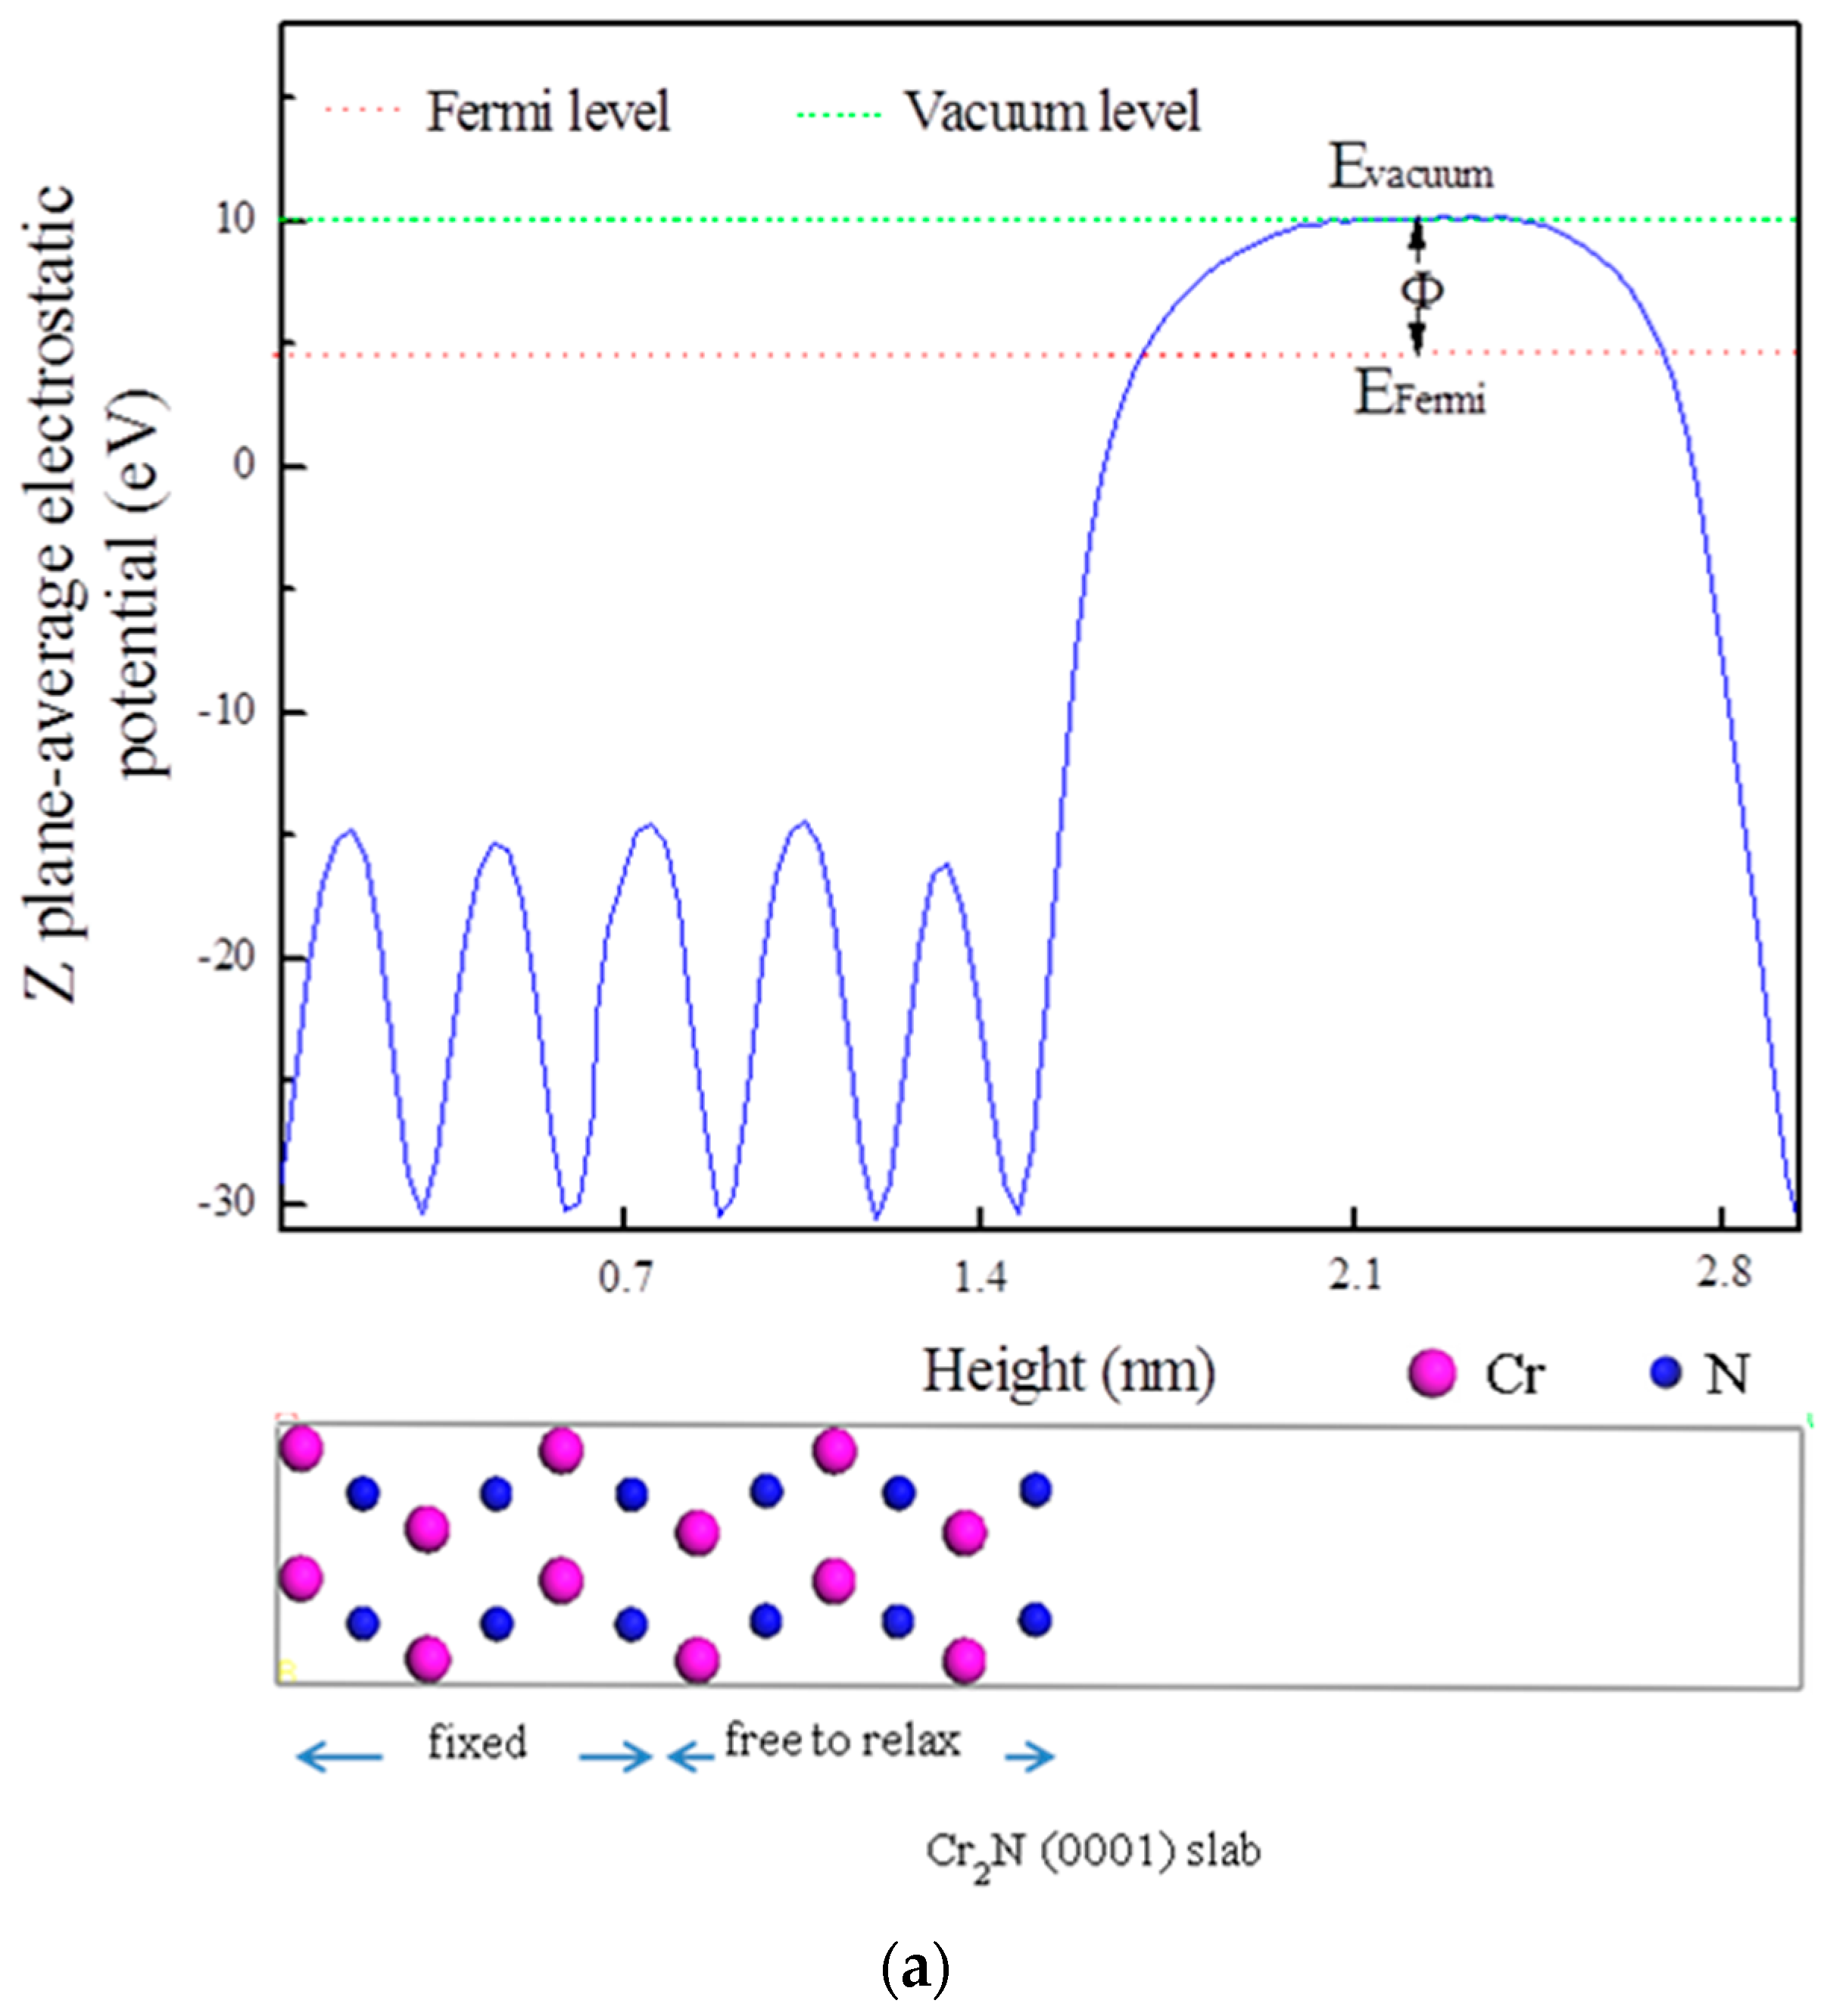
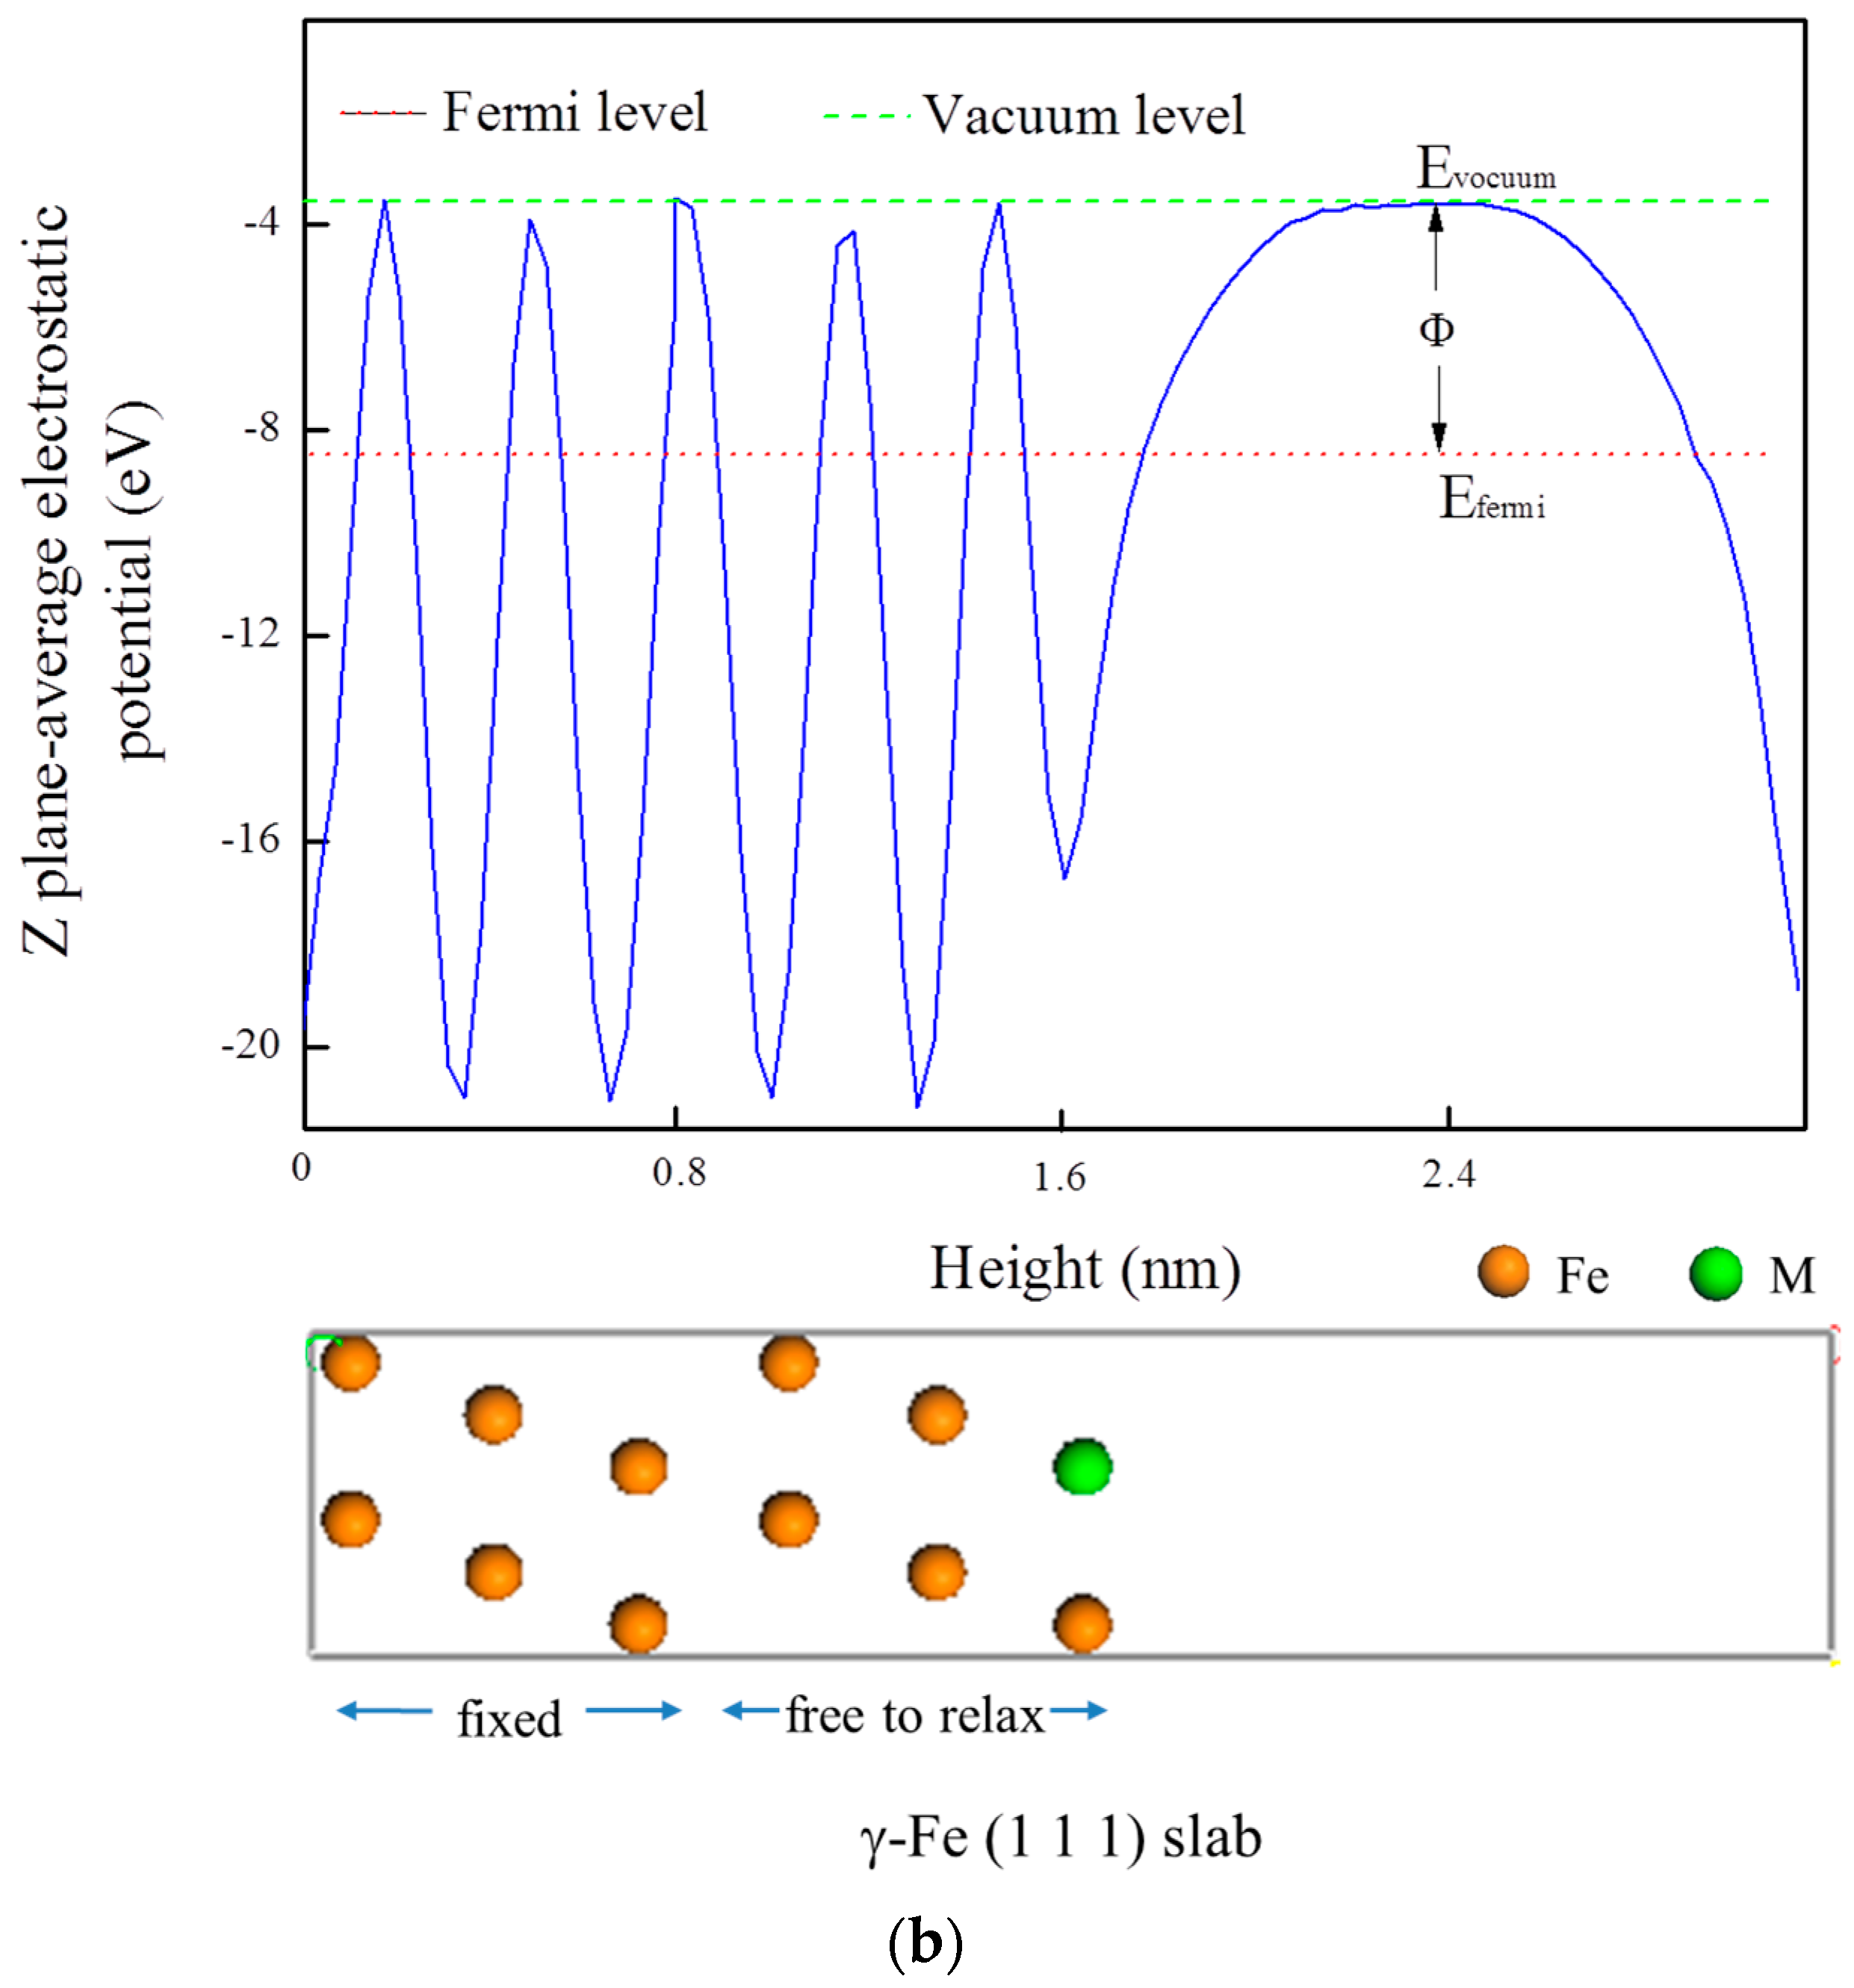
3.5. Electrochemical Properties

Galvanic corrosion occurs when two different phases are electrically connected and immersed in an aggressive electrolyte solution. The potential difference could be regarded as the driving force of galvanic interaction, whereas the aggressive electrolyte solution forms a loop of galvanic interaction. Anodic polarization occurs to the phase with a previously lower corrosion potential, consequently its corrosion is accelerated while the other phase is protected. After removal of electrolyte solution, the driving force still remains in the form of Volta potential difference (VPD). Such occurrence explains why VPD measurements are used to predict galvanic interaction between the matrix and intermetallic particles.
VPD is defined by IUPAC as the electric potential difference between one point in the vacuum close to the surface of M1 and another point in the vacuum close to the surface of M2, where M1 and M2 are two uncharged metals brought into contact [37]. According to previous theoretical calculations [38,39,40], VPD measurement could be considered as a work function distribution map of the measured surface. Fortunately, the calculation of work function is straightforward with the density function theory method [41].
For the calculation of the work function of an (hkl) surface, we adopted stoichiometric slab models with thickness three times as (hkl) interplanar spacing. The lower half of a slab model was fixed while the upper half was allowed to relax. A 15 Å vacuum layer was inserted along the direction of slab periodic repetition to minimize the surface-surface interaction. We retained the use of the same parameters to calculate the work function.
The work function was calculated as the difference between the vacuum level Evacuum and the Fermi energy EFermi:
Φ = E vacuum E Fermi
The vacuum level and Fermi energy were obtained from the plane-averaged electrostatic potentials (Figure 6) and the output of density functional theory (DFT) ground-state calculation, respectively. Since the slabs were stoichiometric, the two surfaces of a slab were usually terminated with different elements.
Given the previous γ-Fe(111)/Cr2N(0001) interfacial model, the calculated work function was carried out for N-terminated Cr2N(0001) surface. The work function value of Cr2N(0001) surface was 5.264 eV.
The matrix of commercial Fe alloys contains many kinds of alloying additives and both the species and concentration of these elements can modify the work function of the Fe matrix. Most alloying additives (Mn, V, Ti) are preferably enriched in intermetallic particles, which leads to an even lower concentration of alloying additives in the Fe matrix. We assumed that the work function of commercial Fe alloys approximately equals to that of pure Fe. In general, the alloy surface was composed of the matrix and the embedded intermetallic particles. Thus, the work function of commercial Fe alloys approximately equaled that of the model we built (Figure 6b). The calculated work functions of γ-Fe(111) alloy surfaces are listed in Table 4. The VPD values are calculated with respect to the value of Cr2N.
The VPD between Fe alloys and Cr2N could be regarded as the driving force of galvanic interaction. Given the VPD in Table 4, we calculated the work function value of N-terminated Cr2N(0001) surface was 5.264 eV, while the work function of Fe(111) surface with alloying additives ranging from 4.710 eV to 5.063 eV. As shown above, the alloying additives V, Mo, Ti, and Ni significantly dragged down the work functions of clean γ-Fe(111) and magified the VPD between clean γ-Fe(111) and Cr2N(0001). Therefore, alloying additives V, Mo, Ti, and Ni at the γ-Fe(111)/Cr2N(0001) interface were low-potential sites that enhanced the interfacial electrochemical activity. In addition, γ-Fe(111) surfaces terminated with Mn atoms shared higher potential level than that of the Fe matrix and reduced the VDP between clean γ-Fe(111) and Cr2N(0001). Such a result decreased the γ-Fe(111)/Cr2N(0001) interfacial electrochemical activity.

4. Conclusions

We focused on the adhesive behavior of alloying additives M (M = Mn, V, Ti, Mo, or Ni) at the γ-Fe(111)/Cr2N(0001) interface and systematically determined the electrochemical effects of these additives at the interface using the first-principles method. On the basis of the calculated heats of segregation and work of adhesion, alloying additives V and Ti easily segregated at the γ-Fe(111)/Cr2N(0001) interface and improved interfacial adhesive strength, while alloying additives Ni and Mo were not easily segregated at the γ-Fe(111)/Cr2N(0001) interface. We also calculated the work function to investigate the local electrochemical corrosion of the γ-Fe(111)/Cr2N(0001) interface with alloying additives M (M = Mn, V, Ti, Mo, or Ni). The alloying additives V, Mo, Ti, and Ni at the γ-Fe(111)/Cr2N(0001) interface magified VPD between clean γ-Fe(111) and Cr2N(0001), which were low-potential sites that usually served as local attack initiation points at the γ-Fe(111)/Cr2N(0001) interface, while the alloying additive Mn reduced the local electrochemical corrosion behavior at the γ-Fe(111)/Cr2N(0001) interface by decreasing the VPD between clean γ-Fe(111) and Cr2N(0001).

Acknowledgments

This research was supported by the National Natural Science Foundation of China (Grant No. 51371123), the National Natural Science Foundation of Shanxi province (Grant No. 2014011002), the Research Fund for the Doctoral Program of Higher Education of China (Grant No. 20131402110003).

Author Contributions

The co-author (Huang Hui, Zhang Caili, Liu Jie, Li Yue, Fang Xudong, Han Peide) substantially contributed to the design of the study, analysis, and interpretation of the results. Huang Hui made preparation to write the manuscript and answered reviewers’ comments. In particular, Han Peide and Li Jianchun provided helpful information and suggestion for the paper, especially helped us answer reviewer’s comments during the process of major revision.

Conflicts of Interest

The authors declare no conflict of interest.

References

  1. Gavriljuk, V.G.; Berns, H. High Nitrogen Steels; Springer-Verlag: Berlin, Germany, 1999. [Google Scholar]
  2. Simmons, J.W. Influence of nitride (Cr2N) precipitation on the plastic flow behavior of high-nitrogen austenitic stainless steel. Scr. Metall. Mater. 1995, 32, 265–270. [Google Scholar] [CrossRef]
  3. Shi, F.; Wang, L.; Cui, W.; Liu, C. Precipitation Kinetics of Cr2N in High Nitrogen Austenitic Stainless Steel. J. Iron Steel Res. Int. 2008, 15, 72–77. [Google Scholar] [CrossRef]
  4. Lee, T.H.; Oh, C.S.; Lee, C.G.; Kim, S.J.; Takaki, S. Precipitation of σ-Phase in High-Nitrogen Austenitic 18Cr-18Mn-2Mo-0.9N Stainless Steel During Isothermal Aging. Scr. Mater. 2004, 50, 1325–1328. [Google Scholar] [CrossRef]
  5. Xu, W.; Martin, D.S.; del Castillo, P.E.J.R.D.; van der Zwaag, S. Modelling and characterization of chi-phase grain boundary precipitation during aging of Fe-Cr-Ni-Mo stainless steel. Mater. Sci. Eng. A 2007, 467, 24–32. [Google Scholar] [CrossRef] [Green Version]
  6. Kartik, B.; Veerababu, R.; Sundararaman, M.; Satyanarayana, D.V.V. Effect of high temperature ageing on microstructure and mechanical properties of a nickel-free high nitrogen austenitic stainless steel. Mater. Sci. Eng. A 2015, 642, 288–296. [Google Scholar] [CrossRef]
  7. Cobelli, P.; Kerschenbauer, C.; Speidel, M.O. Nitrides in high nitrogen stainless steels. Trans. Indian Inst. Met. 2002, 55, 473–480. [Google Scholar]
  8. Ha, H.Y.; Kwon, H.S. Effects of Cr2N on the pitting corrosion of high nitrogen stainless steels. Electrochim. Acta 2007, 52, 2175–2180. [Google Scholar] [CrossRef]
  9. Toro, A.; Misiolek, W.Z.; Tschiptschin, A.P. Correlations between microstructure and surface properties in a high nitrogen martensitic stainless steel. Acta Mater. 2003, 51, 3363–3374. [Google Scholar] [CrossRef]
  10. Lee, T.H.; Kim, S.J.; Takaki, S. Time-temperature-precipitation characteristics of high-nitrogen austenitic Fe-18Cr-18Mn-2Mo-0.9N Steel. Metall. Mater. Trans. A 2006, 37, 3445–3454. [Google Scholar] [CrossRef]
  11. Paulauskas, I.E.; Brady, M.P.; Meyer, H.M.; Buchanan, R.A.; Walker, L.R. Corrosion behavior of CrN, Cr2N and pi phase surfaces on nitrided Ni-50Cr for proton exchange membrane fuel cell bipolar plates. Corros. Sci. 2006, 48, 3157–3171. [Google Scholar] [CrossRef]
  12. Knutsen, R.D.; Lang, C.I.; Basson, J.A. Discontinuous cellular precipitation in a Cr-Mn-N steel with niobium and vanadium additions. Acta Mater. 2004, 52, 2407–2417. [Google Scholar] [CrossRef]
  13. Hirata, S.; Ikegami, Y. Effect of molybdenum on mechanical properties of high-nitrogen containing Cr-Mn-Ni austenitic stainless steels. Trans. Indian Inst. Met. 2002, 55, 349–353. [Google Scholar]
  14. Sauvage, X.; Wilde, G.; Divinski, S.V.; Horita, Z.; Valiev, R.Z. Grain boundaries in ultrafine grained materials processed by severe plastic deformation and related phenomena. Mater. Sci. Eng. A 2012, 540, 1–12. [Google Scholar] [CrossRef]
  15. Kohn, W.; Sham, L.J. Self-Consistent Equations Including Exchange and Correlation Effects. Phys. Rev. A 1965, 140, 1133–1138. [Google Scholar] [CrossRef]
  16. Segall, M.D.; Lindan, P.J.D.; Probert, M.J.; Pickard, C.J.; Hasnip, P.J.; Clark, S.J. First-principles simulation: Ideas, illustrations and the CASTEP code. J. Phys. Condens. Matter. 2002, 14, 2717–2744. [Google Scholar] [CrossRef]
  17. Perdew, J.P.; Zunger, A. Self-interaction correction to density-functional approximations for many-electron systems. Phys. Rev. B 1981, 23, 5048–5079. [Google Scholar] [CrossRef]
  18. Ceperley, D.M.; Alder, B.J. Ground State of the Electron Gas by a Stochastic Method. Phys. Rev. Lett. 1980, 45, 566–569. [Google Scholar] [CrossRef]
  19. Monkhorst, H.; Pack, J.D. Special points for Brillouin-zone integrations. Phys. Rev. B 1976, 13, 5188–5192. [Google Scholar] [CrossRef]
  20. Lee, T.H.; Kim, S.J.; Shin, E.; Takaki, S. On the crystal structure of Cr2N precipitates in high-nitrogen austenitic stainless steel. III. Neutron diffraction study on the ordered Cr2N superstructure. Acta Crystallogr. Sect. B Struct. Sci. 2006, 62, 979–986. [Google Scholar] [CrossRef] [PubMed]
  21. Basinski, Z.S.; Hume-Rothery, W.; Sotton, A.L. The Lattice Expansion of Iron. Math. Phys. Sci. 1955, 229, 459–467. [Google Scholar] [CrossRef]
  22. Straumanis, M.E.; Kim, D.C. Lattice constants, thermal expansion coefficients, densities and perfection of structure of pure iron and iron loaded with hydrogen. Trans. Metall. Soc. AIME 1965, 233, 1519–1525. [Google Scholar]
  23. Haglund, J. Theory of bonding in transition-metal carbides and nitrides. Phys. Rev. B 1993, 48, 11685–11691. [Google Scholar] [CrossRef]
  24. Ma, S.; Liu, Y.; Ye, J.; Zhang, H.; Pang, J. Theoretical study on the elastic, electronic and thermodynamic properties of trigonal-type Cr2N under high pressures. Comput. Mater. Sci. 2014, 95, 620–625. [Google Scholar] [CrossRef]
  25. Kim, S.J.; Marquart, T.; Franzen, H.F. Structure refinement for Cr2N. J. Less Common Met. 1990, 158, 9–10. [Google Scholar] [CrossRef]
  26. Rayaprolu, D.B.; Hendry, A. Cellular precipitation in a nitrogen alloyed stainless steel. Mater. Sci. Technol. 1989, 5, 328–332. [Google Scholar] [CrossRef]
  27. Ramirez, A.J.; Lippold, J.C.; Brandi, S.D. The Relationship between Chromium Nitride and Secondary Austenite Precipitation in Duplex Stainless Steels. Metall. Mater. Trans. A 2003, 34, 1575–1597. [Google Scholar] [CrossRef]
  28. Jiang, Q.; Lu, H.M.; Zhao, M. Modelling of surface energies of elemental crystals. J. Phys. Condens. Matter 2004, 16, 521–530. [Google Scholar] [CrossRef]
  29. Hashibon, A.; Elsässer, C.; Rühle, M. Structure at abrupt copper-alumina interfaces: An ab initio study. Acta Mater. 2005, 53, 5323–5332. [Google Scholar] [CrossRef]
  30. Finnis, M.W. The theory of metal-ceramic interfaces. J. Phys. Condens. Matter 1996, 8, 5811–5836. [Google Scholar] [CrossRef]
  31. Wang, H.; Gao, X.; Yang, J.; Jia, Y.; Gong, J. First-Principles Study of Cr2N/γ-Fe Interface in High Nitrogen Steel. Mater. Tran. 2015, 56, 1047–1051. [Google Scholar] [CrossRef]
  32. Nan, D.; Zhang, C.; Liu, H.; Fan, G.; Fang, X.; Han, P. Effects of different alloying additives X (X = Si, Al, V, Ti, Mo, W, Nb, Y) on the adhesive behavior of Fe/Cr2O3 interfaces: A first-principles study. Comput. Mater. Sci. 2015, 109, 293–299. [Google Scholar]
  33. Xie, Y.P.; Zhao, S.J. First principles study of Al and Ni segregation to the α-Fe/Cu(100) coherent interface and their effects on the interfacial cohesion. Comp. Mater. Sci. 2012, 63, 329–335. [Google Scholar] [CrossRef]
  34. Ande, C.K.; Sluiter, M.H.F. First-priciples prediction of partitioning of alloying elements between cementite and ferrite. Acta Mater. 2010, 58, 6276–6281. [Google Scholar] [CrossRef]
  35. Ozfidan, I.; Chen, K.Y.; Fu, M. Effects of Additives and Impurity on the Adhesive Behavior of the NiAl(110)/Al2O3(0001) Interface: An ab initio Study. Metall. Mater. Trans. A 2011, 42, 4126–4136. [Google Scholar] [CrossRef]
  36. Cantele, G. First-principles study of n- and p-doped silicon nanoclusters. Phys. Rev. B 2005, 72, 113303. [Google Scholar] [CrossRef]
  37. Hu, R.; Cheng, G.M.; Zhang, J.Q.; Li, J.S.; Zhang, T.B.; Fu, H.Z. First principles investigation on the stability and elastic properties of Ni2Cr1−xMx (M = Nb, Mo, Ta, and W) superlattices. Intermetallics 2013, 33, 60–66. [Google Scholar] [CrossRef]
  38. Segall, M.D.; Shah, R.; Pickard, C.J.; Payne, M.C. Population analysis of plane-wave electronic structure calculations of bulk material. Phys. Rev. B 1996, 54, 16317–16320. [Google Scholar] [CrossRef]
  39. International Union of Pure and Applied Chemistry. Compendium of Chemical Terminology Gold Book; International Union of Pure and Applied Chemistry: Research Triangle Park, NC, USA, 2014; p. 327. [Google Scholar]
  40. Qin, Y.F.; Wang, S.Q. Ab-Initio Study of the Role of Mg2Si and Al2CuMg Phases in Electrochemical Corrosion of Al Alloys. J. Electrochem. Soc. 2015, 162, 503–508. [Google Scholar] [CrossRef]
  41. Wang, J.; Wang, S.Q. Correlation between Galvanic Corrosion and Electronic Work Function of Al Alloy Surfaces. Acta Phys. Chim. Sin. 2014, 30, 551–558. [Google Scholar]
Figure 1. Side view of (a) Cr-terminated and (b) N-terminated γ-Fe(111)/Cr2N(0001) interface model. Top view of (c) interface configurations. Side view of (d) N-terminated γ-Fe(111)/ Cr2N(0001) after different solution atoms introduced (M = Mn, V, Ti, Mo, or Ni). (For interpretation of the references to color in this figure legend, the reader is referred to the web version of this article.)
Metals 06 00156 g001
Figure 2. The heat of segregation (ΔEseg) for the Fe(111)/Cr2N(0001) interface after M (M = Mn, V, Ti, Mo, and Ni) atom is introduced.
Metals 06 00156 g002
Figure 3. The work of adhension (Wad) for the clean Fe(111)/Cr2N(0001) interface and that after M (M = Mn, V, Ti, Mo, Ni) atom introduced.
Metals 06 00156 g003
Figure 4. The bond lengths and volume of change of γ-Fe/Cr2N:M (M = Mn, V, Ti, Mo, and Ni).
Metals 06 00156 g004
Figure 5. (a) Total density of states of the clean γ-Fe(111)/Cr2N(0001) interface and that after different solution atoms introduced (M = Mn, V, Ti, Mo, Ni); DOS and PDOS of different solution atoms: (b) clean interface; (c) Mn; (d) V; (e) Ti; (f) Mo; (g) Ni.
Metals 06 00156 g005
Figure 6. (a) Plane-averaged electrostatic potential curve of N-terminated Cr2N(0001) surface model; (b) Plane-averaged electrostatic potential curve of γ-Fe(111) surface model after different solution atoms introduced (M = Mn, V, Ti, Mo, Ni).
Metals 06 00156 g006aMetals 06 00156 g006b
Table 1. Calculated lattice constants between them and experimental data for γ-Fe and Cr2N.
CompositionsThis Work (Å)Others (Å)Exp. (Å)
γ-Fea = b = c = 3.428a = b = c = 3.430 [23]a = b = c = 3.647 [21]
a = b = c = 3.654 [22]
Cr2Na = b = 4.799; c = 4.452a = b = 4.773; c = 4.406 [24]a = b = 4.752 c = 4.429 [25]
Table 2. Atomic charges on the nitrogen atoms and M (M = Mn, V, Ti, Mo, and Ni) atoms closed to the clean interface and that after M atom introduced calculated from Mulliken population analysis.
AtomTotal Electron (e)Transfer Charge (e)AtomTotal Electron (e)Transfer Charge (e)
Fe7.910.09N5.55−0.55
Mn6.370.63N5.55−0.55
V12.230.77N5.58−0.58
Ti10.991.01N5.58−0.58
Mo13.070.93N5.58−0.58
Ni9.970.03N5.51−0.51
Table 3. Atomic charges on the Fe, Cr, M (M = Ti, Ni), and nitrogen atoms of clean interface, Ti-additive and Ni-additive systems calculated from Mulliken population analysis.
AtomTotal Electron (e)Transfer Charge (e)AtomTotal Electron (e)Transfer Charge (e)AtomTotal Electron (e)Transfer Charge (e)
Fe8.01−0.01Fe8.03−0.03Fe8.06−0.06
Fe8.01−0.01Fe8.04−0.04Fe8.03−0.03
Fe8.04−0.04Fe7.990.01Fe8.000.00
Fe7.970.03Fe7.980.02Fe7.980.02
Fe7.970.03Fe7.970.03Fe7.980.02
Fe7.960.04Fe7.960.04Fe7.960.04
Fe7.960.04Fe7.960.04Fe7.950.05
Fe7.830.17Fe7.830.17Fe7.830.17
Fe7.890.11Fe7.870.13Fe7.880.12
Fe7.890.11Fe7.880.12Fe7.900.10
Fe7.900.10Fe7.890.11Fe7.910.09
Fe7.940.06Fe7.920.08Fe7.930.07
Fe7.940.06Fe7.920.08Fe7.950.05
Fe7.910.09Fe7.910.09Fe8.08−0.08
Fe7.910.09Ni9.970.03Ti10.991.01
N5.55−0.55N5.51−0.51N5.58−0.58
N5.55−0.55N5.52−0.52N5.55−0.55
Cr13.890.11Cr13.890.11Cr13.890.11
Cr13.850.15Cr13.880.12Cr13.880.12
Cr13.690.31Cr13.700.30Cr13.700.30
Cr13.750.25Cr13.760.24Cr13.760.24
N5.56−0.56N5.56−0.56N5.56−0.56
Cr13.890.11Cr13.890.11Cr13.890.11
Cr13.850.15Cr13.880.12Cr13.880.12
Cr13.690.31Cr13.670.33Cr13.670.33
Cr13.750.25Cr13.680.32Cr13.680.32
N5.54−0.54N5.54−0.54N5.54−0.54
N5.53−0.53N5.53−0.53N5.53−0.53
Cr13.890.11Cr13.890.11Cr13.890.11
Cr13.850.15Cr13.880.12Cr13.880.12
Cr13.710.29Cr13.710.29Cr13.710.29
Cr13.730.27Cr13.730.27Cr13.730.27
Table 4. Volta potential differences of γ-Fe (111)/Cr2N(0001) and after M (M = Mn, V, Ti, Mo, and Ni) atom is introduced.
Terminated PlaneWork Function (eV)VPD Relative to the Cr2N (V)
Clean Fe5.046−0.218
Fe-Mn5.063−0.201
Fe-V4.710−0.554
Fe-Ti4.931−0.333
Fe-Mo4.916−0.348
Fe-Ni4.811−0.453

