Article

A Study of the Heat Transfer Behavior of Mold Fluxes with Different Amounts of Al2O3

1
School of Metallurgy and Environment, Central South University, Changsha 410083, China
2
State Key Laboratory of Powder Metallurgy, Central South University, Changsha 410083, China
*
Author to whom correspondence should be addressed.
Metals 2016, 6(6), 139; https://doi.org/10.3390/met6060139
Submission received: 21 March 2016 / Revised: 12 May 2016 / Accepted: 13 May 2016 / Published: 16 June 2016

Abstract

:
The element Al in molten aluminum containing steel reacts with the liquid mold flux and thus be transferred into the mold flux during the continuous casting process. Additionally, the increase in alumina in a mold flux changes its performance significantly. Thus, in this paper, the heat transfer properties of mold fluxes with the Al2O3 content ranging from 7 to 40 wt. % were studied with the Infrared Emitter Technique (IET). Results found that heat flux at the final steady state decreased from 423 kW·m−2 to 372 kW·m−2 with the increase in Al2O3 content from 7% to 30%, but it increased to 383 kW·m−2 when the Al2O3 content was further increased to 40%. Both crystalline layer thickness and crystalline fraction first increased, then decreased with the further addition of A2O3 content. Moreover, it indicated that the heat transfer process inside the mold was dominated by both a crystallization of mold flux and the resulting interfacial thermal resistance. Further, the Rint increased from 9.2 × 10⁻⁴ m2·kW−1 to 11.0 × 10⁻⁴ m2·kW−1 and then to 16.0 × 10⁻⁴ m2·kW−1 when the addition of Al2O3 content increased from 7% to 20% and then to 30%, respectively; however, it decreased to 13.6 × 10⁻⁴ m2·kW−1 when the Al2O3 content reached 40%.

Graphical Abstract

1. Introduction

Aluminum, as an effective additive, is widely used for the new generation of automotive steels (TRIP/TWIP, etc.) development, as it can lower the weight of an automotive body for a better fuel-efficiency without losing the safety through the improvement of the mechanical properties of steels. However, the containing aluminum in steels would tend to introduce problems for continuous casting processes, as partial dissolution of aluminum in the steels would transfer into a mold flux and lead to a dramatic interaction between silica and aluminum that would deteriorate the mold flux properties such as viscosity and crystallization, which would further degenerate the quality of the shell and consequently affect the smooth casting process. Basically, there are two ways for the pickup of Al2O3 in the mold flux during the continuous casting process. One is the absorption of Al2O3-based inclusions, which form in the steelmaking, refining, and casting processes [1,2]. The other is the direct reaction that occurs in the vicinity of the steel/slag interface between the Al contained molten steel and the SiO2-contained liquid mold slag [3,4]. The experimental results reported by the ArcelorMittal [5] showed that the content of alumina in the mold flux can reach more than 30% during the TRIP steel continuous casting process.
The increase in Al2O3 content in the mold flux deteriorates the lubrication of shell. According to research by Zhang et al. [6], the viscosity increased sharply with the increase in Al2O3/SiO2 in the mold flux, which is consistent with the results of Yu et al. [7] Further, Kim et al. [8] further investigated the effect of Al2O3 on the viscosity and suggested that the increase in viscosity was due to the change in the calcium silicate-based melt structure that was caused by the increase in Al2O3 content. Therefore, the increase in Al2O3 in the mold flux will lead to an increase in viscosity, which will lower the rheological ability of the mold flux that makes a mold flux infiltration harder and a lower mold flux consumption, consequently deteriorating the lubrication of shell.
Regarding the effect of Al2O3 content on the heat transfer behavior, the related reports are relatively rare. Cho et al. [9] observed a fade in mold heat transfer rate when the conventional lime-silica mold fluxes were used during casting the TRIP steel. Yu et al. [10] characterized the heat flux across the slag film when casting the high aluminum TRIP steel. Additionally, it was found that the heat flux decreased with the increase in the w Al 2 O 3 / w SiO 2 ratio.
Although several works have been done, the impact of Al2O3 on the heat transfer performance of the mold flux is still not thoroughly clear; the importance of interfacial thermal resistance is especially ignored. Therefore, in this study, the effect of Al2O3 content (ranging from 7 to 40 wt. %) on heat transfer behavior of the mold flux, and interfacial thermal resistance between the mold/slag, were studied via an advanced Infrared Emitter Technique (IET).

2. Materials and Methods

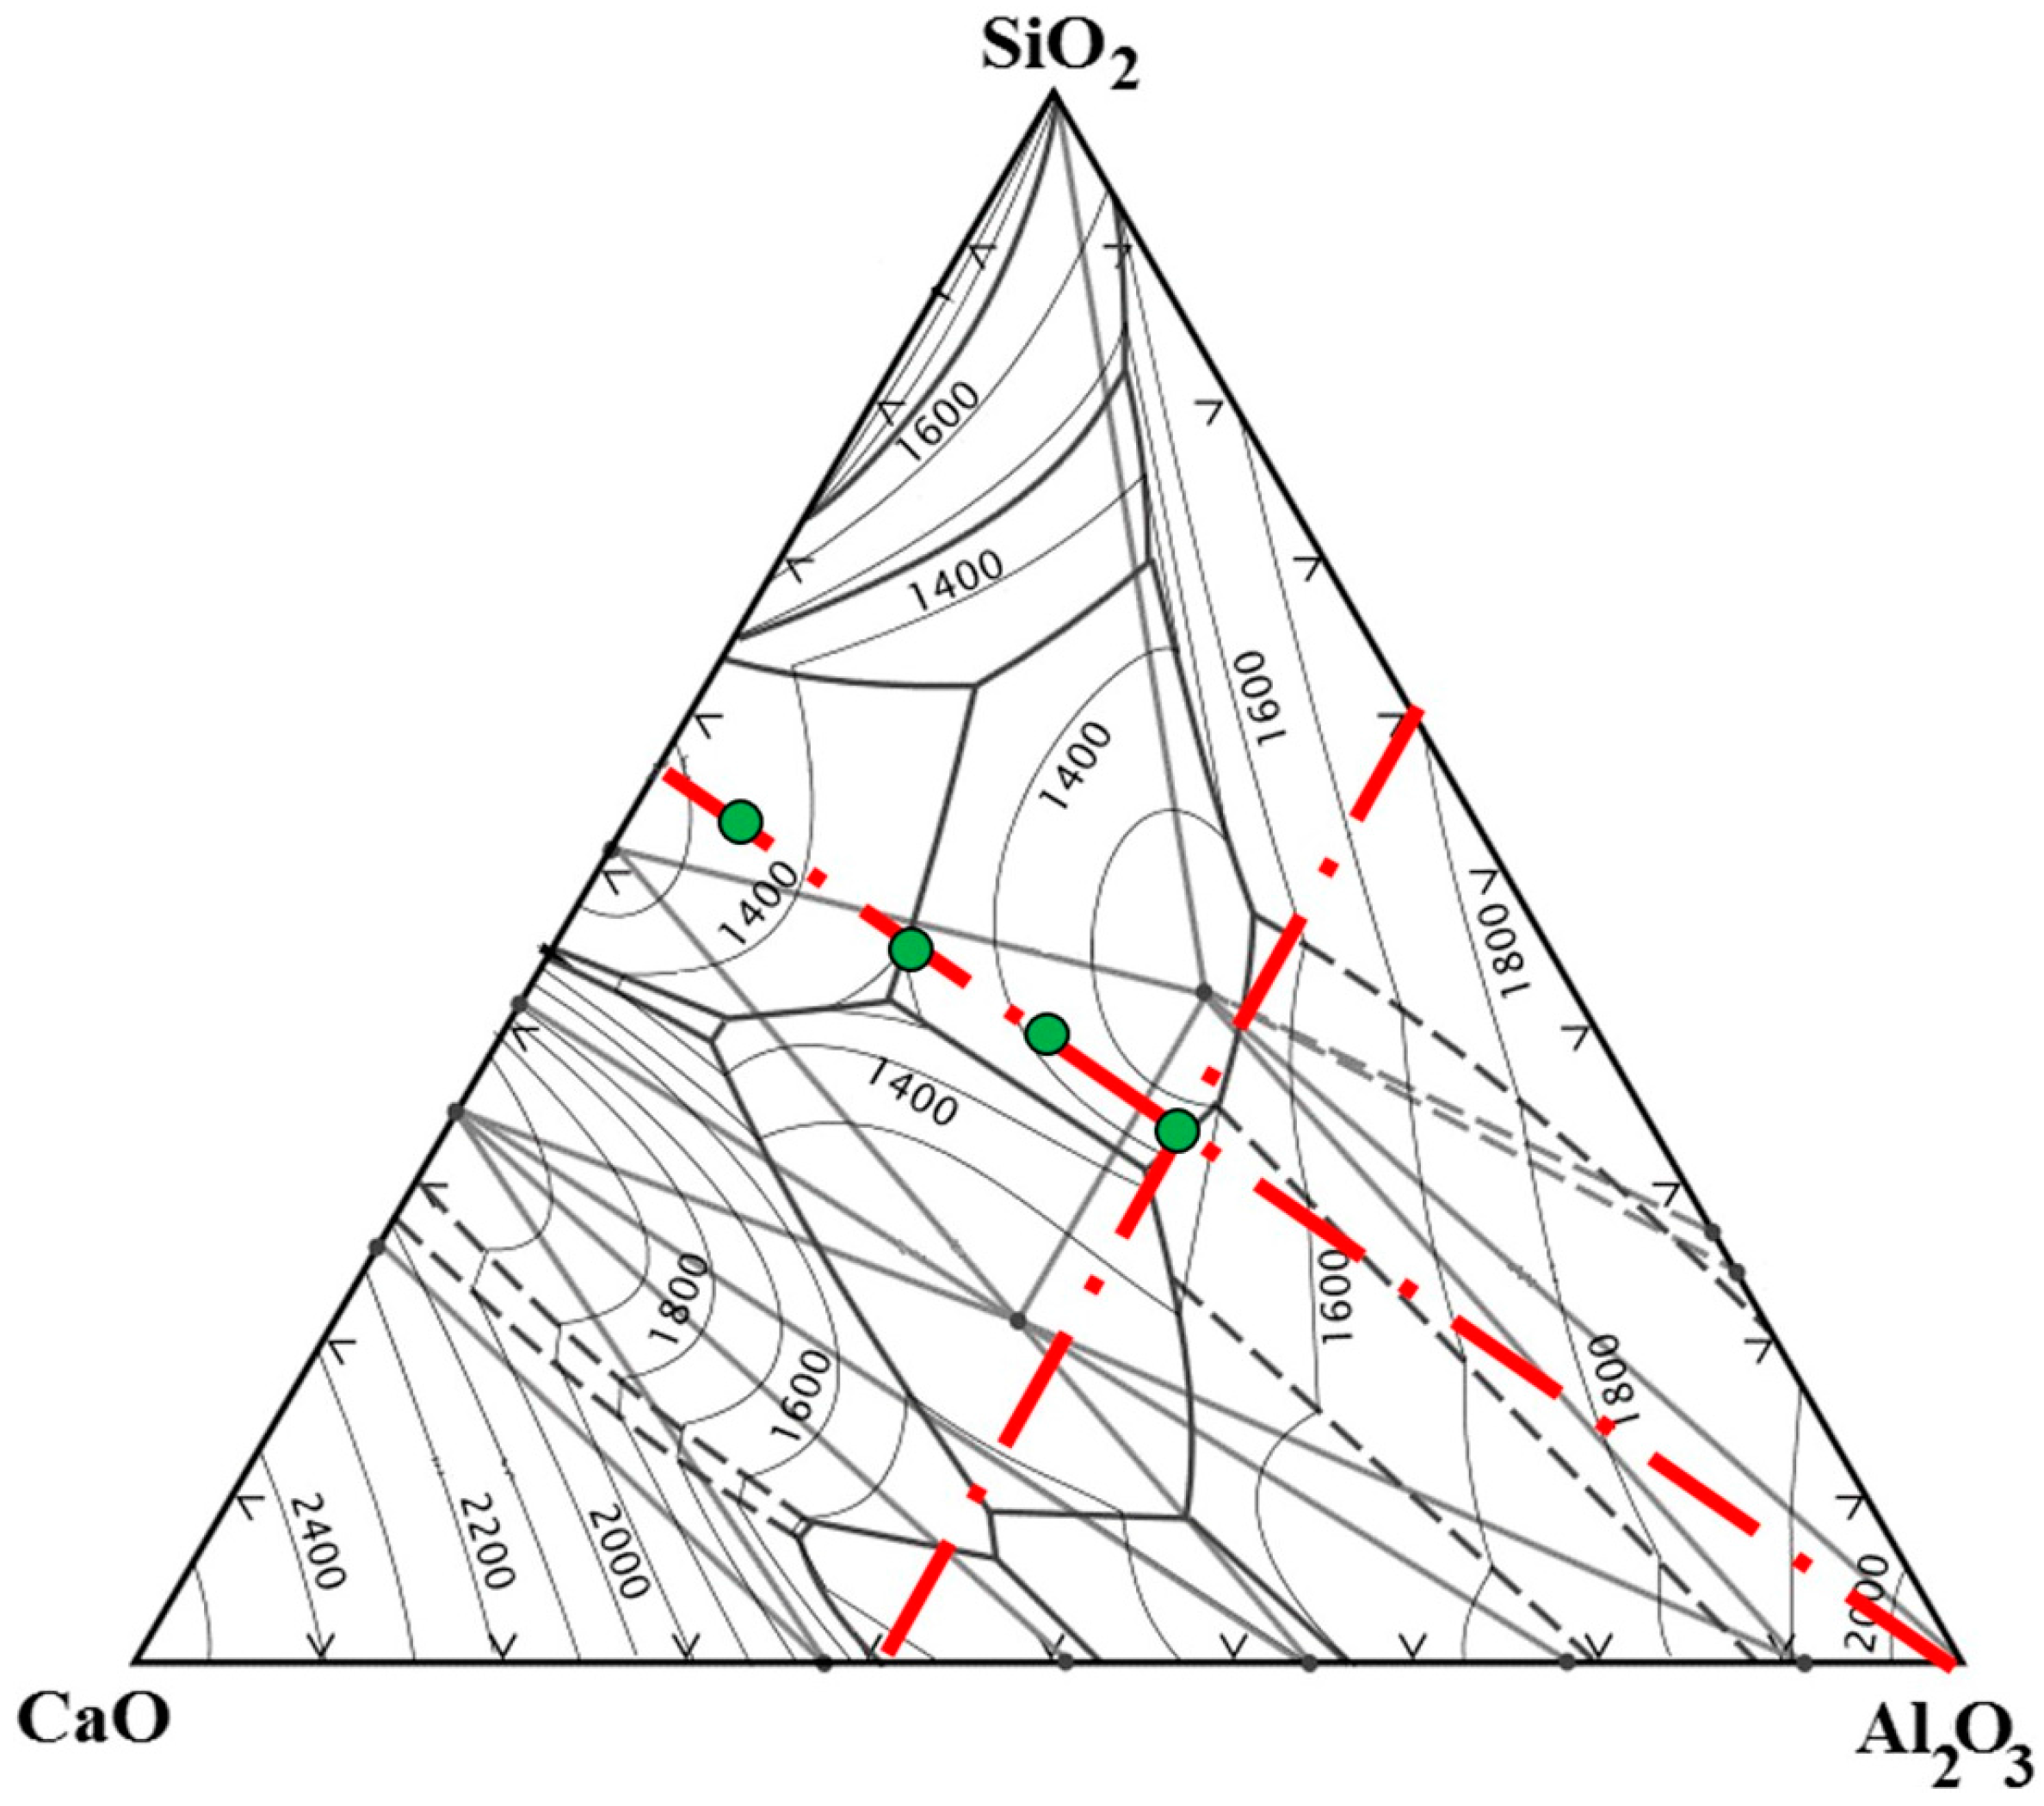
2.1. Experimental Slags

A commercial mold flux (named as R0.8A7 in Table 1), with an R = CaO/SiO2 (basicity) of 0.8 and Al2O3 content of 7 wt. %, for casting low carbon steel was chosen as the matrix flux in this study [11]. In order to investigate the influence of Al2O3 on the heat transfer behaviors of mold fluxes, different amounts of reagent grade chemicals, such as CaCO3, SiO2, Al2O3, MgCO3, CaF2, Na2CO3, and Li2CO3, were added into the matrix R0.8A7 to make the content of Al2O3 in the mold flux vary from 7 to 40 wt. %. The maximal amount of Al2O3 contained in the mold flux was chosen to be 40 wt. %, according to the CaO–SiO2–Al2O3 ternary phase diagram [12], due to the fact that the maximal amount of precipitation of Al2O3 is about 40% when the basicity (CaO/SiO2) is 0.8, as shown in Figure 1.
The samples were prepared via melting in an induction furnace with a graphite crucible at a temperature of 1773 K (1500 °C) for about 5 min in order to homogenize their chemical compositions. Then, they were poured onto a copper plate for quenching to fully obtain glass. Meanwhile, a new cylindrical tube copper mold was used to cast the slags before it solidified on the copper plate. After that, the cooled slag disks were ground and polished with SiC sandpaper to control their thickness and surface roughness. The glassy disks, after polished, were individually placed on the top surface of the copper mold during the heat transfer tests. Otherwise, a small amount of solidified glassy mold flux was crushed into powder samples for the Single Hot Thermocouple Technique (SHTT) tests. The final slags after pre-melting were also analyzed through X-Ray Fluoroscopy (XRF, Bruker, Karlsruhe, Germany). The main chemical compositions of those pre-melted slag are listed in Table 1 and marked as dots in Figure 1.

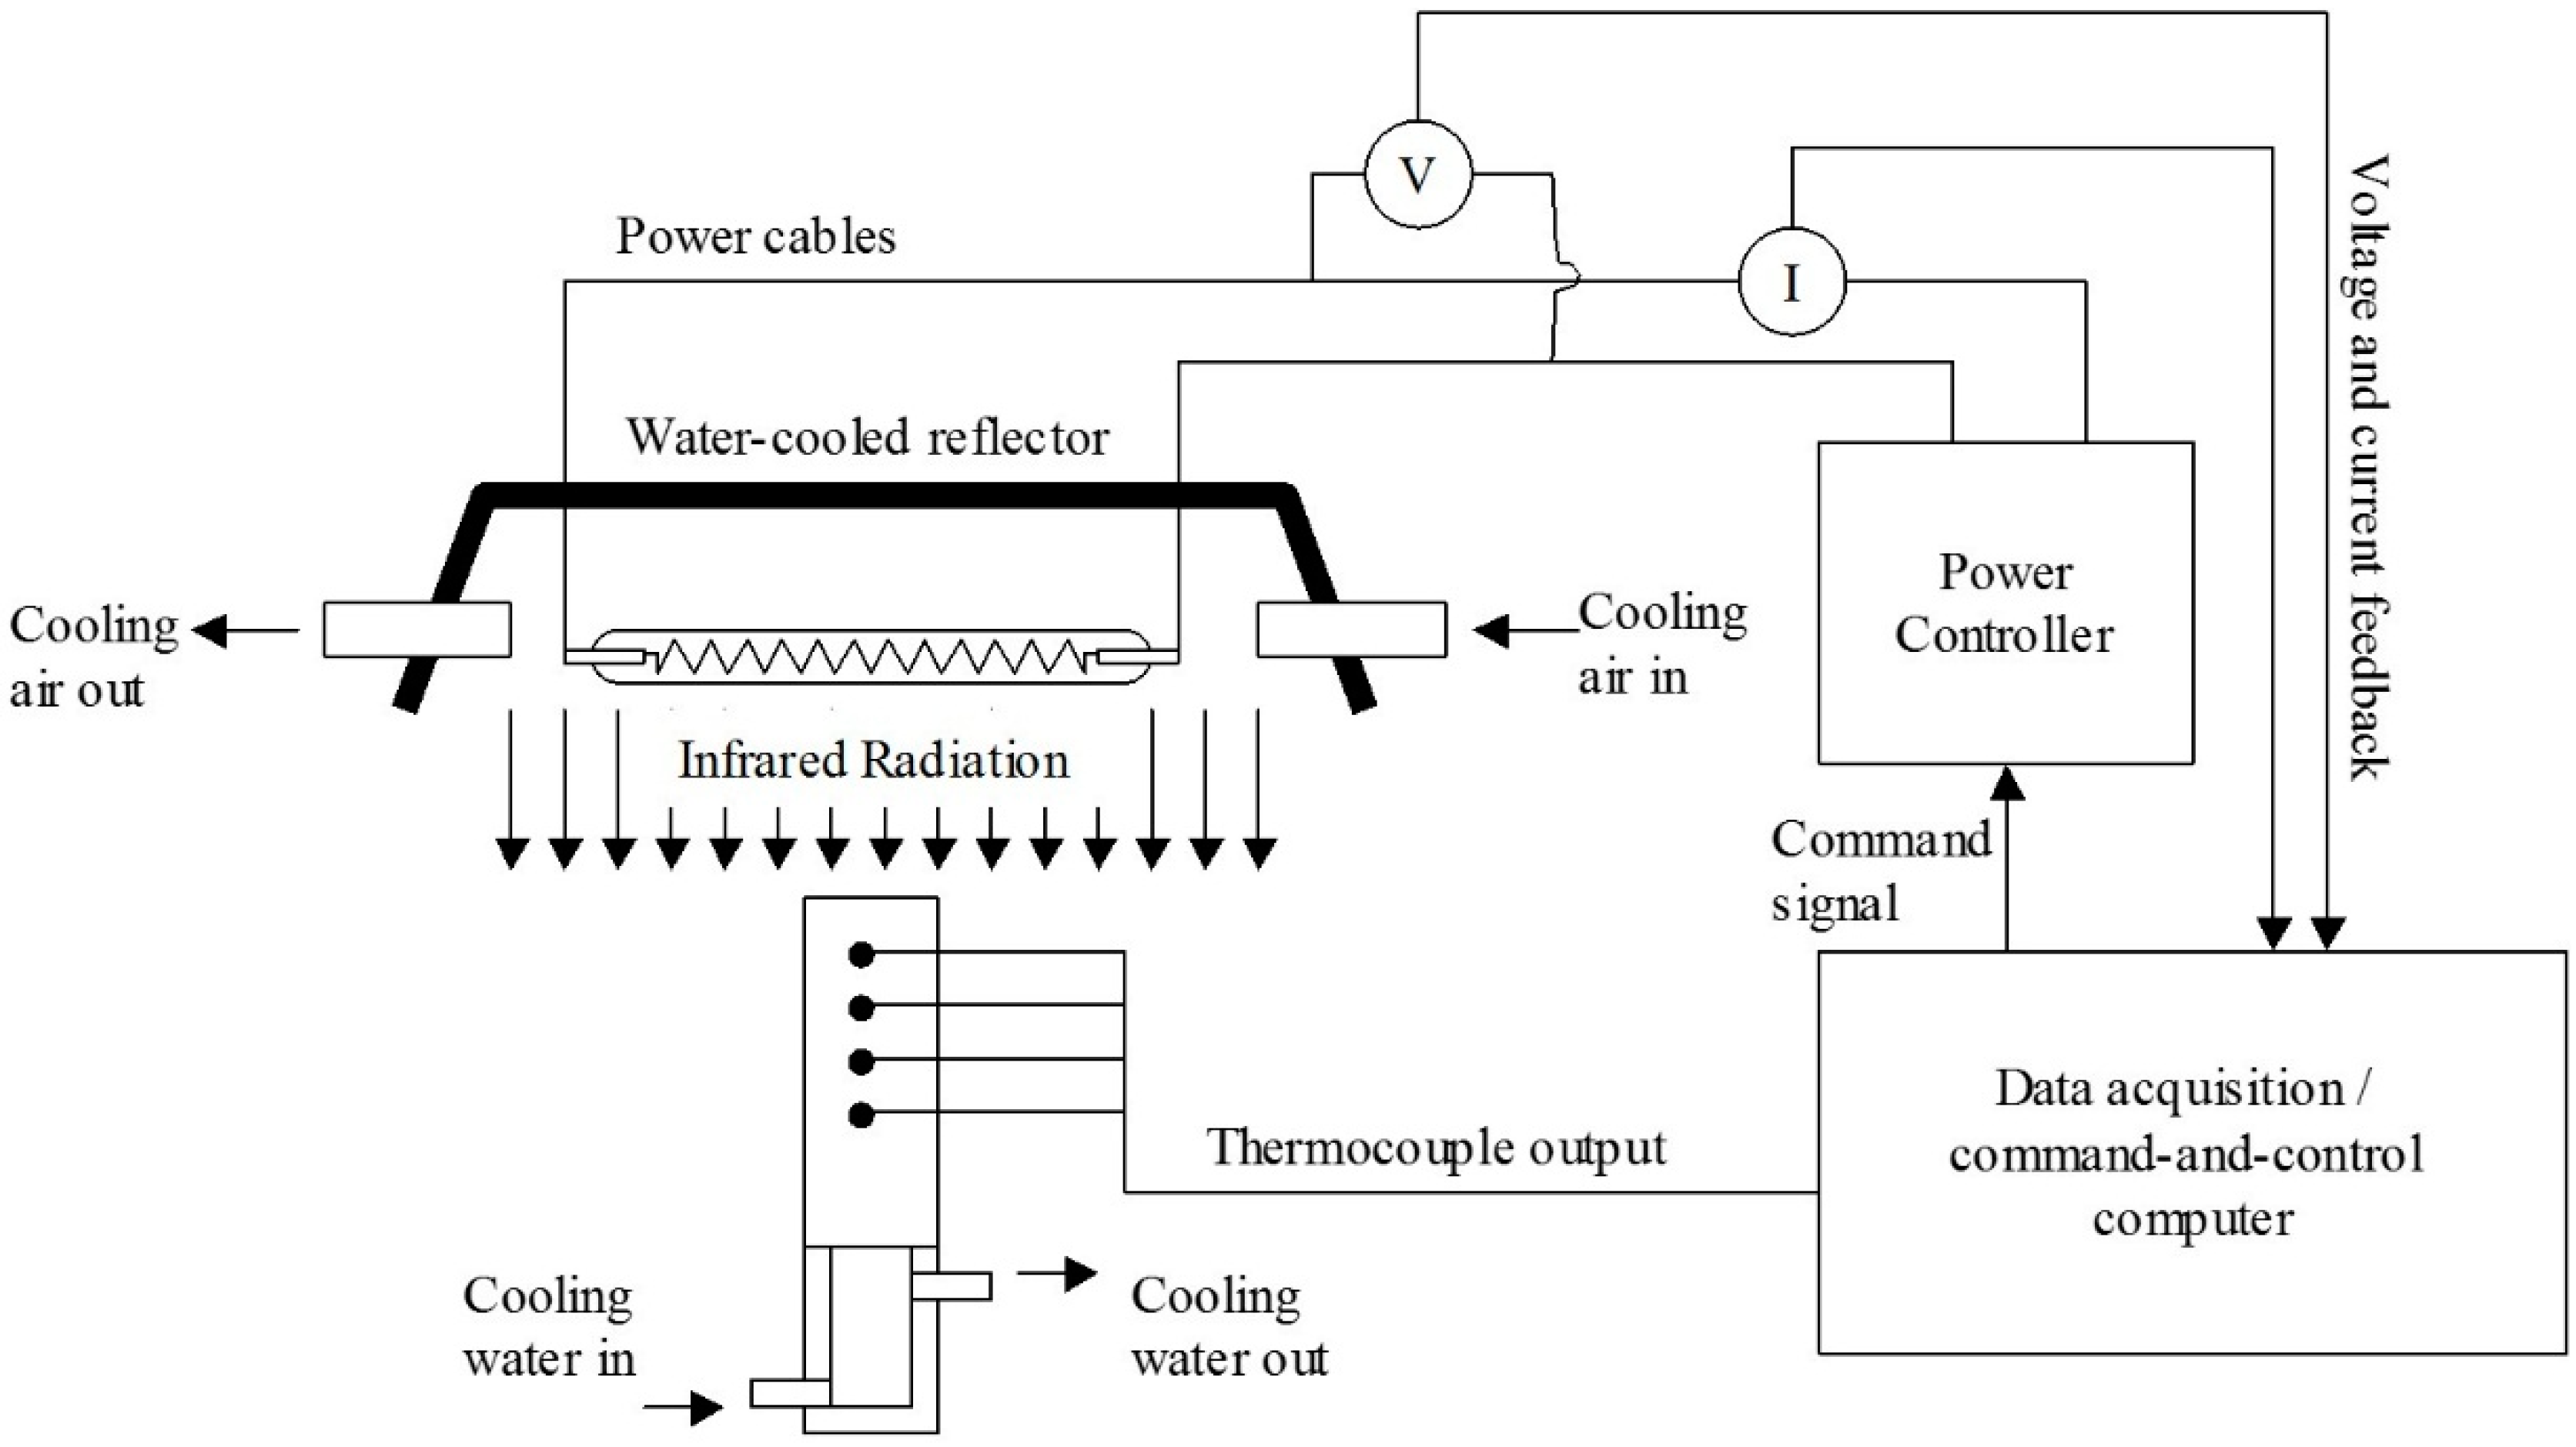
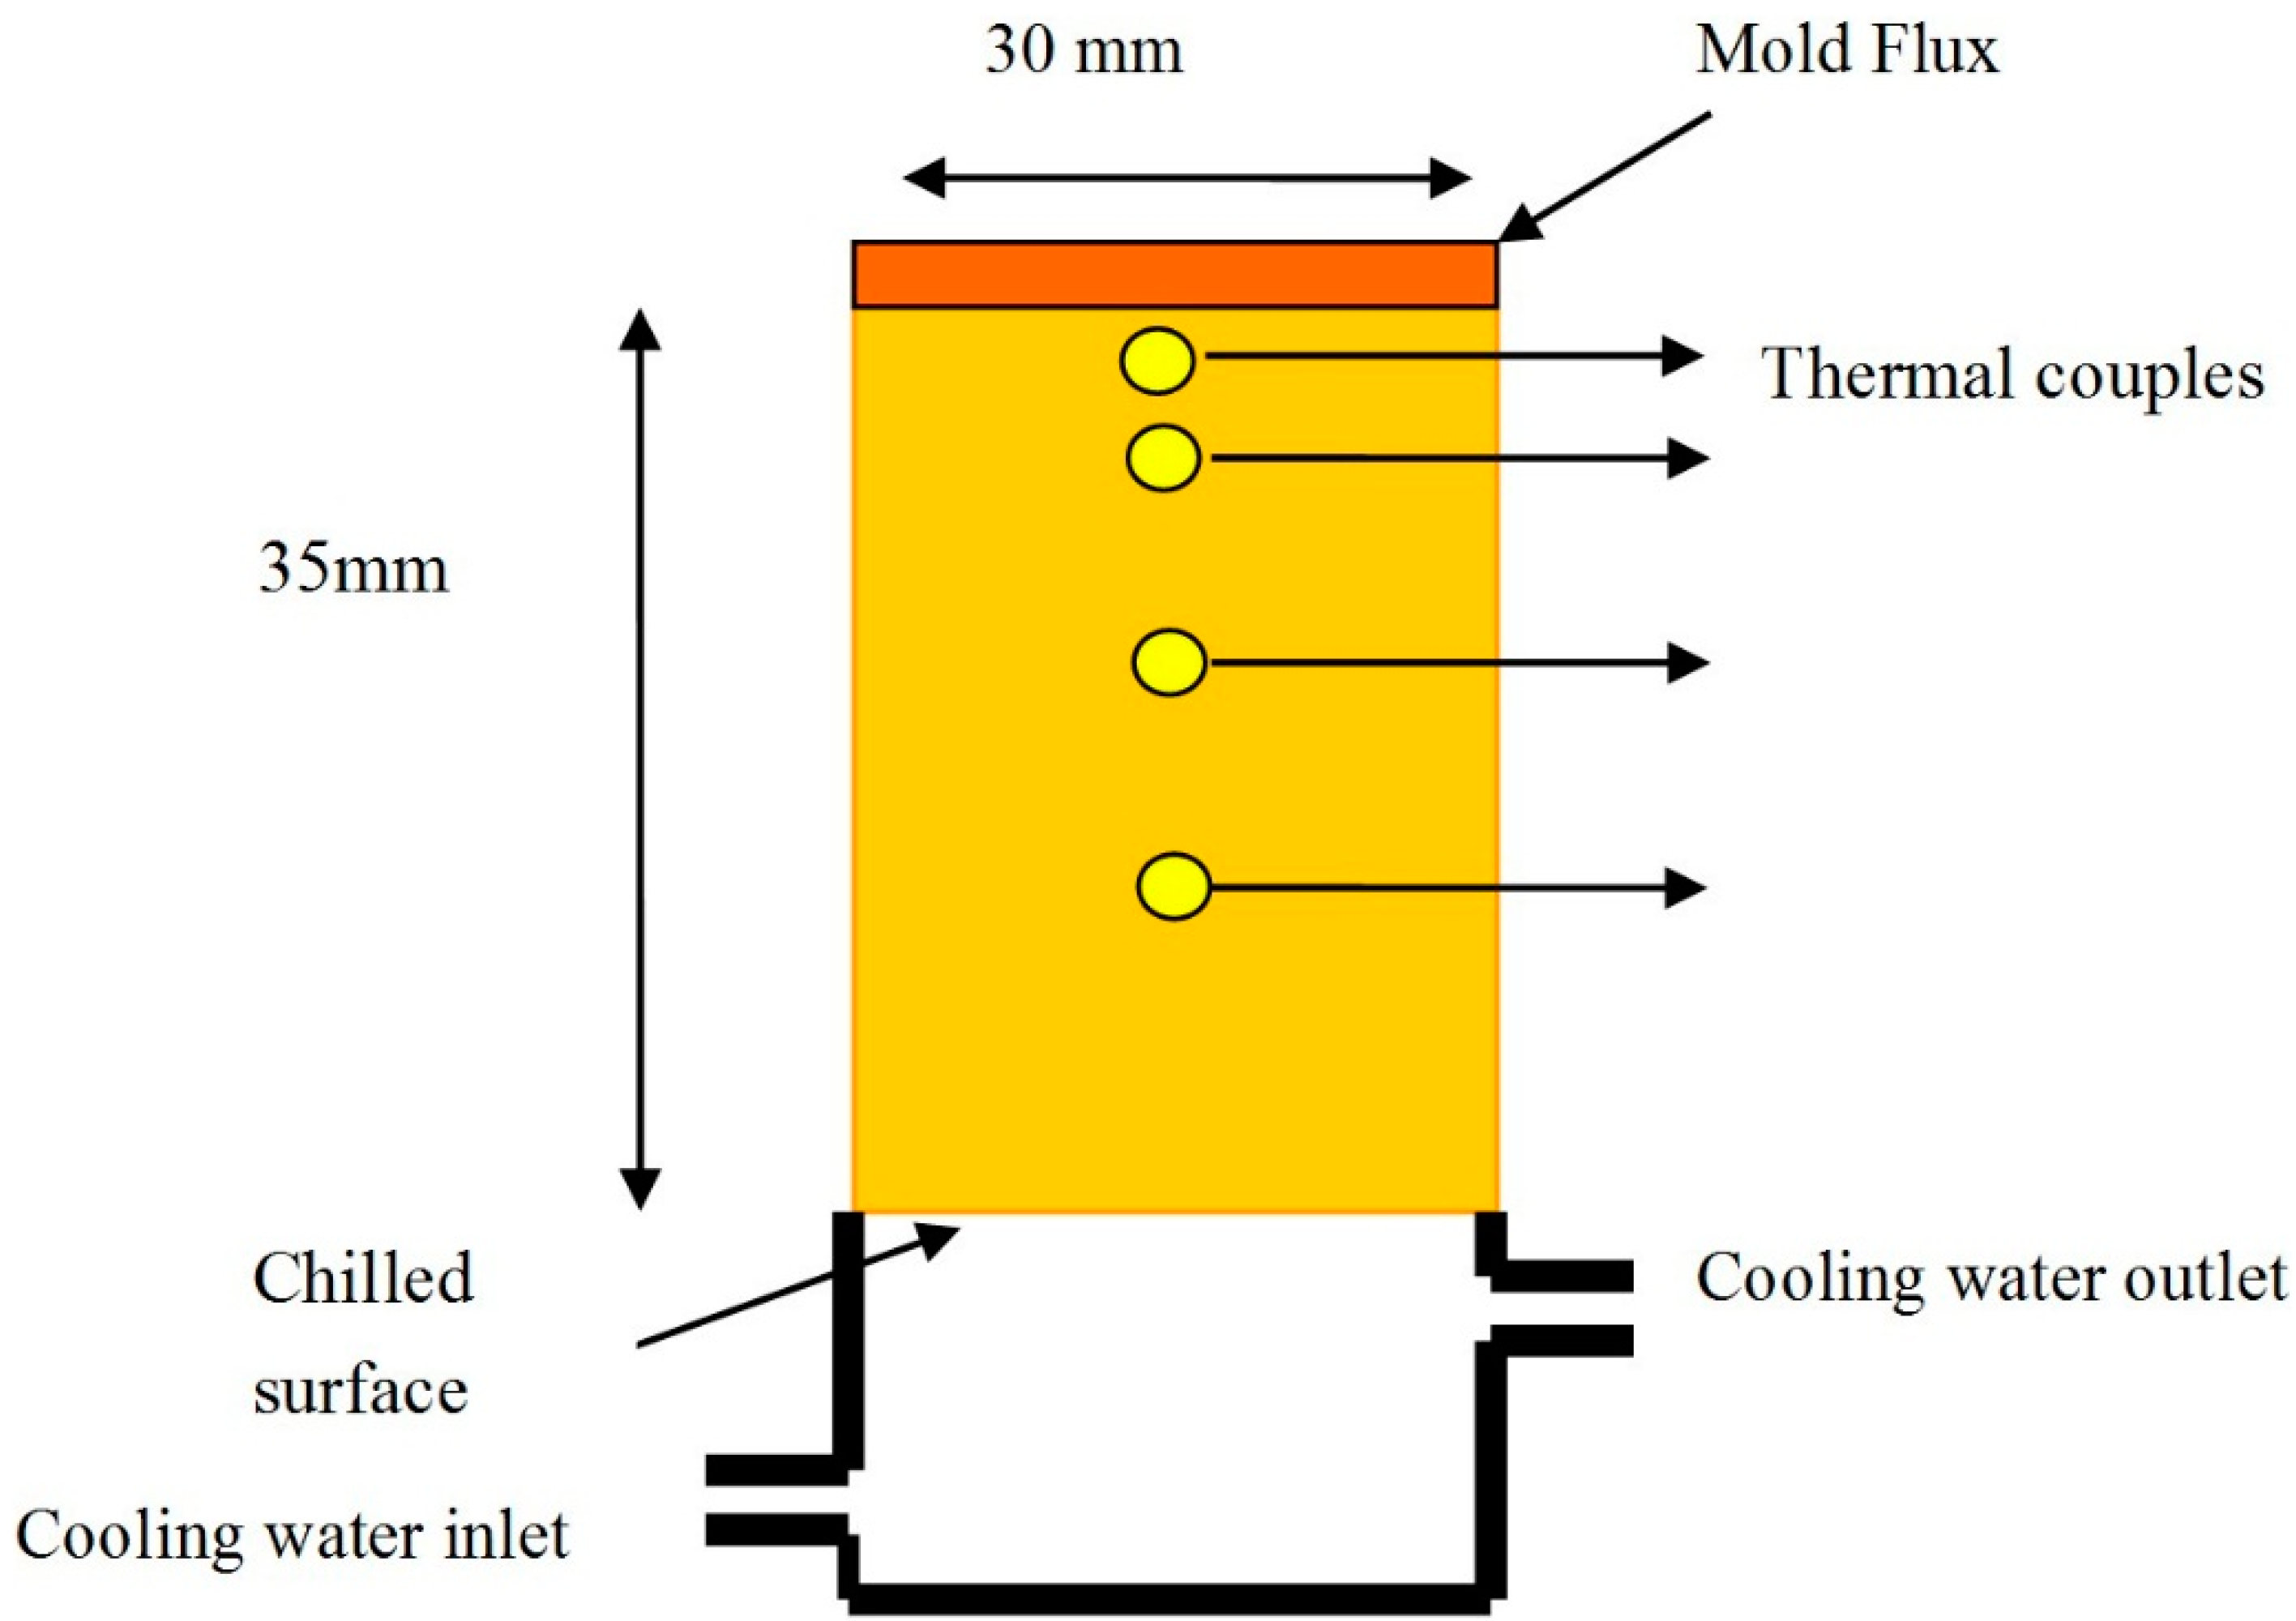
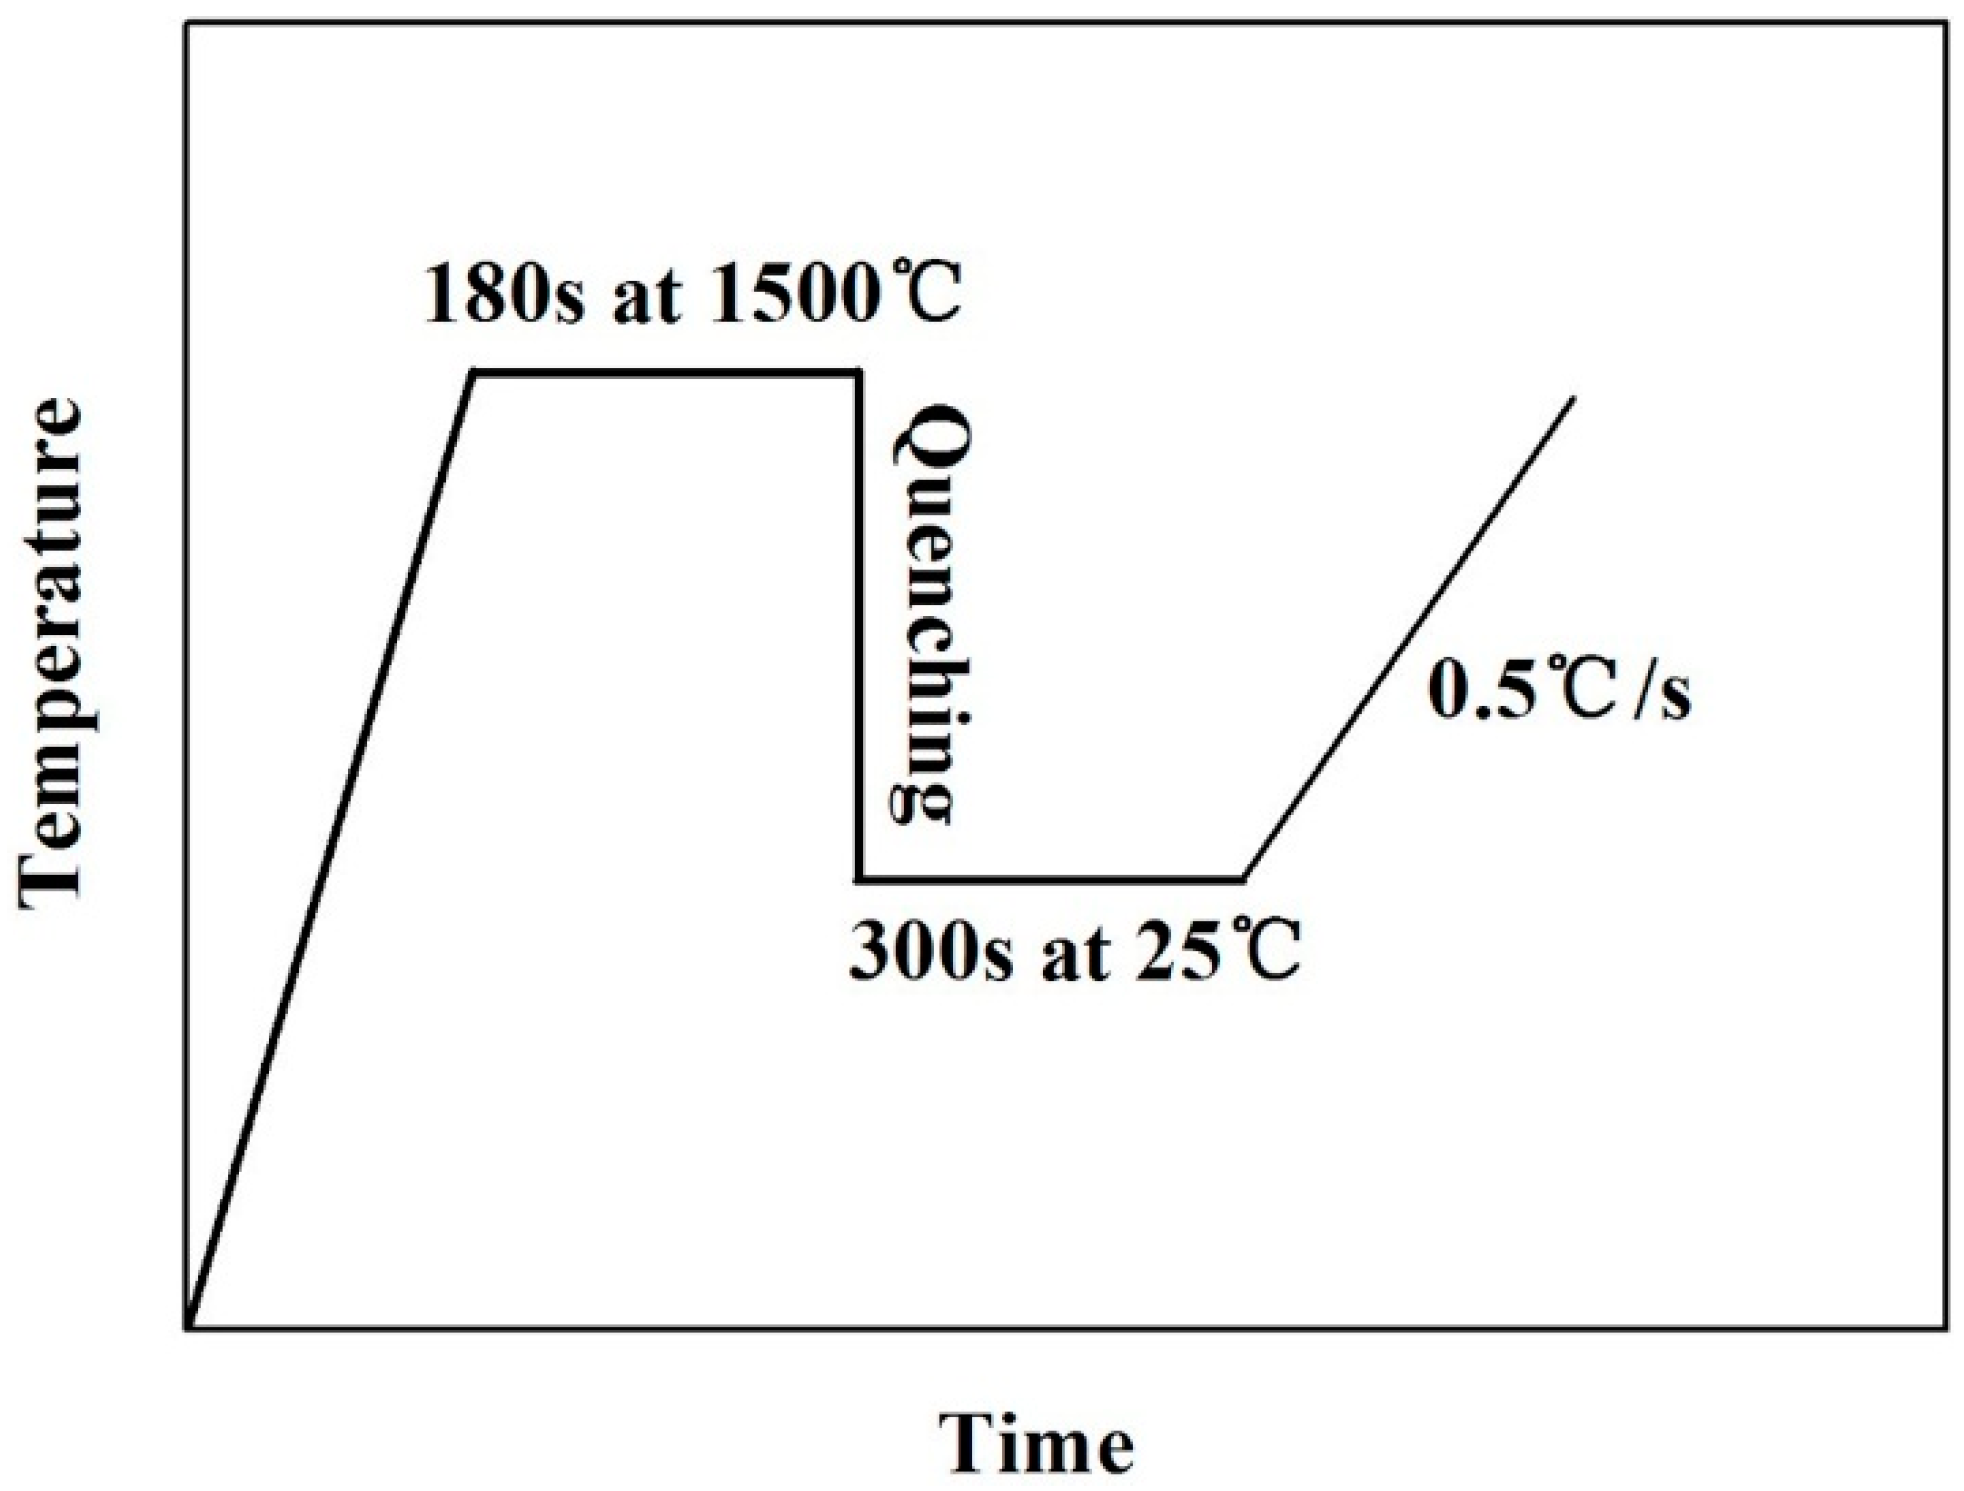
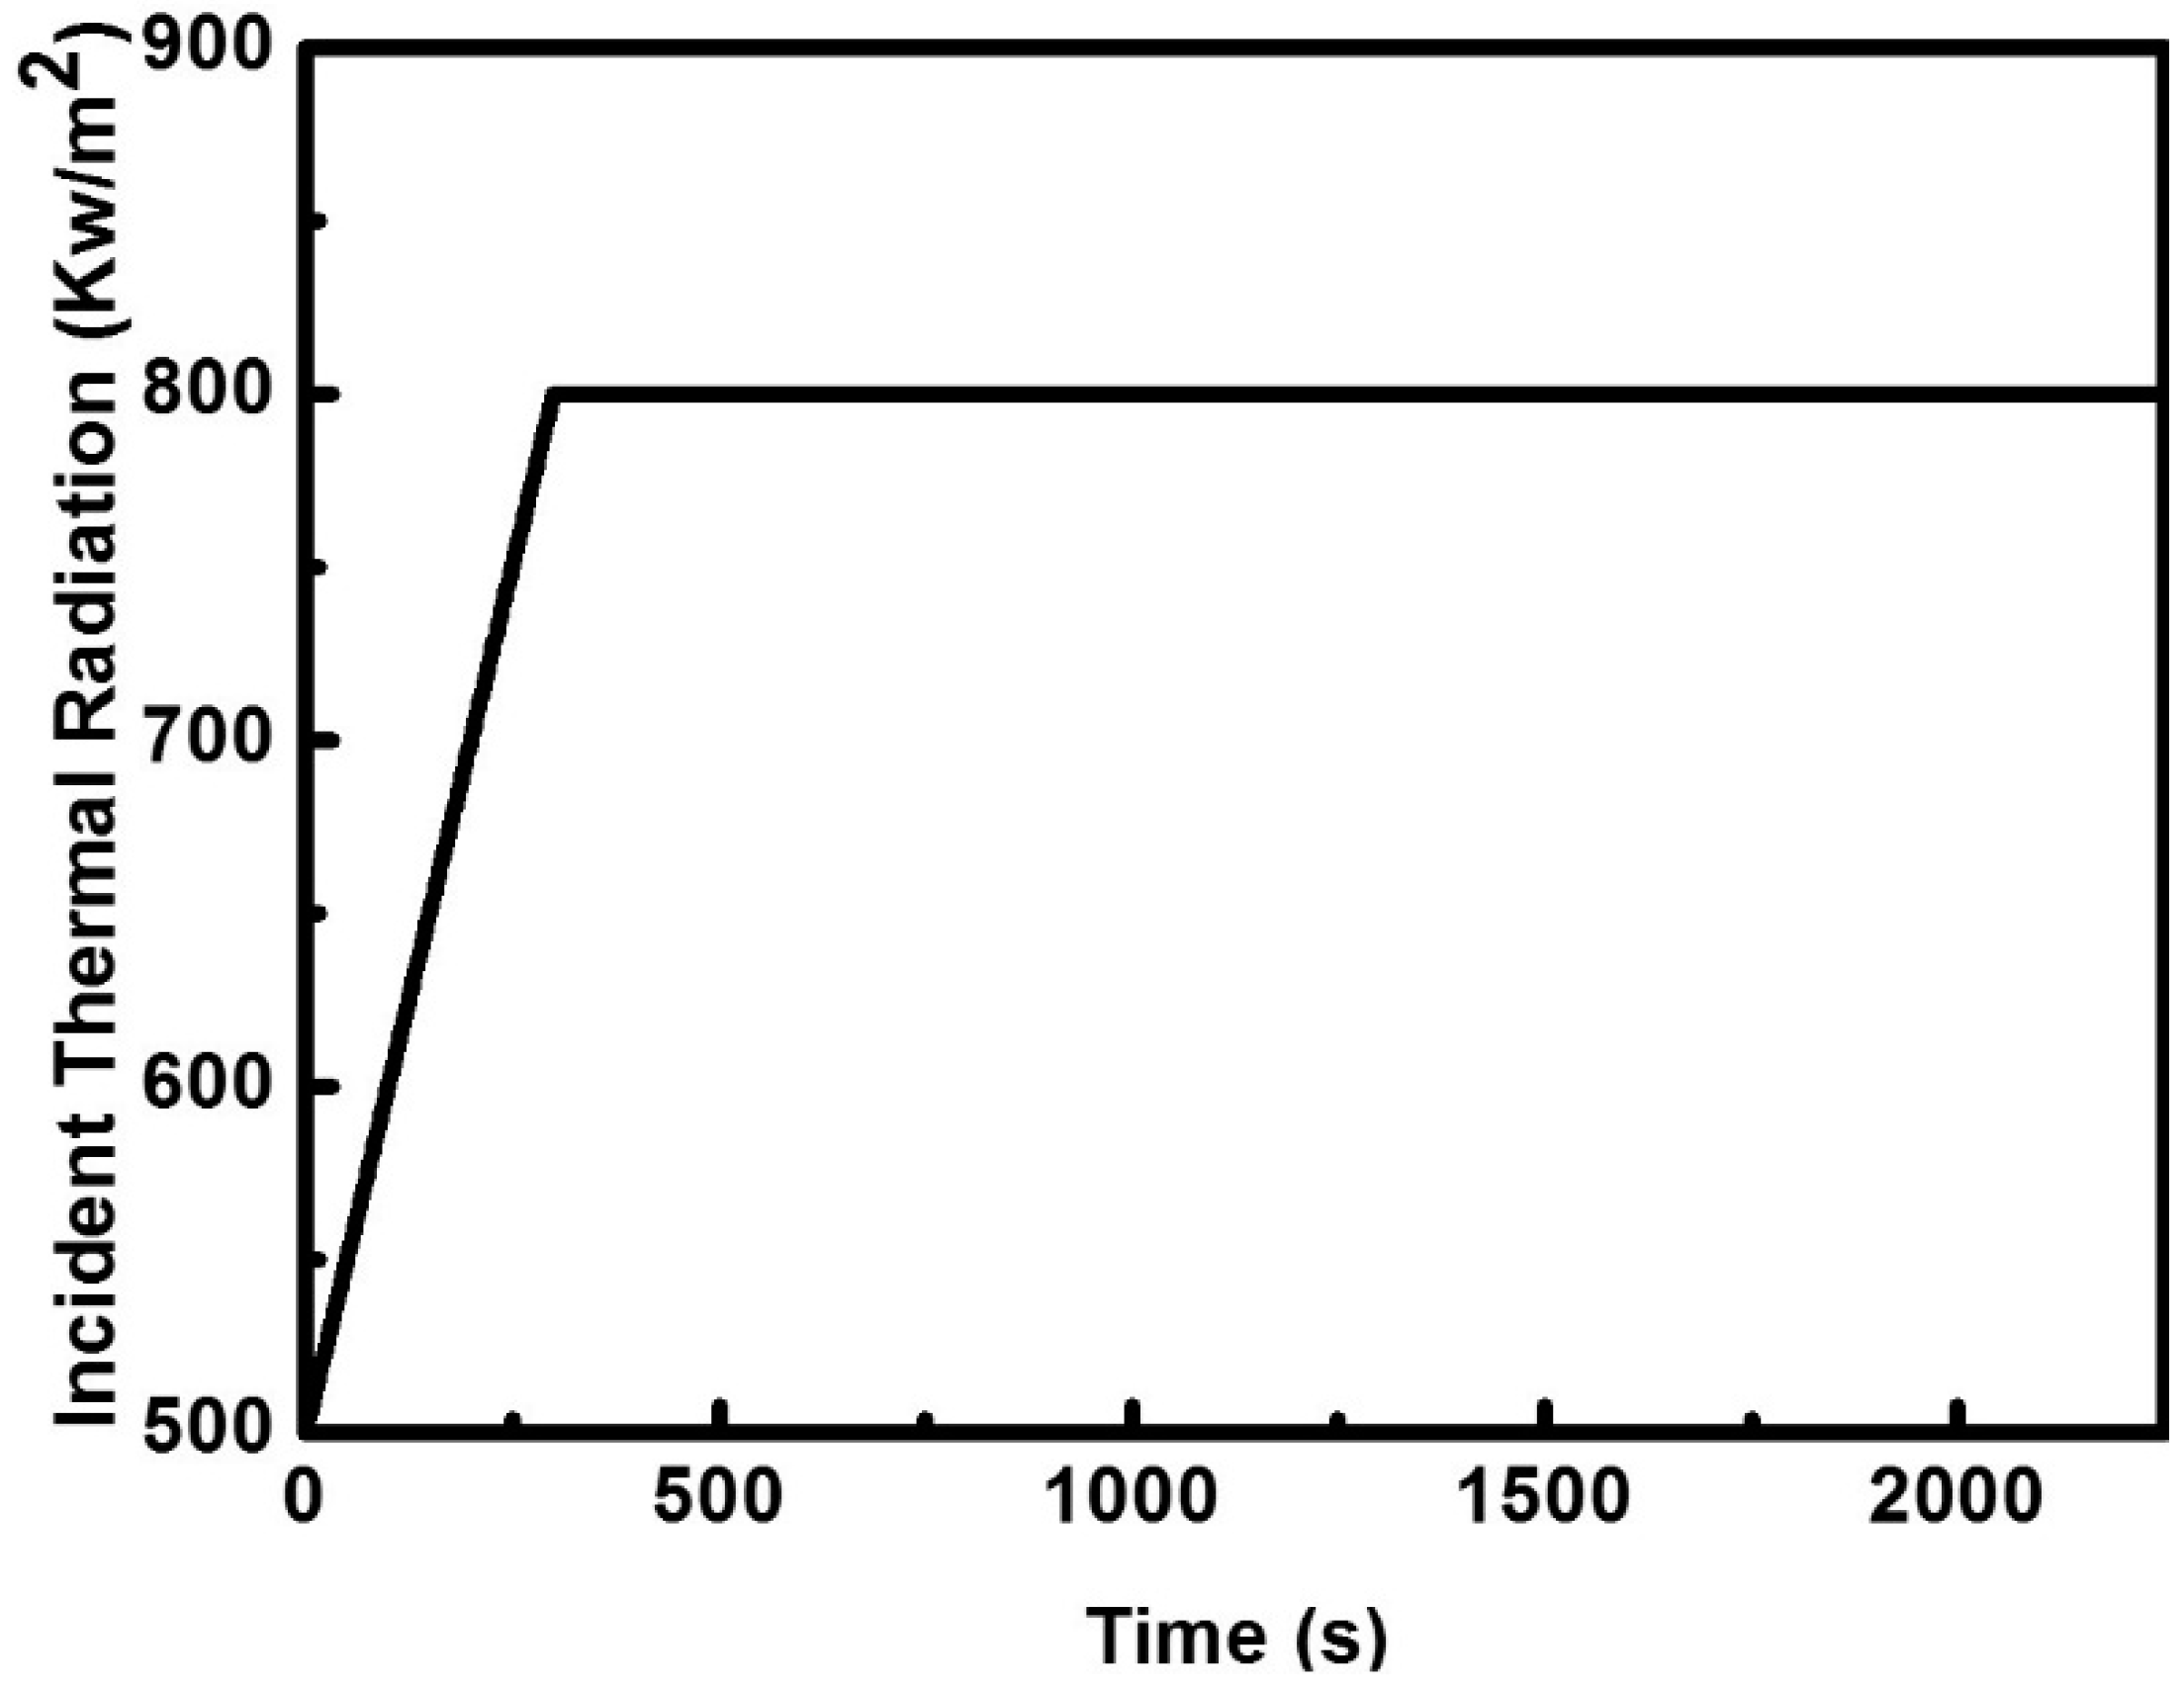
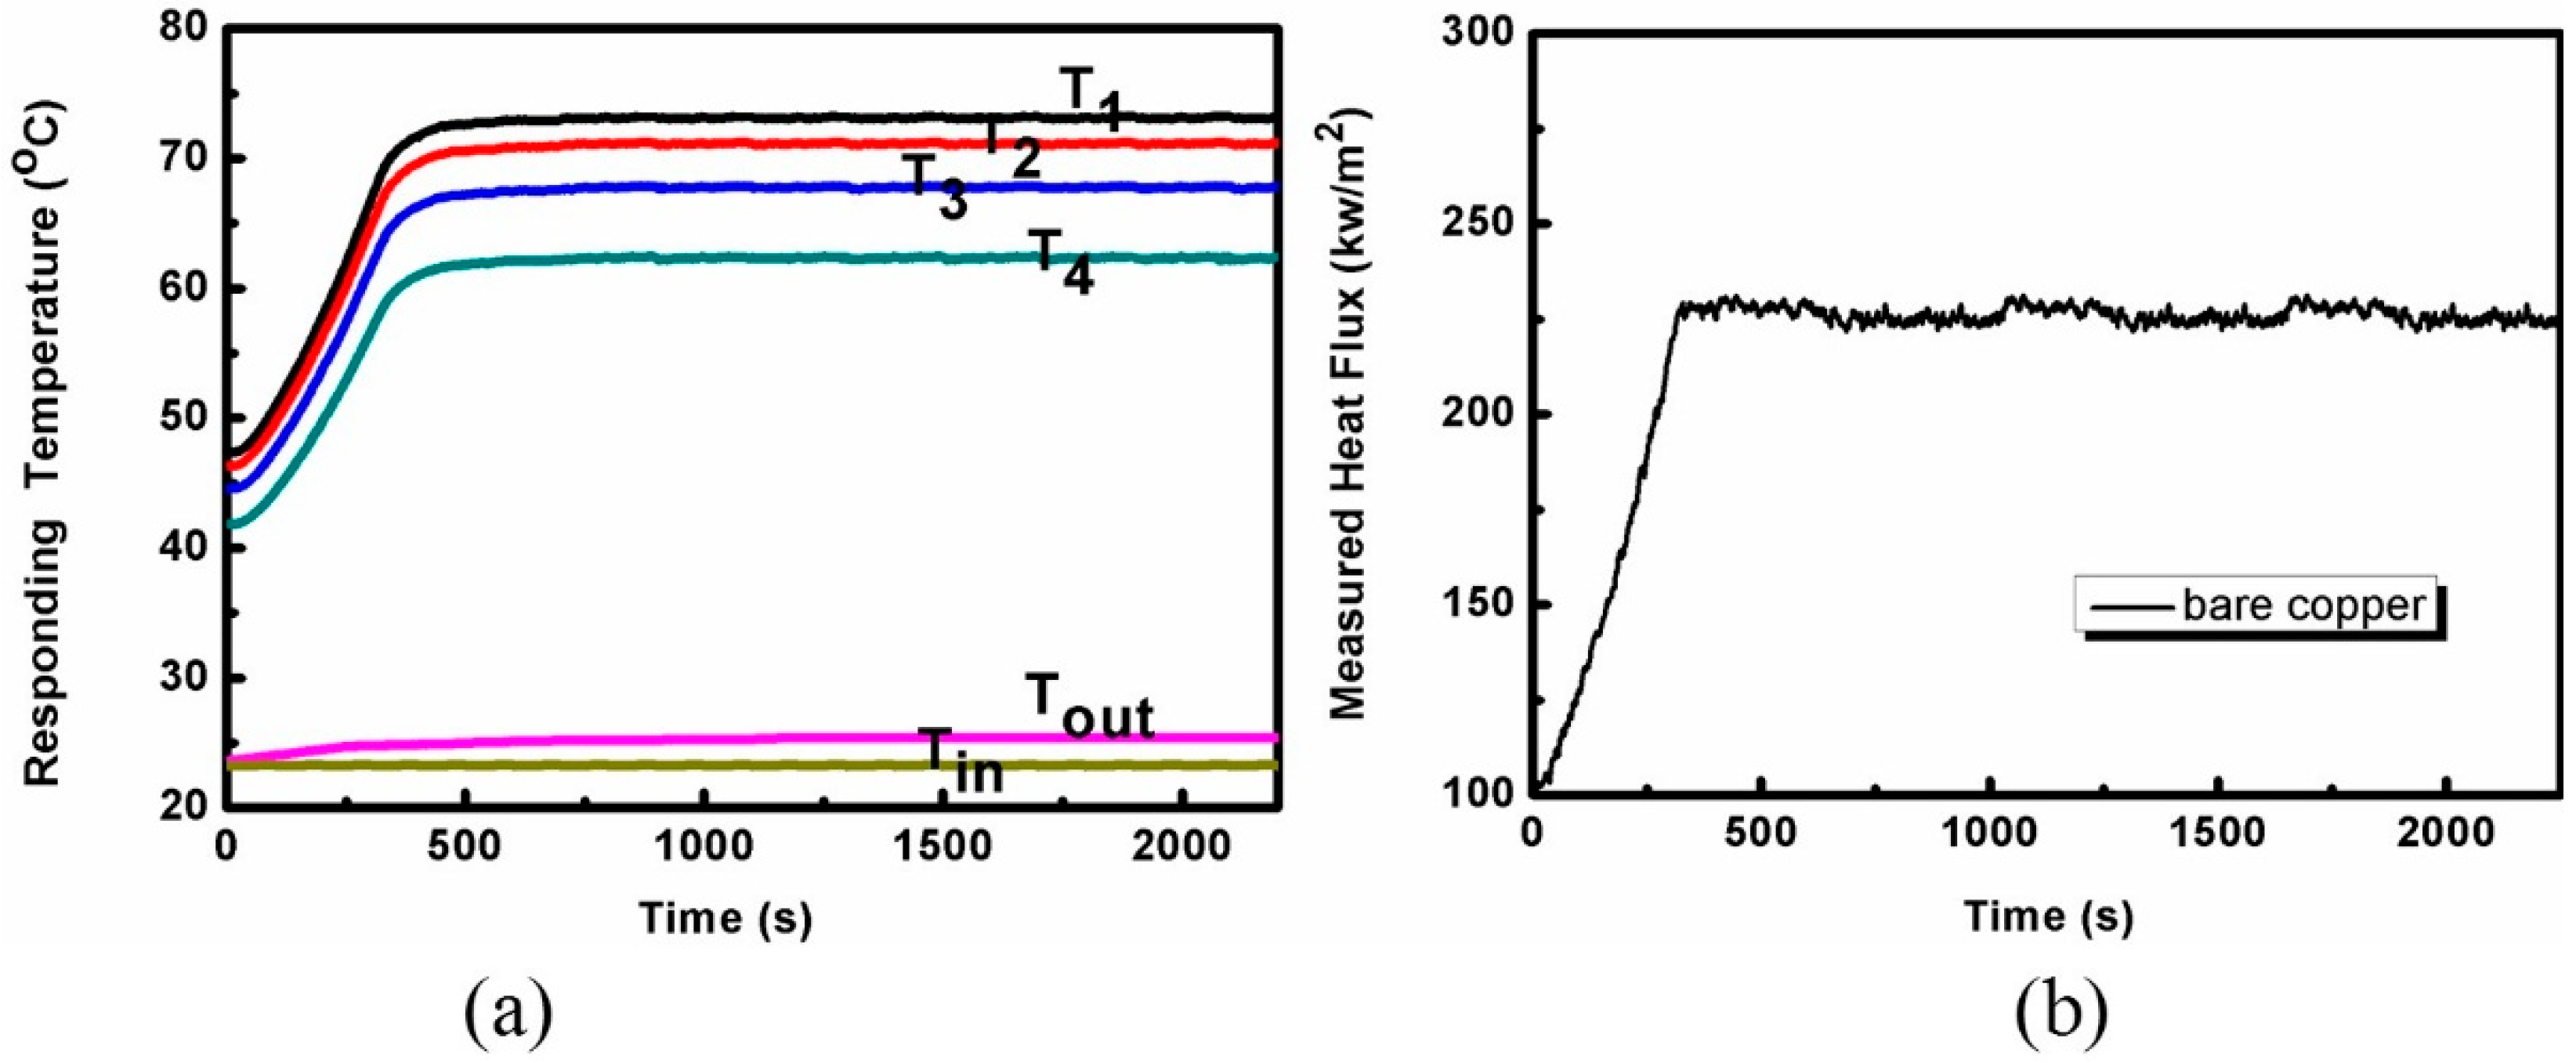
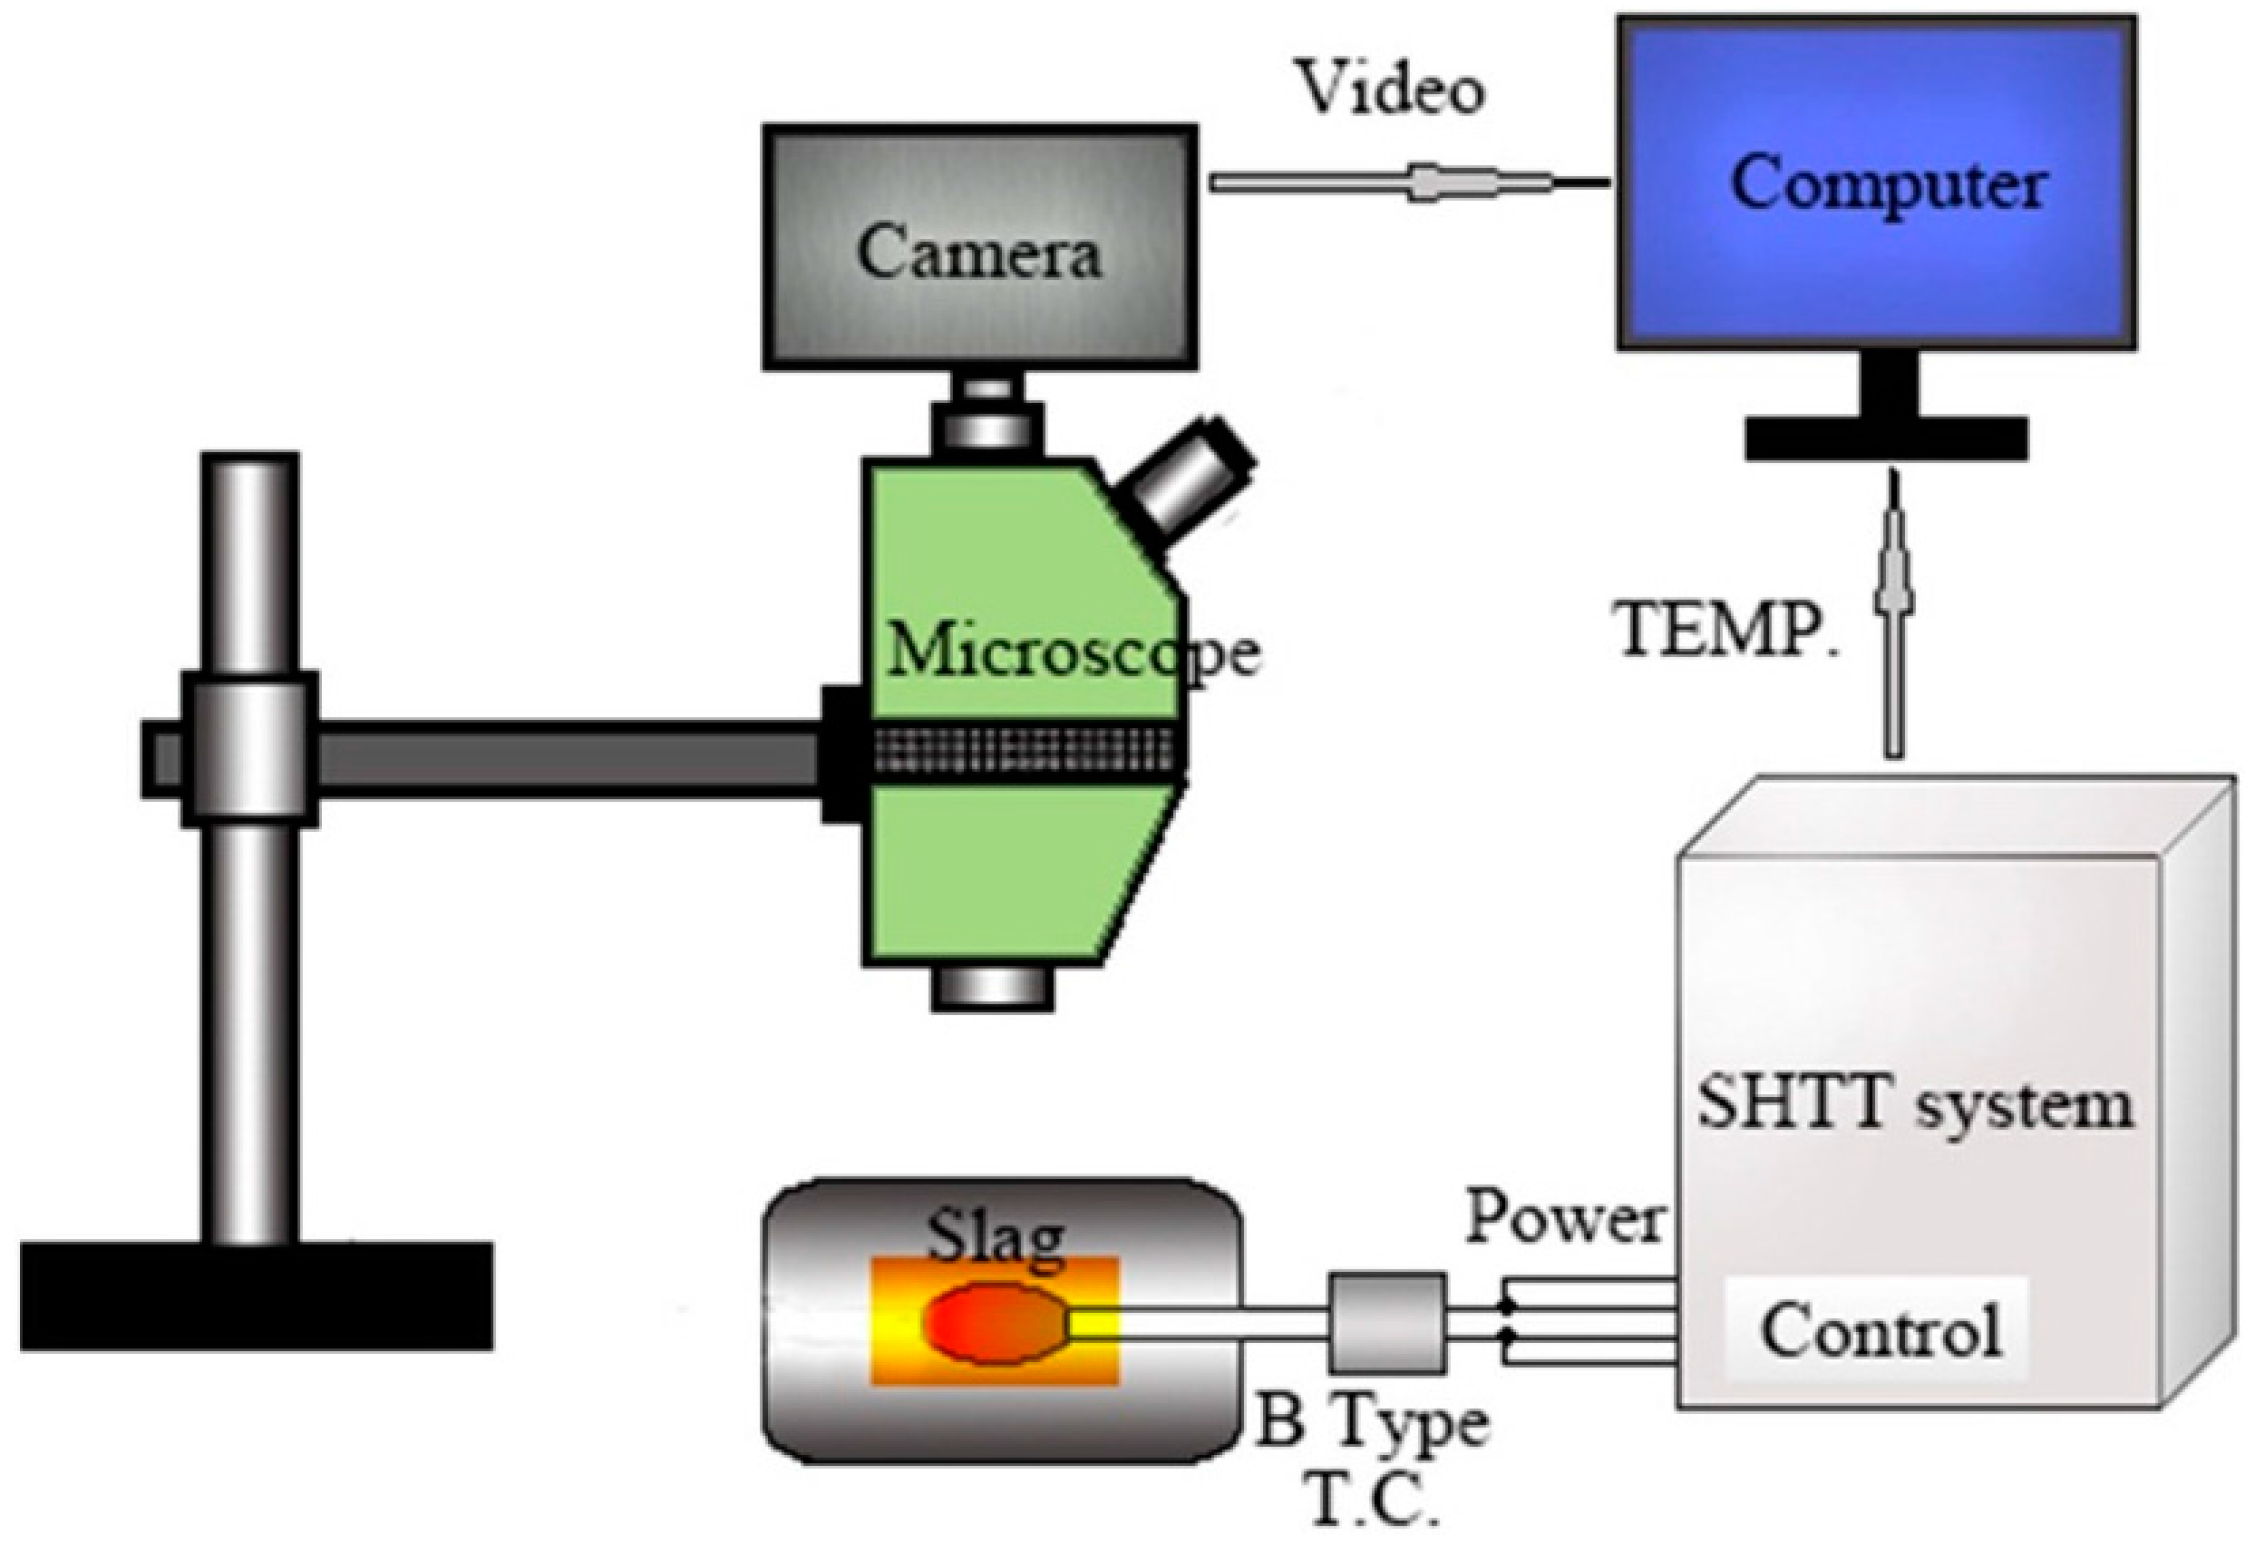
2.2. The Heat Transfer Test

The heat transfer tests of the mold flux with different amounts of Al2O3 were investigated by using the IET, which is schematically shown in Figure 2. Details about the IET have been illustrated in our previous paper [13,14]. The infrared radiant heater (CSU, Changsha, China) with the maximum emitting heat flux of 2.0 MW·m−2, power controller, command/control unit, and data acquisition system were included in this experimental apparatus. Figure 3 shows the schematic figure of the copper mold system, which is simulated by a copper cylinder, cooled by water on one end. The cylindrical copper mold was covered by the slag disks before the application of radiation thermal energy from the infrared radiant heater. The response temperatures were obtained through the subsurface thermocouples.
The heat transfer tests were carried out by preheating the copper mold system with a single glassy disk under a thermal energy of 500 kW·m−2 first. Then, the thermal energy was linearly increased to 800 kW·m−2 with a rate of 1 kW·m−2·s−1 and maintained for 2000 s, as shown in Figure 4.
Figure 5a shows the temperature time span when the heating profile, as shown in Figure 4, was applied to the bare copper mold without the slag disk. The temperature of T1, T2, T3, and T4 were obtained through the thermocouples, embedded 2 mm, 5 mm, 10 mm, and 18 mm below the surface copper mold (Figure 3), respectively. Tin and Tout are the temperatures of the inlet and outlet cooling water. The heat flux across the copper mold was calculated by using the one-dimensional inverse heat conduction model developed by Beck [15,16] based on Equation (1):
x ( k T i x ) = ( ρ c p ) T i t
where T is the temperature, x is the distance below the copper mold top surface, t is the time, k is the thermal conductivity, cp is the heat capacity, and ρ is the mass density of copper.
Then, the calculated result of the heat flux time span across the bare copper system is shown in Figure 5b. It suggests that the measured heat flux linearly increased first with the increase in the output thermal energy; then, it comes into a relative steady state in a very short time.

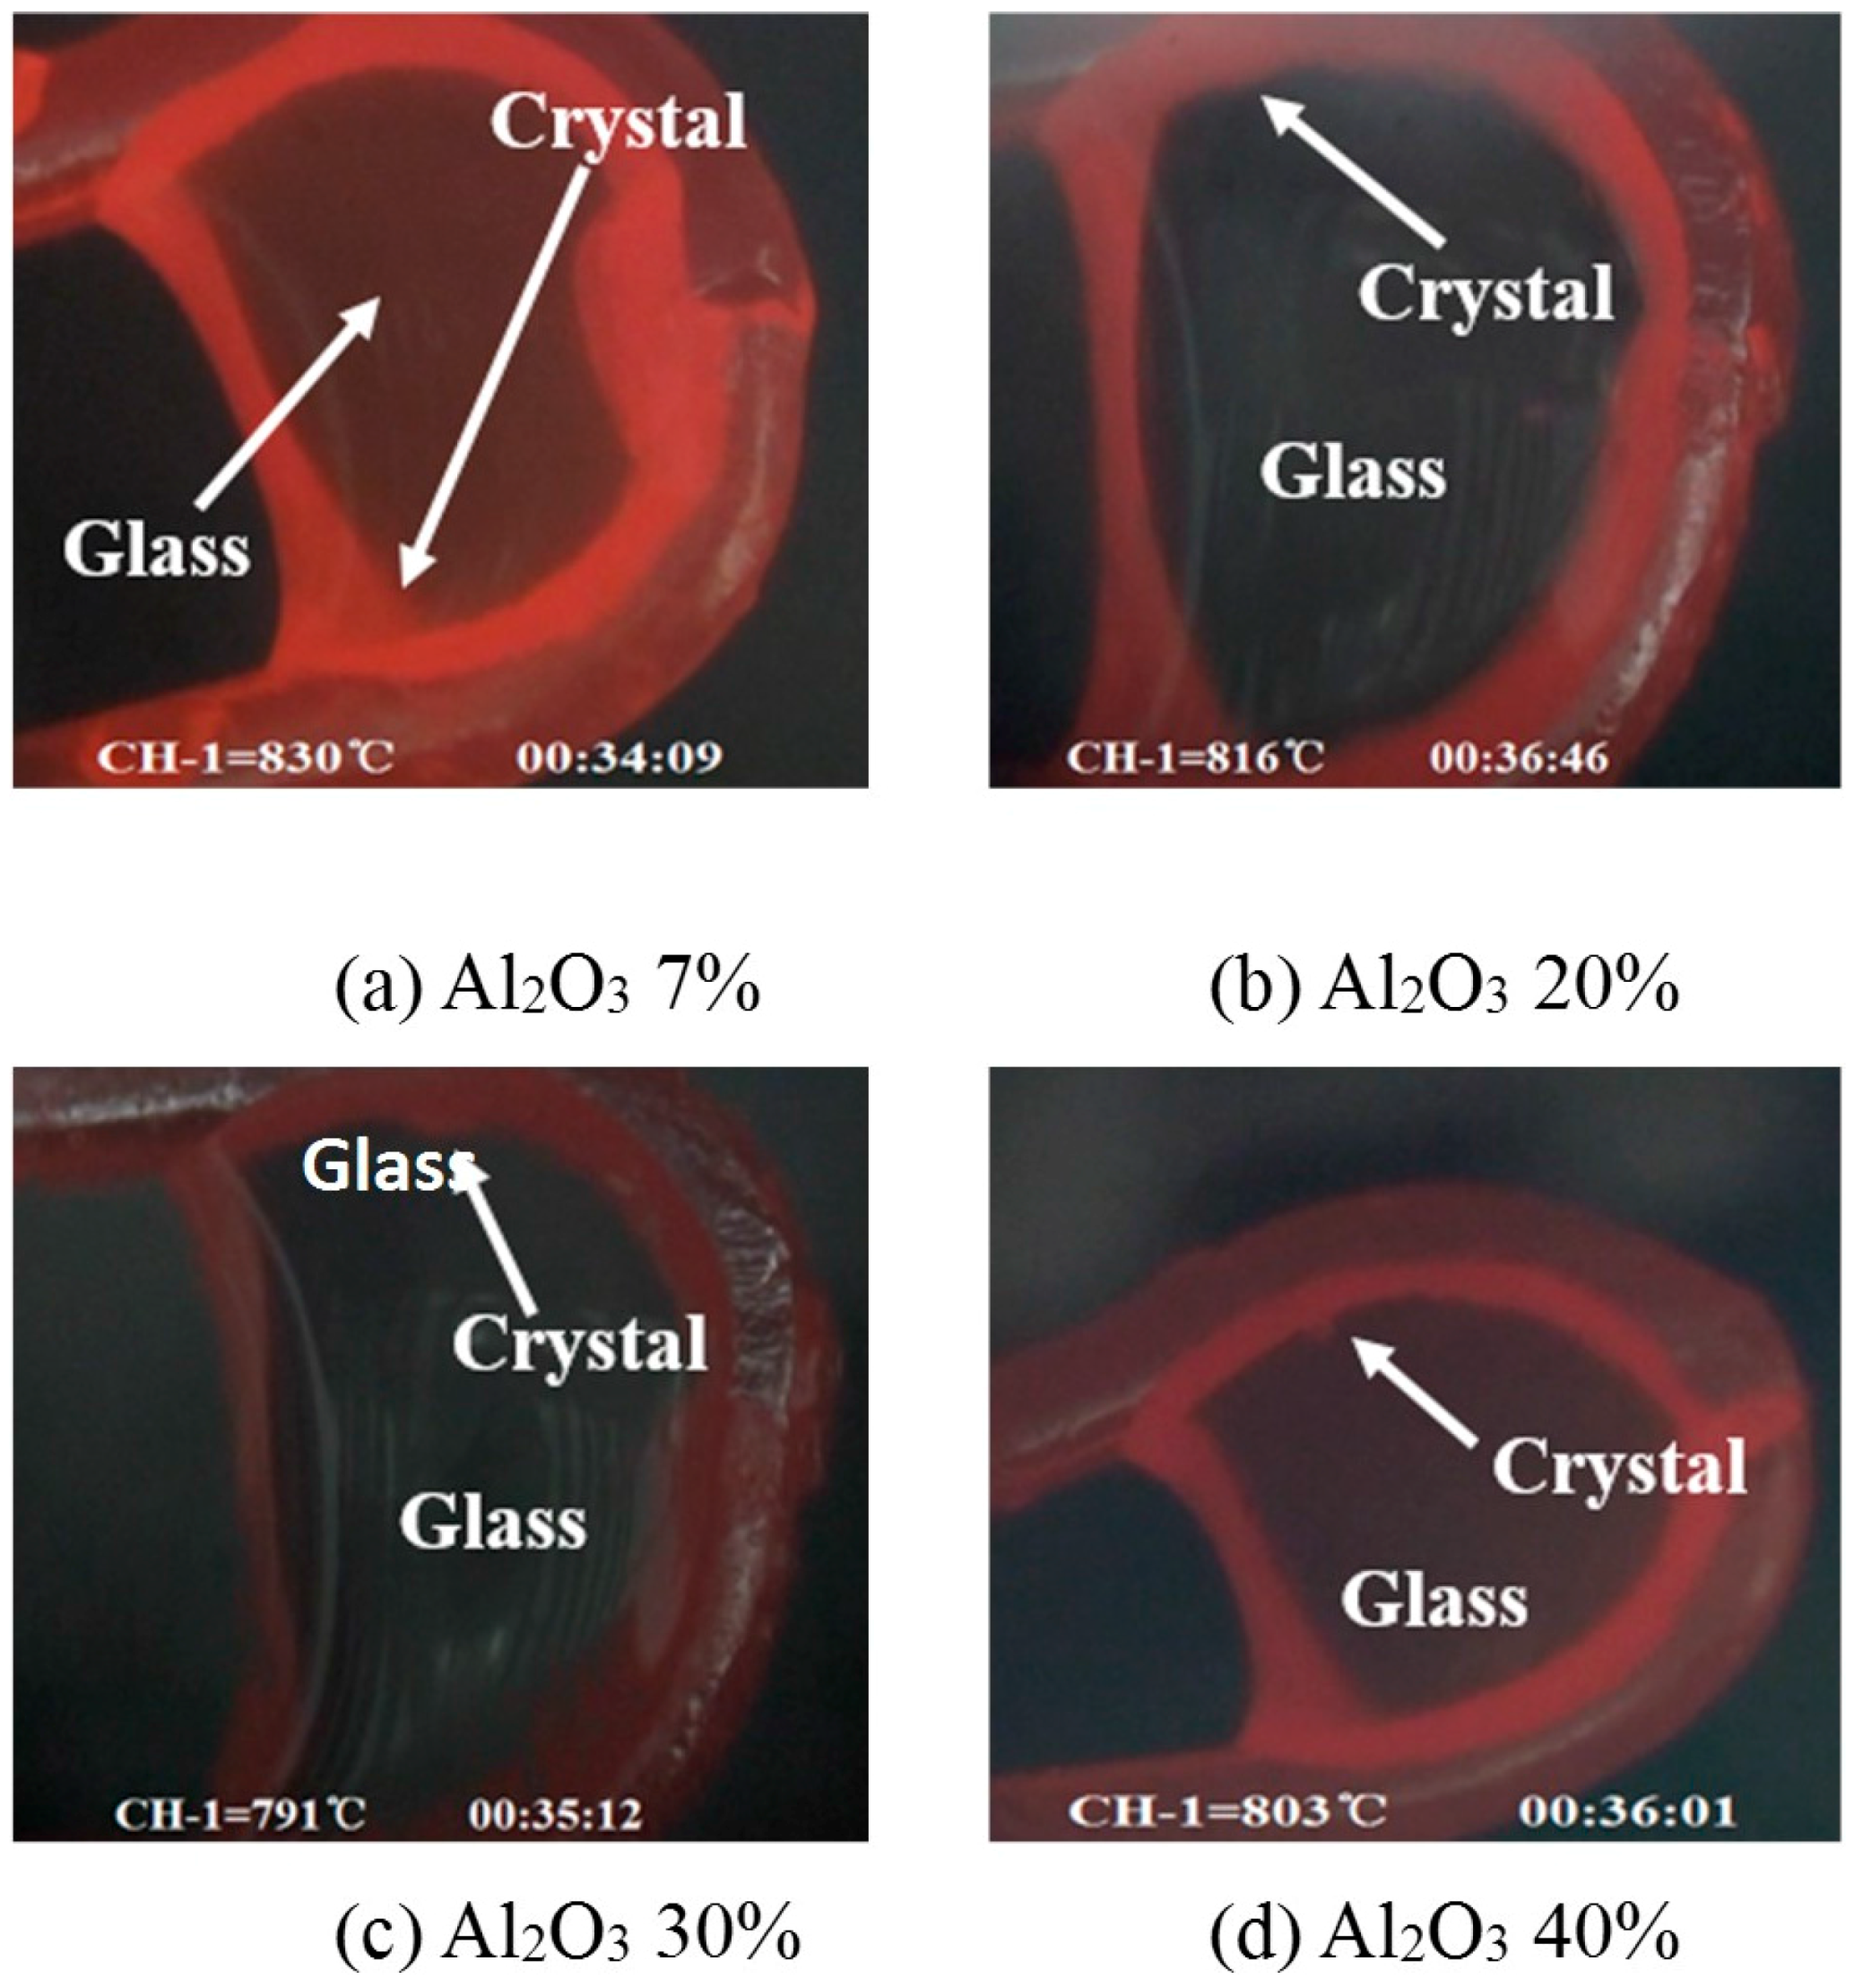
2.3. The Initial Crystallization Temperature Test
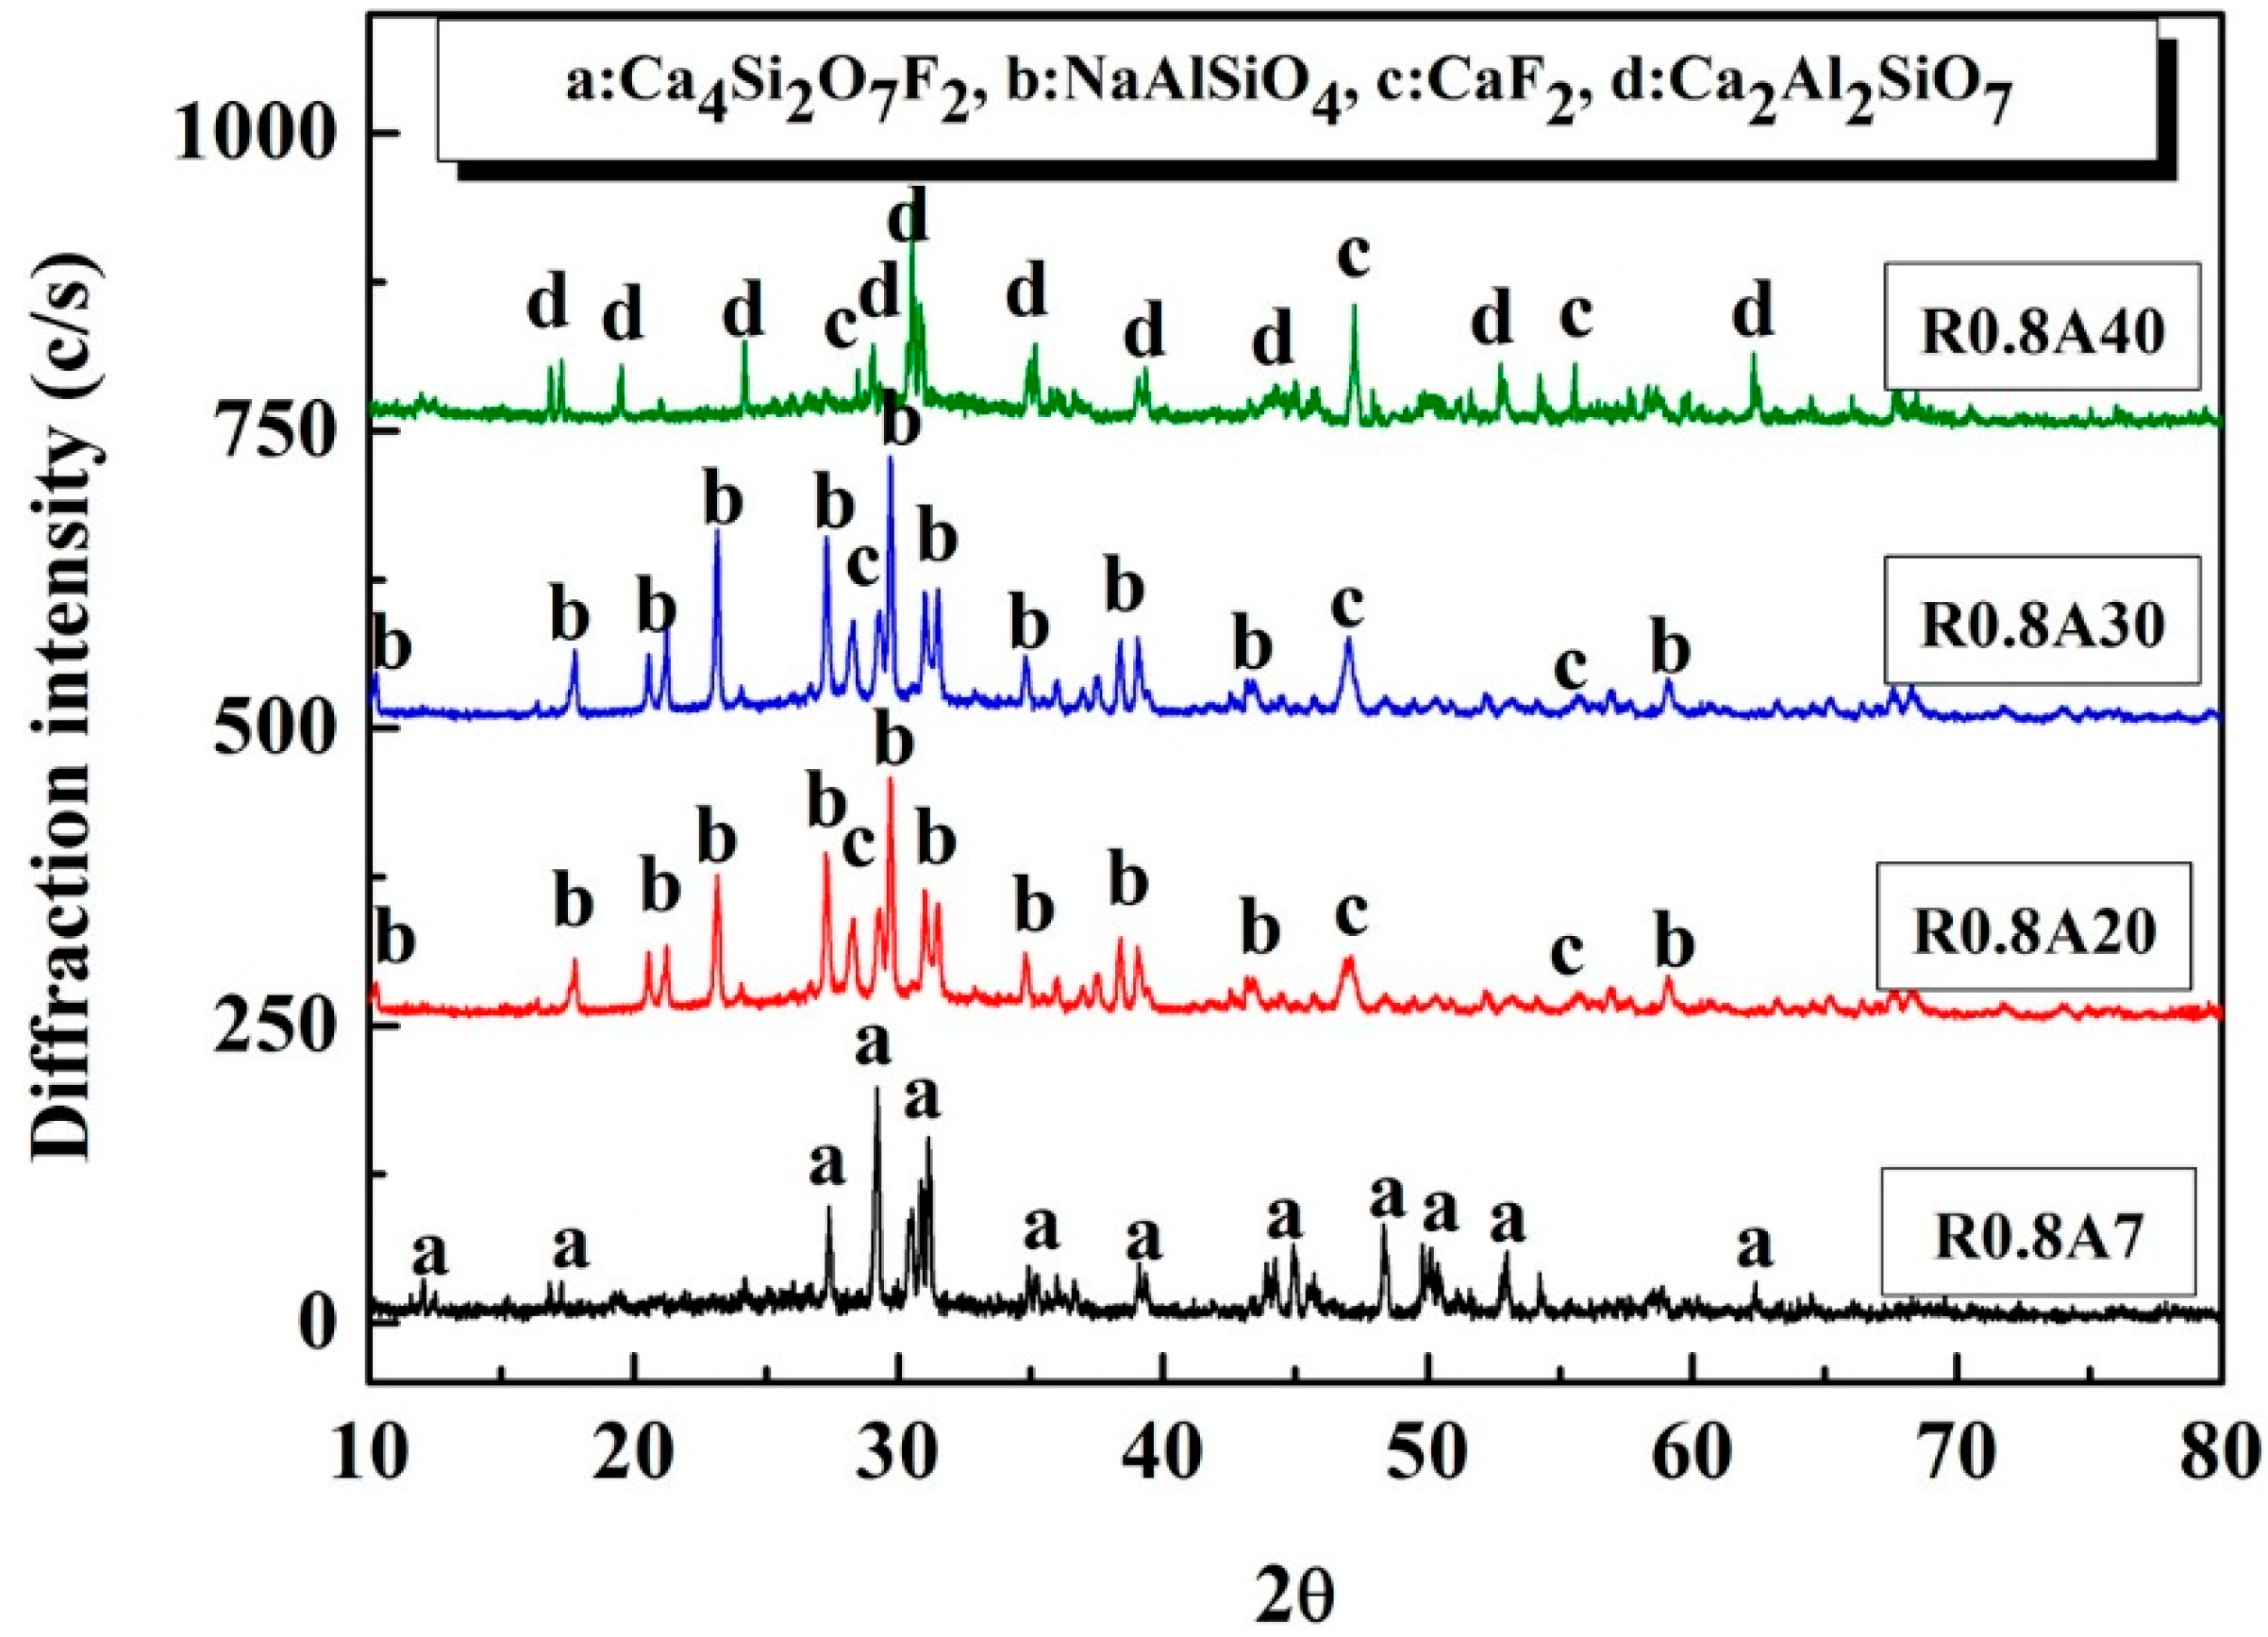
The SHTT was utilized to obtain the initial crystallization temperatures in this study. Details about the SHTT apparatus have been illustrated by Prof. Kashiwaya [17] and our previous paper [18]. Figure 6 shows the schematic of the SHTT experimental apparatus. The precipitation of crystals can be directly observed and recorded by a DVD camera through a high-temperature microscope (DY Optical Instruments Co., Shanghai, China); meanwhile, the corresponding temperature was obtained by the temperature acquisition system. Figure 7 shows the temperature controlling profile for the glassy/crystalline phase transition temperature measurements of mold fluxes with different amounts of Al2O3. The samples were heated up to 1773 K (1500 °C) first, and then quenched to obtain a glassy phase; after that, they were heated up again at a heating rate of 0.5 K·s−1 (0.5 °C·s−1). The initial crystallization temperature was obtained by analyzing the recorded video and the corresponding temperature time span.

2.4. Phase Analysis

Those mold flux disks after heat transfer tests were crushed and ground into powders for phase analysis. The precipitated crystalline phases were analyzed with an X-Ray diffractometer (RIGAKU-TTR III, Rigaku Corporation, Tokyo, Japan) with the Cu–Kα (0.154, 184 nm). XRD data ranged from 2θ = 10° to 2θ = 80°, with a scanning speed of 10° min−1.

3. Results and Discussion

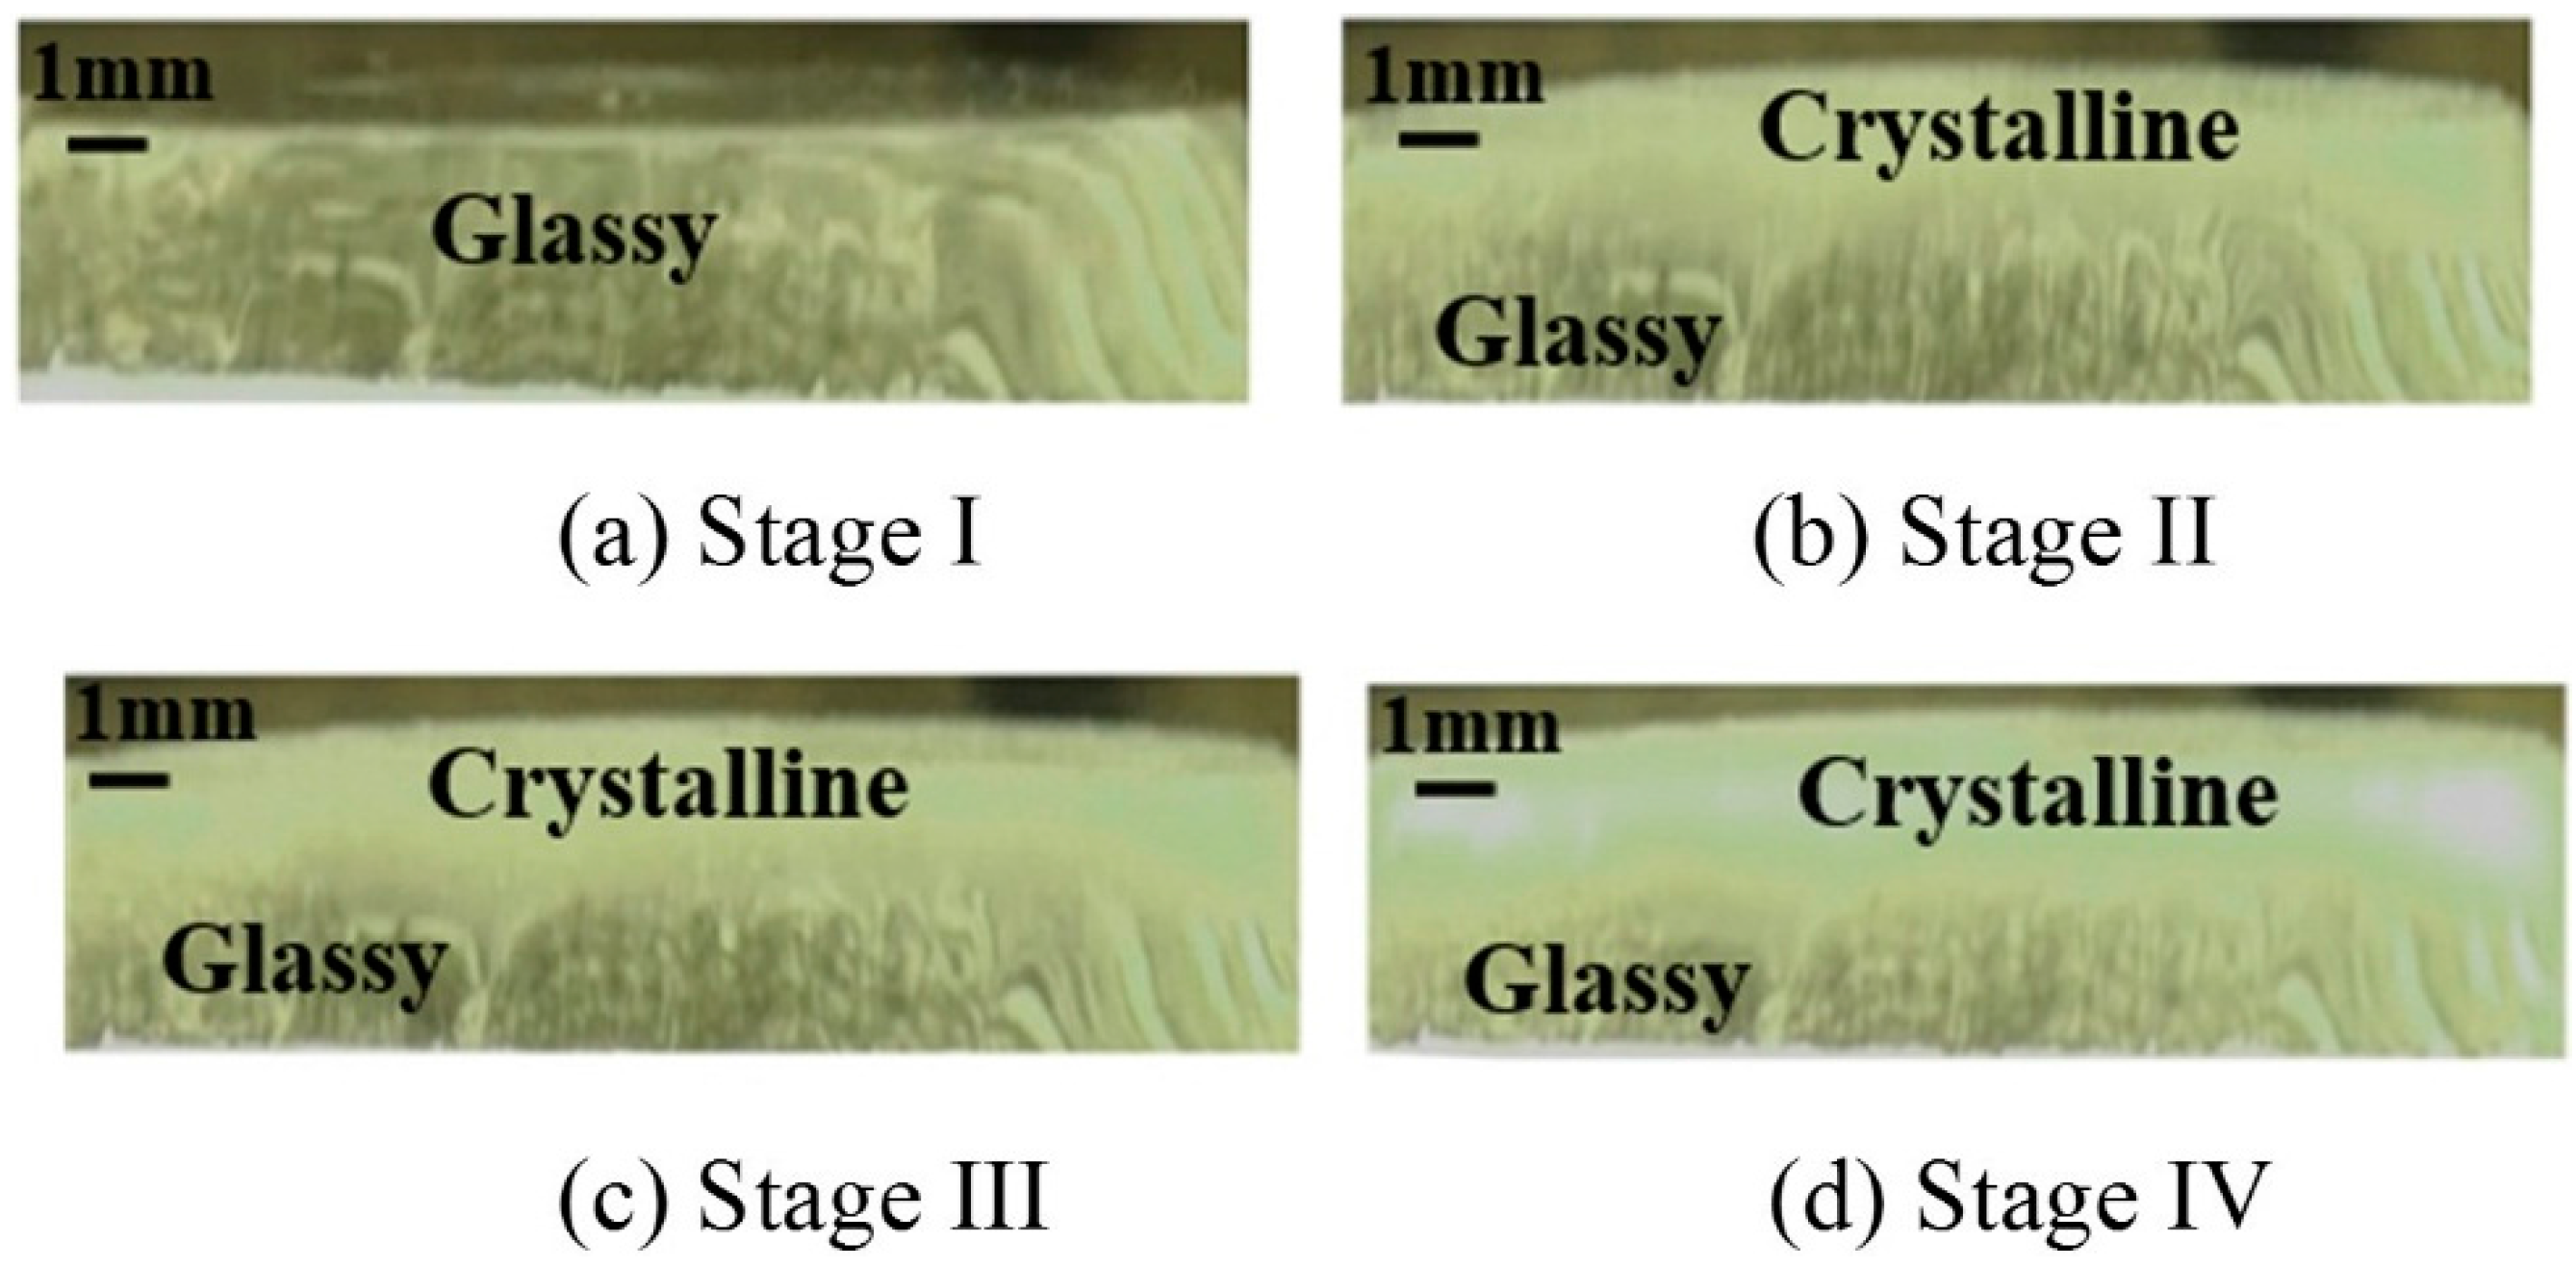
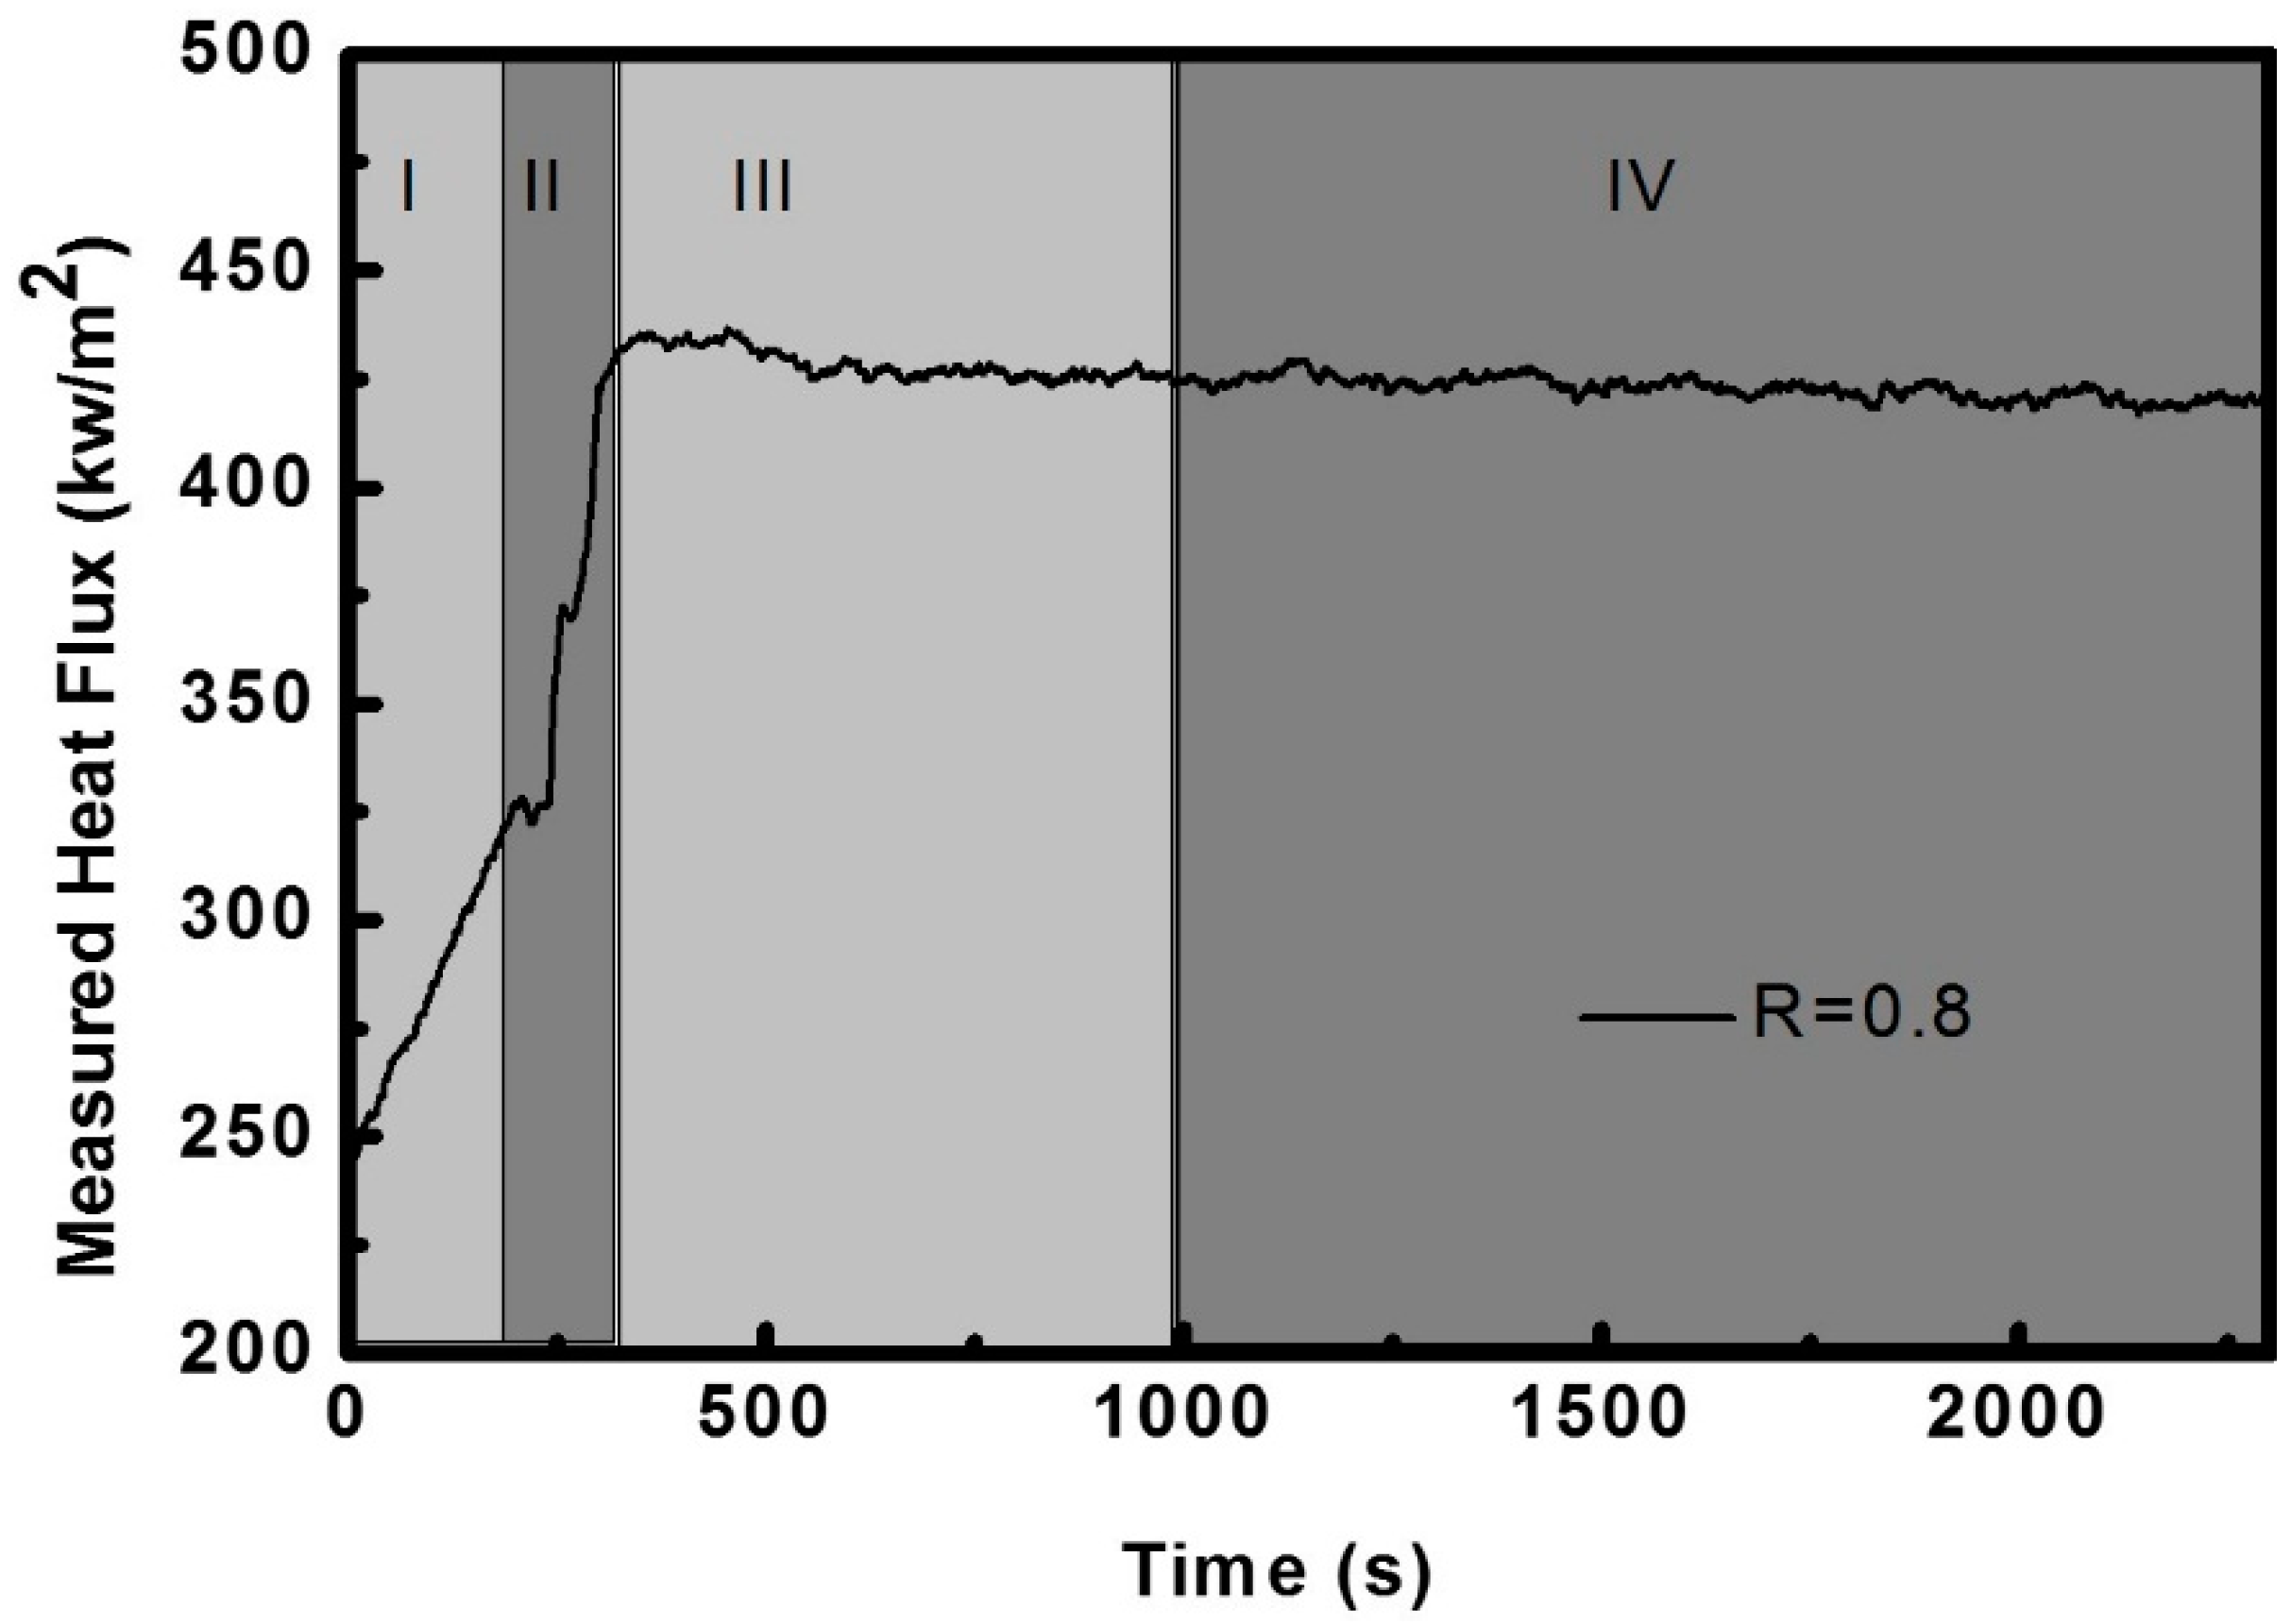
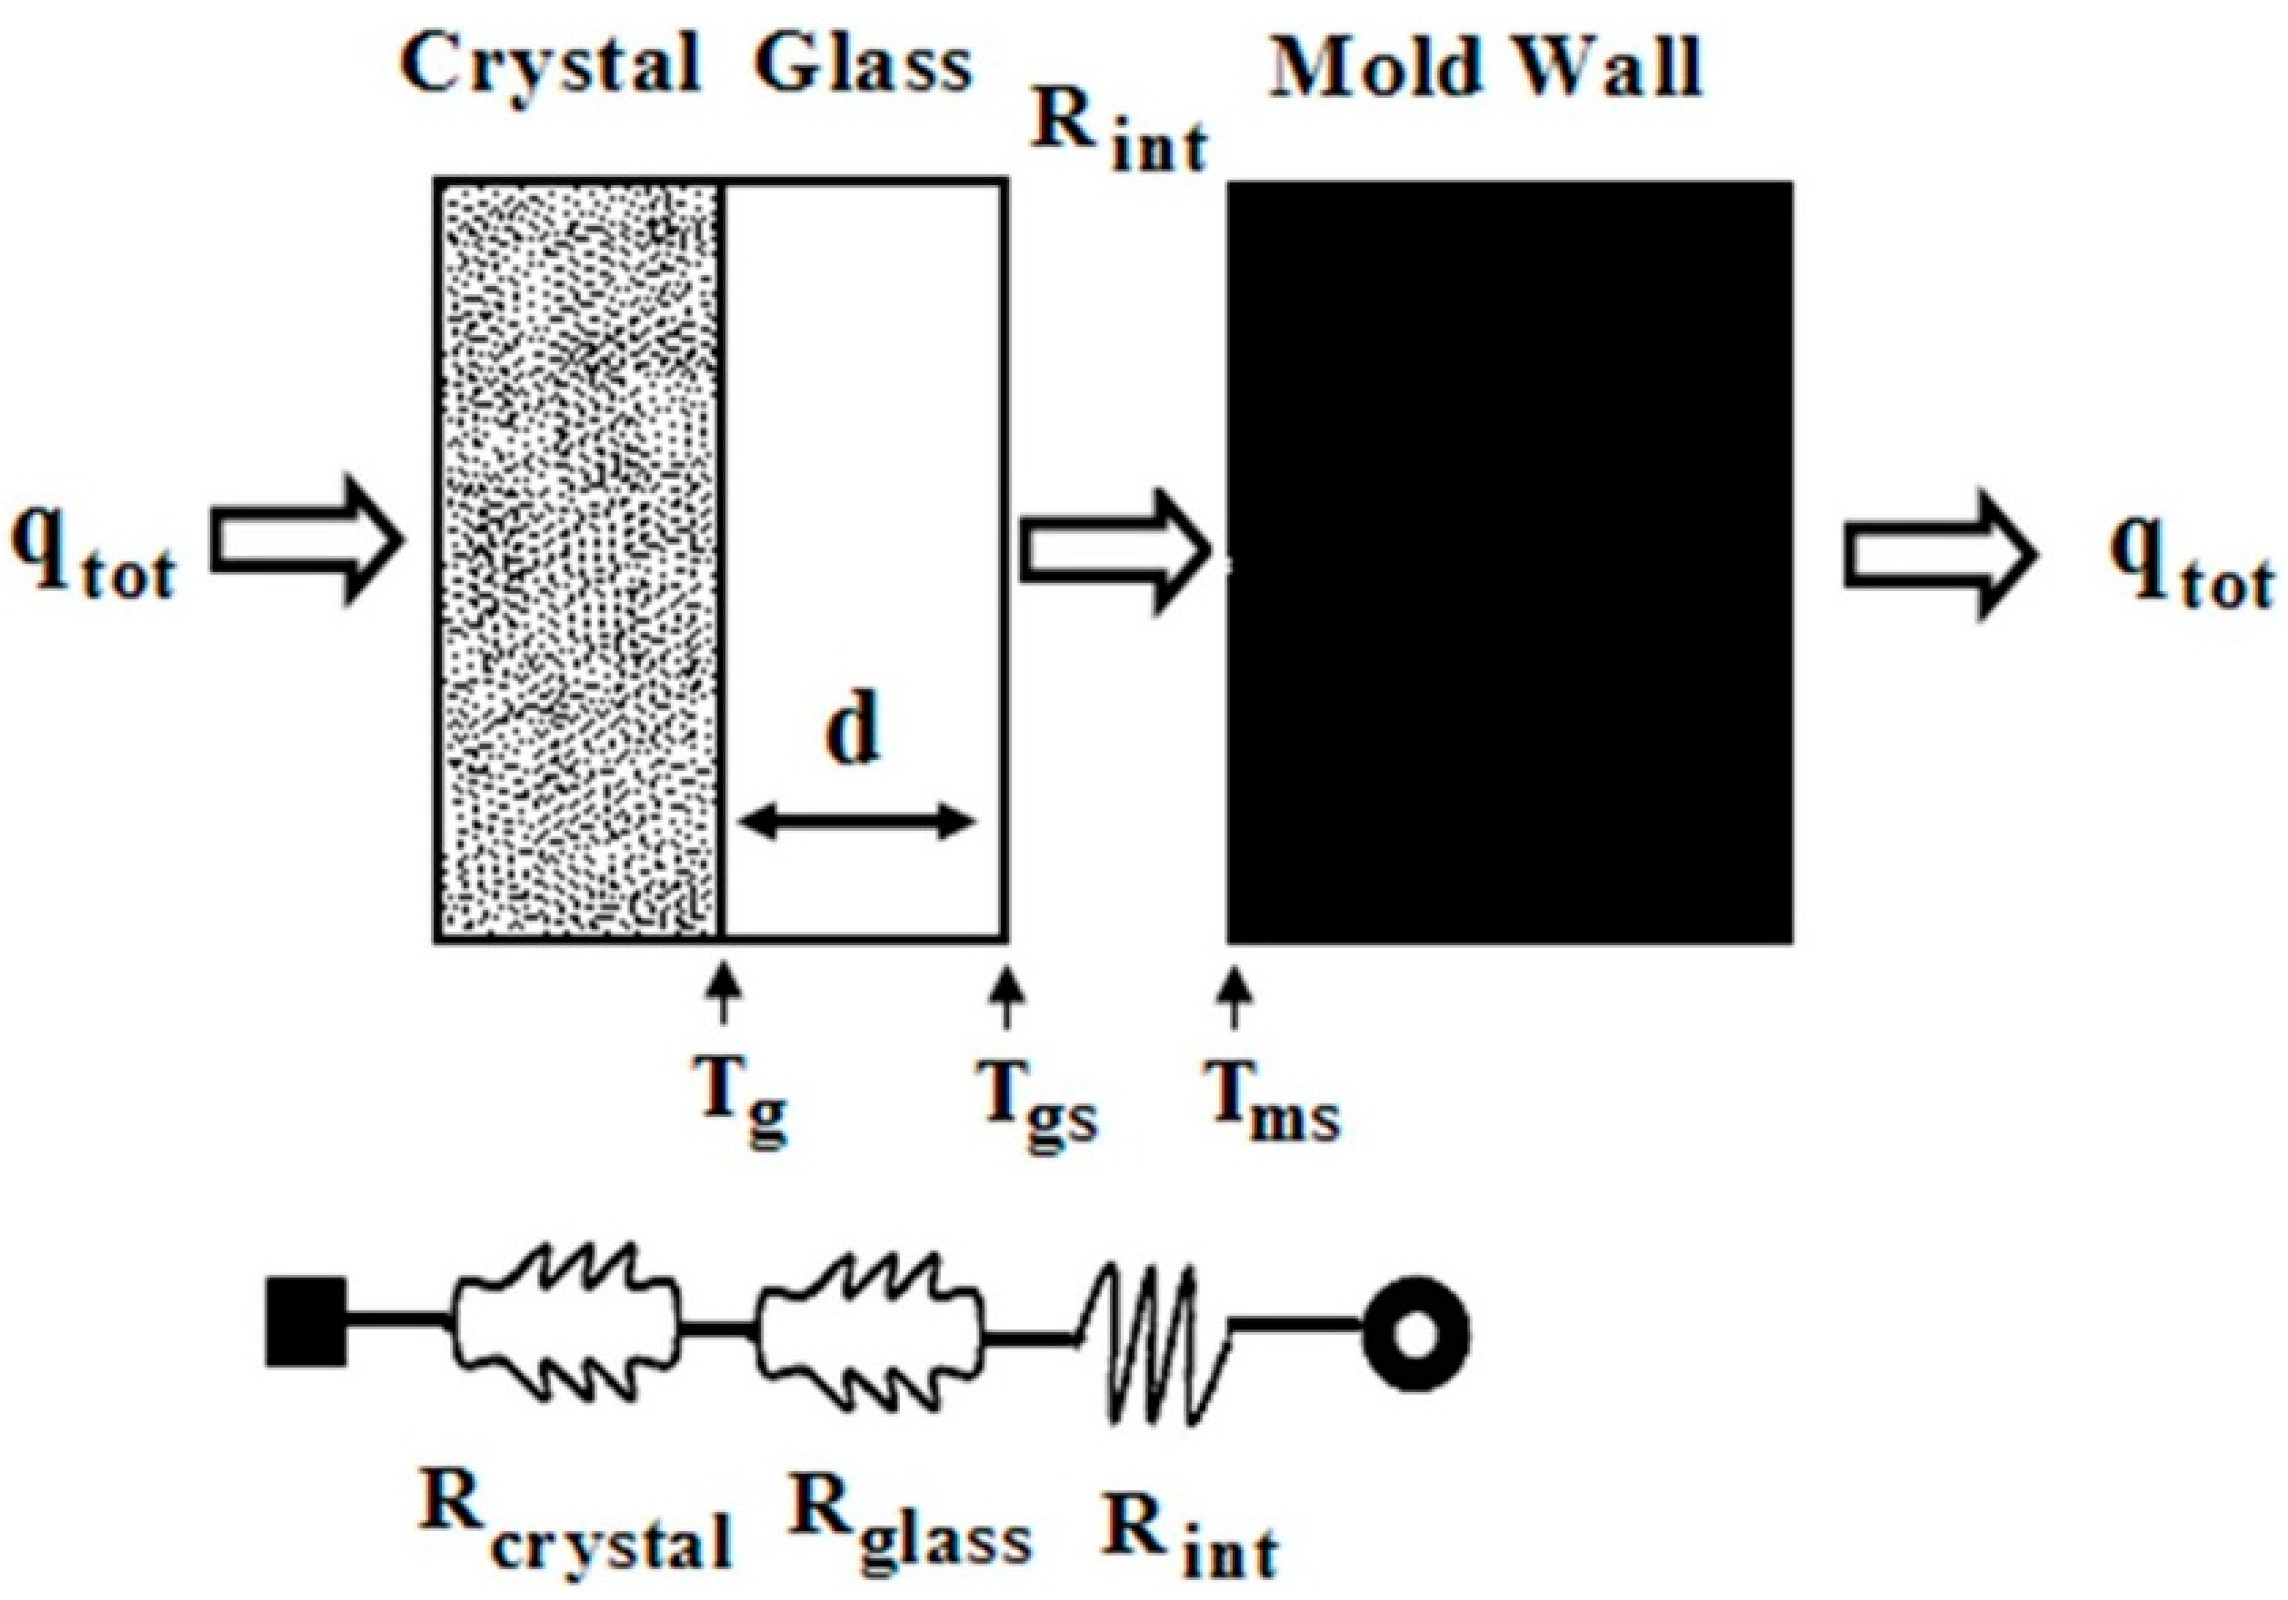
3.1. The Heat Transfer Procedure

The prepared mold slag disks were individually placed on the top surface of the copper mold and subjected to the heating profile, as shown in Figure 4, for the heat transfer tests. Taking Sample R0.8A7, for example, there are four typical stages appearing during the heat transfer experiment as shown in Figure 8 and Figure 9. Among them, Figure 8 shows the heat flux time span of Sample R0.8A7 during the heat transfer test; Figure 9 shows the snapshots of the cross-section of those mold flux disks. It can be seen that, in the period of the pre-heating Stage I, the heat flux linearly increased with the increase in thermal energy, and the disk was remained as glassy without phase transition, as shown in Figure 9a. After that, the heat flux kept increasing, and the deviation occurred in the heat flux curve due to the initiation of mold flux crystallization, where the opaque crystals formed on the top of the mold slag disk, as shown in Figure 9b. At Stage III, the heat flux arrived to its peak value and then slightly decreased again due to the continuous crystallization. Finally, the heat flux remained constant when the crystallization completed and reached a steady state in Stage IV.

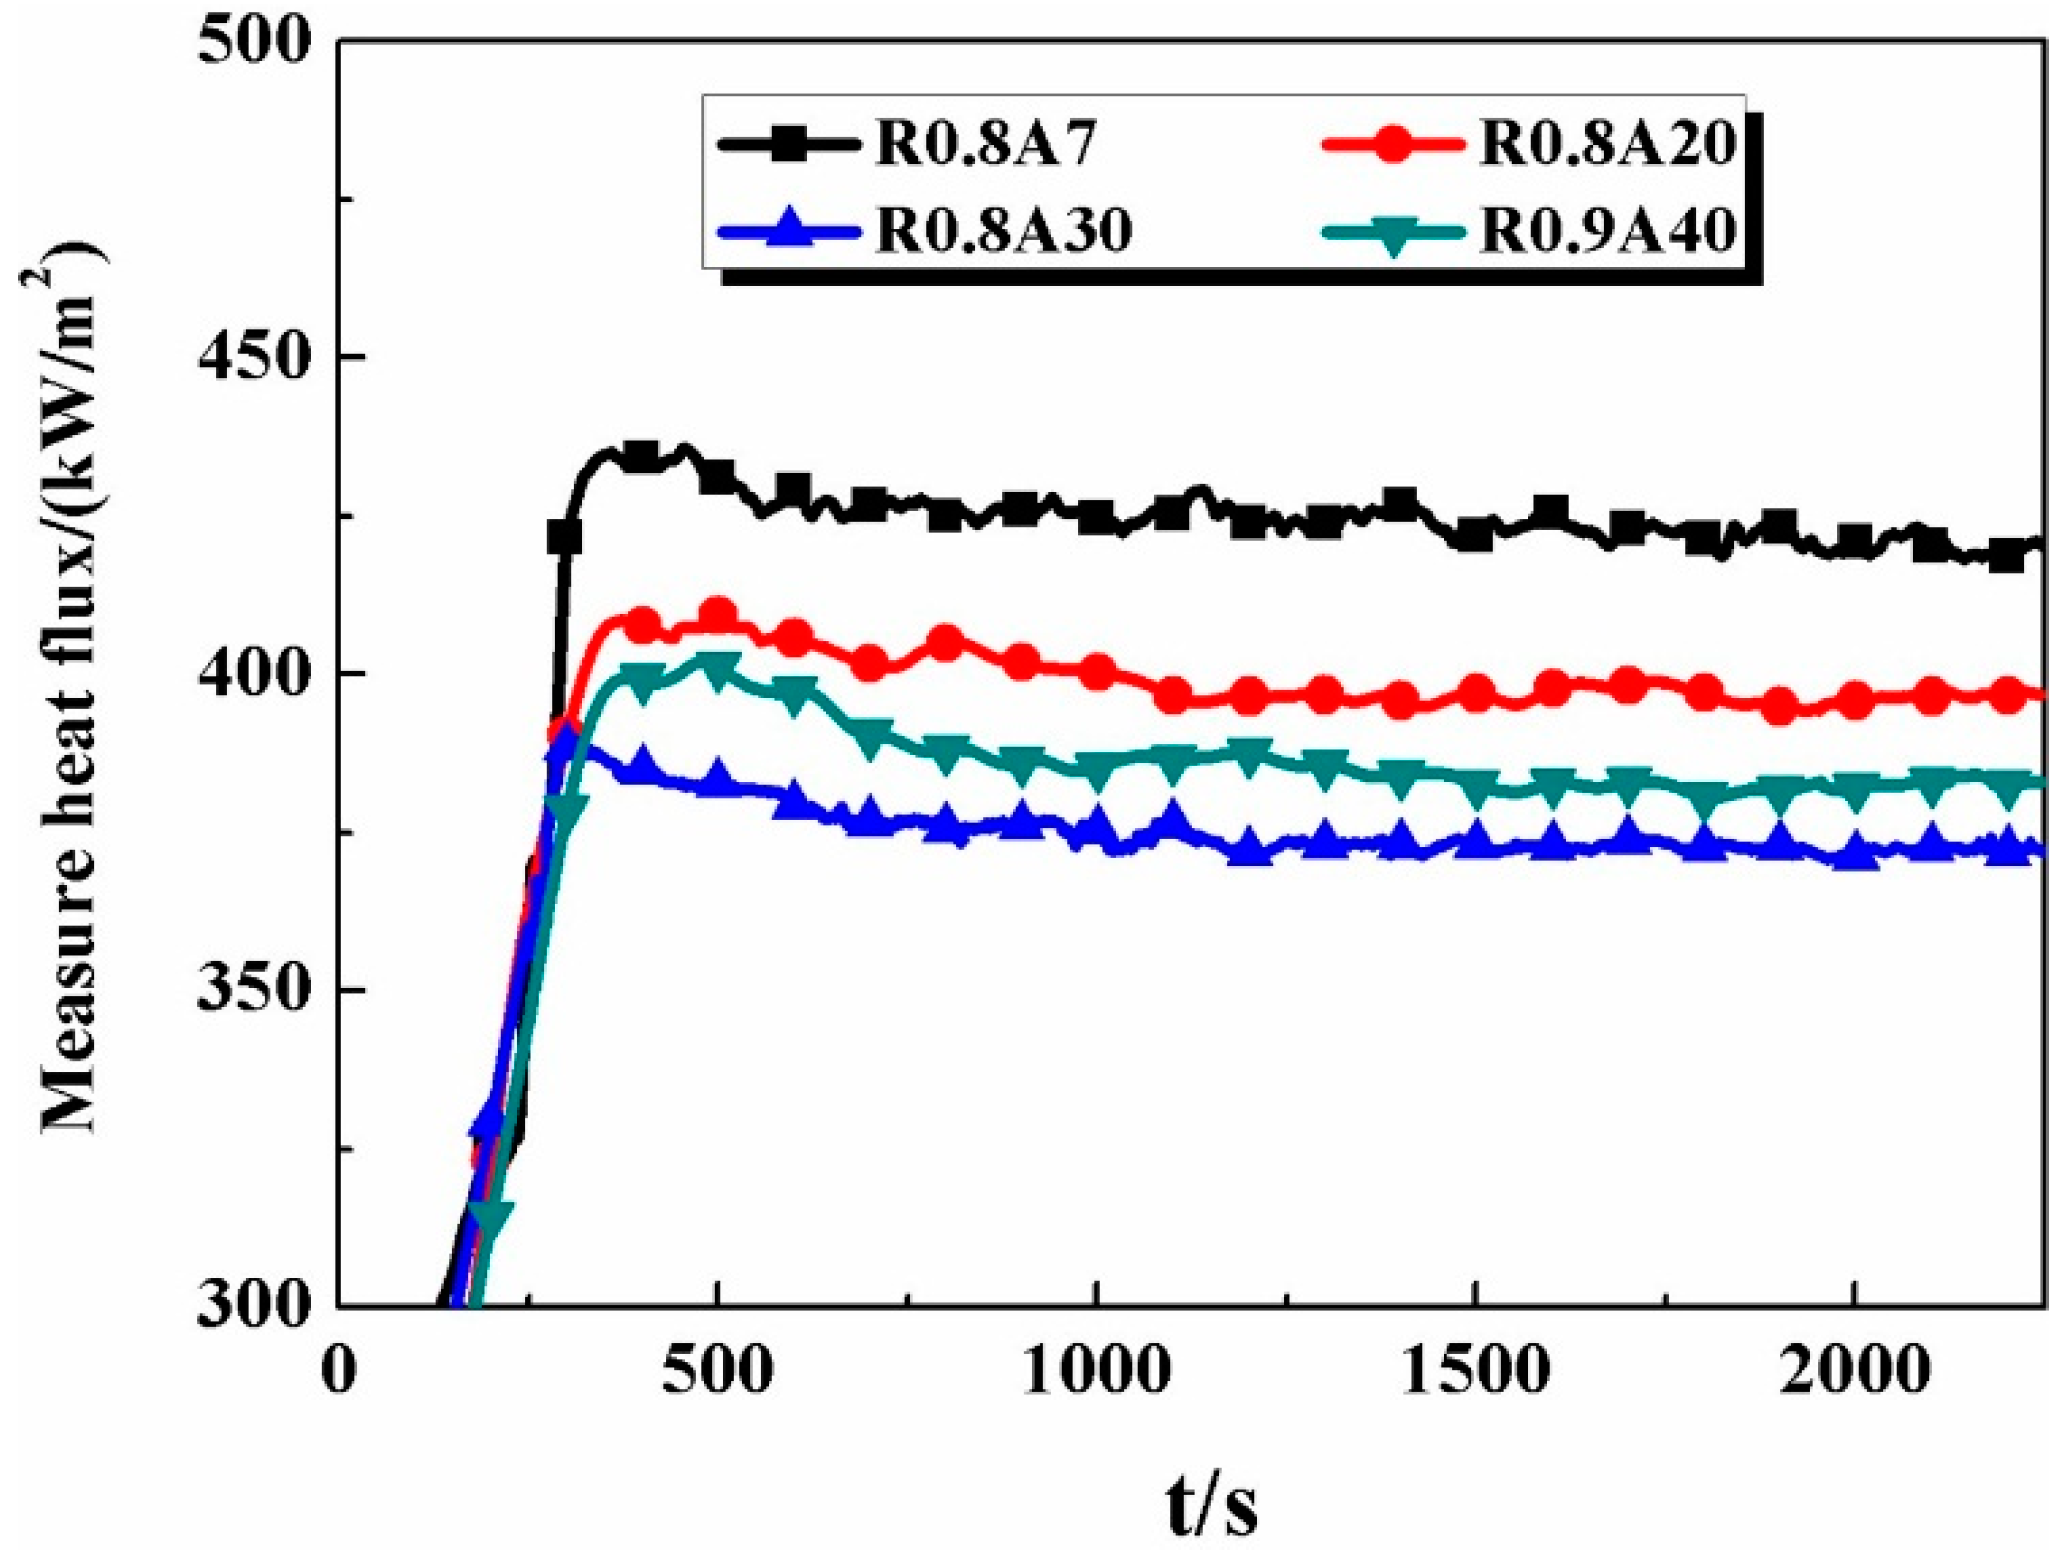
3.2. The Effect of Al2O3 Content on Heat Flux

In order to study the effect of Al2O3 content on the heat transfer performance of the mold flux, the heat flux of the four mold slags with the Al2O3 content ranging from 7% to 40% is combined and shown in Figure 10. It can be found that the final steady-state heat flux of Sample R0.8A7 (Al2O3, 7%) was 423 kW·m−2, whereas it decreased to 419 kW·m−2 (Sample R0.8A20) and to 372 kW·m−2 (Sample R0.8A30) when the Al2O3 content increased from 7% to 20% and then to 30%, respectively. However, the final steady-state heat flux increased to 383 kW·m−2 when the Al2O3 content increased to 40%. The reasons for the above results are mainly due to the variation in the mold flux crystallization and the corresponding interface thermal resistance caused by the change in Al2O3 content, which will be discussed in detail later.
Moreover, the snapshots of the cross-section of the mold flux disks, after the heat transfer tests, were obtained and shown in Figure 11. It can be observed that the opaque crystalline layer occurred on the top part of disks; however, on the bottom part of those disks, there was still a glassy layer. This is due to the temperature gradient that formed from the top to the bottom of the disks. The top part of the disk was close to the radiant heater, so it was heated to a higher temperature and became crystallized; meanwhile, the bottom part was close to the water-cooled cooper mold, so it remains in a glassy phase, as in a real continuous casting mold [19].
Although all the disks shown in Figure 11 are comprised of two layers—the crystalline and glassy layers—the specific thickness of each layer in the disk is different. Therefore, for a better comparison, the crystalline fraction and thickness of the crystalline layer of the mold flux disks with varying amounts of Al2O3 are shown in Figure 12. The crystalline layer thicknesses are 2.30 mm, 2.51 mm, 2.96 mm, and 2.68 mm for Samples R0.8A7, R0.8A20, R0.8A30, and R0.8A40, respectively, which corresponds to a 69.8%, 76%, 90%, and 81% crystalline fraction for those respective disks. Those values suggest that both crystalline layer thickness and crystalline fraction increased first, then decreased with the further addition of A2O3. In other words, the A2O3 can improve the crystallization ability of the mold flux when the Al2O3 content is less than 30%; however, it begins to inhibit crystallization when the Al2O3 content exceeds 30%. The amphoteric behavior of A2O3 on the crystallization of the mold flux obtained in the heat transfer test here is consistent with our previous study [20].
Thus, it is suggested that the change in Al2O3 content leads to the variation in mold flux crystallization ability, which results in different crystalline layer distribution in the disk and affects the heat flux. More specifically, when the Al2O3 content is less than 30%, the Al2O3 is added into the acidic matrix slag (the basicity is 0.8). Thus, it offers O2− as a basic oxide. Then, the silicate structure is simplified by the addition of non-bridging oxygen, which makes the molten mold slag easier to become crystallized. Once the mold flux crystallizes, more incident thermal energy is scattered/reflected from the grain boundary, crystals surface, and defects, which leads to less thermal energy being transferred to the mold. Therefore, the final steady-state heat flux in the heat transfer tests decreases. On the contrary, in this case, the matrix itself turned into a basic slag when the Al2O3 content further increased from 30% to 40%. Therefore, the additional Al2O3 worked as acidic oxide, which made the silicate network of molten slag become an alumino-silicate structure, which is more complex and does not promote crystallization. Thus, less mold fluxes become crystallized, more incident radiation can be absorbed and transferred to the mold, and the final steady-state heat flux hence increases.
The XRD results of the mold fluxes with different amounts of Al2O3 after the heat transfer tests are shown in Figure 13. The main precipitated crystal in Sample R0.8A7 was cuspidine (Ca4Si2O7F2), which is quite common in mold fluxes. When the Al2O3 content increased to 20%, NaAlSiO4 (nepheline) and CaF2 appeared. When the Al2O3 content reached 30%, the compositions of the crystals were similar to the mold flux with 20% Al2O3 content; however, the content of CaF2 increased, as the intensity of the characteristic peaks of CaF2 of Sample R0.8A30 was higher than Sample R0.8A20, which suggests that the Al2O3 can enhance the precipitation of CaF2 crystals. Finally, the Ca2Al2SiO7 (gehlenite) precipitated when the content of Al2O3 continuously increased to 40%, as shown in Figure 13. According to Taylor’s observation [21,22], the thermal conductivity of the following several crystalline phases was given in the following order: CaSiO3 > Ca2Al2SiO7 > Ca4Si2O7F2 > NaAlSiO4, which means that the heat flux of Sample R0.8A40 should be higher than both Sample R0.8A7 and Sample R0.8A20, as the precipitation crystals in Samples R0.8A40, R0.8A7, and R0.8A20 were Ca2Al2SiO7, Ca4Si2O7F2, and NaAlSiO4, respectively; however, the experimental result was different. Therefore, it was the mold flux crystallization that dominated the heat transfer process inside the mold flux instead of the specific precipitated crystal phase, as the crystal fraction of Sample R0.8A40 was larger than that of Samples R0.8A7 and R0.8A20, which let less incident energy be transferred to the water-cooled copper mold.

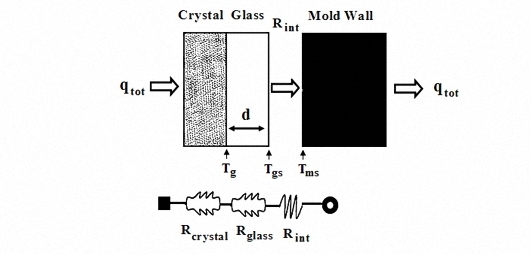
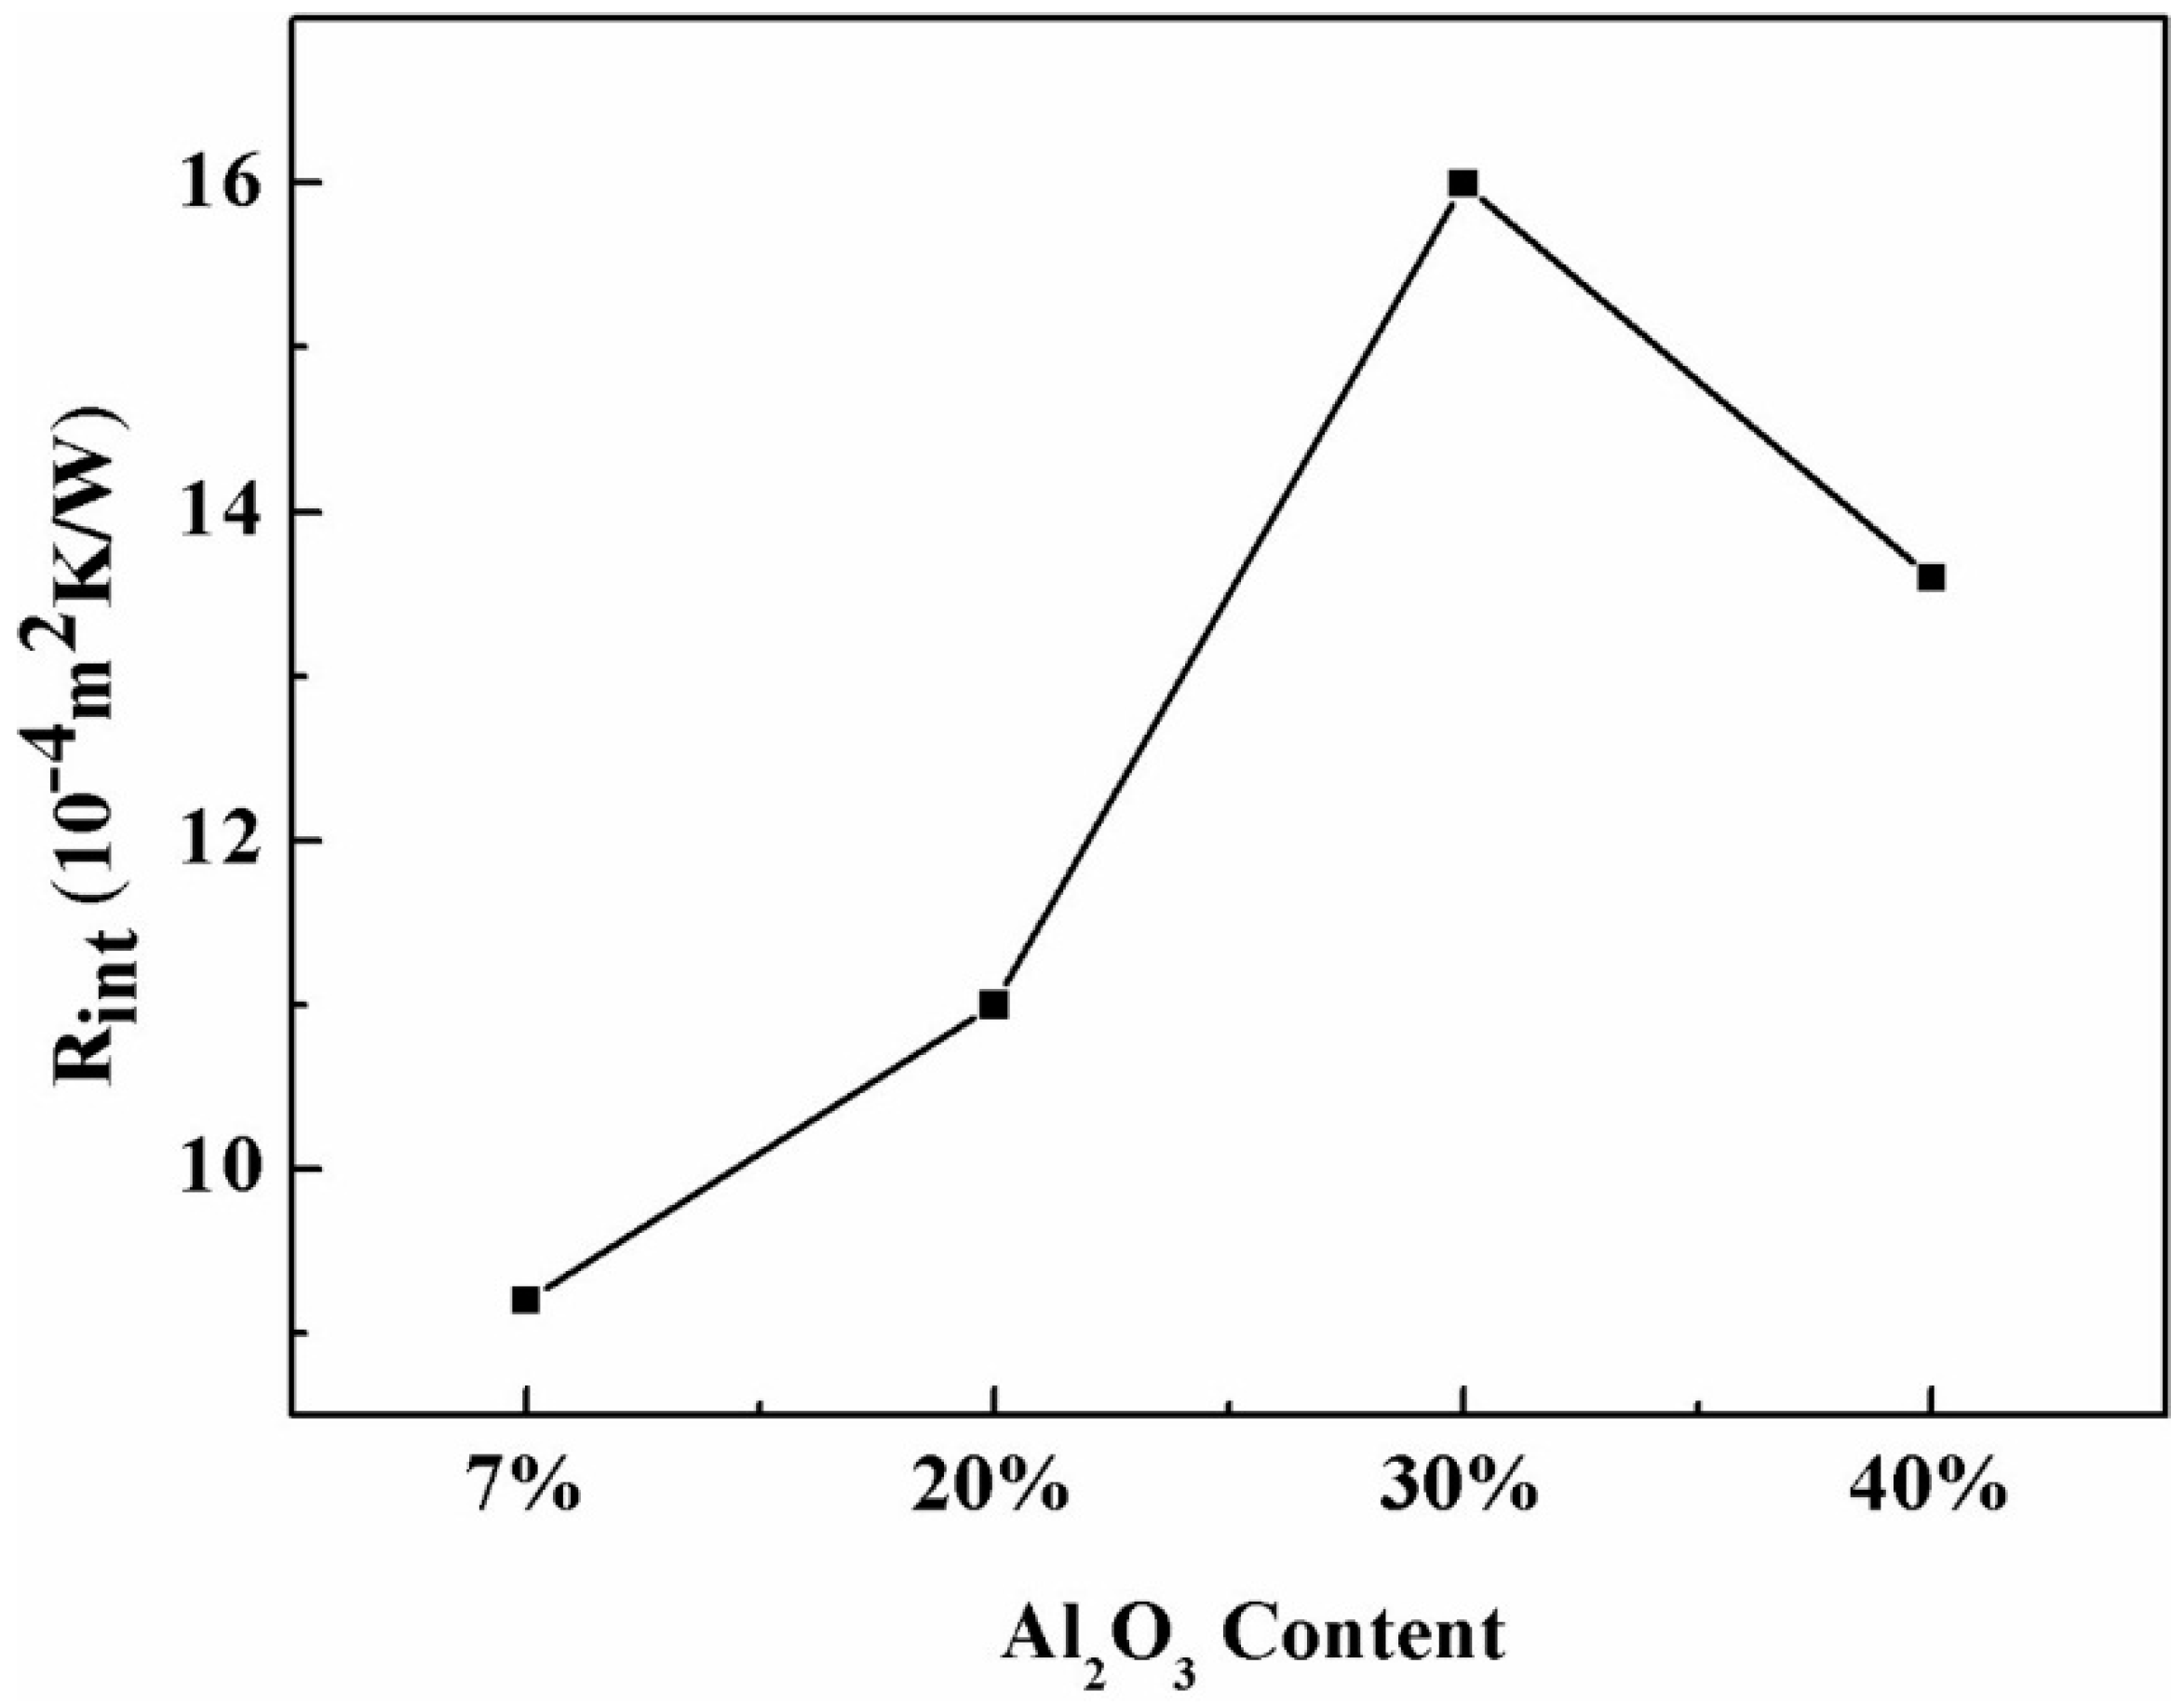
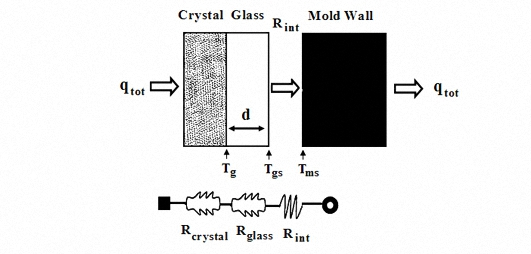
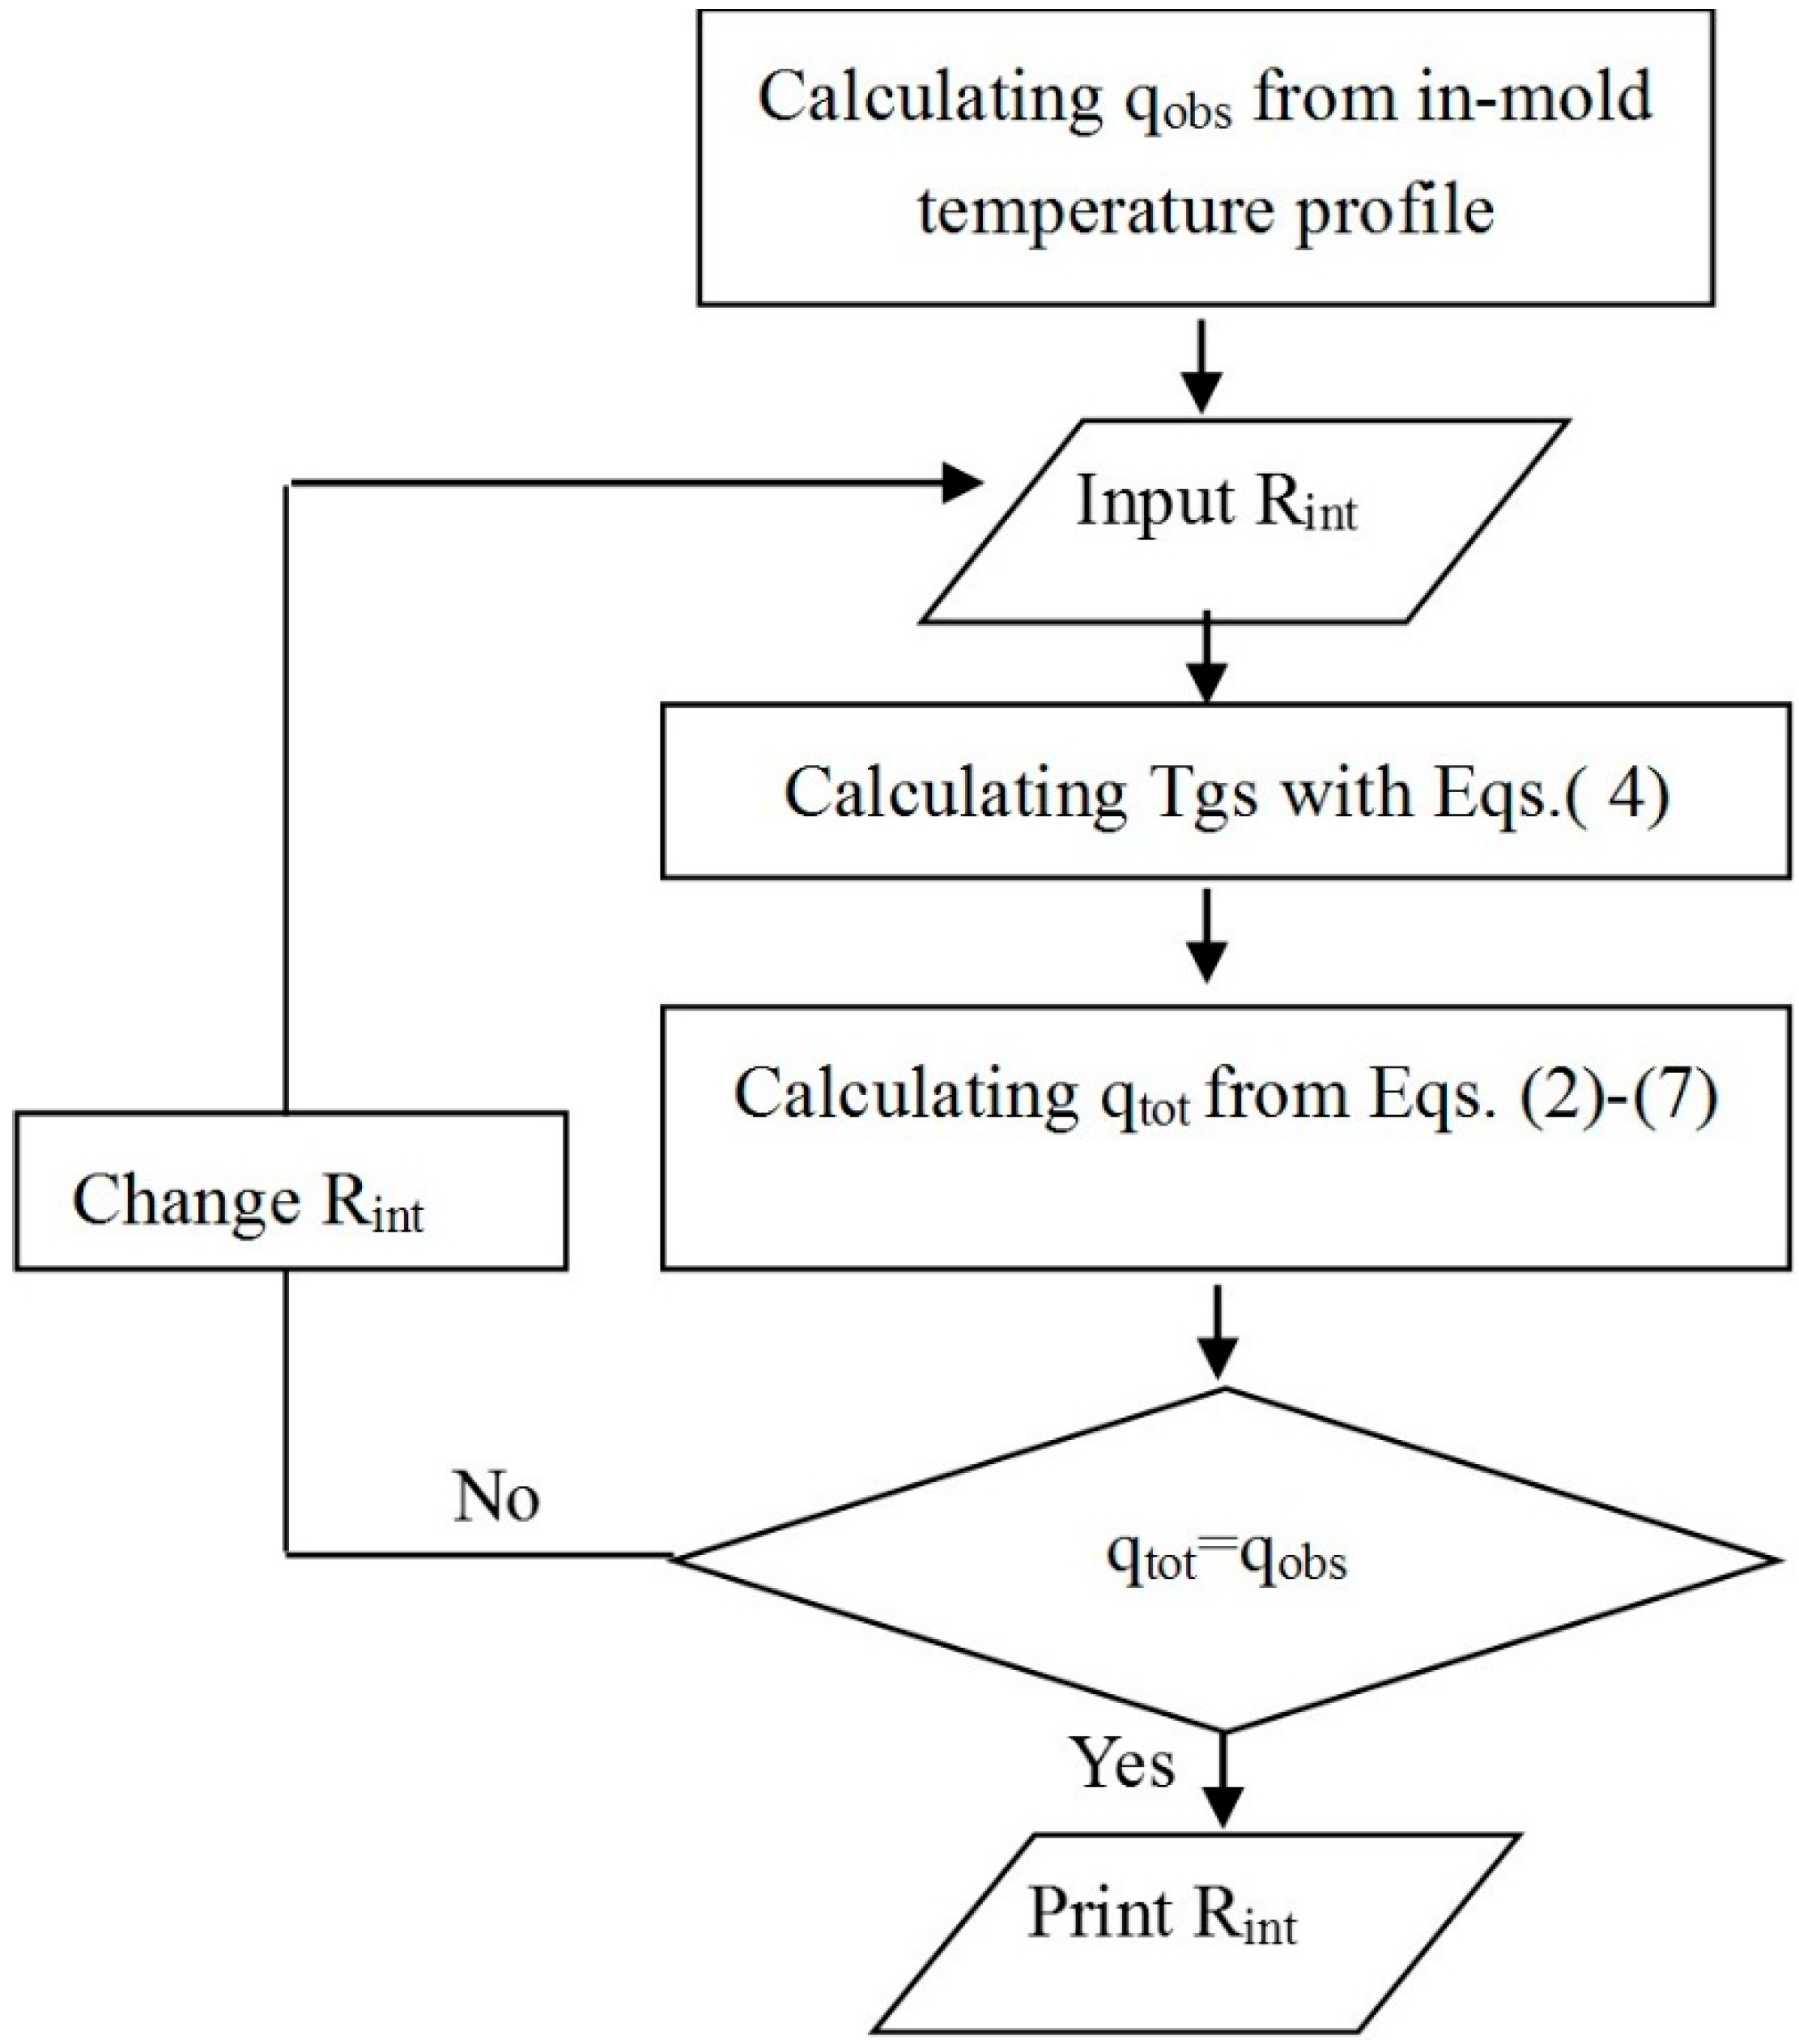
3.3. The Effect of Al2O3 Content on Interface Thermal Resistance

Except for the heat transfer performance of the mold flux, the interfacial thermal resistance between the mold wall and mold slag film is another very important factor that affects the heat flux, from solidified shell to mold. In order to investigate the impact of Al2O3 content on the interface thermal resistance of the mold wall/mold flux, a numerical calculation was conducted by assuming that (1) only a one-dimensional heat transfer occurred from the mold flux to the water-cooled copper mold and (2) the total heat flux across the mold flux consisted of conductive and radiative heat flux. The heat flux travels from the mold flux film to the mold wall and is schematically shown in Figure 14.
Therefore, the total heat flux qtot across the mold flux disk, at the steady state, can be expressed as Equation (2):
qtot = qrad + qcond
According to the Fourier’s law, the conductive heat flux at steady state could be expressed as Equation (3):
q cond = K cond T g T gs d
where Kcond is the thermal conductivity of the glassy mold flux, its values employed as 1.0 to 1.2 Wm−1·k−1 as in previous study [23], Tgs is the bottom face temperature of the mold flux disk, d is the thickness of the glassy layer, and Tg is the temperature at the interface between the crystalline layer and the glassy layer, which was obtained as the temperature of the mold flux initial crystallization (glass/crystal transformation). Values were obtained by using SHTT tests as shown in Figure 15 and Table 2.
Thus, the Tgs can be calculated with Equation (4):
Tgs = Tgs + Rint × qobs
where Rint is interface resistance, Tms stands for the temperature of copper mold top face calculated by the in-mold temperature gradient, and qobs is the measured steady-state heat flux.
For the transferred radiative heat flux from the mold slag into the copper mold, Fourier’s equation is used for convenience. Therefore, the radiative heat flux can be calculated as Equation (5):
q rad = K rad T g T gs d
Additionally, the radiative thermal conductivity Krad of the glassy mold slag can be obtained by Equations (6) and (7) through assuming the mold flux behaves like gray gas:
K rad = β ( T g 4 T gs 4 ) d T g T gs
β = n 2 σ 0.75 α d + ε 1 1 + ε 2 1 1
where σ is the Stefan–Boltzmann constant assumed to be 5.67 × 10⁻⁸ W·m−2·K−4, n represents the refractive index, which is 1.6, ε is the emissivity—its value is 0.92 for the glassy mold slag, while it is 0.4 for the copper mold [24]—and α is the absorption coefficient of the glassy mold flux, which is 400 m−1 [25].
Hence, the interface thermal resistance Rint can be computed with the above equations according to the flow chart in Figure 16 and parameters listed in Table 2.
The mold fluxes interface thermal resistances, Rint, with different amounts of Al2O3 are shown in Figure 17. It can be seen that the values of Rint ranged from 9.2 × 10⁻⁴ to 16.0 × 10⁻⁴ m2·kW−1, which is close to other researchers’ results [26,27]. Further, the Rint increased from 9.2 × 10⁻⁴ (Sample R0.8A7) to 11.0 × 10⁻⁴ m2·kW−1 (Sample R0.8A20) and then to 16.0 × 10⁻⁴ m2·kW−1 (Sample R0.8A30) when the addition of Al2O3 content increased from 7% to 20% and then to 30%, respectively; however, it decreased to 13.6 × 10⁻⁴ m2·kW−1 (Sample R0.8A40) when the Al2O3 content reached 40%. This is mainly due to the fact that the interface thermal resistance Rint was formed because of the deformation and shrinkage of the mold flux during the crystallization process that occurs in the heat transfer tests. Therefore, the variation tendency of the interface thermal resistance with the addition of Al2O3 content as shown in Figure 17 is proportional to the crystalline fraction of mold fluxes as shown in Figure 12 in Section 3.2. The crystalline fraction increase/decrease leads to more/less slag disk deformation and shrinkage; thus, the interface thermal resistance of mold fluxes tends to increase/decrease with the variation of Al2O3 content.

4. Conclusions

The heat transfer behavior of the mold fluxes with Al2O3 content ranging from 7% to 40% was studied through the IET, and the interfacial thermal resistance was estimated through numerical calculation. Some important results were summarized as following below:
  • The final steady-state heat flux of Sample R0.8A7 (Al2O3, 7%) was 423 kW·m−2, while it decreased to 419 kW·m−2 (Sample R0.8A20) and then to 372 kW·m−2 (Sample R0.8A30) when the Al2O3 content increased from 7% to 20% and then to 30%, respectively; however, it increased to 383 kW·m−2 as the Al2O3 content was continuously increased to 40%.
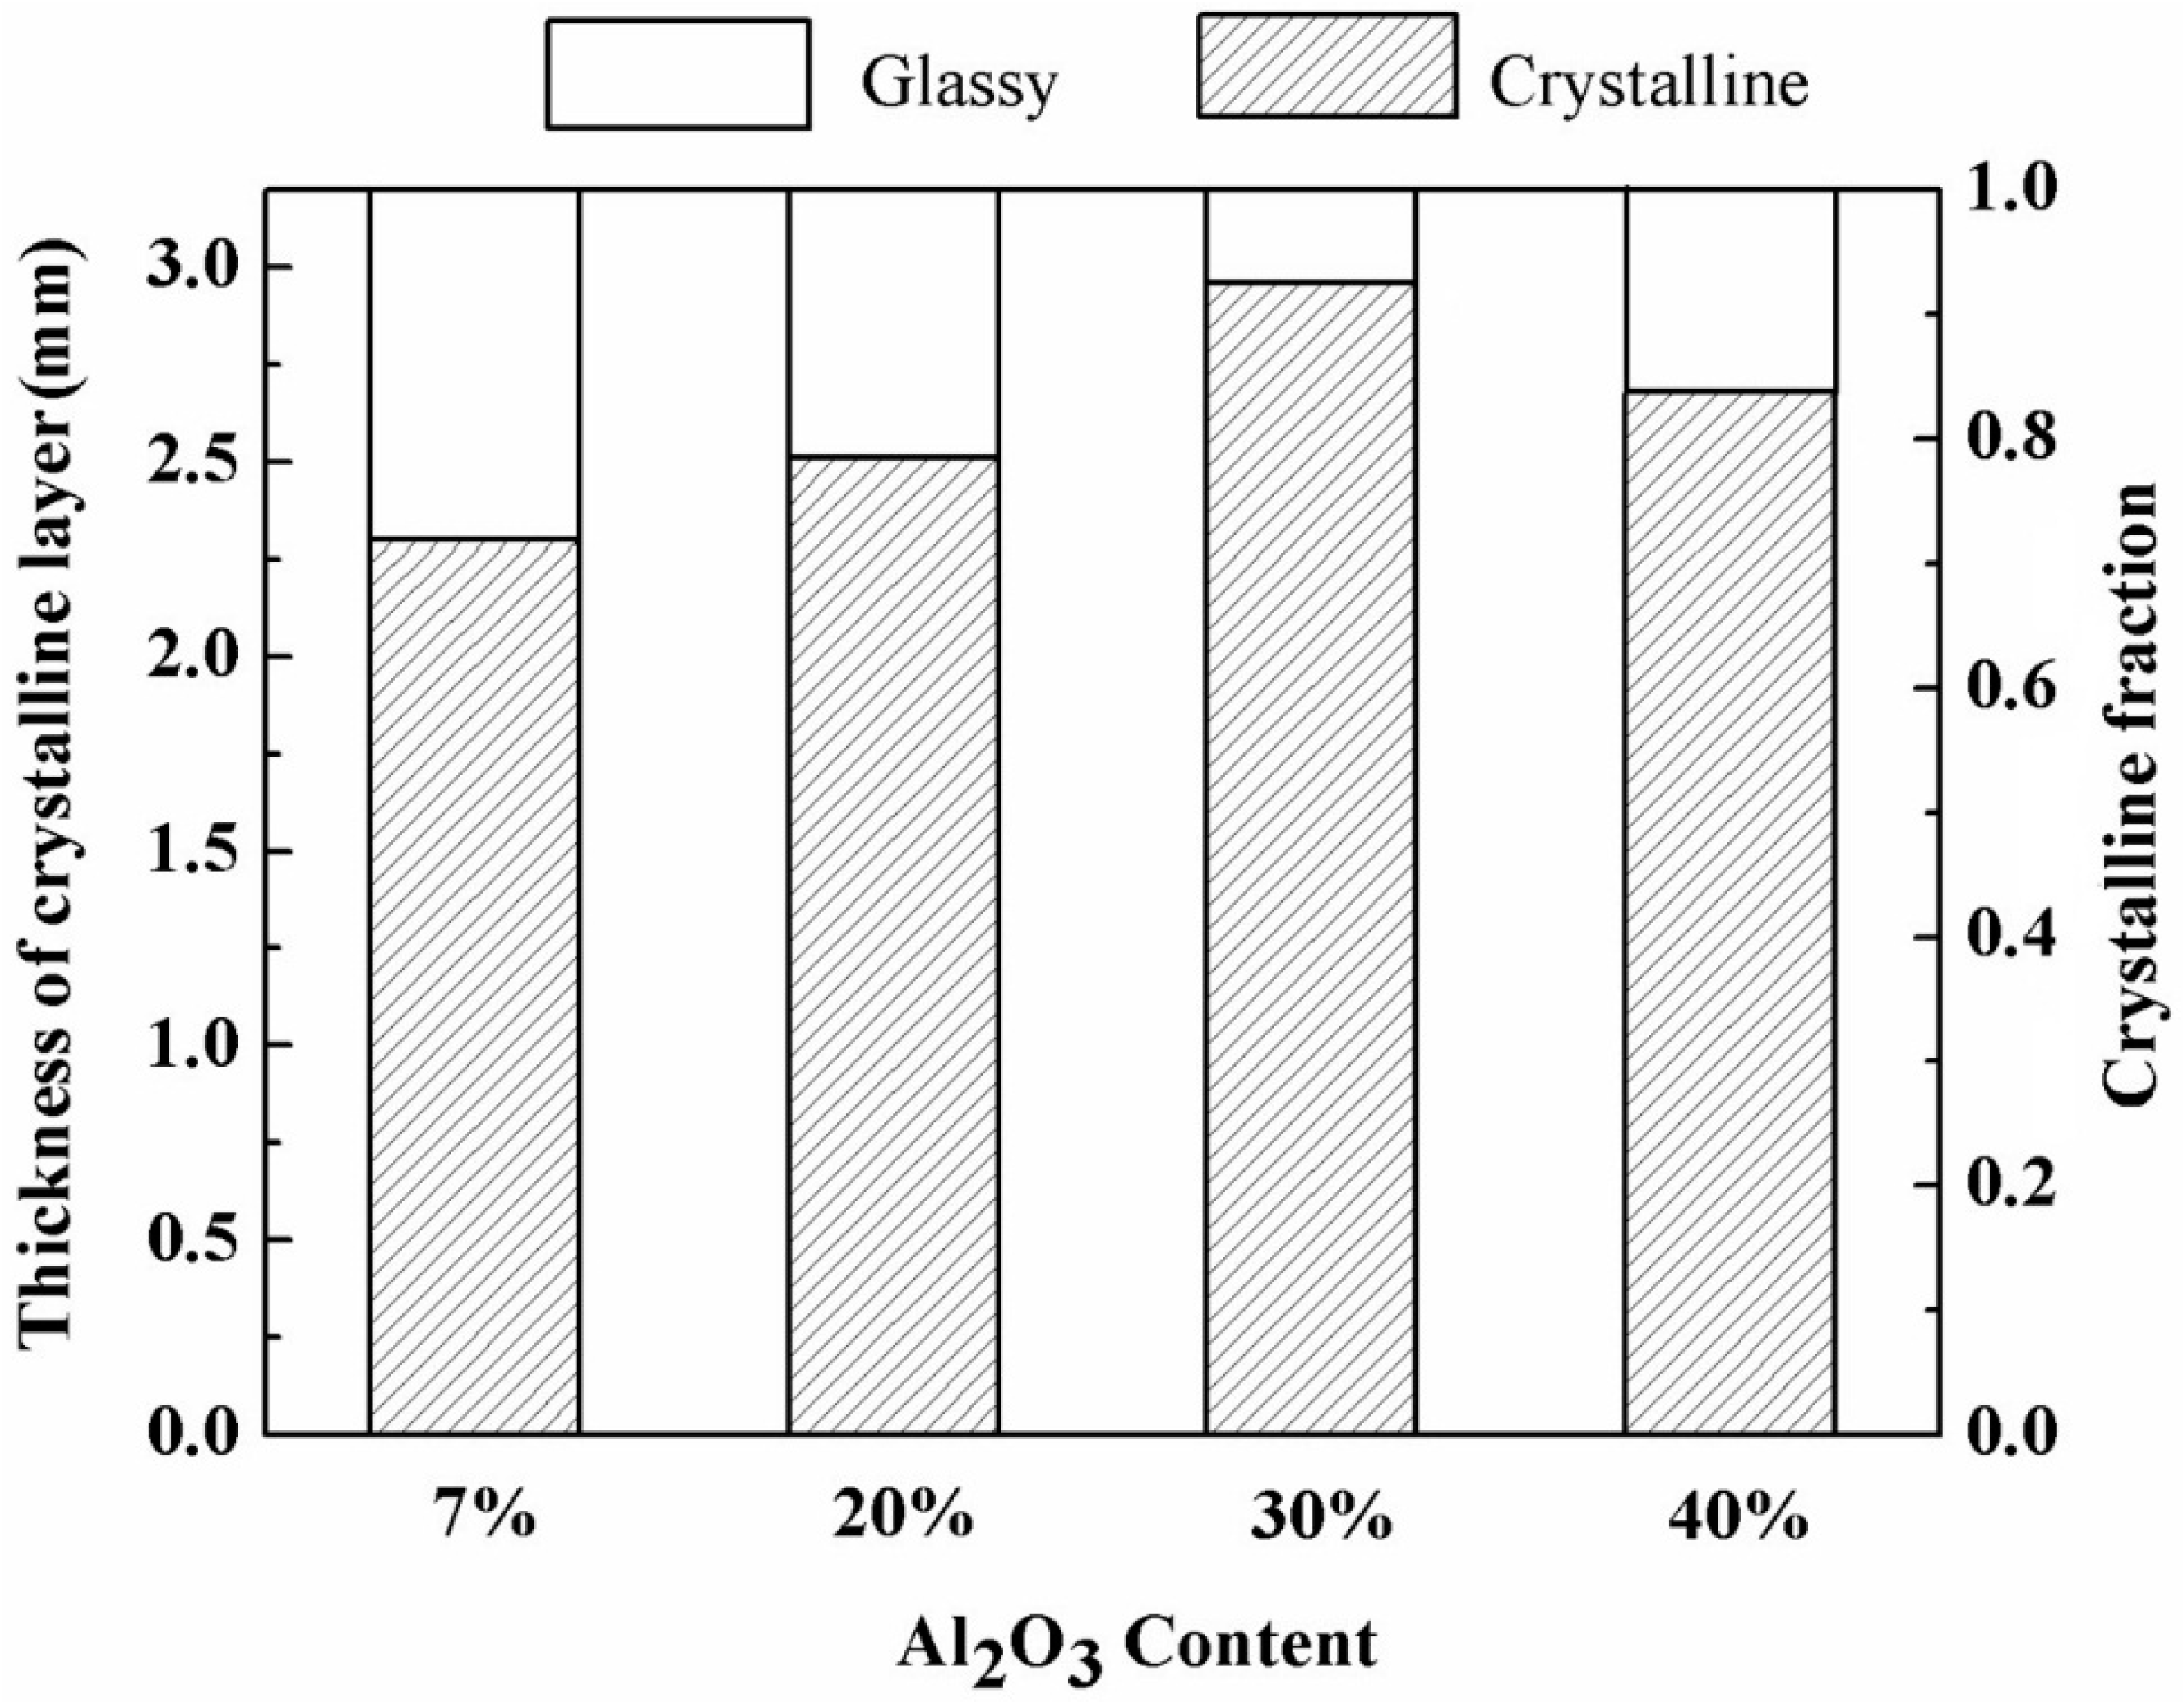
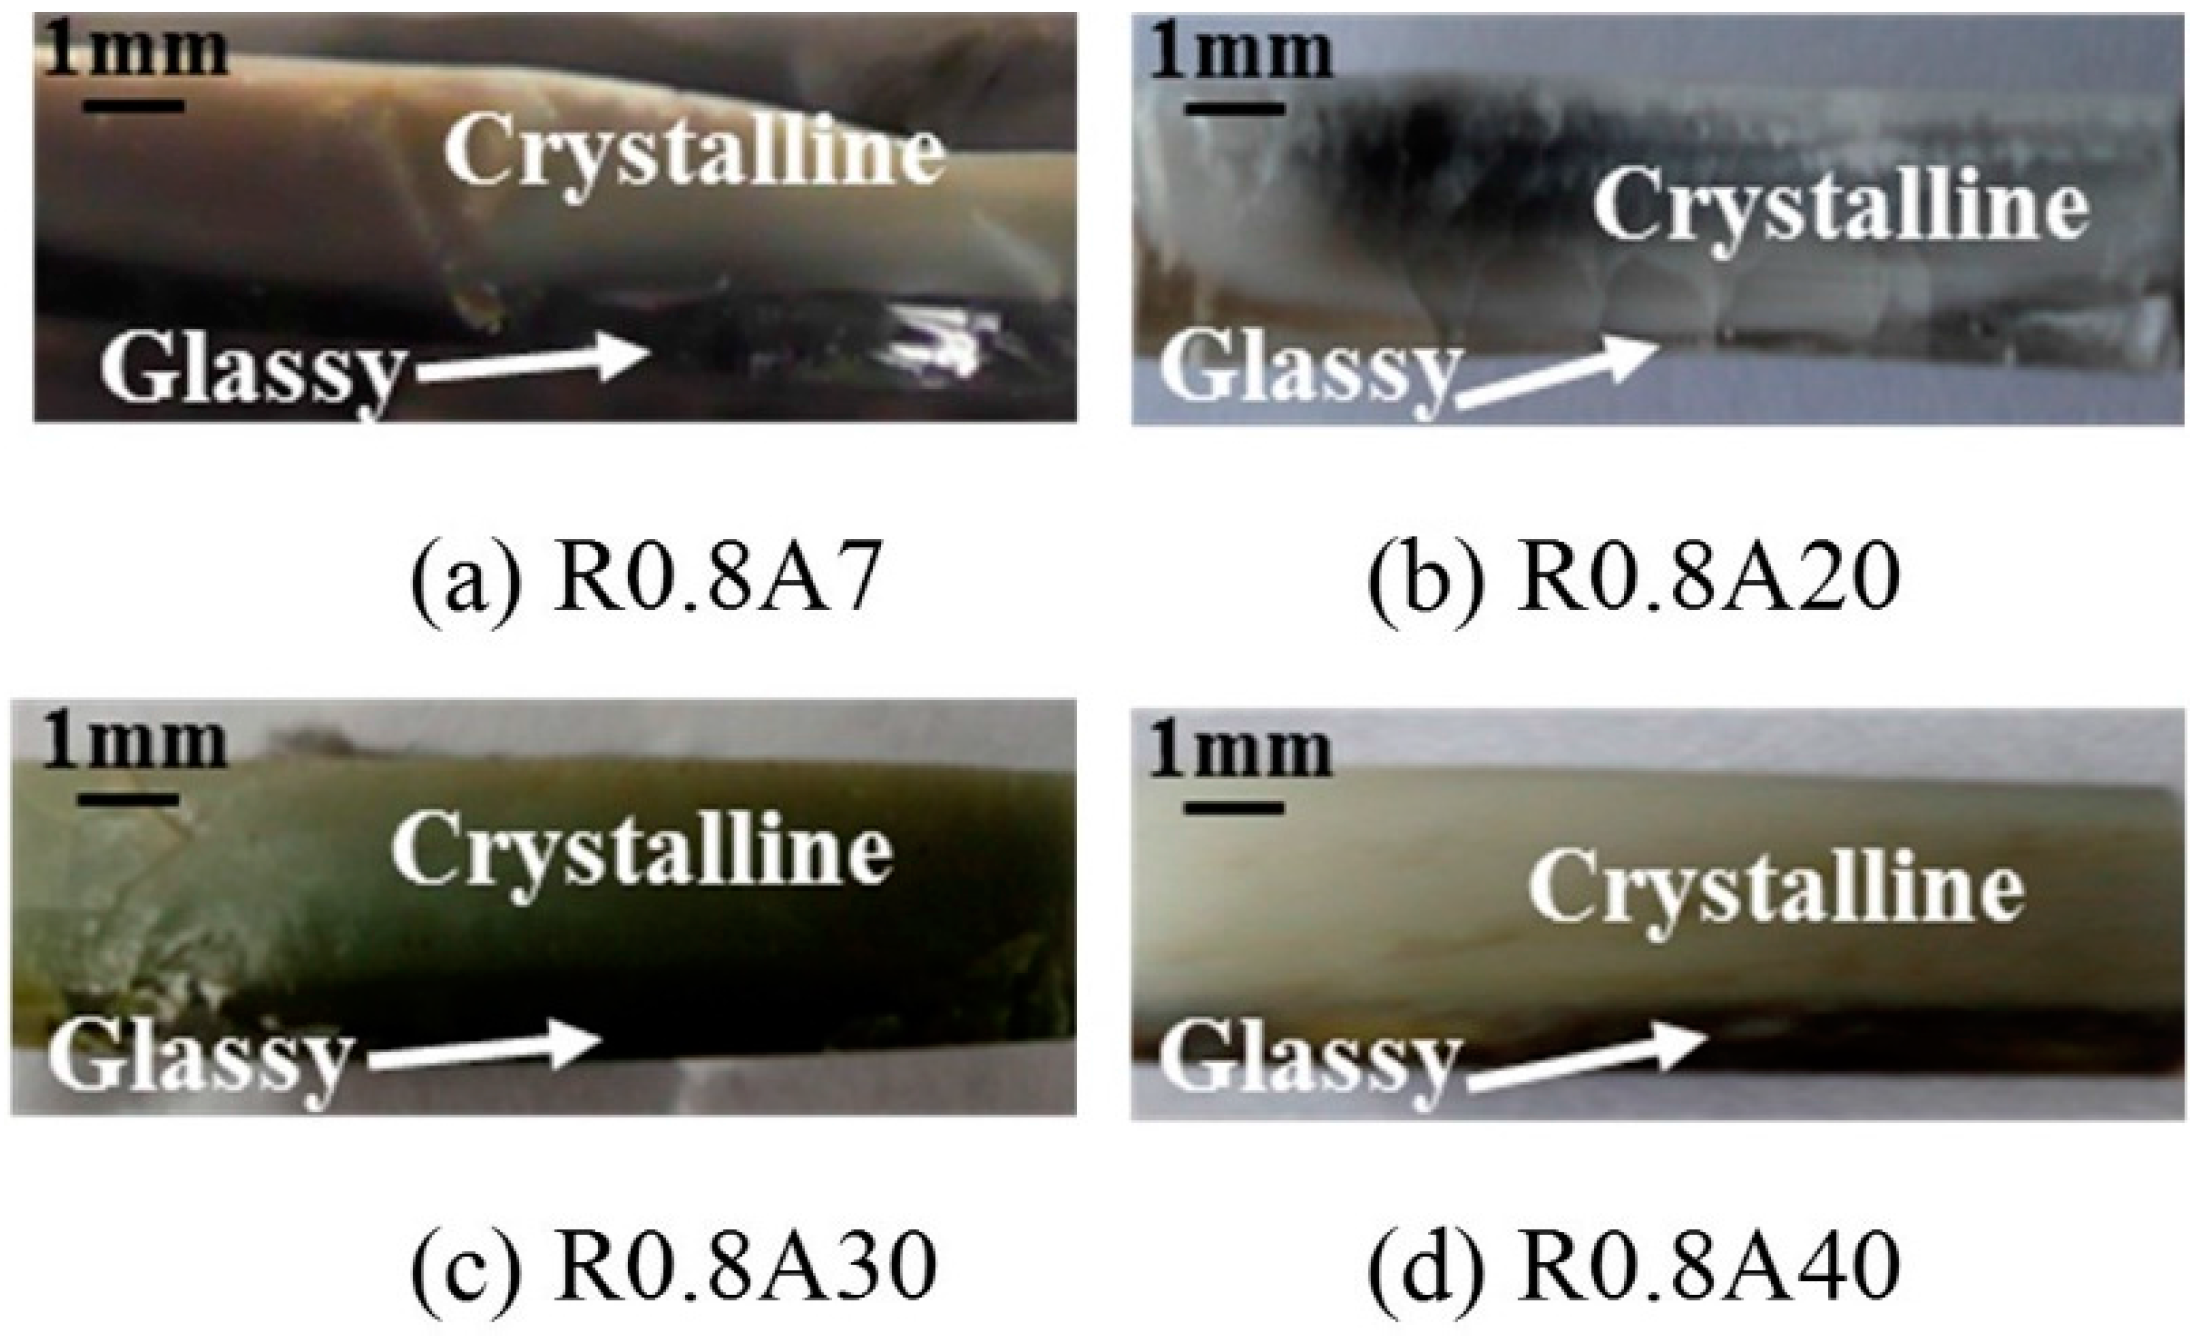
  • Both crystalline layer thickness and fraction increased first, then decreased with the further addition of Al2O3. Additionally, it was the mold flux crystallization, together with the resulted interfacial thermal resistance, that dominated the heat transfer performance of the mold flux—not the specific precipitated crystal phase.
  • The Rint increased from 9.2 × 10⁻⁴ m2·kW−1 (Sample R0.8A7) to 11.0 × 10⁻⁴ m2·kW−1 (Sample R0.8A20) and then to 16.0 × 10⁻⁴ m2·kW−1 (Sample R0.8A30) when the addition of Al2O3 content increased from 7% to 20% and then to 30%, respectively; however, it decreased to 13.6 × 10⁻⁴ m2·kW−1 (Sample R0.8A40) when the Al2O3 content reached 40%.
  • The variation in the interfacial thermal resistance Rint was proportional to crystalline fraction of the mold fluxes, as the interface thermal resistance was mainly caused by the deformation and shrinkage of the mold flux during its crystallization process.

Acknowledgments

The financial support from the start-up foundation of the State Key Laboratory of Advanced Metallurgy (KF14-10), China Postdoctoral Science Foundation (2014M550423), and NSFC (51504294, 51322405) are greatly acknowledged.

Author Contributions

L.Z. designed the work and conducted the heat transfer experiments and wrote the manuscript under the advice of both W.W. and K.Z. W.W. and K.Z. revised the manuscript before submission.

Conflicts of Interest

The authors declare no conflicts of interest.

References

  1. Zhang, L.; Thomas, B.G. Inclusions in continuous casting of steel. In Proceedings of the XXIV National Steelmaking Symposium, Morelia, Mich, Mexico, 26–28 November 2003; pp. 138–183.
  2. Atkinson, H.V.; Shi, G. Characterization of inclusions in clean steels: A review including the statistics of extremes methods. Prog. Mater. Sci. 2003, 48, 457–520. [Google Scholar] [CrossRef]
  3. Senk, D. Effects of Casting Flux Interaction with Steel Melt on Lubrication in CC Moulds. Mater. Sci. Forum 2010, 638, 3628–3633. [Google Scholar] [CrossRef]
  4. Kim, M.; Lee, S.; Cho, J.; Park, M.; Lee, H.; Kang, Y. A reaction between high Mn-High Al steel and CaO–SiO2-Type molten mold flux: Part I. Composition evolution in molten mold flux. Metall. Mater. Trans. B 2013, 44, 299–308. [Google Scholar] [CrossRef]
  5. Blazek, K.; Yin, H.; Skoczylas, G.; McClymonds, M.; Frazee, M. Development and evaluation of Lime-Alumina-Based mold powders for casting high-Aluminum TRIP steel grades. AIST Trans. 2011, 8, 232–240. [Google Scholar]
  6. Zhang, Z.; Wen, G.; Tang, P.; Sridhar, S. The influence of Al2O3/SiO2 ratio on the viscosity of mold fluxes. ISIJ Int. 2008, 48, 739–746. [Google Scholar] [CrossRef]
  7. Yu, X.; Wen, G.H.; Tang, P.; Wang, H. Investigation on viscosity of mould fluxes during continuous casting of aluminum containing TRIP steels. Ironmak. Steelmak. 2009, 36, 623–630. [Google Scholar] [CrossRef]
  8. Kim, G.; Sohn, I. Effect of Al2O3 on the viscosity and structure of calcium silicate-based melts containing Na2O and CaF2. J. Non-Crys. Sol. 2012, 358, 1503–1537. [Google Scholar] [CrossRef]
  9. Cho, J.; Blazek, K.; Frazee, M.; Yin, H.; Park, J.; Moon, S. Assessment of CaO–Al2O3 based mold flux system for high aluminum TRIP casting. ISIJ Int. 2013, 53, 62–70. [Google Scholar] [CrossRef]
  10. Xiong, Y.; Wen, G.; Tang, P.; Yang, B. Characteristics of heat flux through slag film of mold slag used for high Al-TRIP steel casting. J. Iron Steel Res. Int. 2010, 17, 11–16. [Google Scholar]
  11. Zhou, L.; Wang, W.; Ma, F.; Li, J.; Wei, J.; Matsuura, H.; Tsukihashi, F. A Kinetic Study of the Effect of Basicity on the Mold Fluxes Crystallization. Metall. Mater. Trans. B 2012, 43, 354–362. [Google Scholar] [CrossRef]
  12. Allibert, M.; Gaye, H.; Geiseler, J. Slag Atlas; Eisenhüttenleute, V.D., Ed.; Verlag Stahleisen GmbH Press: Dtisseldorf, Germany, 1995. [Google Scholar]
  13. Zhou, L.; Wang, W.; Wei, J.; Zhou, K. Melting and Heat Transfer Behavior of F-Free Mold Fluxes for Casting Medium Carbon Steels. ISIJ Int. 2015, 55, 821–829. [Google Scholar] [CrossRef]
  14. Wang, W.; Zhou, L.; Gu, K. Effect of mold flux melting and crystal dissolution on the radiative heat transfer for continuous casting. Met. Mater. Int. 2010, 16, 913–920. [Google Scholar] [CrossRef]
  15. Beck, J.V. 1HCP1D: A Program for Calculating Surface Heat Fluxes from Transient Temperatures Inside Solids; Beck Engineering Consultants Company: Houston, TX, USA, 1997. [Google Scholar]
  16. Zhang, H.; Wang, W.; Zhou, D.; Ma, F.; Lu, B.; Zhou, L. A Study for Initial Solidification of Sn-Pb Alloy during Continuous Casting: Part I. The Development of the Technique. Metall. Mater. Trans. B 2014, 45, 1038–1047. [Google Scholar] [CrossRef]
  17. Kashiwaya, Y.; Cicutti, C.E.; Cramb, A.W.; Ishii, H. Development of double and single hot thermocouple technique for in situ observation and measurement of mold slag crystallization. ISIJ Int. 1998, 38, 348–356. [Google Scholar] [CrossRef]
  18. Zhou, L.; Wang, W.; Zhou, K. Viscosity and crystallization behavior of F-free mold for casting medium carbon steels. ISIJ Int. 2015, 55, 1916–1924. [Google Scholar] [CrossRef]
  19. Mills, K.C.; Fox, A.B.; Li, Z.; Thackray, R.P. Performance and properties of mould fluxes. Ironmak. Steelmak. 2005, 32, 26–34. [Google Scholar] [CrossRef]
  20. Zhou, L.; Wang, W.; Zhou, K. Effect of Al2O3 on the Crystallization of Mold Flux for Casting High Al Steel. Metall. Mater. Trans. E 2015, 2, 99–108. [Google Scholar] [CrossRef]
  21. Taylor, R.; Mills, K.C. Physical properties of casting powders III: Thermal conductivities of casting powders. Ironmak. Steelmak. 1988, 15, 187–194. [Google Scholar]
  22. Wang, W.; Gu, K.; Zhou, L.; Ma, F.; Sohn, I.; Min, D.; Matsuura, H.; Tsukihashi, F. Radiative heat transfer behavior of mold fluxes for casting low and medium carbon steels. ISIJ Int. 2011, 51, 1838–1845. [Google Scholar] [CrossRef]
  23. Ozawa, S.; Susa, M.; Goto, T.; Endo, R.; Mills, K.C. Lattice and radiation conductivities for mould fluxes from the perspective of degree of crystallinity. ISIJ Int. 2006, 46, 413–419. [Google Scholar] [CrossRef]
  24. Kyokai, N.T.; Shinkokai, N.G. Handbook of Physico-Chemical Properties at High Temperature; Shiraishi, Y., Kawai, Y., Eds.; Iron and Steel Institute of Japan: Tokyo, Japan, 1988. [Google Scholar]
  25. Gu, K.; Wang, W.; Wei, J.; Matsuura, H.; Tsukihashi, F.; Sohn, I.; Min, D.J. Heat-transfer phenomena across mold flux by using the inferred emitter technique. Metall. Mater. Trans. B 2012, 43, 1393–1404. [Google Scholar] [CrossRef]
  26. Tsutsumi, K.; Nagasaka, T.; Hino, M. Surface roughness of solidified mold flux in continuous casting process. ISIJ Int. 1999, 39, 1150–1159. [Google Scholar] [CrossRef]
  27. Cho, J.W.; Emi, T.; Shibata, H.; Suzuki, M. Heat transfer across mold flux film in mold during initial solidification in continuous casting of steel. ISIJ Int. 1998, 38, 834–842. [Google Scholar] [CrossRef]
Figure 1. CaO–SiO2–Al2O3 ternary phase diagram [12].
Metals 06 00139 g001
Figure 2. Schematic illustration of the infrared emitter.
Metals 06 00139 g002
Figure 3. Schematic figure of copper substrate used as the radiation target.
Metals 06 00139 g003
Figure 4. The heating profile for heat transfer test.
Metals 06 00139 g004
Figure 5. The responding temperatures and heat flux in heat transfer test. (a) The in-mold responding temperature time span; (b) the heat flux for bare copper system under thermal radiation.
Metals 06 00139 g005
Figure 6. The schematic of Single Hot Thermocouple Technique (SHTT) experimental apparatus.
Metals 06 00139 g006
Figure 7. Temperature controlling profile for the glassy/crystalline phase transition temperature measurements.
Metals 06 00139 g007
Figure 8. The heat flux time span of Sample R0.8A7 during the heat transfer test.
Metals 06 00139 g008
Figure 9. The variation in phases of Sample R0.8A7 during the heat transfer test.
Metals 06 00139 g009
Figure 10. The measured heat fluxes histories of mold fluxes with different amounts of Al2O3.
Metals 06 00139 g010
Figure 11. The snapshots of cross-section of the mold flux disks after the heat transfer test.
Metals 06 00139 g011
Figure 12. Thickness of the crystalline layer and the crystalline fraction of disks with different amounts of Al2O3.
Metals 06 00139 g012
Figure 13. The XRD of mold fluxes with different amounts of Al2O3.
Metals 06 00139 g013
Figure 14. Schematic representation of heat flux across the mold flux film consisted of crystalline and glassy layers.
Metals 06 00139 g014
Figure 15. The glassy/crystalline transition temperature of mold fluxes with different amounts of Al2O3.
Metals 06 00139 g015
Figure 16. The flow chart for calculating Rint.
Metals 06 00139 g016
Figure 17. The Rint of mold fluxes with different amounts of Al2O3.
Metals 06 00139 g017
Table 1. The chemical compositions of mold fluxes with different amounts of Al2O3 after pre-melted (in Mass Pct wt. %).
SampleCaOSiO2Al2O3MgOFNa2OLi2OR
R0.8A733.5342.057.022.005.889.020.500.8
R0.8A2027.8434.7020.012.025.919.020.500.8
R0.8A3023.3729.1630.012.015.949.010.500.8
R0.8A4018.8923.6040.002.005.989.010.500.8
Table 2. Conditions for Rint calculations of mold fluxes with different amounts of Al2O3.
Al2O3 Cont.Tg/c (°C)Tms (°C)dcrystalline (mm)dglassy (mm)
7%8301032.301.00
20%8161002.510.79
30%791962.960.34
40%803972.680.62

