
Properties Evaluation of Thin Microhardened Surface Layer of Tool Steel after Wire EDM


Abstract
:
1. Introduction
2. Materials and Methods
2.1. The Basic Characteristic of Eroded Surface and HAZ after WEDM
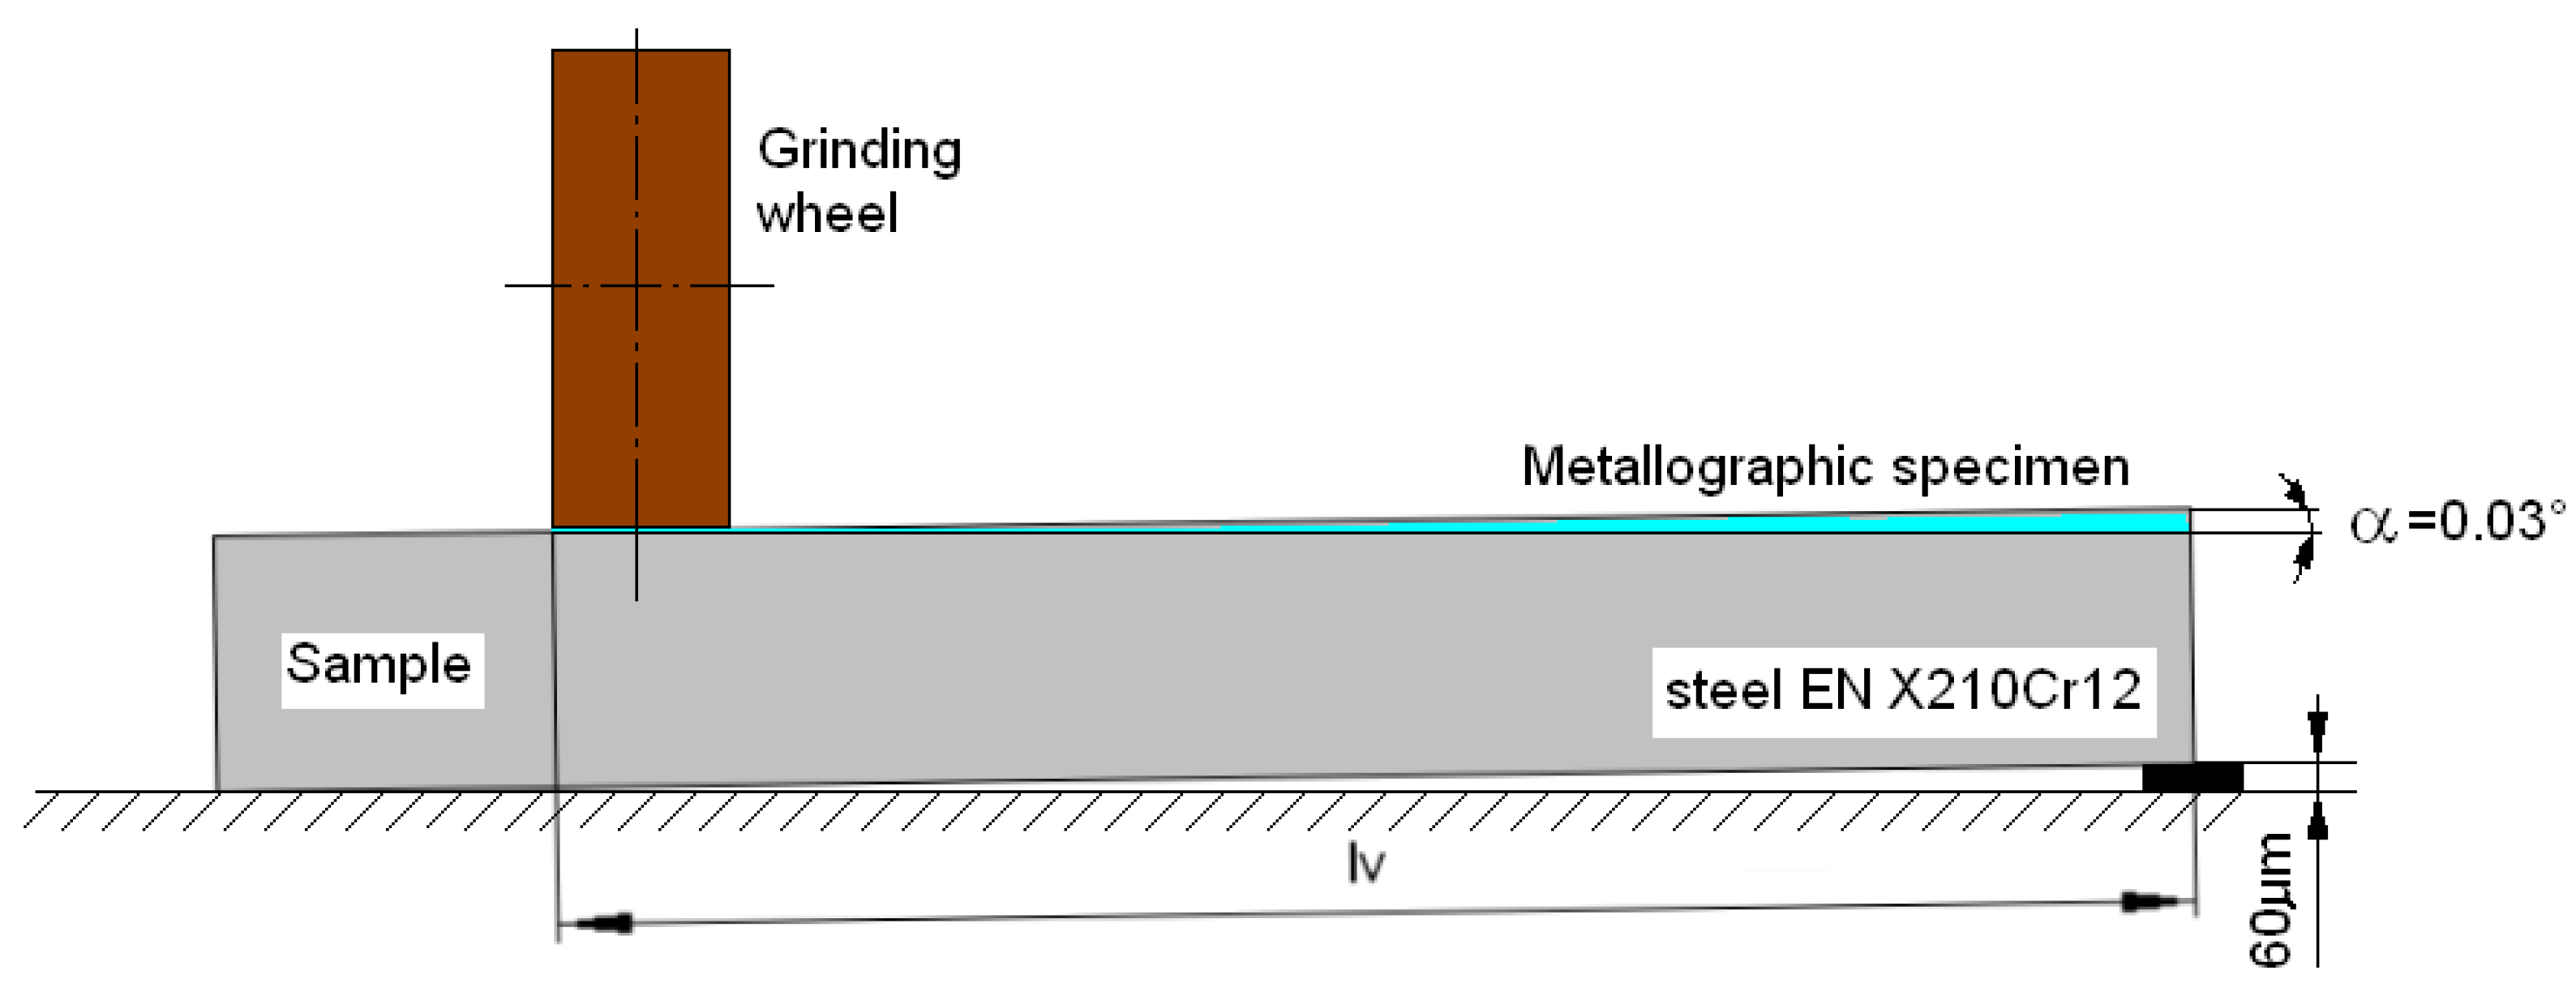
2.2. Preparation of Experimental Samples
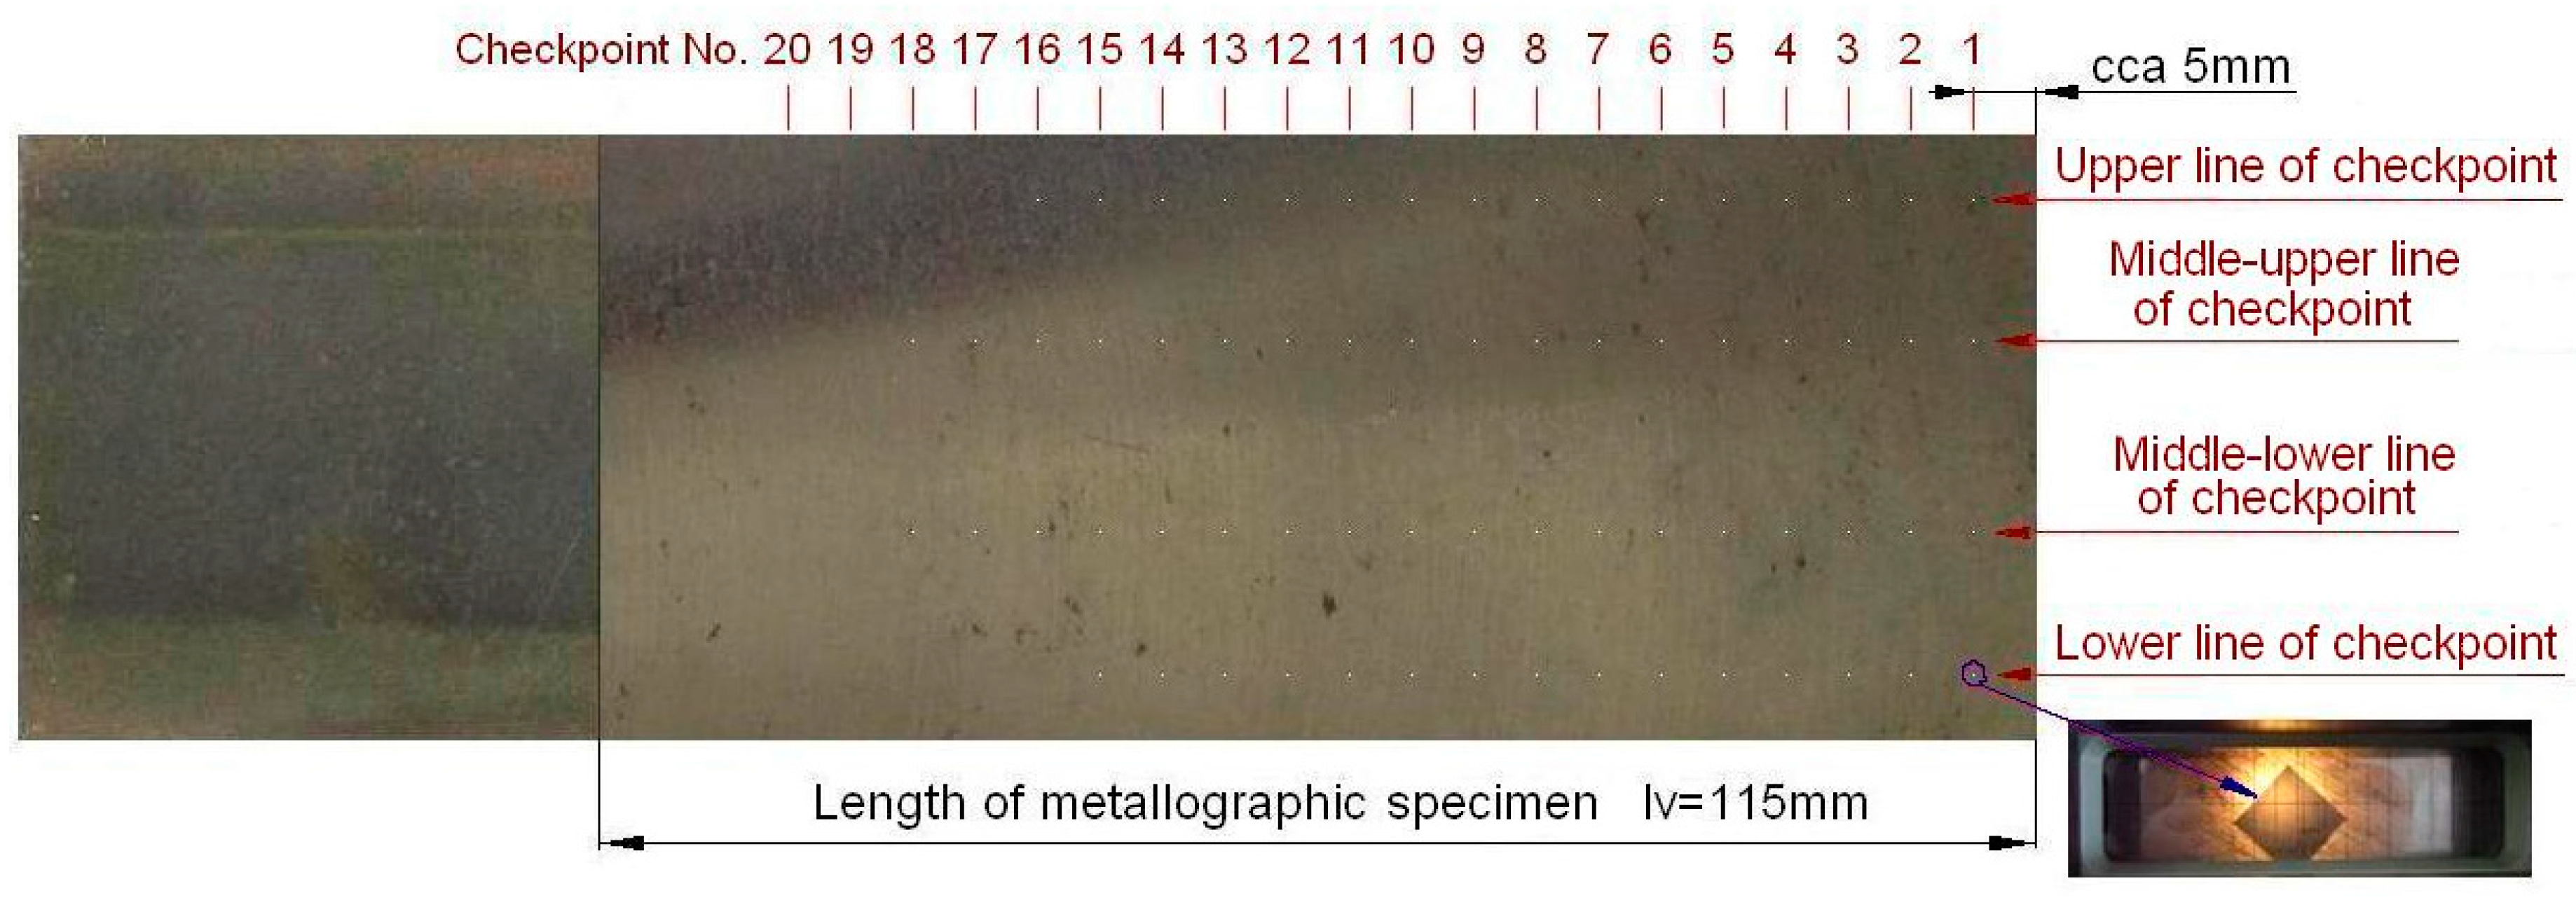
2.3. Microhardness Test and Measurement of Total HAZ Depth
3. Results and Discussions
3.1. Experimental Measurement of Total HAZ Depth and Microhardness Course
3.2. Evaluation of Experimental Measurements
3.3. Mathematical Modeling of the Total HAZ Course
4. Conclusions
- (i)
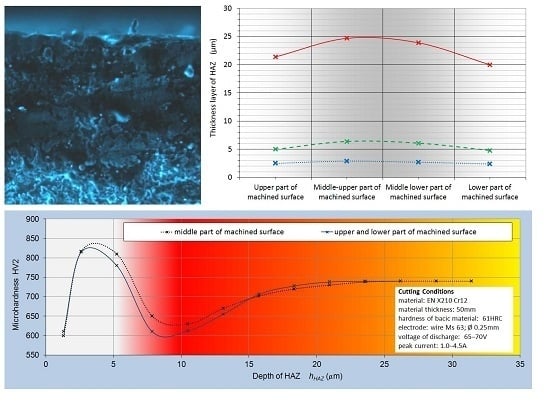
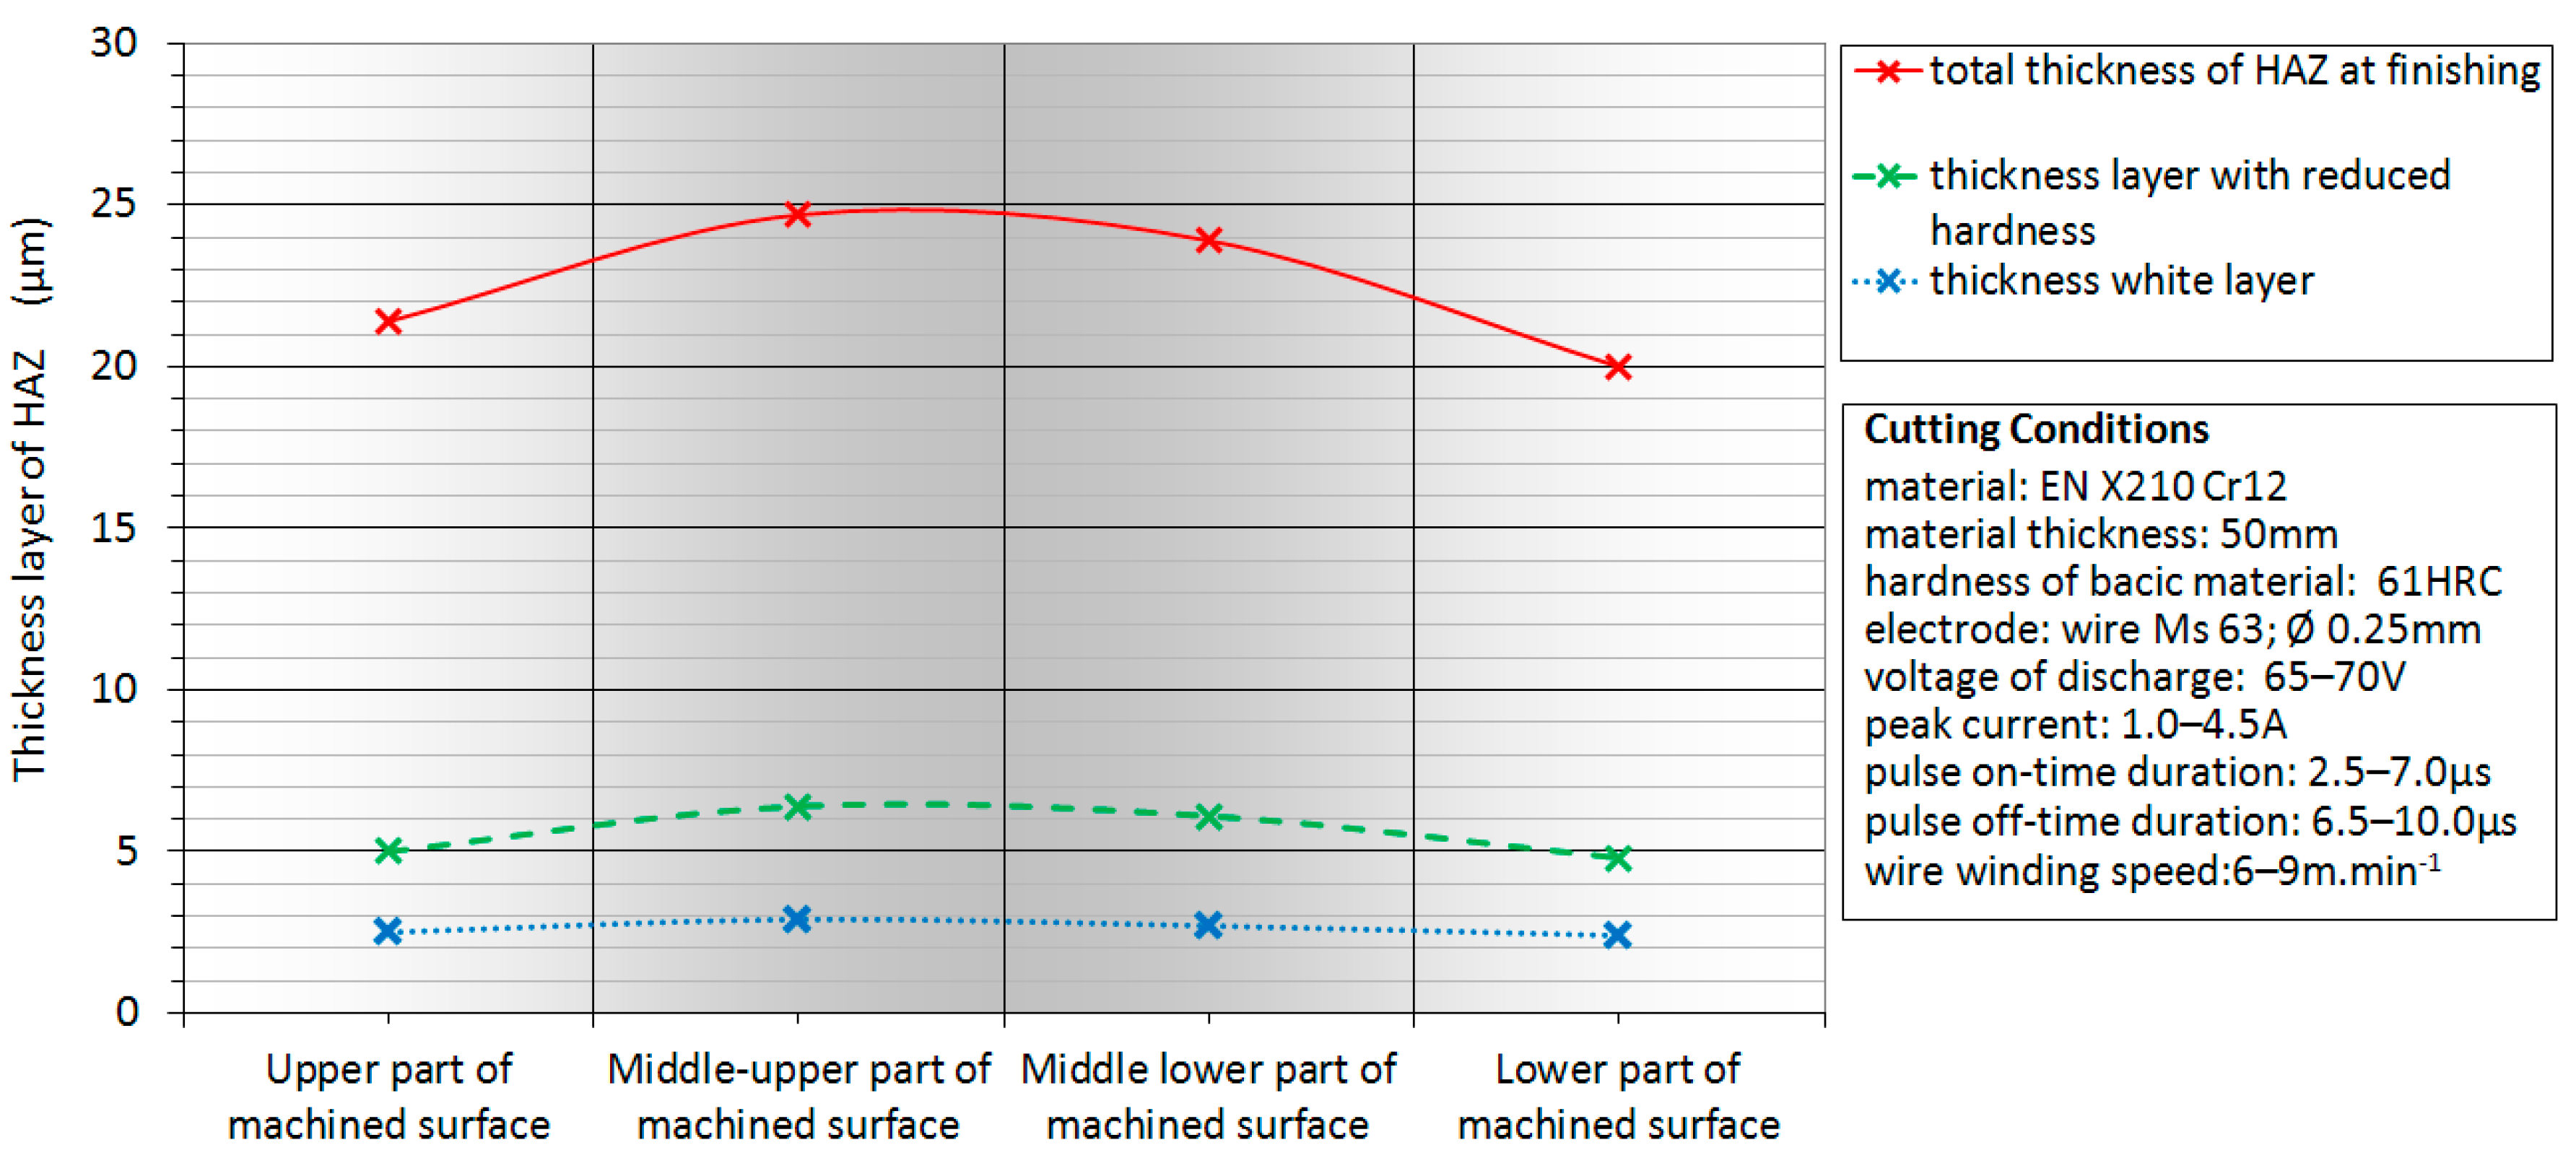
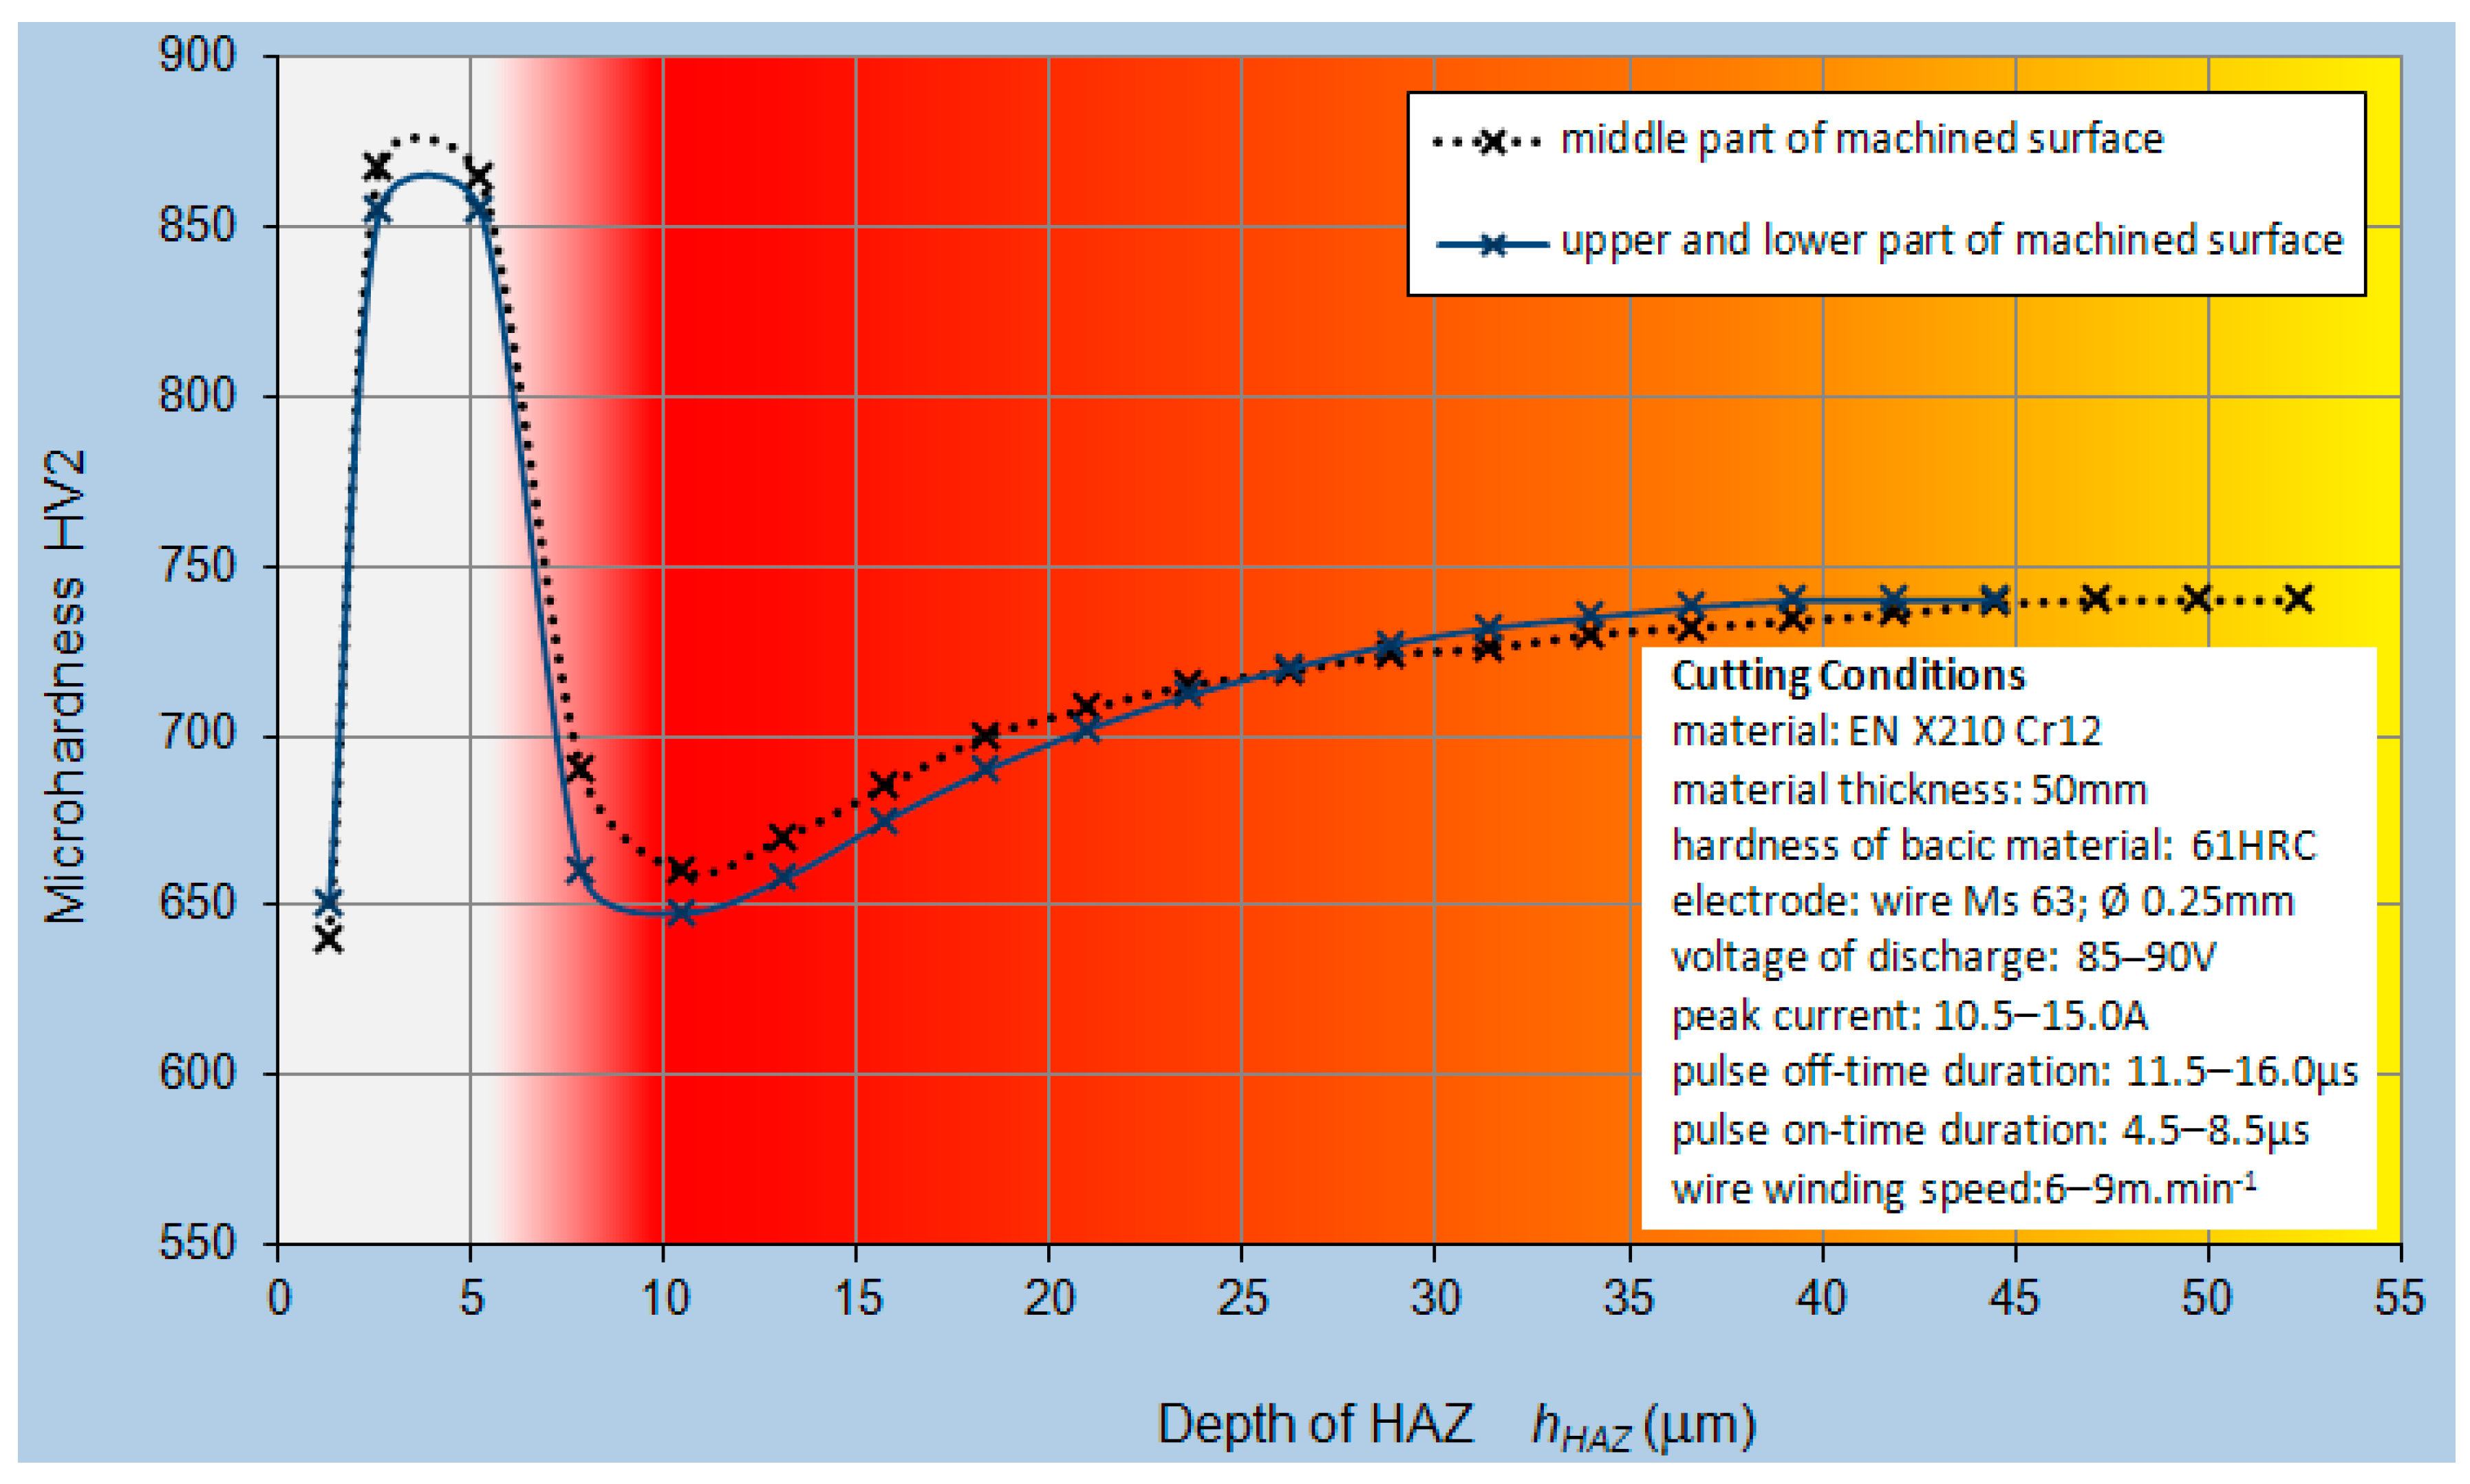
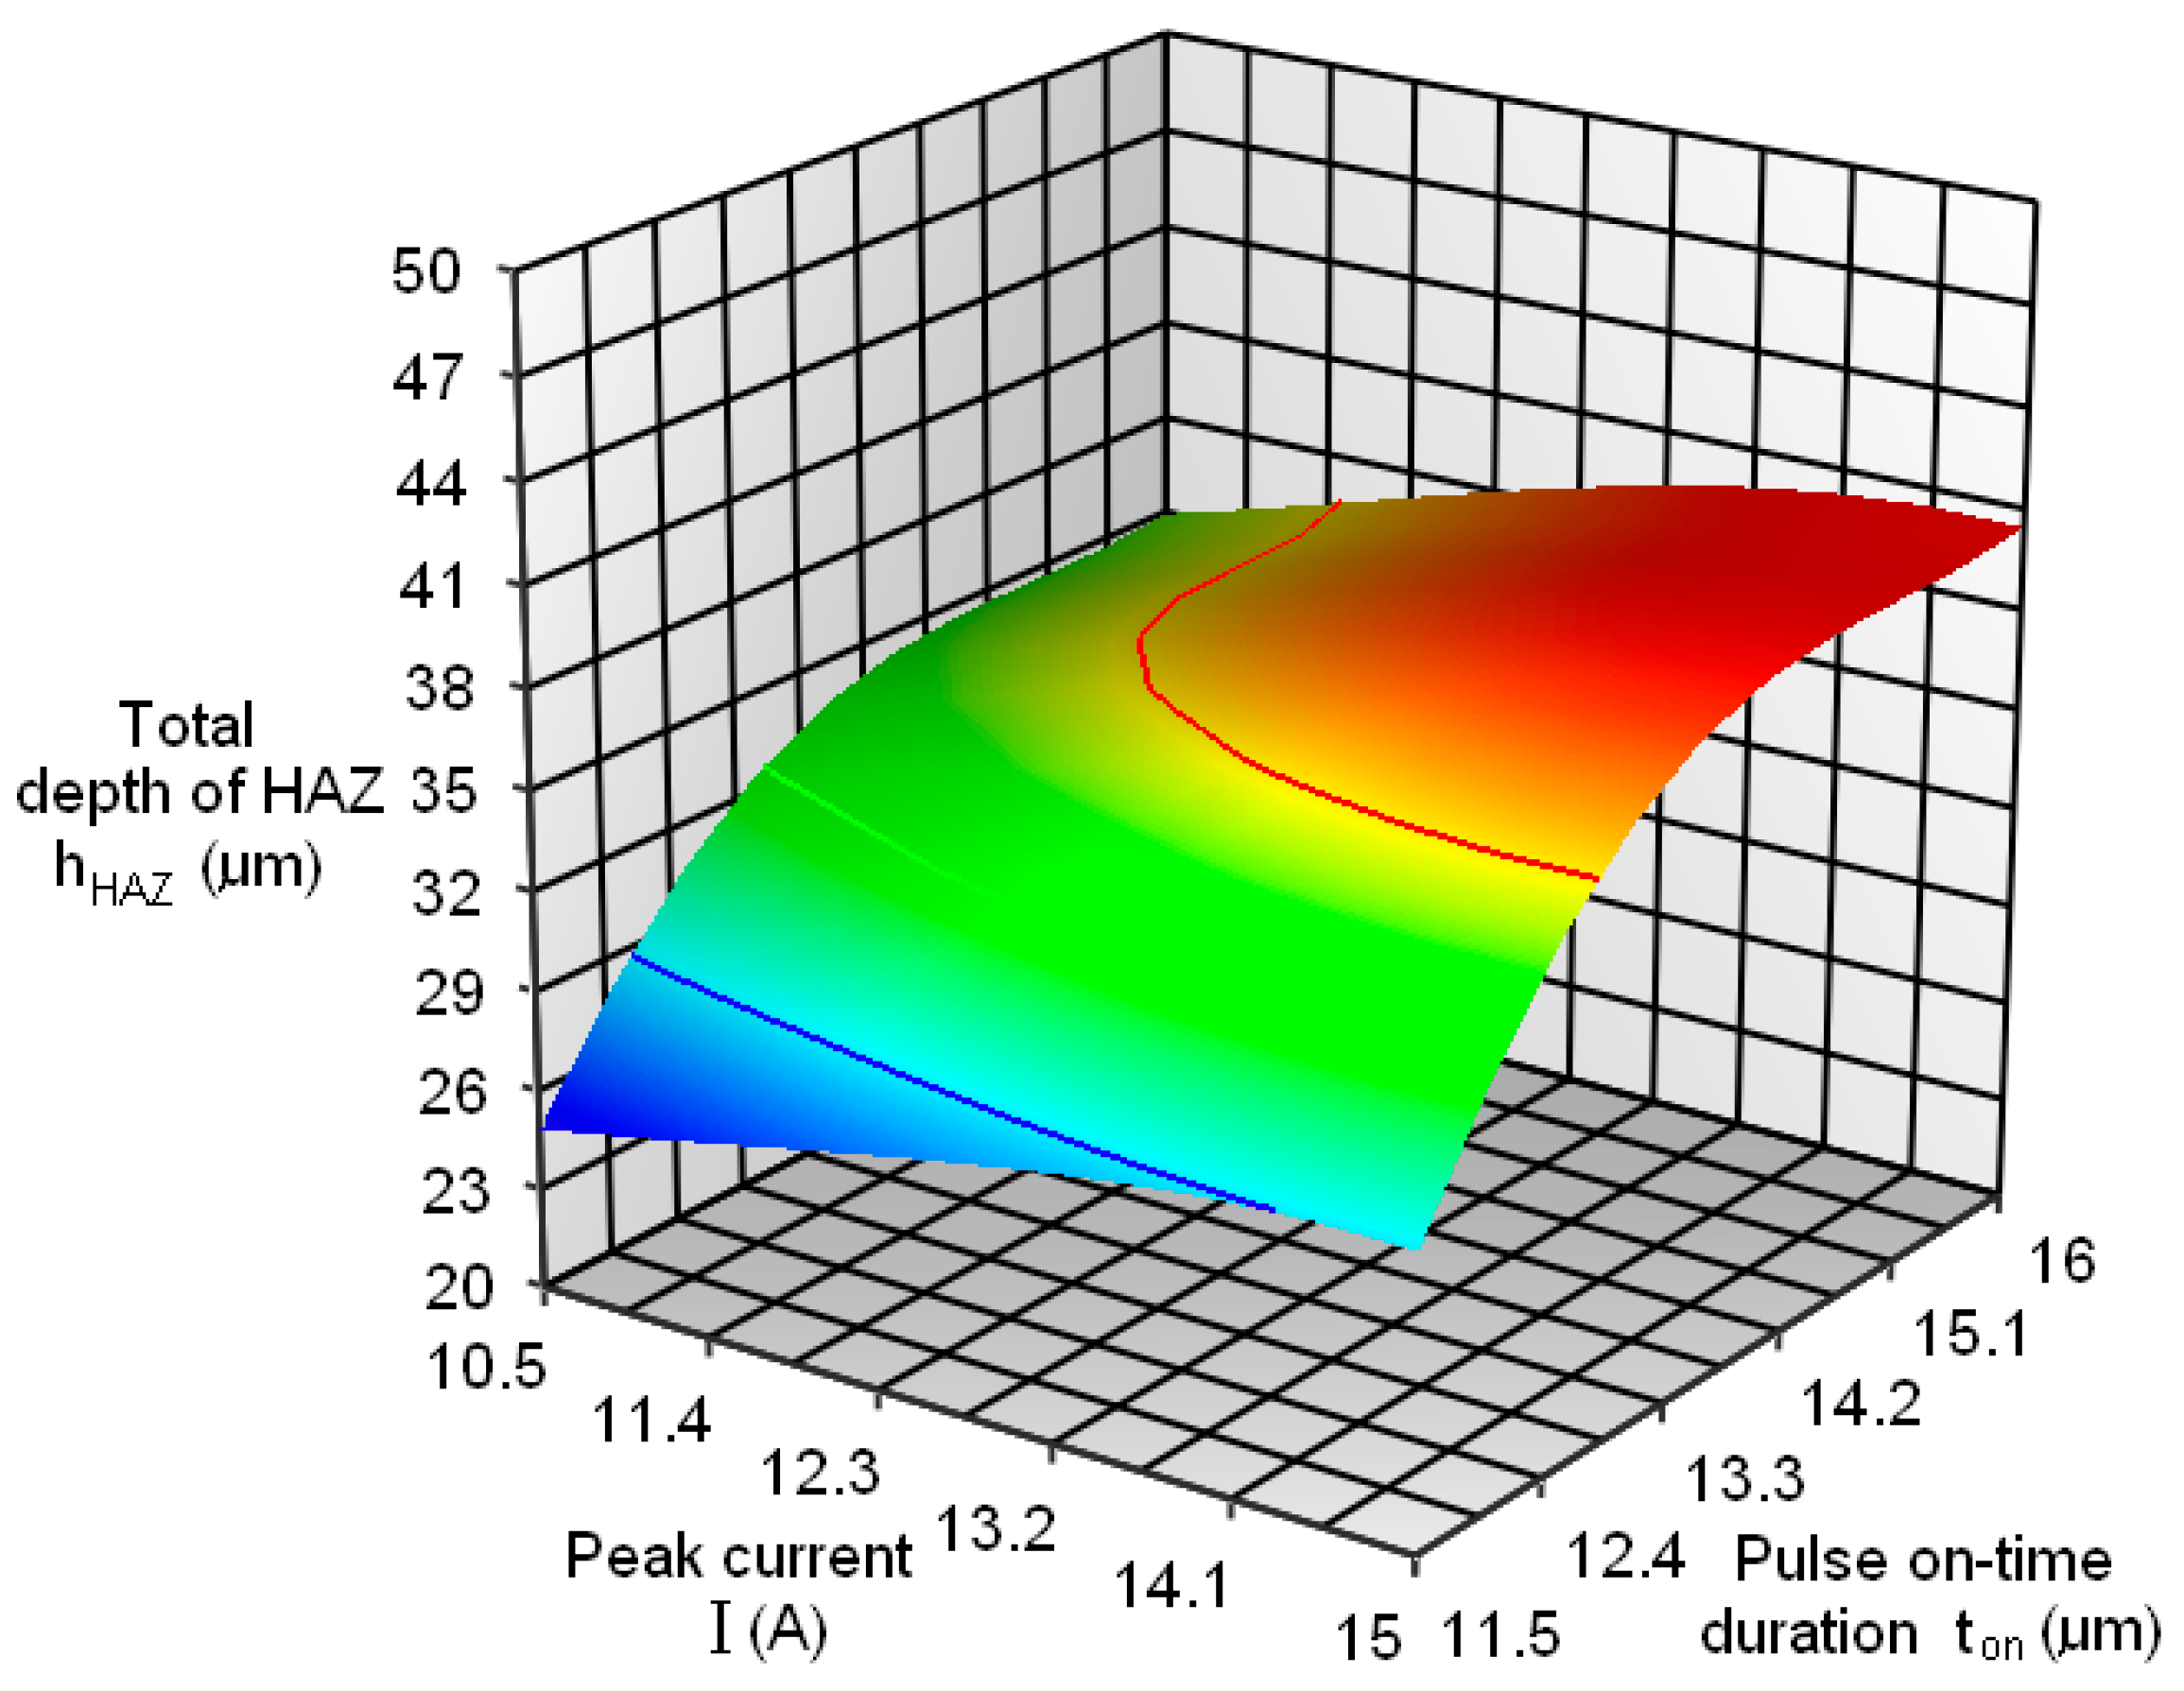
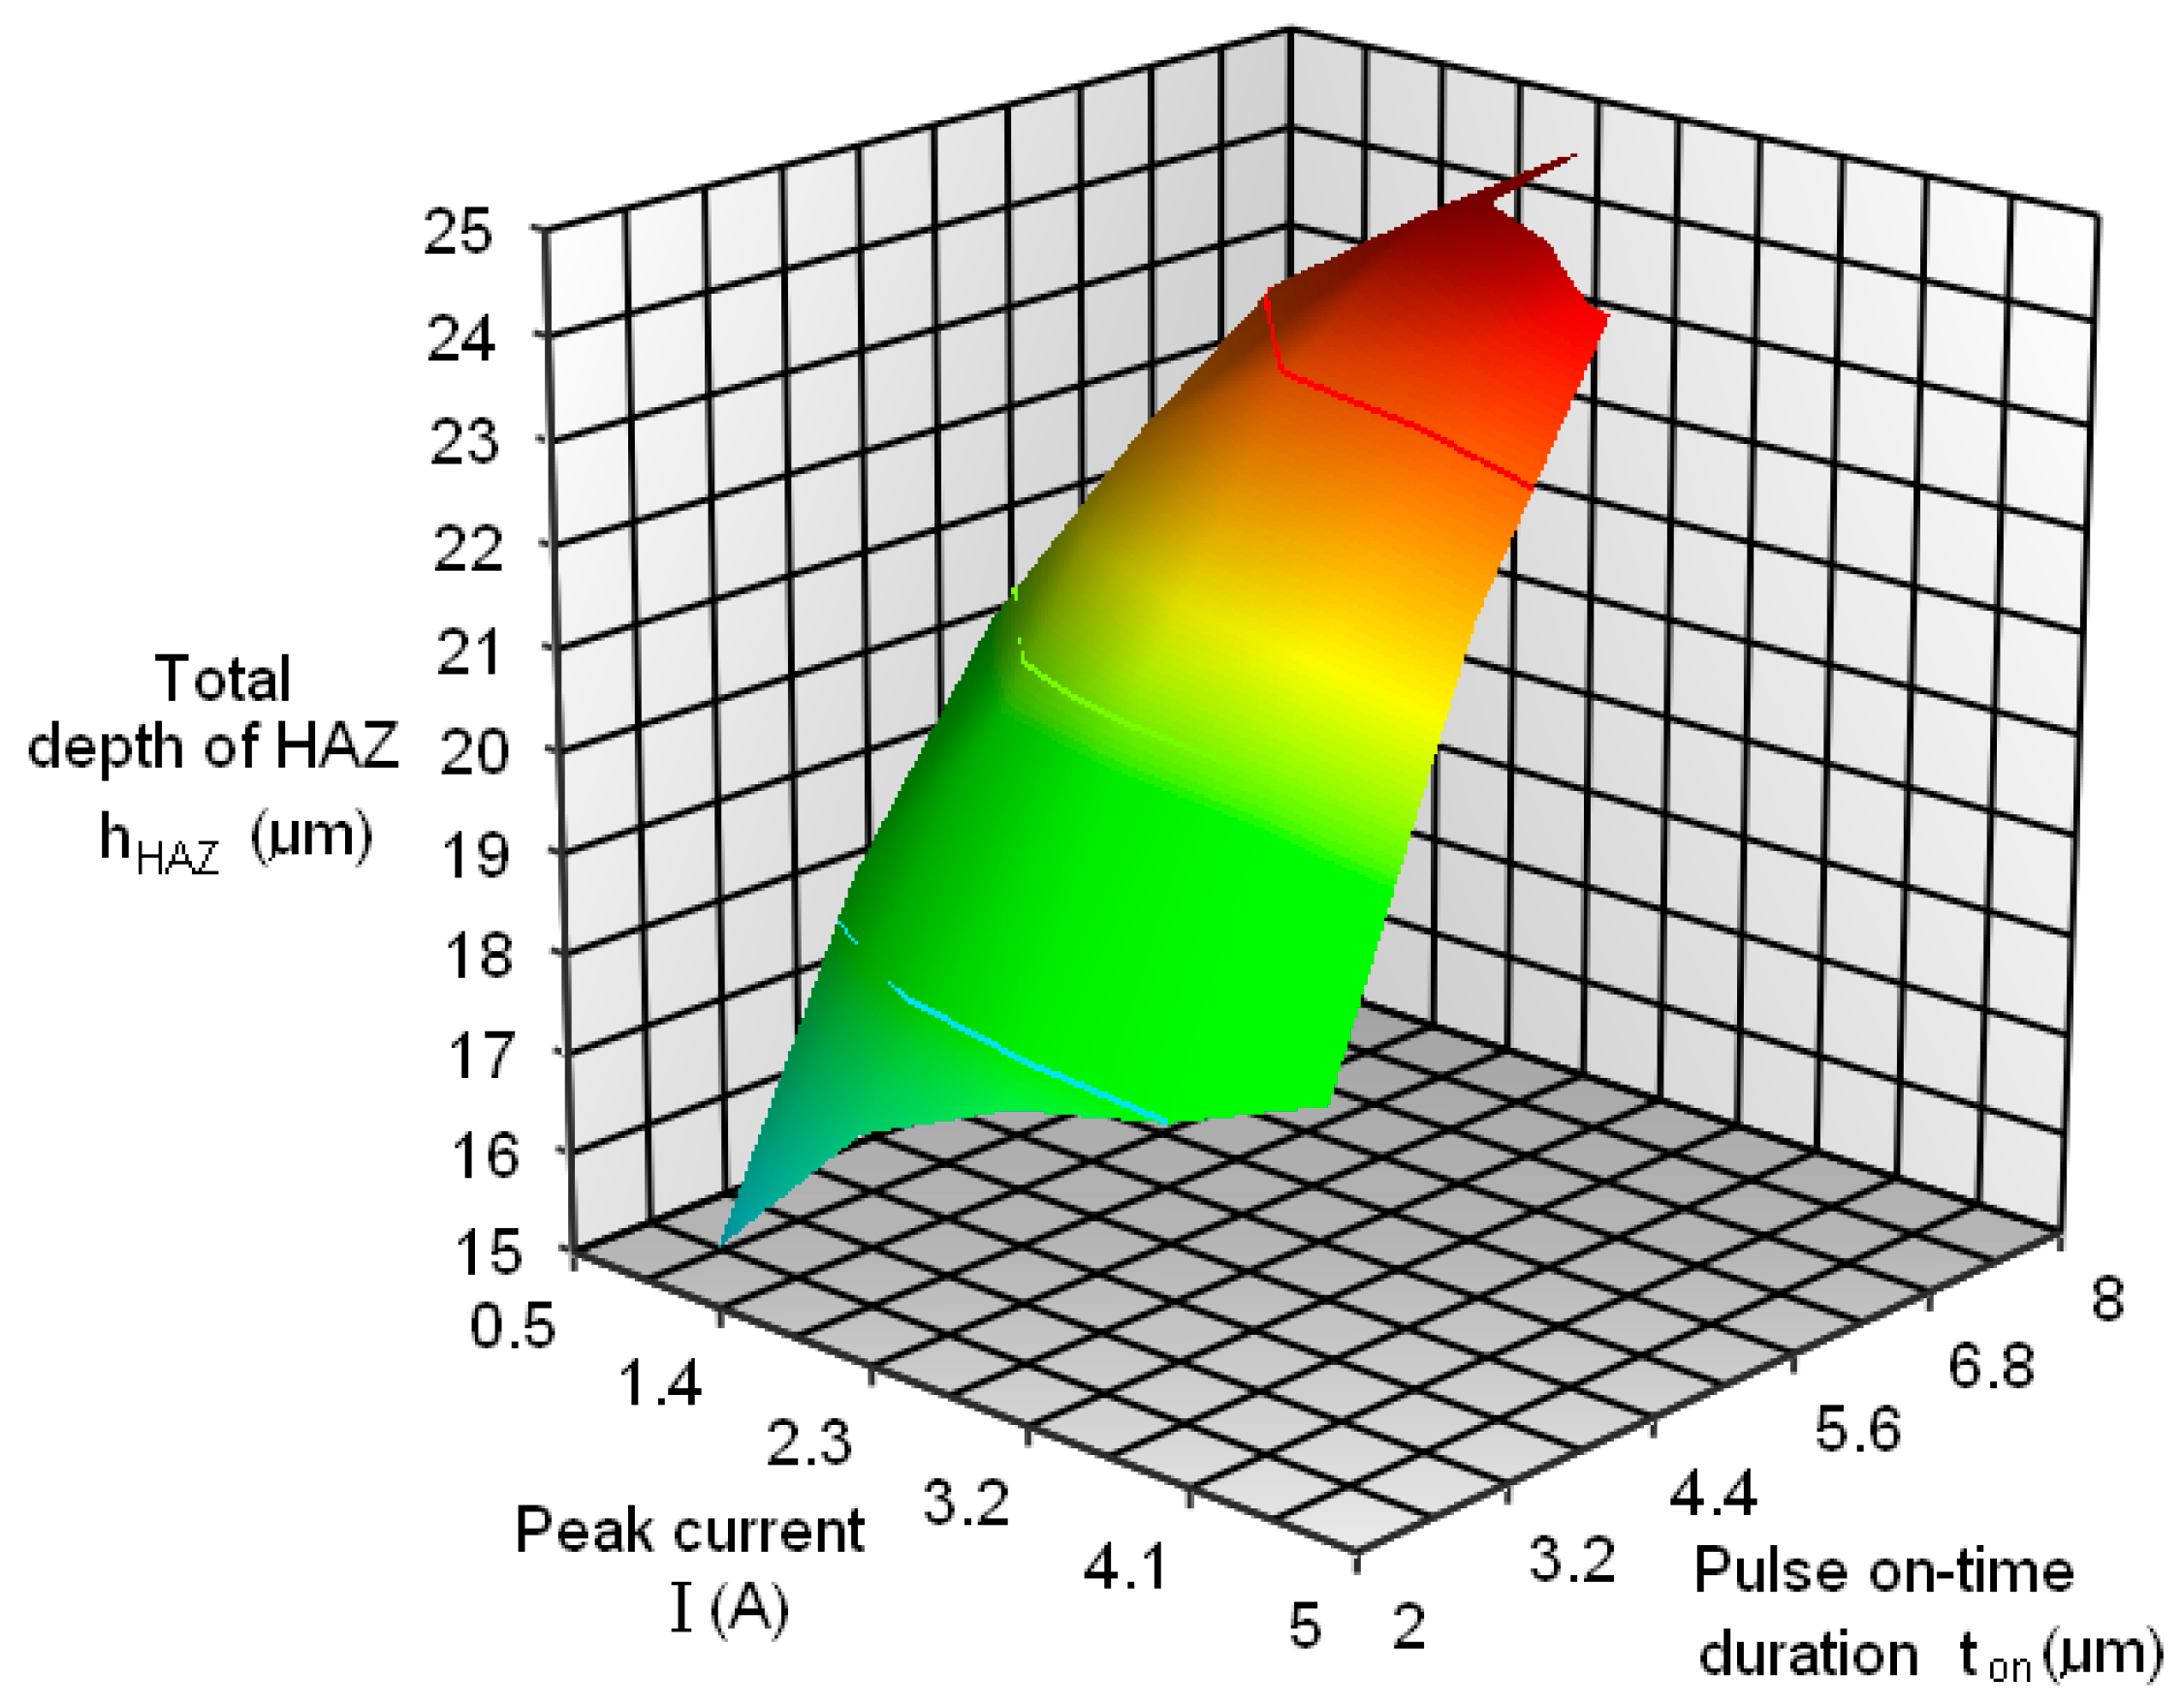
- Total microhardened surface layer depth determined by experimental measurement on tool steel EN X210Cr12 ranges from 20 to 25 µm for finishing operations and from 40 to 50 µm for roughing operations.
- (ii)
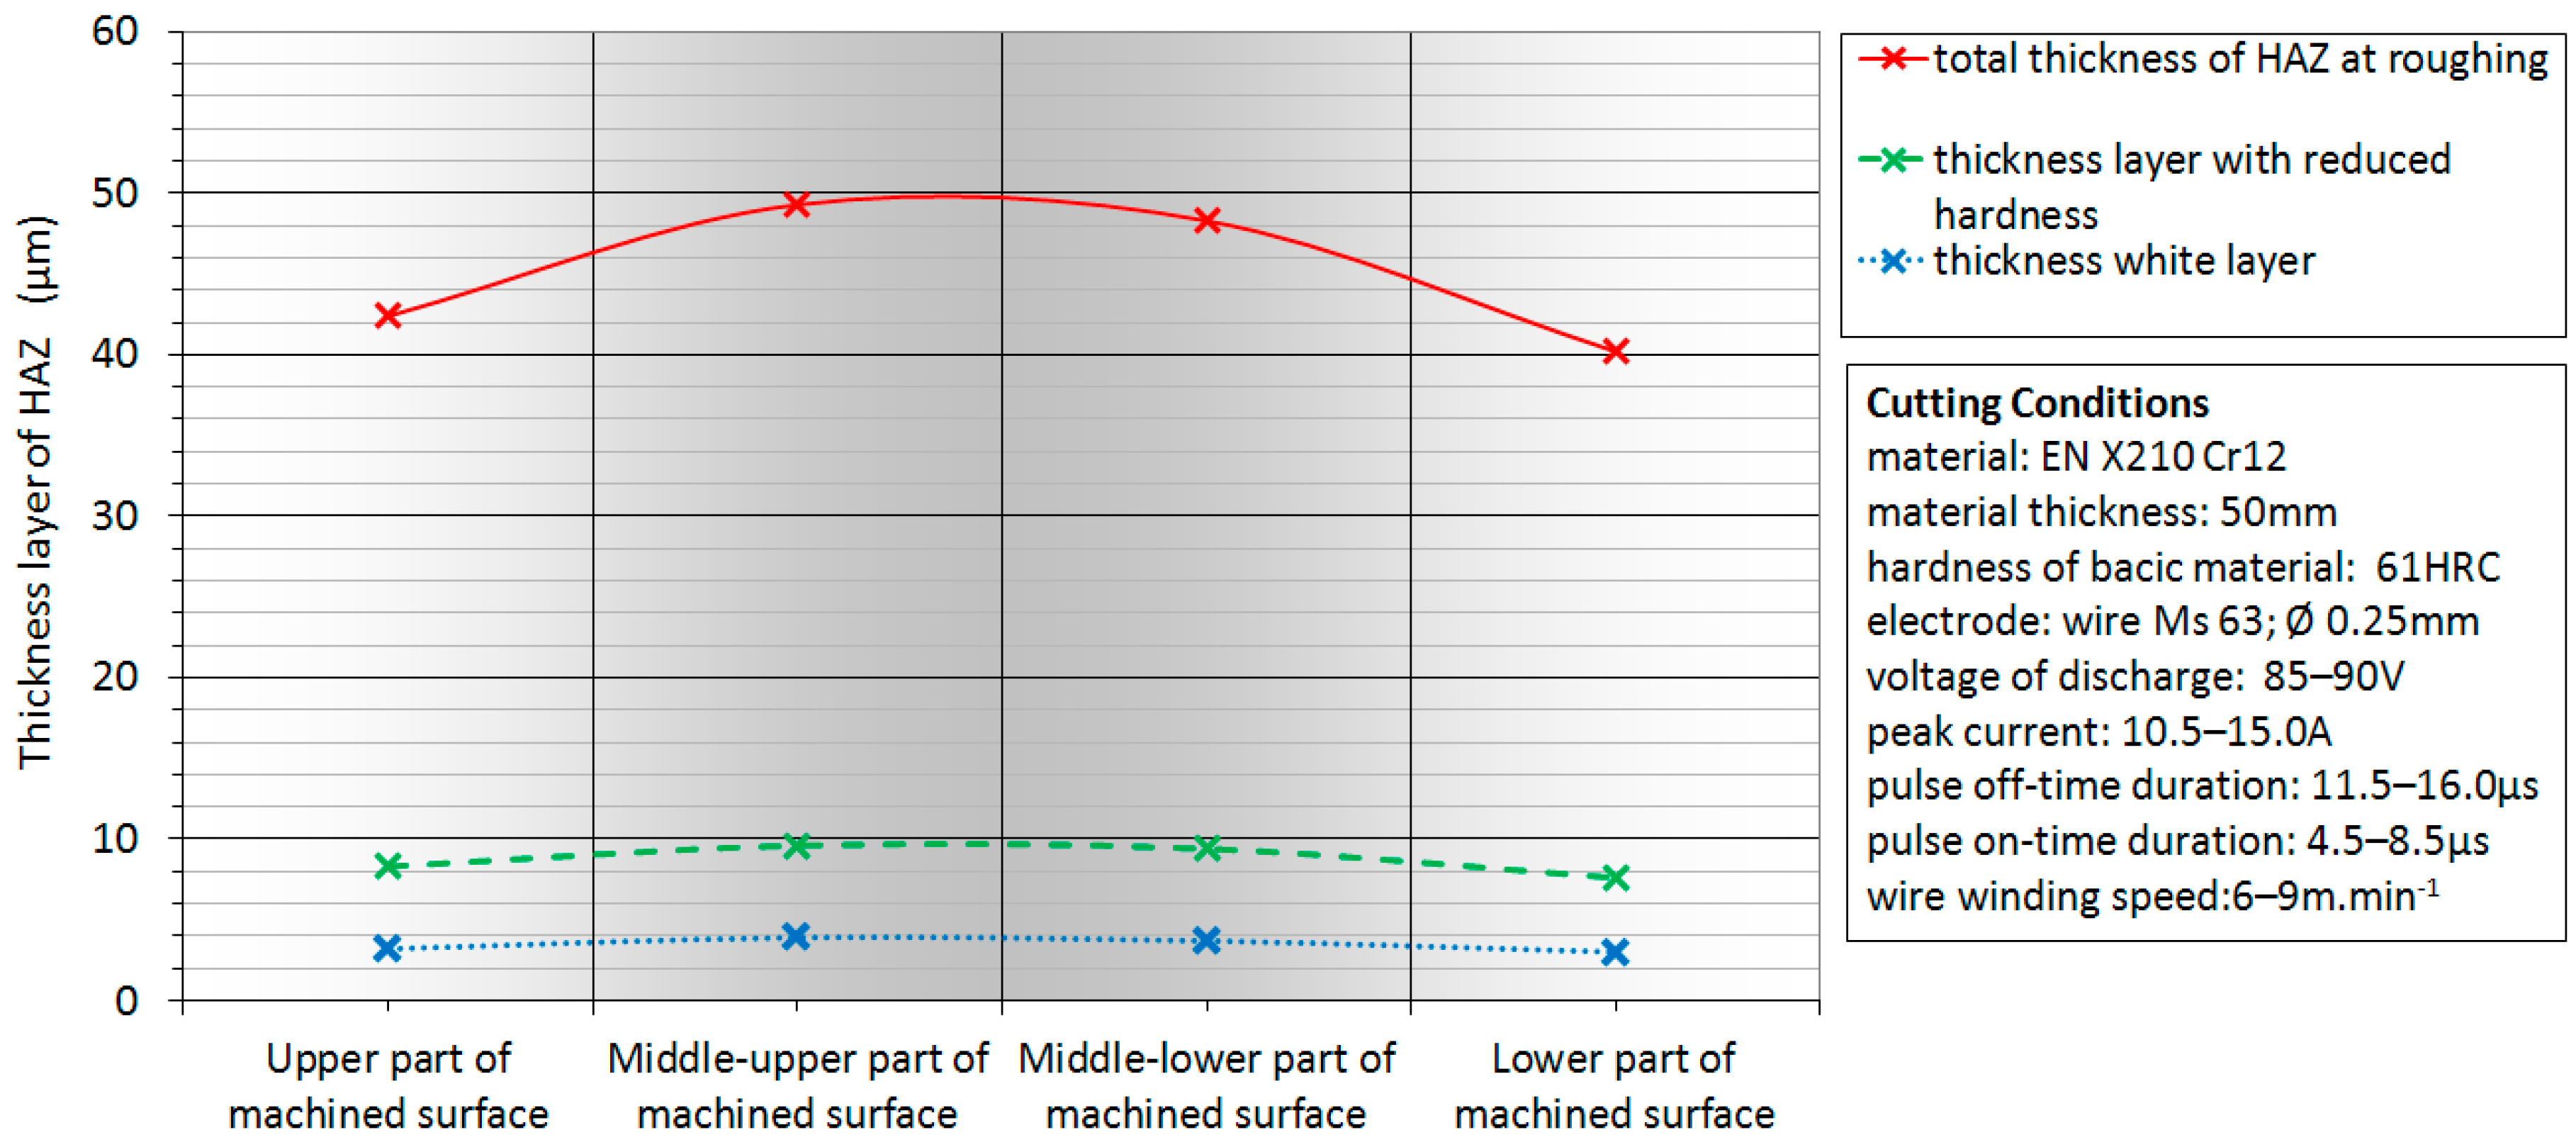
- Differences of measured values of total microhardened surface layer depth were found in particular lines of the cut; marginal parts of eroded surface at 50 mm thickness of the material showed approximately 20% lower values of hHAZ than middle part.
- (iii)
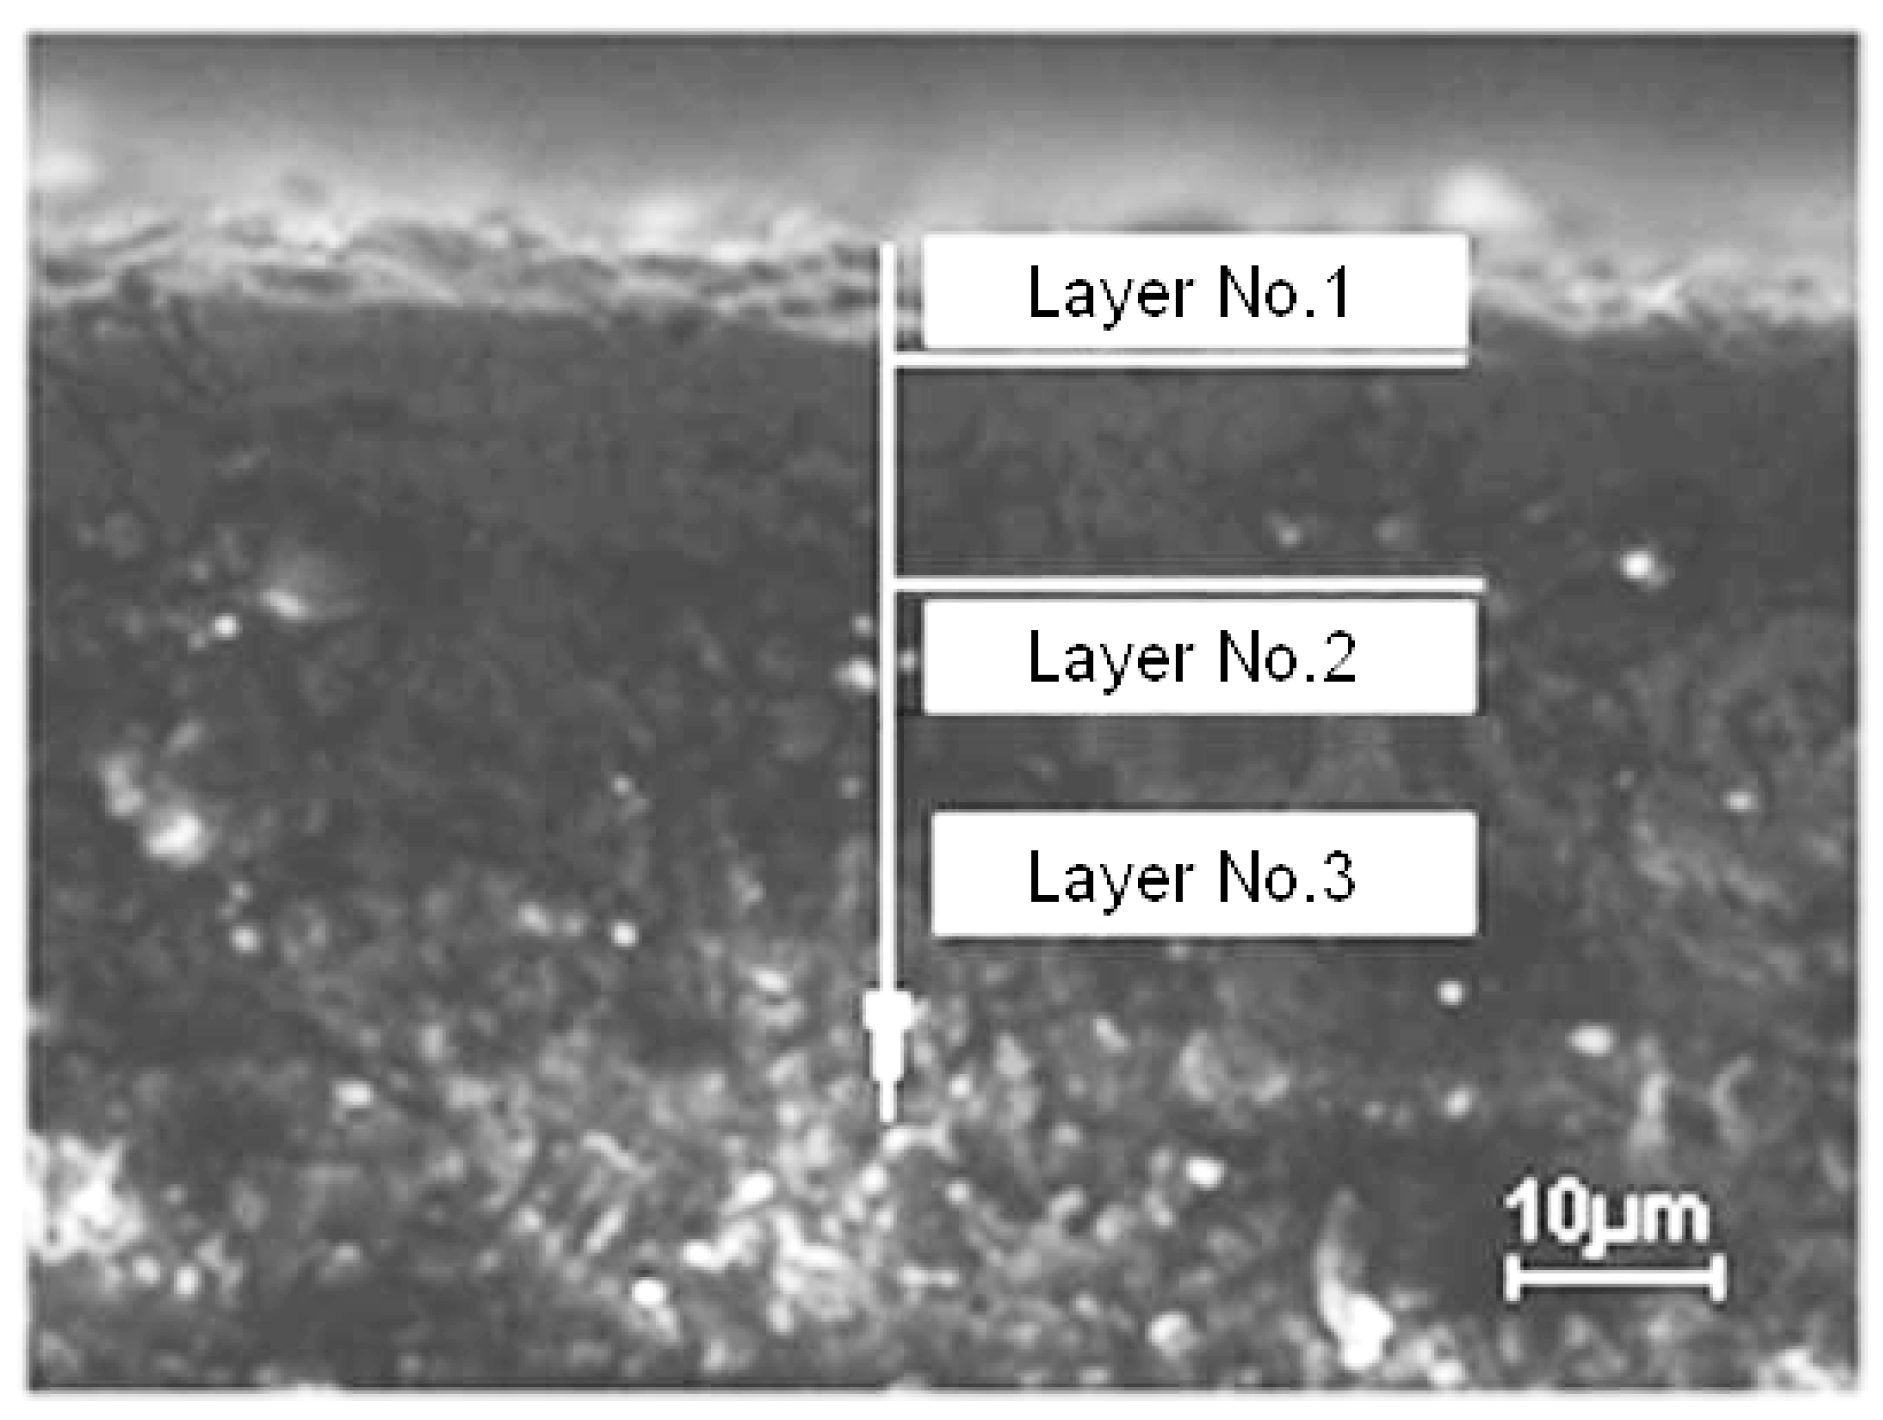
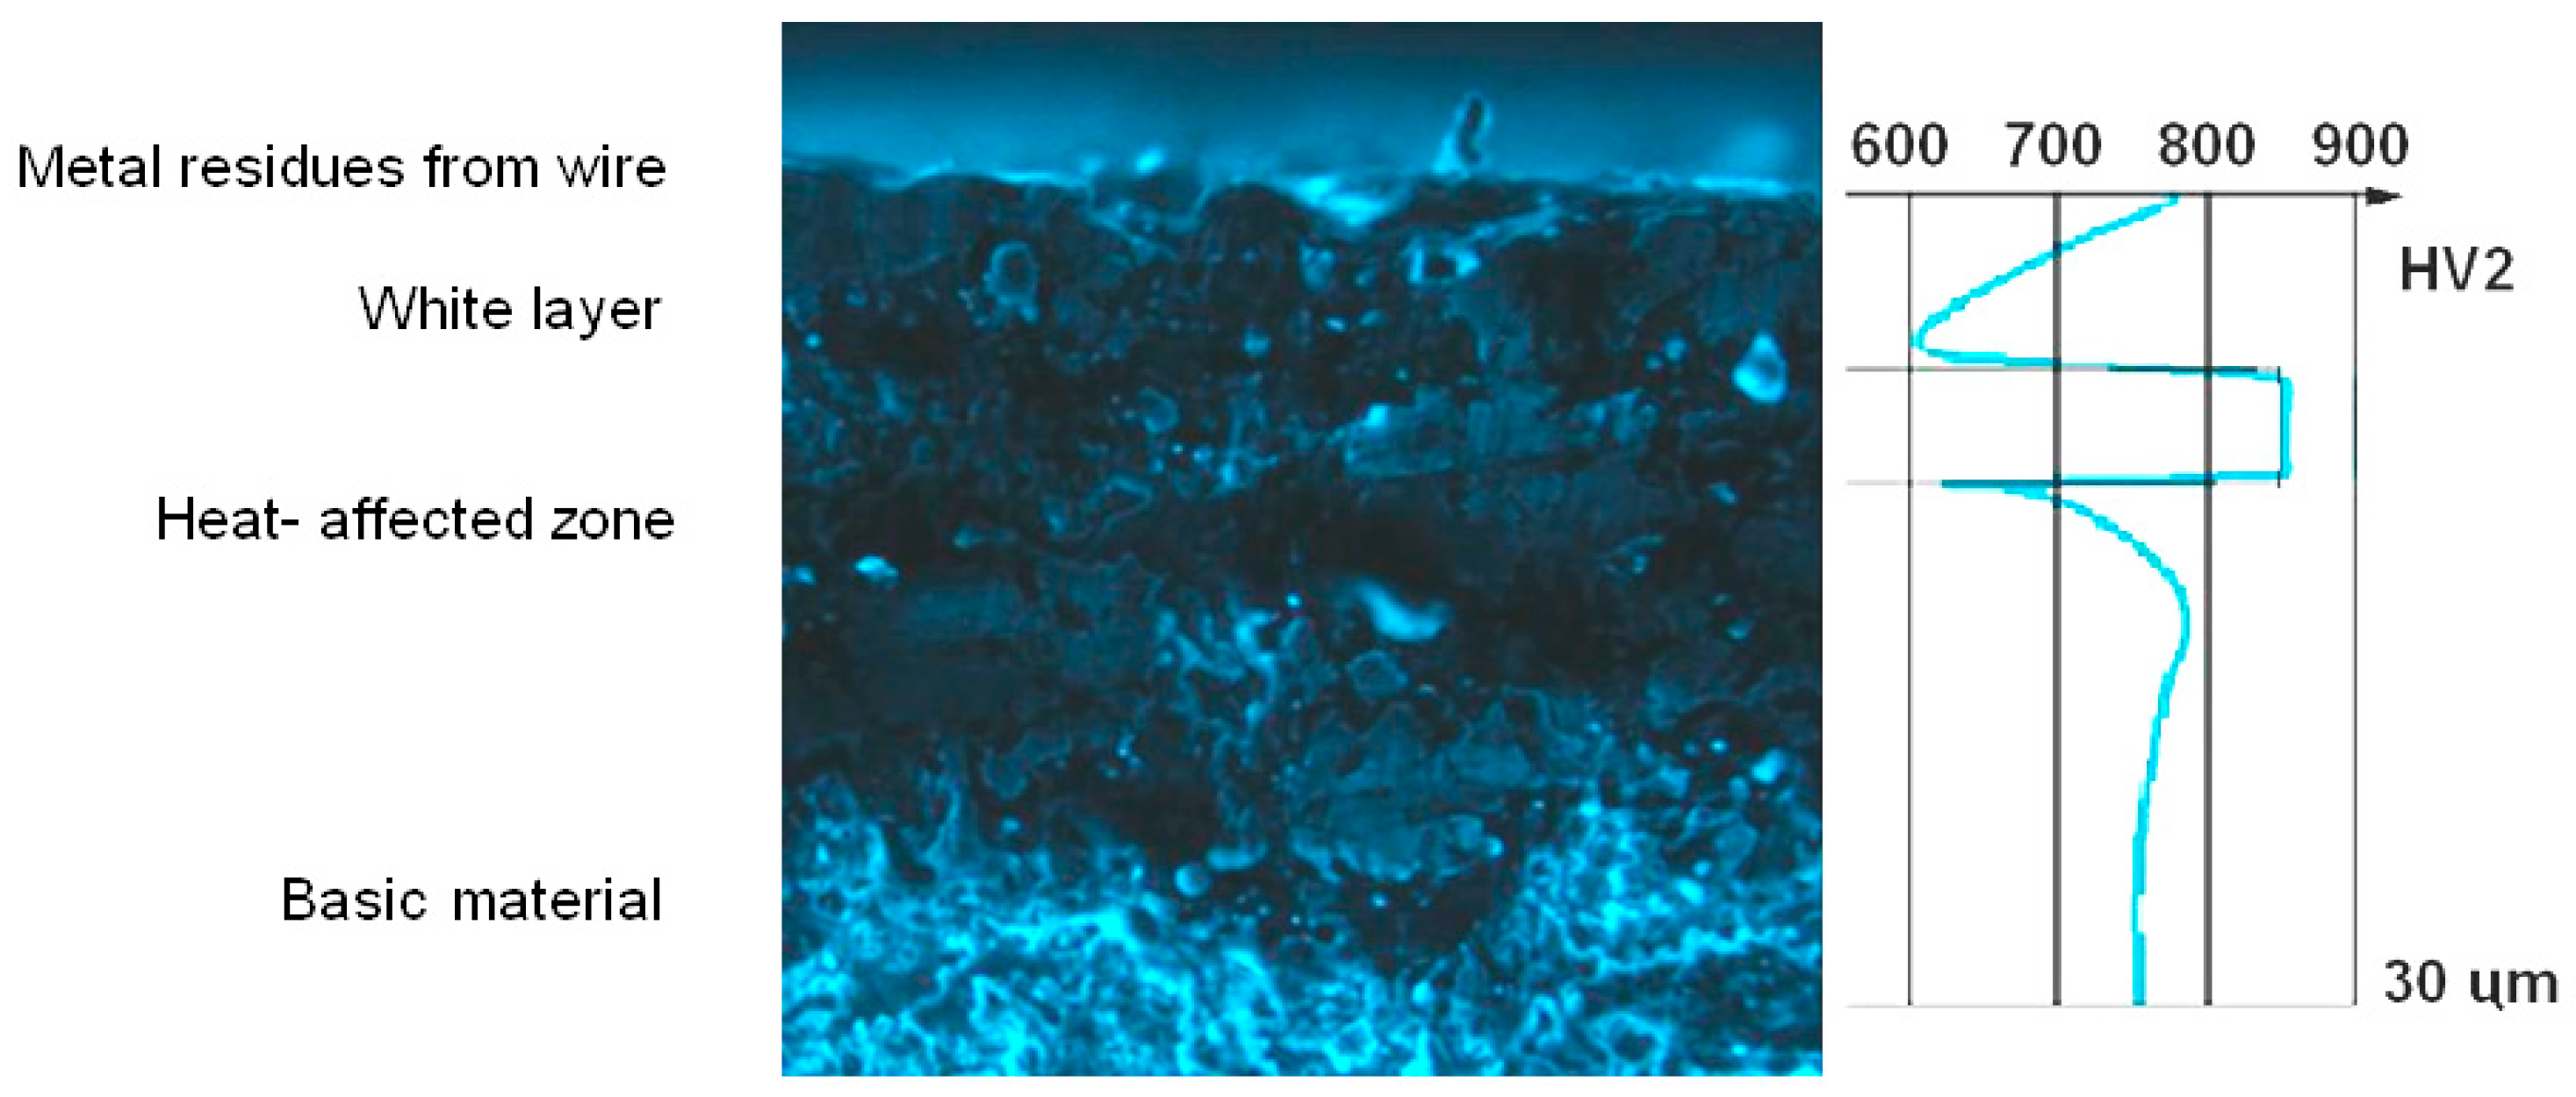
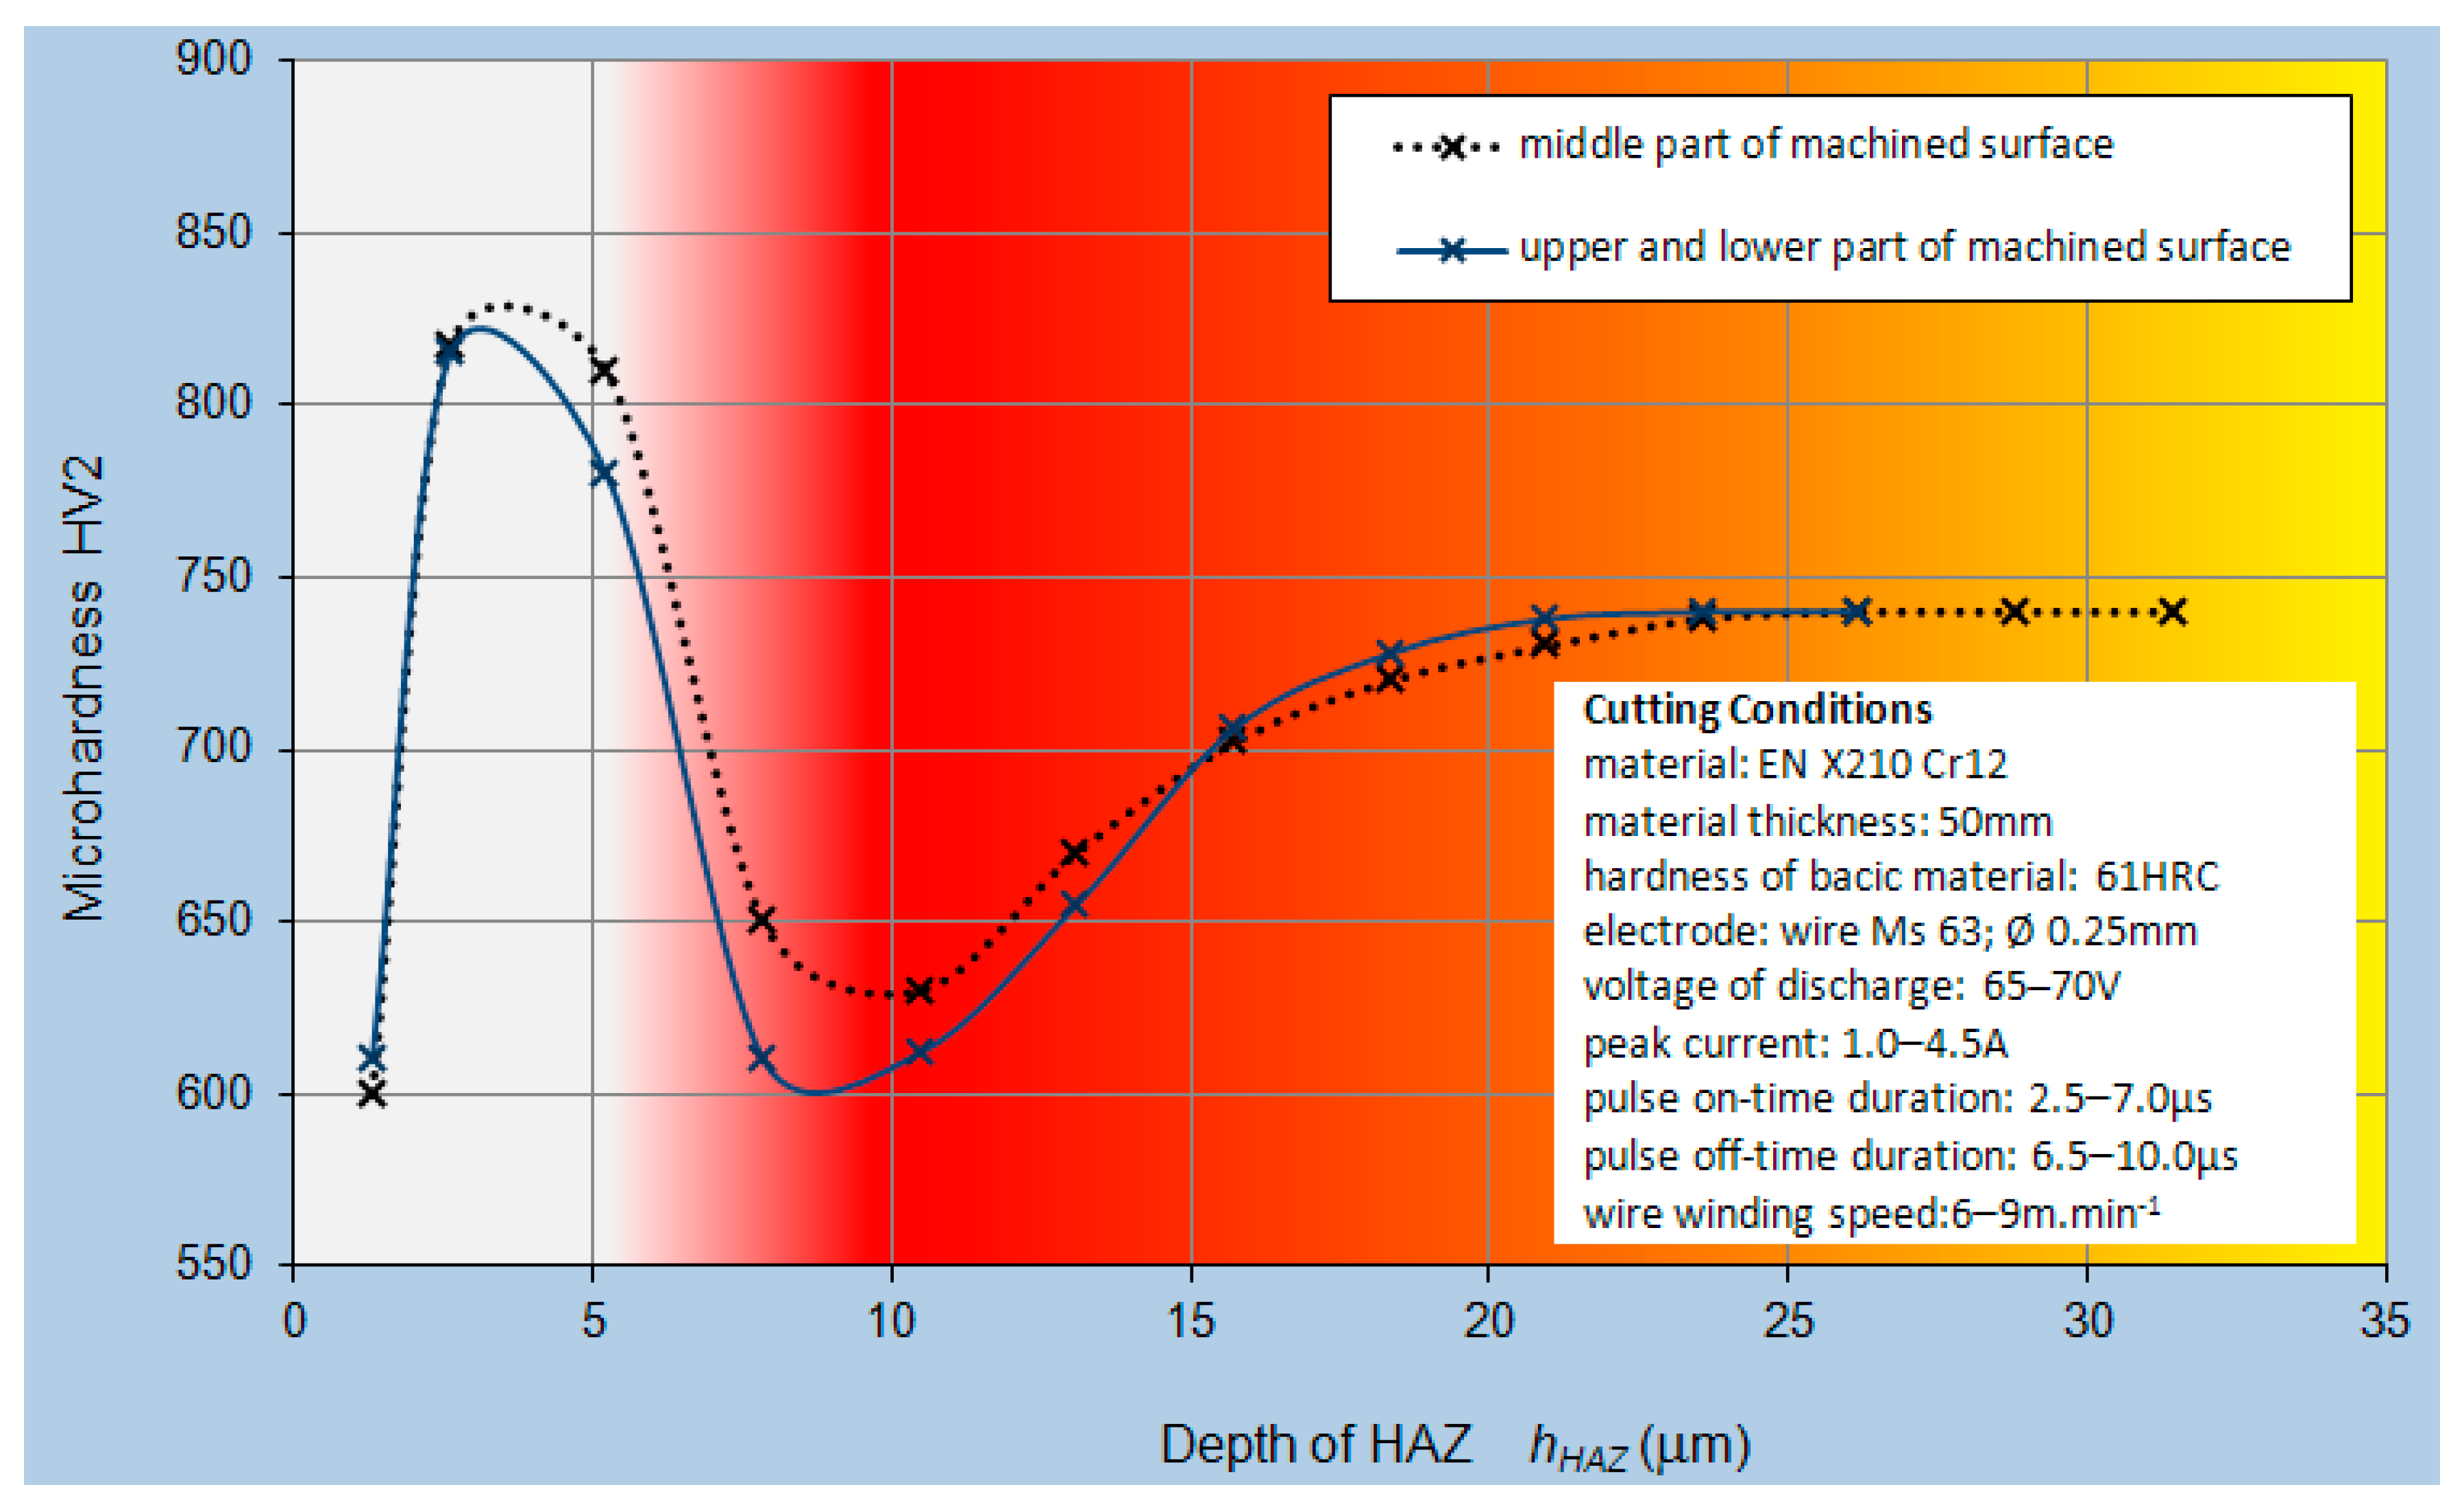
- In the heat affected zone, an essential fluctuation of microhardness was observed considering hardness of basic material, which was on the level approximately 740 HV2; microhardness in the so-called “white layer” zone showed increased values ranging from 870 to 820 HV2. On the contrary, in the transition layer, a microhardness decrease was recorded to the level of 610 to 660 HV2.
- (iv)
- The knowledge gained by the experimental research of heat affected zone of machined surface of tool steel EN X210Cr12 after WEDM concerning microhardness variation and total HAZ depth presents an important contribution, not only on a theoretical level, but also for manufacturing practice: the results of the research will enable meeting tighter quality requirements on machined surface after WEDM and, thus, to achieve higher quality of products in the same time, decreasing the scrap factor.
Acknowledgments
Author Contributions
Conflicts of Interest
Abbreviations
| WEDM | Wire Electrical Discharge Machining |
| CNC | Computer numerical control |
| HAZ | Heat Affected Zone |
| HV2 | Vickers Hardness |
| HRC | Rockwell Hardness |
| LSM | Least Square Method |
| LBM | Beam Machining |
| PAM | Plasma Arc Machining |
References
- Kopac, J. High precision machining on high speed machines. J. Achiev. Mater. Manuf. Eng. 2007, 24, 405–412. [Google Scholar]
- Zhang, J.; Li, Q.; Zhang, H.; Sui, Y.; Yang, H. Investigation of micro square structure fabrication by applying textured cutting tool in WEDM. Micromachines 2015, 6, 1427–1434. [Google Scholar] [CrossRef]
- Maňková, I. Progressive Technologies, 1st ed.; SjF TUKE: Kosice, Slovakia, 2000; p. 275. [Google Scholar]
- Fernández, P.; Blanco, D.; Rico, C.; Valiño, G.; Mateos, S. Influence of surface position along the working range of conoscopic holography sensors on dimensional verification of AISI 316 wire EDM machined surfaces. Sensors 2014, 14, 4495–4512. [Google Scholar] [CrossRef] [PubMed]
- Zaborowski, T.; Jurko, J.; Panda, A. Damage-Wear of the Cutting Tool, 1st ed.; IBEN Gorzow Wlkp.: Poznaň, Poland, 2014; p. 127. [Google Scholar]
- Straka, Ľ.; Čorný, I. Heat treating of chrome tool steel before electroerosion cutting with brass electrode. Acta Metall. Slovaca 2009, 15, 180–186. [Google Scholar]
- Ťavodová, M. Research state heat affected zone of the material after wire EDM. Acta Fac. Tech. 2014, 19, 145–152. [Google Scholar]
- Mičietová, A.; Neslušan, M.; Čilliková, M. Influence of surface geometry and structure after non-conventional methods of parting on the following milling operations. Manuf. Technol. 2013, 13, 199–204. [Google Scholar]
- Zajac, J.; Mitaľ, D.; Radchenko, S.; Jadušová, A.; Straka, R. Study of the subsurface layers of the structural ceramics WC–Co alloyed by laser. In Proceeding of the IEEE 17th International Conference on Intelligent Engineering Systems, San José, Costa Rica, 19–21 June 2013; pp. 307–310.
- Shrestha, T.; Alsagabi, S.F.; Charit, I.; Potirniche, G.P.; Glazoff, M.V. Effect of heat treatment on microstructure and hardness of grade 91 steel. Metals 2015, 5, 131–149. [Google Scholar] [CrossRef]
- Cusanelli, G.; Hessler-Wyser, A.; Bobard, F.; Demellayer, R.; Perez, R.; Flükiger, R. Microstructure at submicron scale of the white layer produced by EDM technique. J. Mater. Process. Technol. 2004, 1, 289–295. [Google Scholar] [CrossRef]
- Hargrove, S.K.; Ding, D. Determining cutting parameters in wire EDM based on workpiece surface temperature distribution. Int. J. Adv. Manuf. Technol. 2007, 34, 295–299. [Google Scholar] [CrossRef]
- Liu, J.F.; Guo, Y.B. Surface integrity evolution from main cut mode to finish trim cut mode in W-EDM of shape memory alloy. Appl. Surf. Sci. 2014, 308, 253–260. [Google Scholar] [CrossRef]
- Švecová, V.; Madaj, M. Surface characteristics evaluation of the VANADIS 23 high speed steel punch after Wire Electrical Discharge Machining. Stroj. Technol. 2012, 40–41. [Google Scholar]
- Valentinčič, J.; Brissaud, D.; Junkar, M. EDM process adaptation system in toolmaking industry. J. Mater. Process. Technol. 2005, 2, 291–298. [Google Scholar] [CrossRef]
- Čada, R.; Zlámalík, J. Materials comparison of cutting tools functional parts for cutting of electrical engineering sheets. Trans. VŠB–Ostrava Mech. Ser. 2012, 33–41. [Google Scholar]
- Ramesh, S.; Natarajan, N.; Krishnaraj, V. Effect of multipass cutting on surface roughness in wire electrical discharge machining of metal matrix composites. Carbon Sci. Technol. 2014, 3, 14–21. [Google Scholar]
- Sidhom, H. Effect of electro discharge machining (EDM) on the AISI316L SS white layer microstructure and corrosion resistance. Int. J. Adv. Manuf. Technol. 2012, 1–4, 141–153. [Google Scholar] [CrossRef]
- Ho, K.H.; Newman, S.T. State of the art electrical discharge machining (EDM). Int. J. Mach. Tools Manuf. 2003, 13, 1287–1300. [Google Scholar] [CrossRef]
- Puri, A.B.; Bhattacharyya, B. Modeling and analysis of white layer depth in a wire-cut EDM process through response surface methodology. Int. J. Adv. Manuf. Technol. 2005, 3–4, 301–307. [Google Scholar] [CrossRef]
- Dewangan, S.; Gangopadhyay, S.; Biswas, C.K. Study of surface integrity and dimensional accuracy in EDM using Fuzzy TOPSIS and sensitivity analysis. Measurement 2015, 63, 364–376. [Google Scholar] [CrossRef]
- Kiyak, M.; Cakir, O. Examination of machining parameters on surface roughness in EDM of tool steel. J. Mater. Process. Technol. 2007, 1–3, 41–144. [Google Scholar] [CrossRef]
- Mathew, S.; Varma, P.R.D.; Kurian, P.S. Study on the Influence of process parameters on surface roughness and MRR of AISI 420 stainless steel machined by EDM. Int. J. Eng. Trends Technol. 2014, 2, 54–58. [Google Scholar] [CrossRef]
- Choudhary, R.; Kumar, H.; Gark, R.K. Analysis and evaluation of heat affected zones in electric discharge machining of EN-31 die steel. Indian J. Eng. Mater. Sci. 2010, 2, 91–98. [Google Scholar]
- Ma, A.; Zhu, C.; Chen, J.; Jiang, J.; Song, D.; Ni, S.; He, Q. Grain refinement and high-performance of equal-channel angular pressed Cu–Mg alloy for electrical contact wire. Metals 2014, 4, 586–596. [Google Scholar] [CrossRef]
- Chotěborský, R.; Linda, M.; Ružbarský, J.; Muller, M. Modelling of the anisothermal phase transformation of austenite by electromagnetic sensor. Appl. Mech. Mater. 2014, 616, 44–51. [Google Scholar] [CrossRef]
- Tie, D.; Guan, R.G.; Guo, N.; Zhao, Z.; Su, N.; Li, J.; Zhang, Y. Effects of different heat treatment on microstructure, mechanical and conductive properties of continuous Rheo-extruded Al-0.9Si-0.6Mg (wt %) alloy. Metals 2015, 5, 648–655. [Google Scholar] [CrossRef]
- Orečny, M.; Buršak, M.; Viňaš, J. The influence of heat treatment on the abrasive wear resistance of a construction and a tool steel. Metalurgija 2015, 54, 91–193. [Google Scholar]
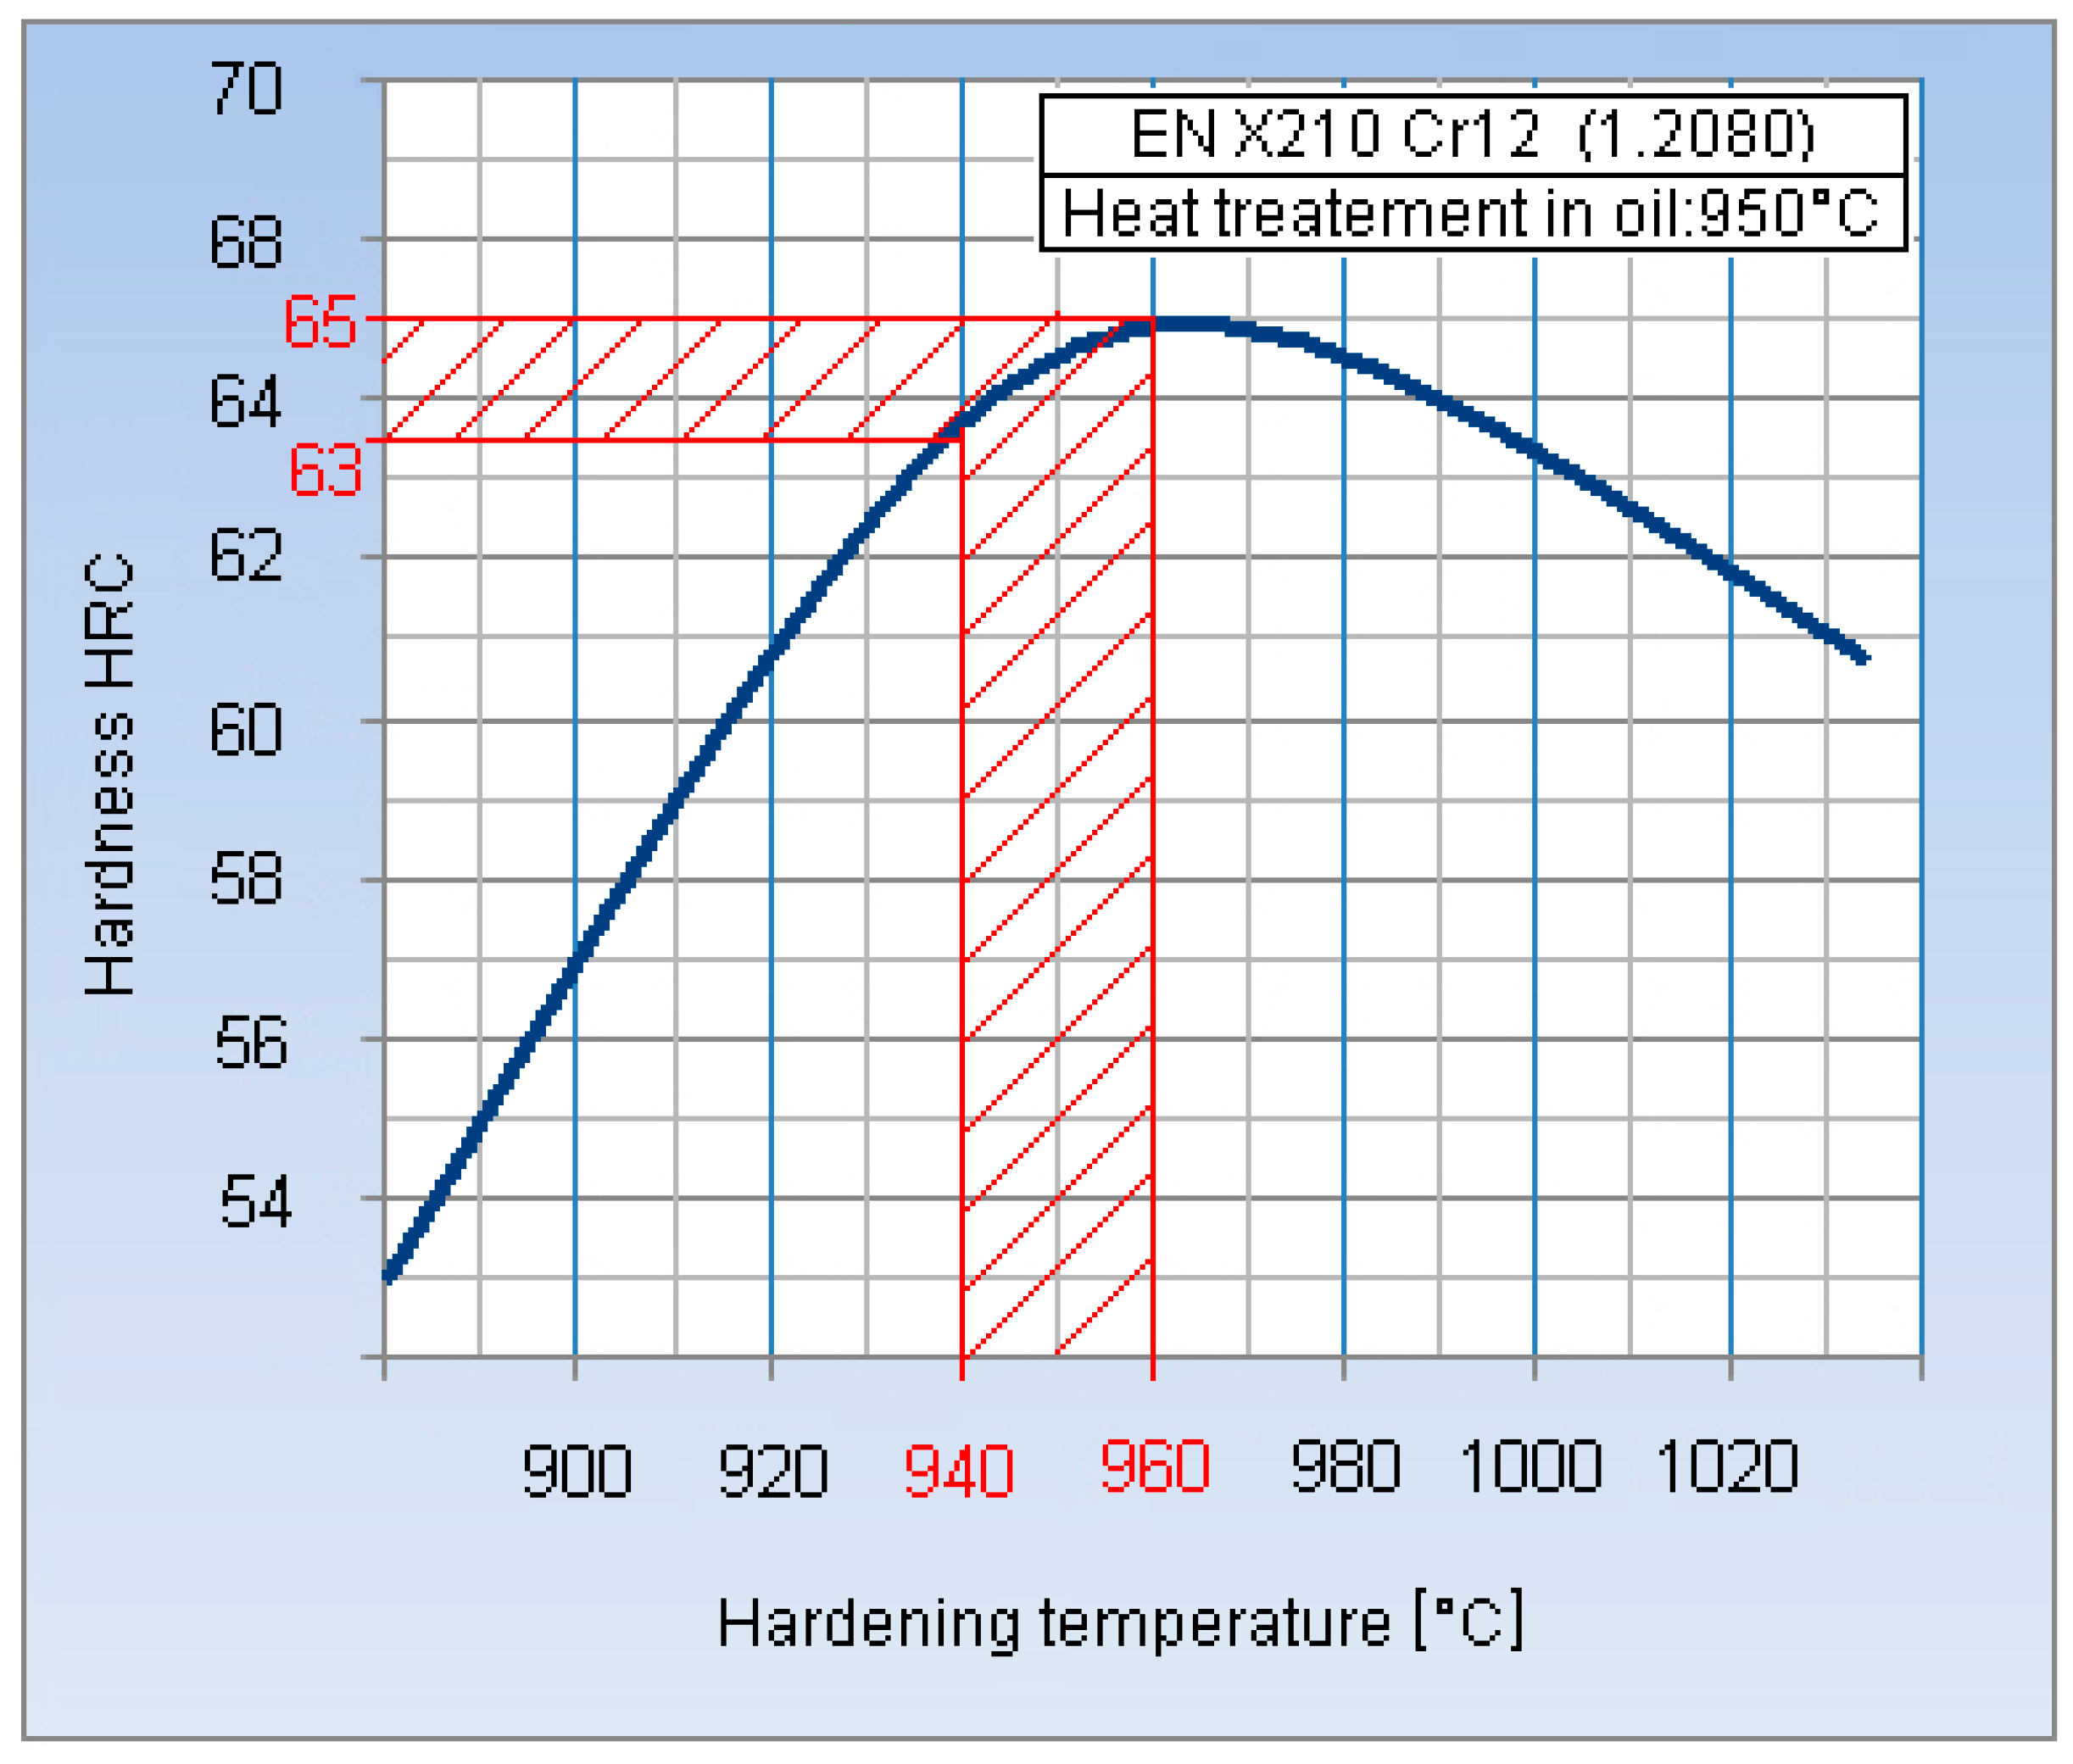
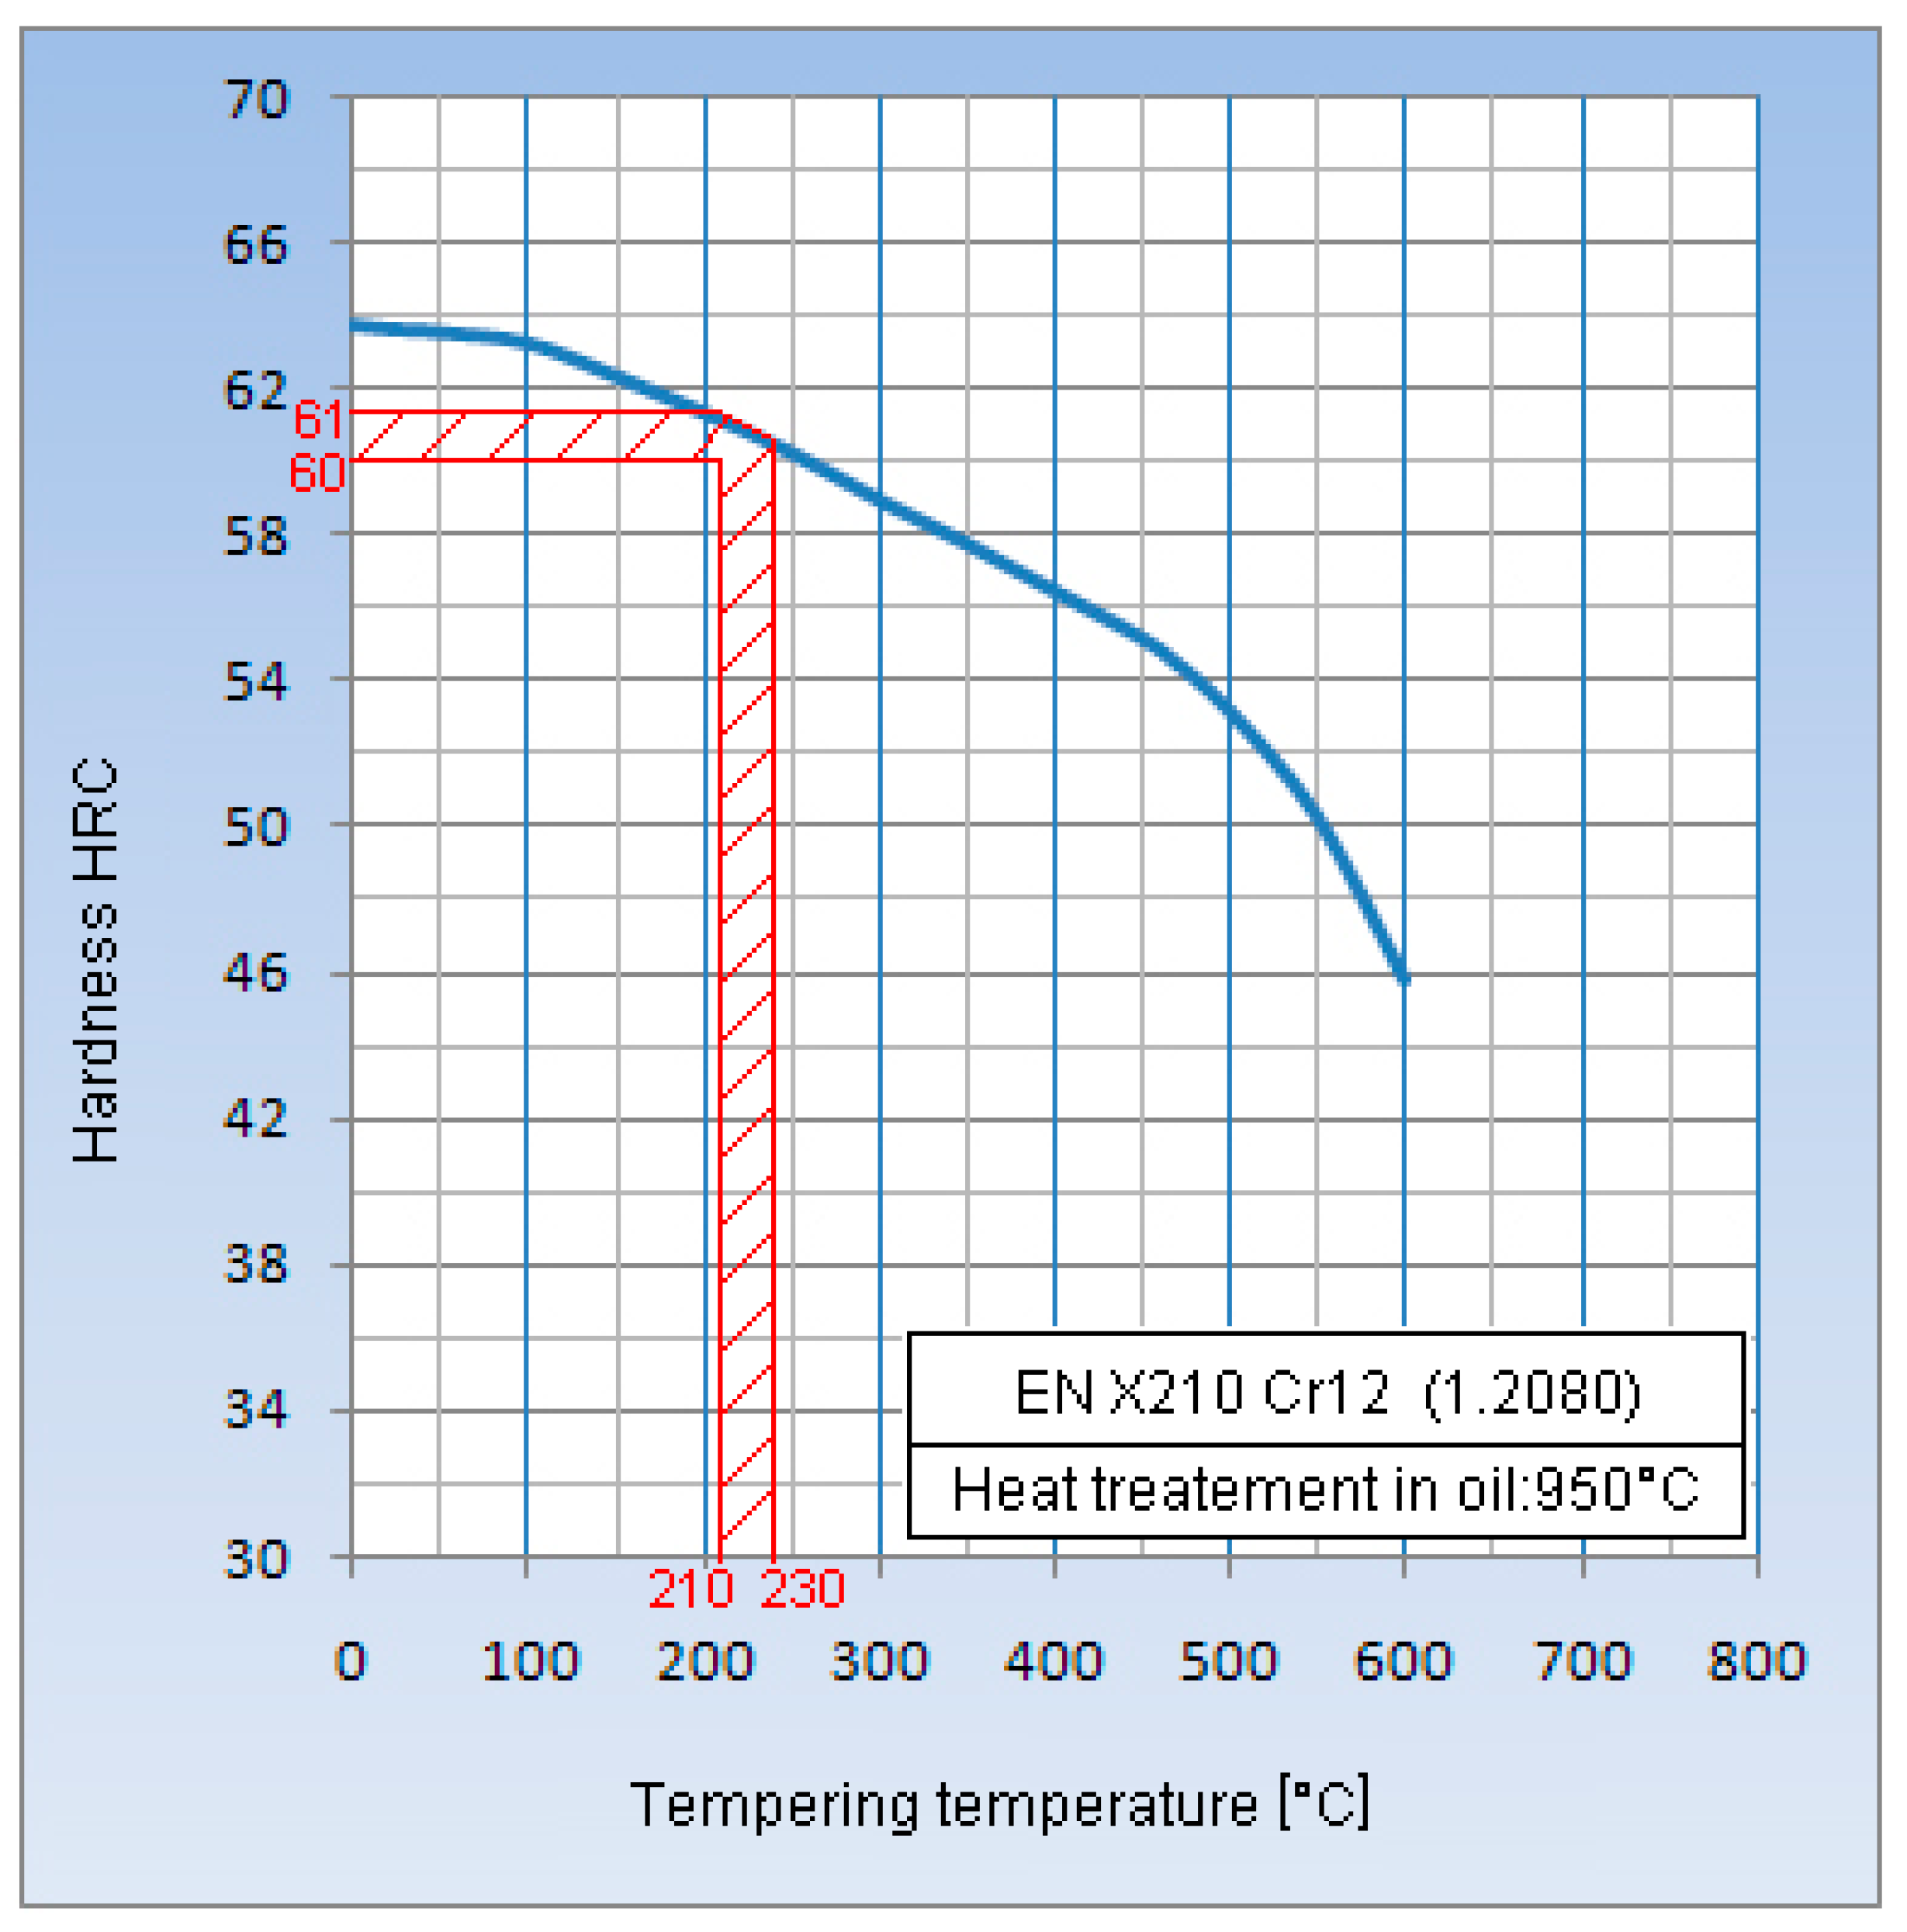
- Material Card of Steel EN X210Cr12. Available online: http://www.usbcosteels.com/pdffile/OCR12.pdf (accessed on 18 April 2016).
- Kim, J.M.; Ha, T.H.; Park, J.S.; Kim, H.G. Effect of laser surface treatment on the corrosion behavior of FeCrAl-coated TZM alloy. Metals 2016, 6, 29. [Google Scholar] [CrossRef]
- Straka, Ľ.; Hašová, S. Study of tool electrode wear in EDM process. Key Eng. Mater. 2016, 669, 302–310. [Google Scholar] [CrossRef]
- STN ISO 6507 Hardness Measurement. Available online: http://infostore.saiglobal.com/store/PreviewDoc.aspx?saleItemID=40729 (accessed on 18 April 2016).
- Che Haron, C.H. Investigation on the influence of machining parameters when machining tool steel using EDM. J. Mater. Process. Tech. 2001, 1, 84–87. [Google Scholar] [CrossRef]
- Yan, B.H.; Tsai, H.C.; Huang, F.Y. The effect in EDM of a dielectric of a urea solution in water on modifying the surface of titanium. Int. J. Mach. Tool Manuf. 2005, 2, 194–200. [Google Scholar] [CrossRef]
- Mižáková, J.; Hošovský, A.; Piteľ, J. Modeling of heat transfer through the wall for simulation of heating process control. In Trudy IX Meždunarodnoj Naučno-Techničeskoj Konferencii; Donskoj gosudarstvennij techničeskij universitet: Rostov Na Donu, Russia, 2010; pp. 298–301. [Google Scholar]
- Saha, S.K.; Chaudhary, S.K. Experimental investigation and empirical modeling of the dry electrical discharge machining process. Int. J. Mach. Tools Manuf. 2009, 49, 297–308. [Google Scholar] [CrossRef]
- Straka, Ľ.; Čorný, I. Mathematical model of influence of cutting current on machined surface roughness at electro-erosion cutting. In Operation and Diagnostics of Machines and Production Systems Operational States; Scientific Papers; Lüdenscheid: RAM-Verlag, Germany, 2009; pp. 71–77. [Google Scholar]
- Mahapatra, S.S.; Patnaik, A. Optimization of wire electrical discharge machining (WEDM) process parameters using Taguchi method. Int. J. Adv. Manuf. Technol. 2007, 34, 911–925. [Google Scholar] [CrossRef]


| Designation of Steel | Chemical Composition in (%) | Hardness | |||||||
|---|---|---|---|---|---|---|---|---|---|
| C | Mn | Si | Cr | Ni | Pmax | Smax | Annealed HBmax | Heat-Treated HRCmin | |
| EN X210Cr12 (W.-Nr. 1.2080) | 1.80–2.05 | 0.20–0.45 | 0.02–0.45 | 11.0–12.5 | 0.5 | 0.03 | 0.035 | 250 | 61 |
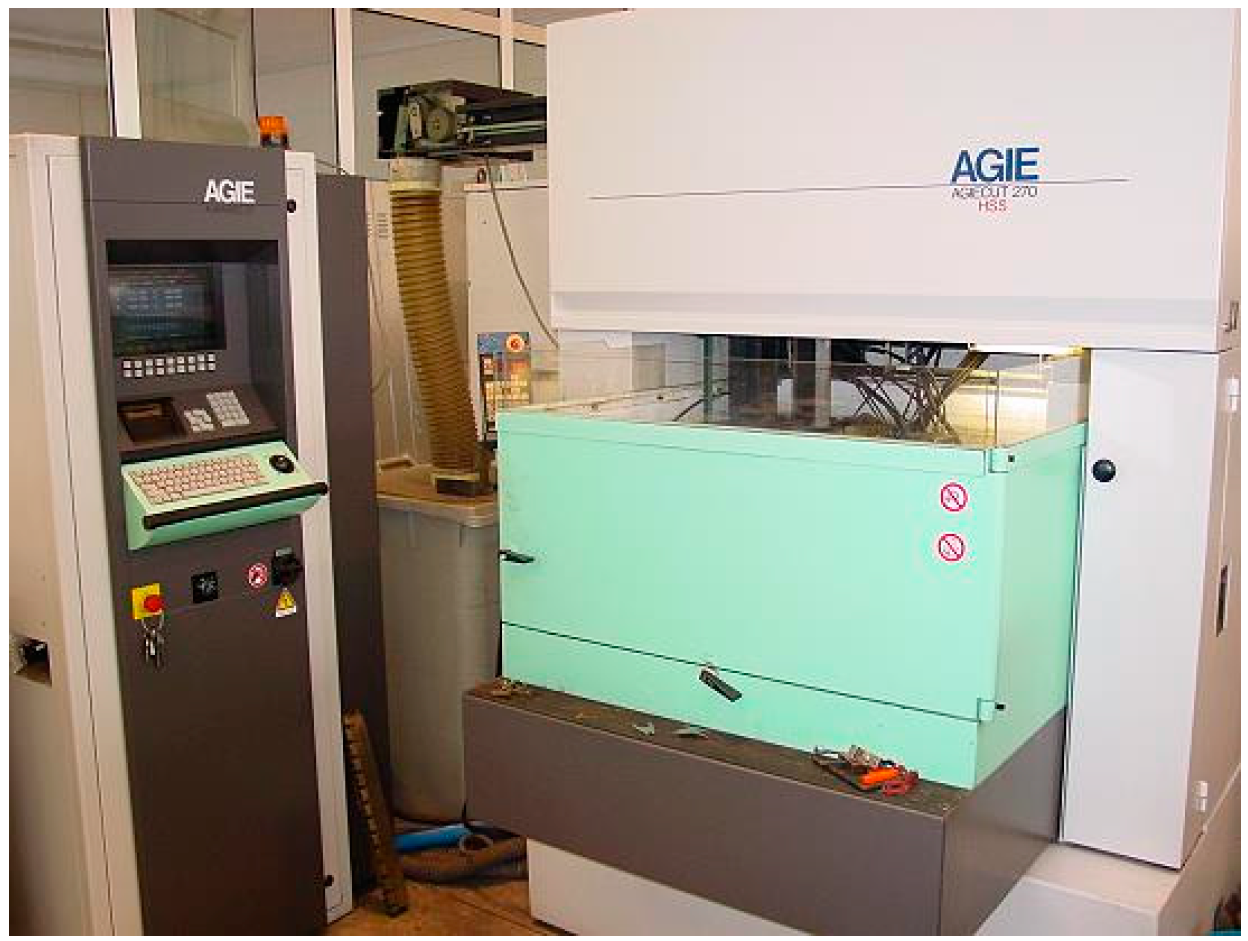
| Technical Parameter | Maximum Range |
|---|---|
| portal dimensions X/Y/Z | 400/250/251 mm |
| workpiece dimensions X/Y/Z | 1050/650/250 mm |
| workpiece weight | 400 kg |
| inclination angle | 30/100 mm |
| wire diameter | 0.1–0.3 mm |
| shape tolerance | ±3 µm |
| Main Technological Parameters | Type of Operation | Setting Range | Influence of Technological Parameter on HAZ |
|---|---|---|---|
| Maximum peak current I (A) | roughing | 10.5–15.0 | With increase of I value, total HAZ depth grows markedly |
| finishing | 1.0–4.5 | ||
| Pulse on-time duration ton (μs) | roughing | 11.5–16.0 | With increase of ton value, total HAZ depth grows markedly |
| finishing | 2.5–7.0 | ||
| Pulse off-time duration toff (μs) | roughing | 4.5–8.5 | With increase of toff value, total HAZ depth reduces slightly |
| finishing | 6.5–10.0 | ||
| Voltage of discharge U(V) | roughing | 85–90 | With increase of U value, total HAZ depth grows slightly |
| finishing | 65–70 |
© 2016 by the authors; licensee MDPI, Basel, Switzerland. This article is an open access article distributed under the terms and conditions of the Creative Commons Attribution (CC-BY) license (http://creativecommons.org/licenses/by/4.0/).
Share and Cite
Straka, Ľ.; Čorný, I.; Piteľ, J. Properties Evaluation of Thin Microhardened Surface Layer of Tool Steel after Wire EDM. Metals 2016, 6, 95. https://doi.org/10.3390/met6050095
Straka Ľ, Čorný I, Piteľ J. Properties Evaluation of Thin Microhardened Surface Layer of Tool Steel after Wire EDM. Metals. 2016; 6(5):95. https://doi.org/10.3390/met6050095
Chicago/Turabian StyleStraka, Ľuboslav, Ivan Čorný, and Ján Piteľ. 2016. "Properties Evaluation of Thin Microhardened Surface Layer of Tool Steel after Wire EDM" Metals 6, no. 5: 95. https://doi.org/10.3390/met6050095
APA StyleStraka, Ľ., Čorný, I., & Piteľ, J. (2016). Properties Evaluation of Thin Microhardened Surface Layer of Tool Steel after Wire EDM. Metals, 6(5), 95. https://doi.org/10.3390/met6050095