Article

Tensile Fracture Behavior of Progressively-Drawn Pearlitic Steels

Fracture & Structural Integrity Research Group, University of Salamanca, E.P.S., Campus Viriato, Avda. Requejo 33, Zamora 49022, Spain
*
Author to whom correspondence should be addressed.
Metals 2016, 6(5), 114; https://doi.org/10.3390/met6050114
Submission received: 31 March 2016 / Revised: 8 May 2016 / Accepted: 10 May 2016 / Published: 17 May 2016
(This article belongs to the Special Issue Microalloyed Steel)

Abstract

:
In this paper a study is presented of the tensile fracture behavior of progressively-drawn pearlitic steels obtained from five different cold-drawing chains, including each drawing step from the initial hot-rolled bar (not cold-drawn at all) to the final commercial product (pre-stressing steel wire). To this end, samples of the different wires were tested up to fracture by means of standard tension tests, and later, all of the fracture surfaces were analyzed by scanning electron microscopy (SEM). Micro-fracture maps (MFMs) were assembled to characterize the different fractographic modes and to study their evolution with the level of cumulative plastic strain during cold drawing.

1. Introduction

Pearlitic steels are widely used in a high variety of applications in engineering, e.g., pre-stressing steel wires [1,2], railway rails [3,4,5], rock bolts [6], steel cord wires (tire reinforcement) [7], music wires [8], etc. The wide use of these types of steels is due to their excellent mechanical properties induced in the raw material during the mechanical conforming process, e.g., hot rolling for complex shapes or wire drawing in the case of cylindrical bars. As a result of the plastic strains undergone by the material during the latter process, the yield stress is high enough [9] for considering it as a high strength steel. The today importance of these steels in industry can be quantified in terms of the world production of drawn wires of pearlitic steels which can be estimated in 25 million tons per year [10]. In addition, the interest of the scientific community on these research areas is also very high, as indicated by the number of research papers published up to date in multiple journals indexed in the SCOPUS database (Figure 1).
Consequently, from a pure scientific point of view, increasing the knowledge about pearlitic steel wires is a quite interesting issue. In a common commercial wire drawing chain, wires undergo a progressive reduction of their cross-sectional area during several steps (usually 6–8 passes) [11]. As a consequence of material hardening due to huge plastic strains in the wire, key microstructural changes are caused in the steels as was reported in many studies [12,13,14,15,16,17,18,19]. The analyses of such changes revealed a progressive increment of the microstructural anisotropy as the drawing degree is increased. These microstructural changes also affect the macroscopic mechanical behavior of the material [20,21,22], as in their fatigue and fracture behavior [23,24,25,26,27].
This paper goes further in the research, so that a study is presented of the tensile fracture behavior of progressively-drawn pearlitic steels obtained from five different real cold drawing chains, including each drawing step from the initial hot-rolled bar (not cold-drawn at all) to the final commercial product (pre-stressing steel wire).
For this purpose, standard tension tests up to final fracture were carried out for each one of the wires corresponding to each step of the five commercial wire drawing chains considered in this study. On one hand, results of testing allow one to obtain the mechanical properties—material yield strength (σY) and ultimate tensile strength (UTS, σR)—of each one of the wires tested from the material constitutive law (stress-strain curve). This mechanical characterization presents a high interest not only from the scientific point of view, but also from the educational viewpoint [28]. On the other hand, the quantitative fractographic analysis (post mortem) of the fracture surfaces of tested samples, obtained by scanning electron microscopy (SEM), allows one to reveal the microscopic fracture maps (MFMs) and the fracture micro-mechanisms. From these analyses, the evolution of both mechanical properties and fracture behavior with drawing will be revealed for different wire drawing processes, thereby achieving a better understanding of the mechanical behavior of these key types of steels.

2. Experimental Program

Cylindrical samples of the wires obtained at the end of each drawing step of the five commercial manufacturing processes were used for testing. Each one of the families of progressively-drawn steels was labelled with a capital letter (A, B, C, D and E). In addition, to identify each particular steel (member of the family), a number was added representing the number of drawing steps undergone by the specific wire. Thus, as a way of example, steel E4 corresponds to a wire obtained after the fourth drawing step of family E. According to Table 1, the chemical composition of the five families of steels is similar with slight variations.
Each one of the raw materials for each family undergoes different straining paths during the manufacturing process by cold drawing. Family A is forced to pass through six drawing dies, whereas the wire drawing of the other families (B, C, D and E) is divided into seven drawing steps. Table 2 summarizes each one of the five cold drawing procedures (straining paths or yielding histories) in terms of the wire diameter at the end of each drawing step.
The cumulative plastic strain εP represents the drawing degree [23], and is defined as follows:
ε P = 2 ln ϕ 0 ϕ i
where ϕ 0 is the hot-rolled bar diameter (not cold drawn at all) and ϕ i is the diameter of a wire undergoing i drawing steps. Results for the different drawn wires are given in Table 3.
Standard tension tests were performed up to final fracture. Three tests were made for each drawing step (thus, as many as 117 standard tension tests were performed in the mechanical characterization, a huge collection of statistical quantitative data).

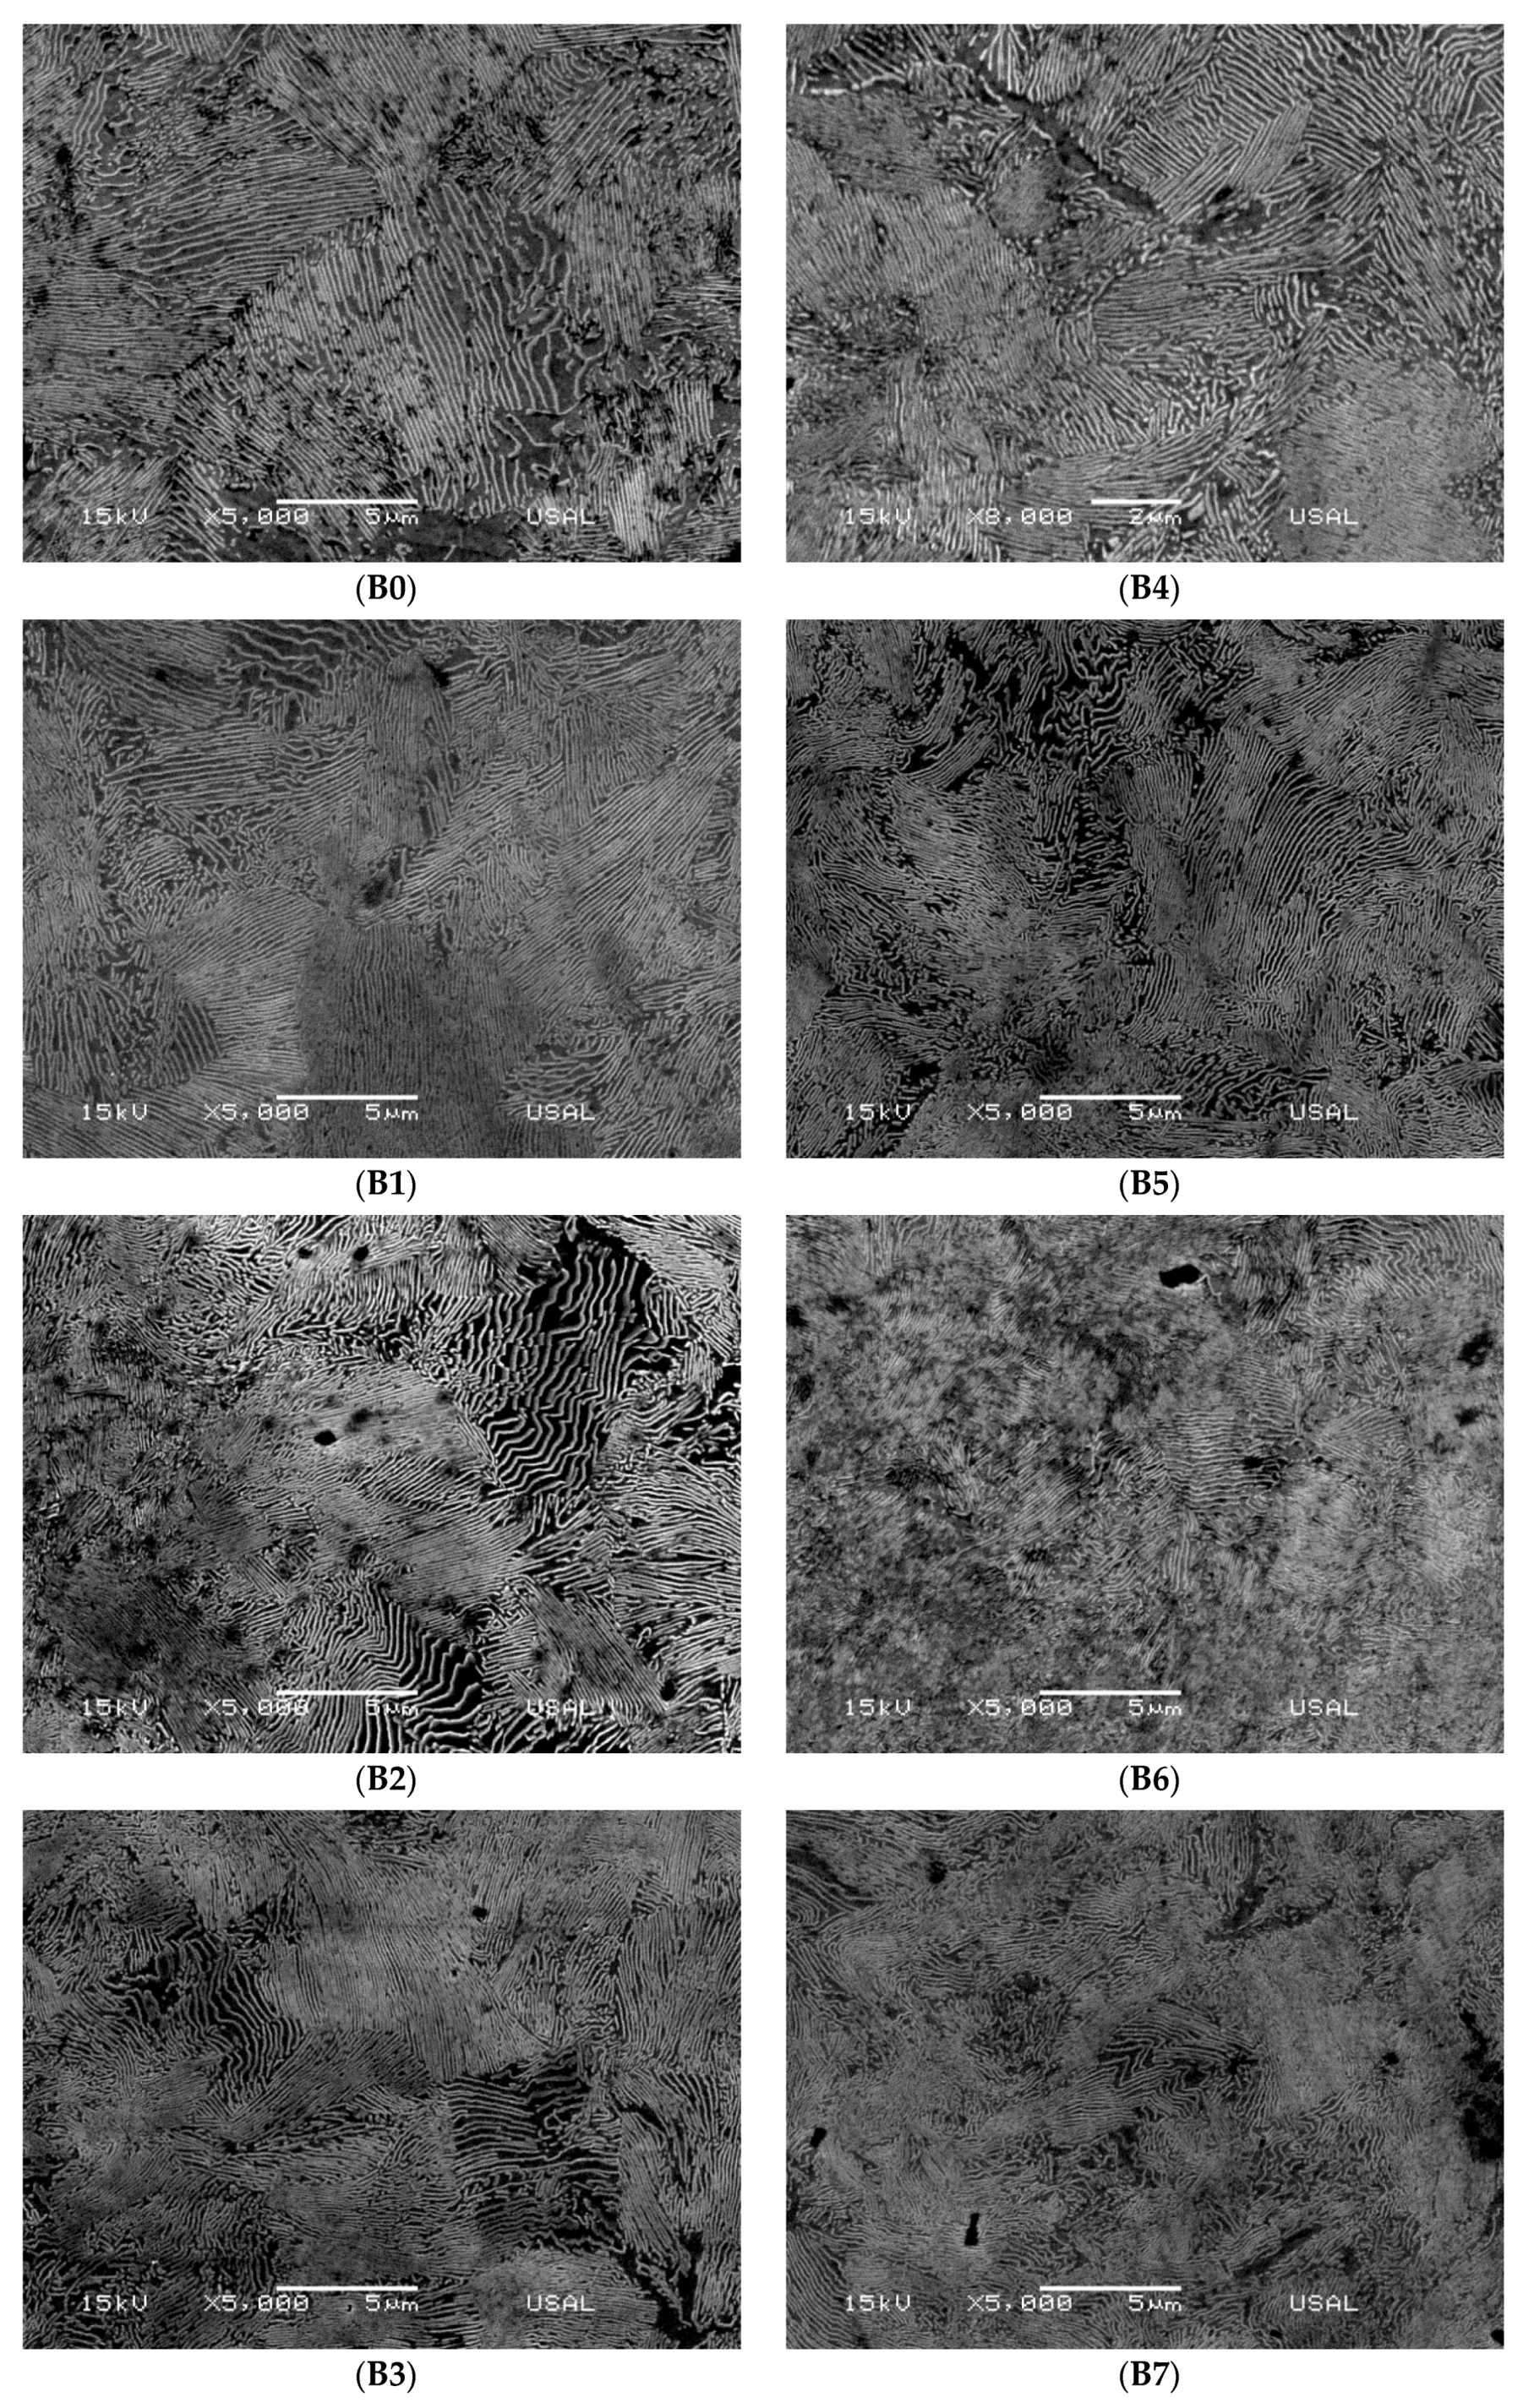
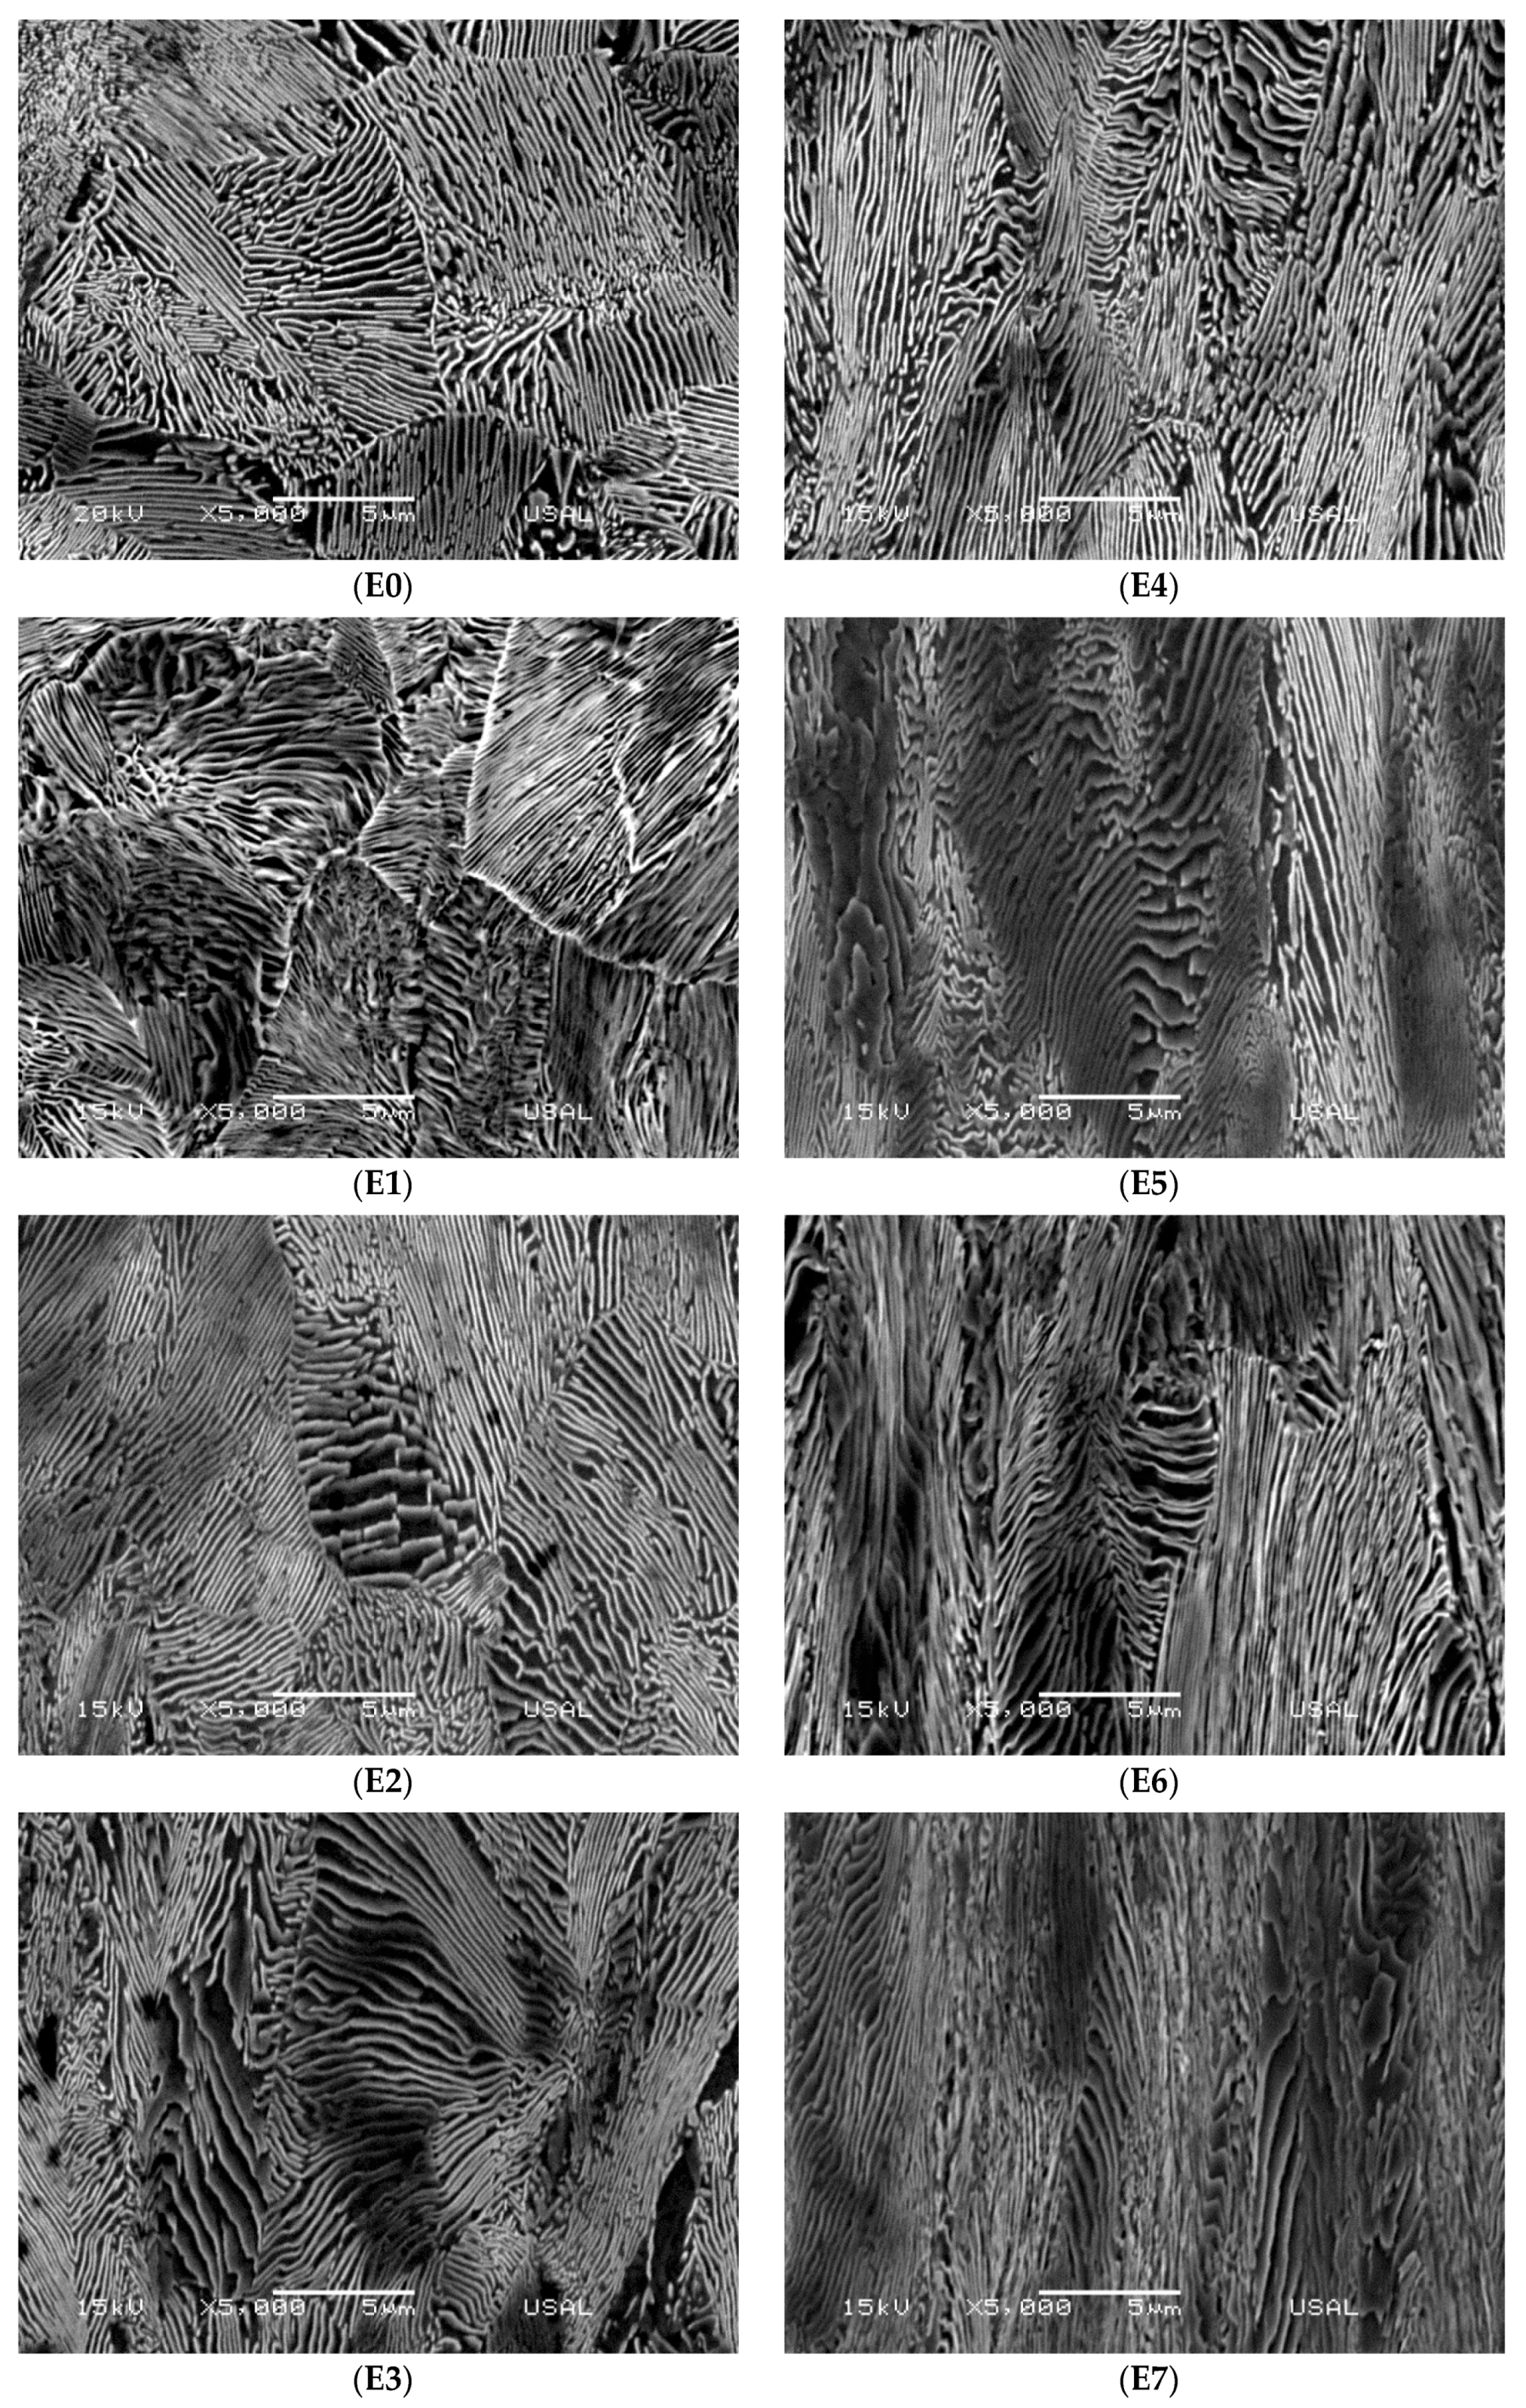
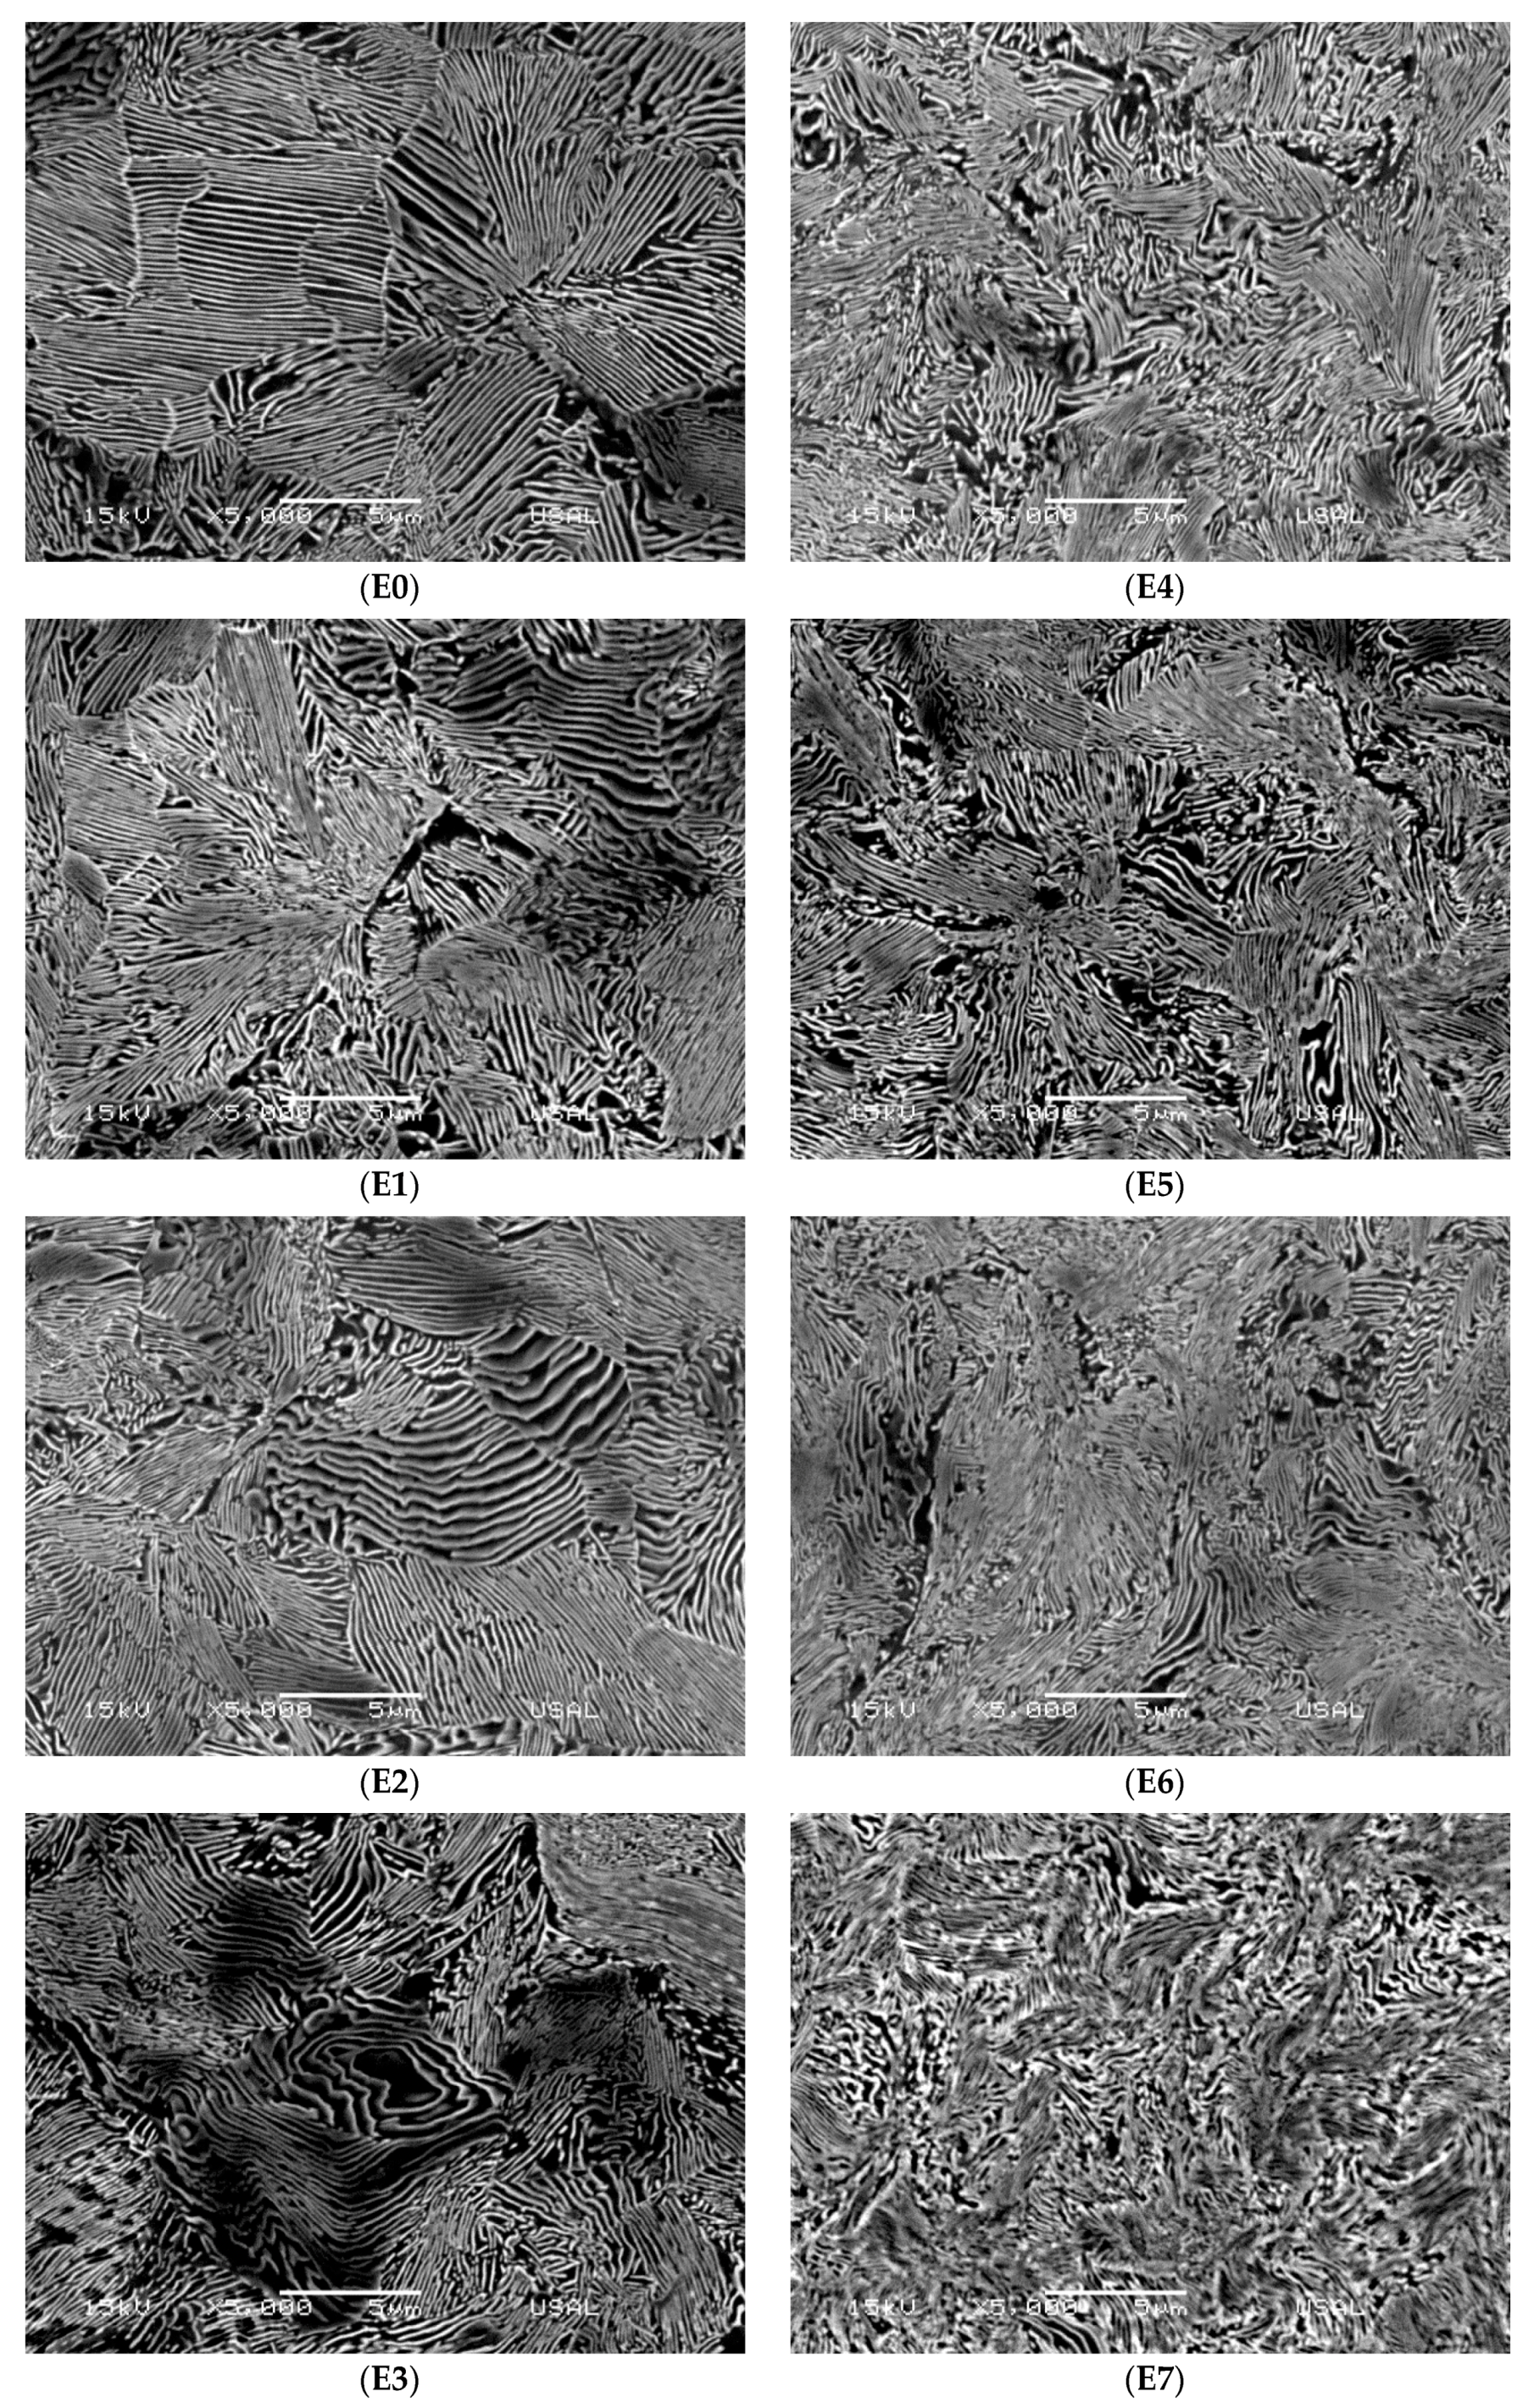
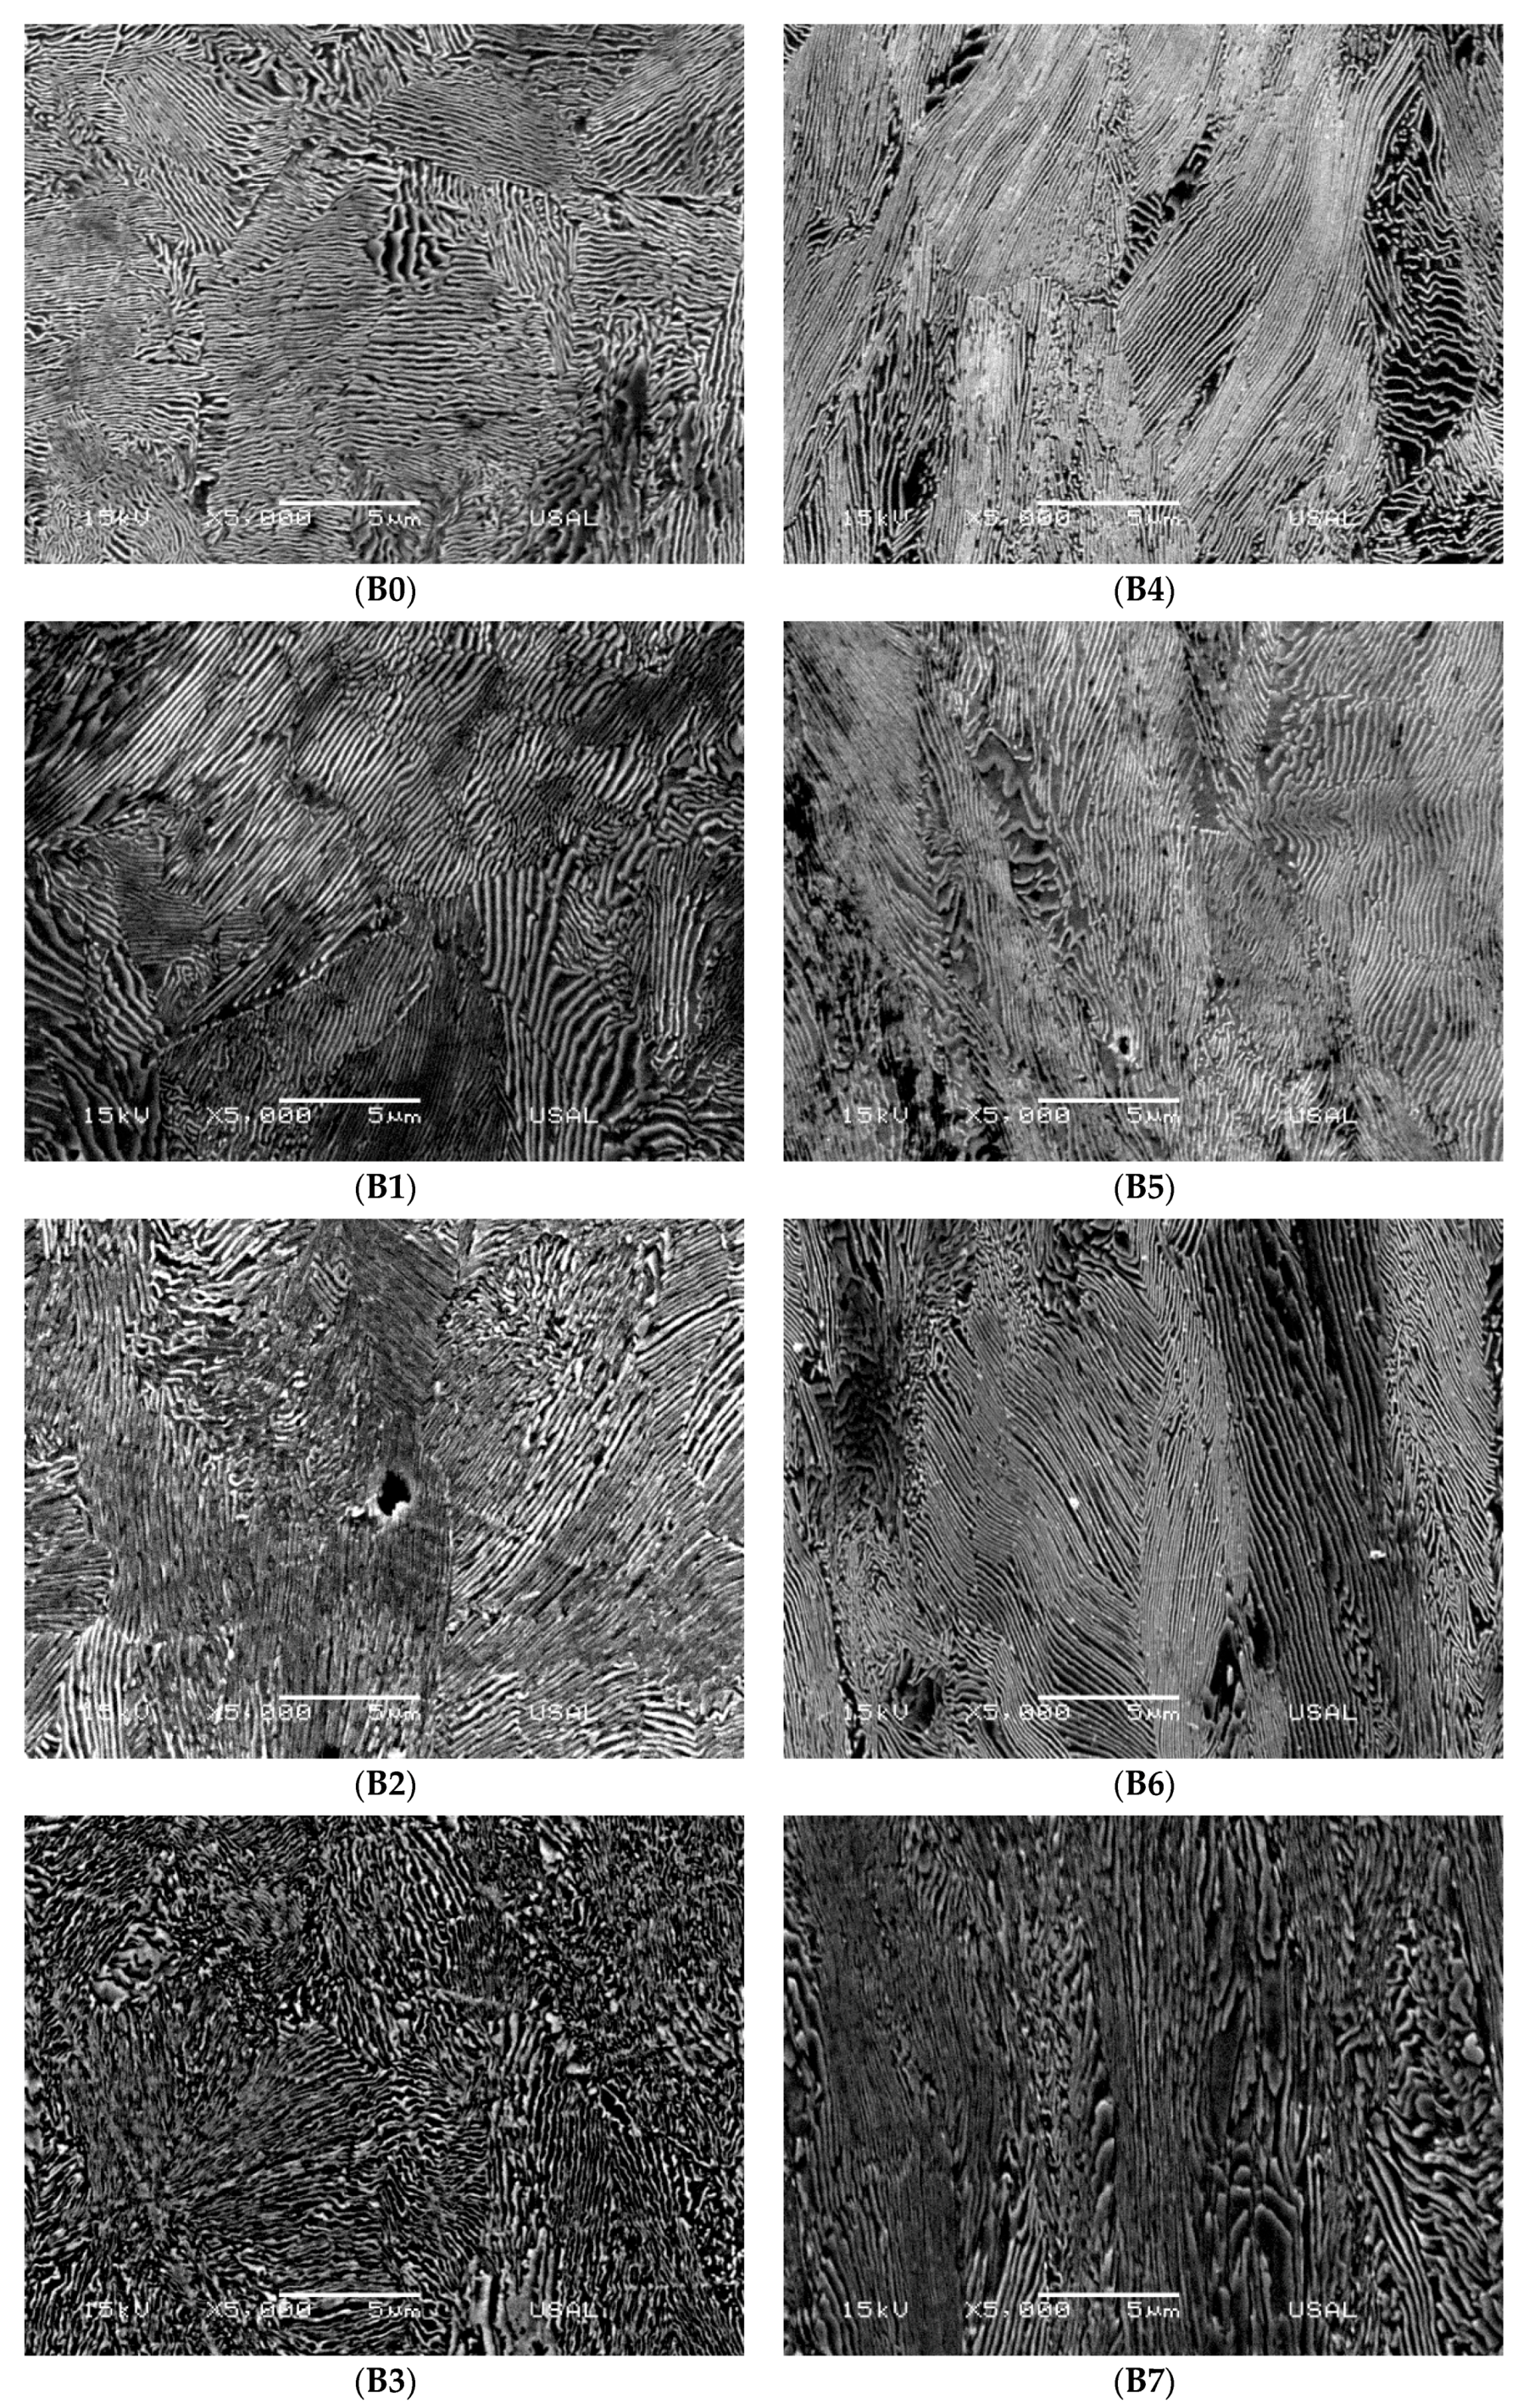
3. Microstructure of the Progressively-Drawn Wires

The microstructure of the progressively-drawn wires is given in Figure 2, Figure 3, Figure 4 and Figure 5 (the vertical side of longitudinal sections always corresponds to the wire axis). They show a progressive slenderizing of the pearlitic colonies and an increase of packing closeness (with decrease of pearlite interlamellar spacing). In addition, a progressive orientation (in the drawing direction) of both pearlitic colonies (first microstructural level) and ferrite/cementite lamellae (second microstructural level) can be observed. All these observations are fully consistent with previous research in similar steels [12,13,14,15].

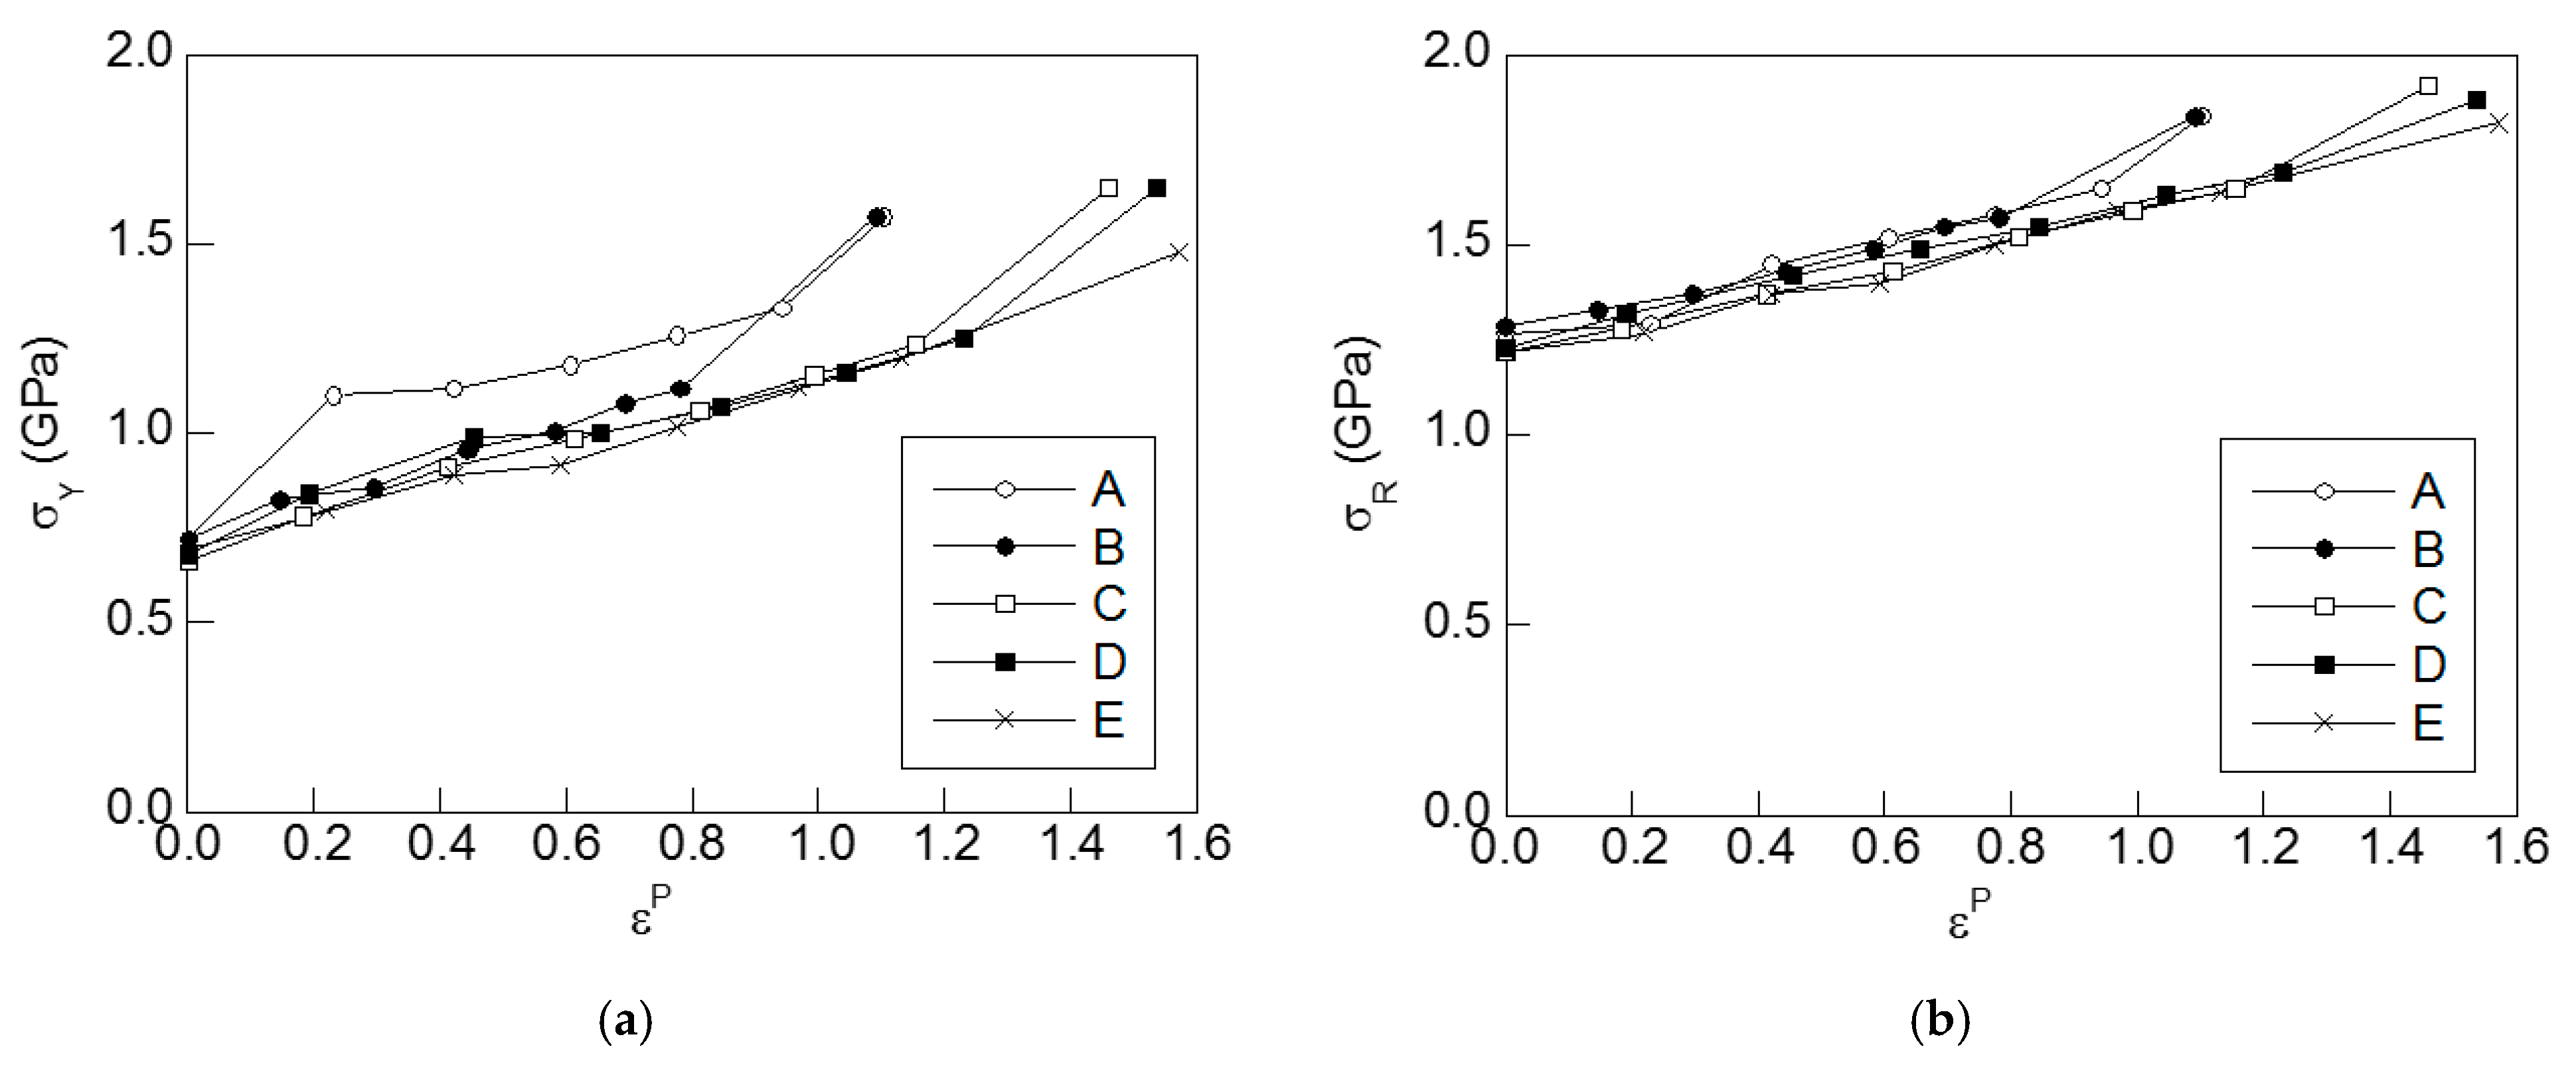
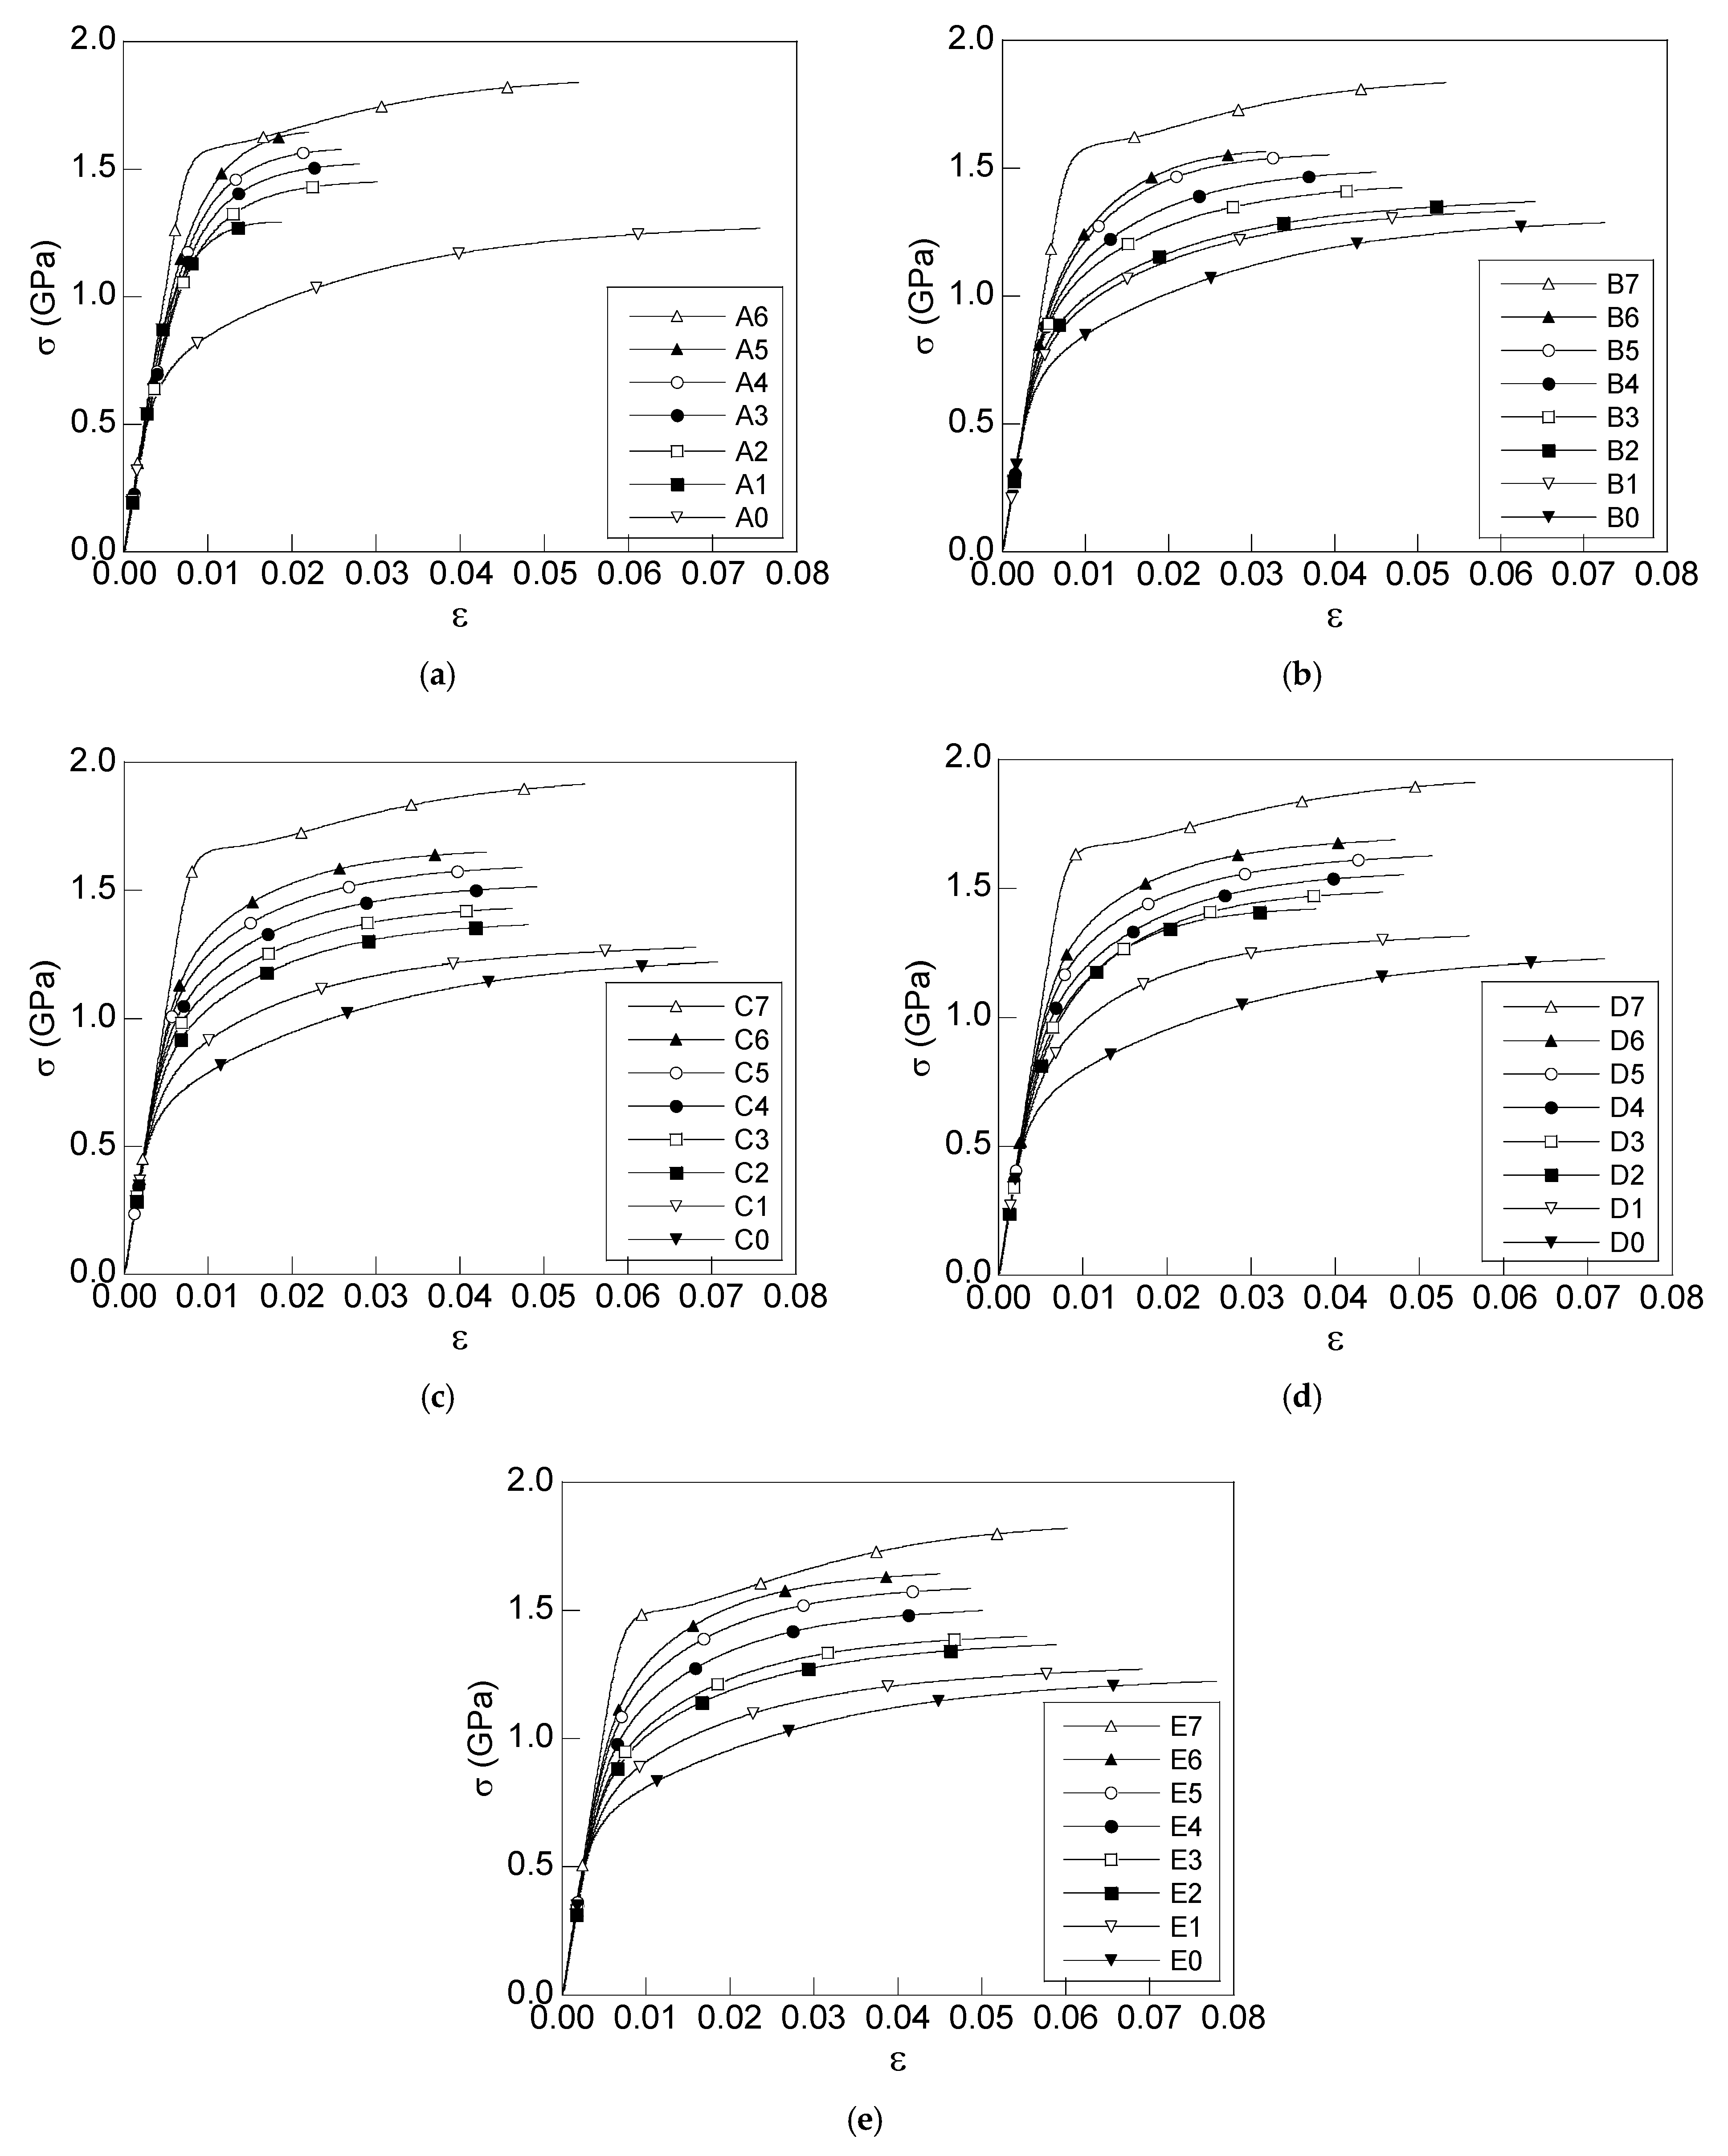
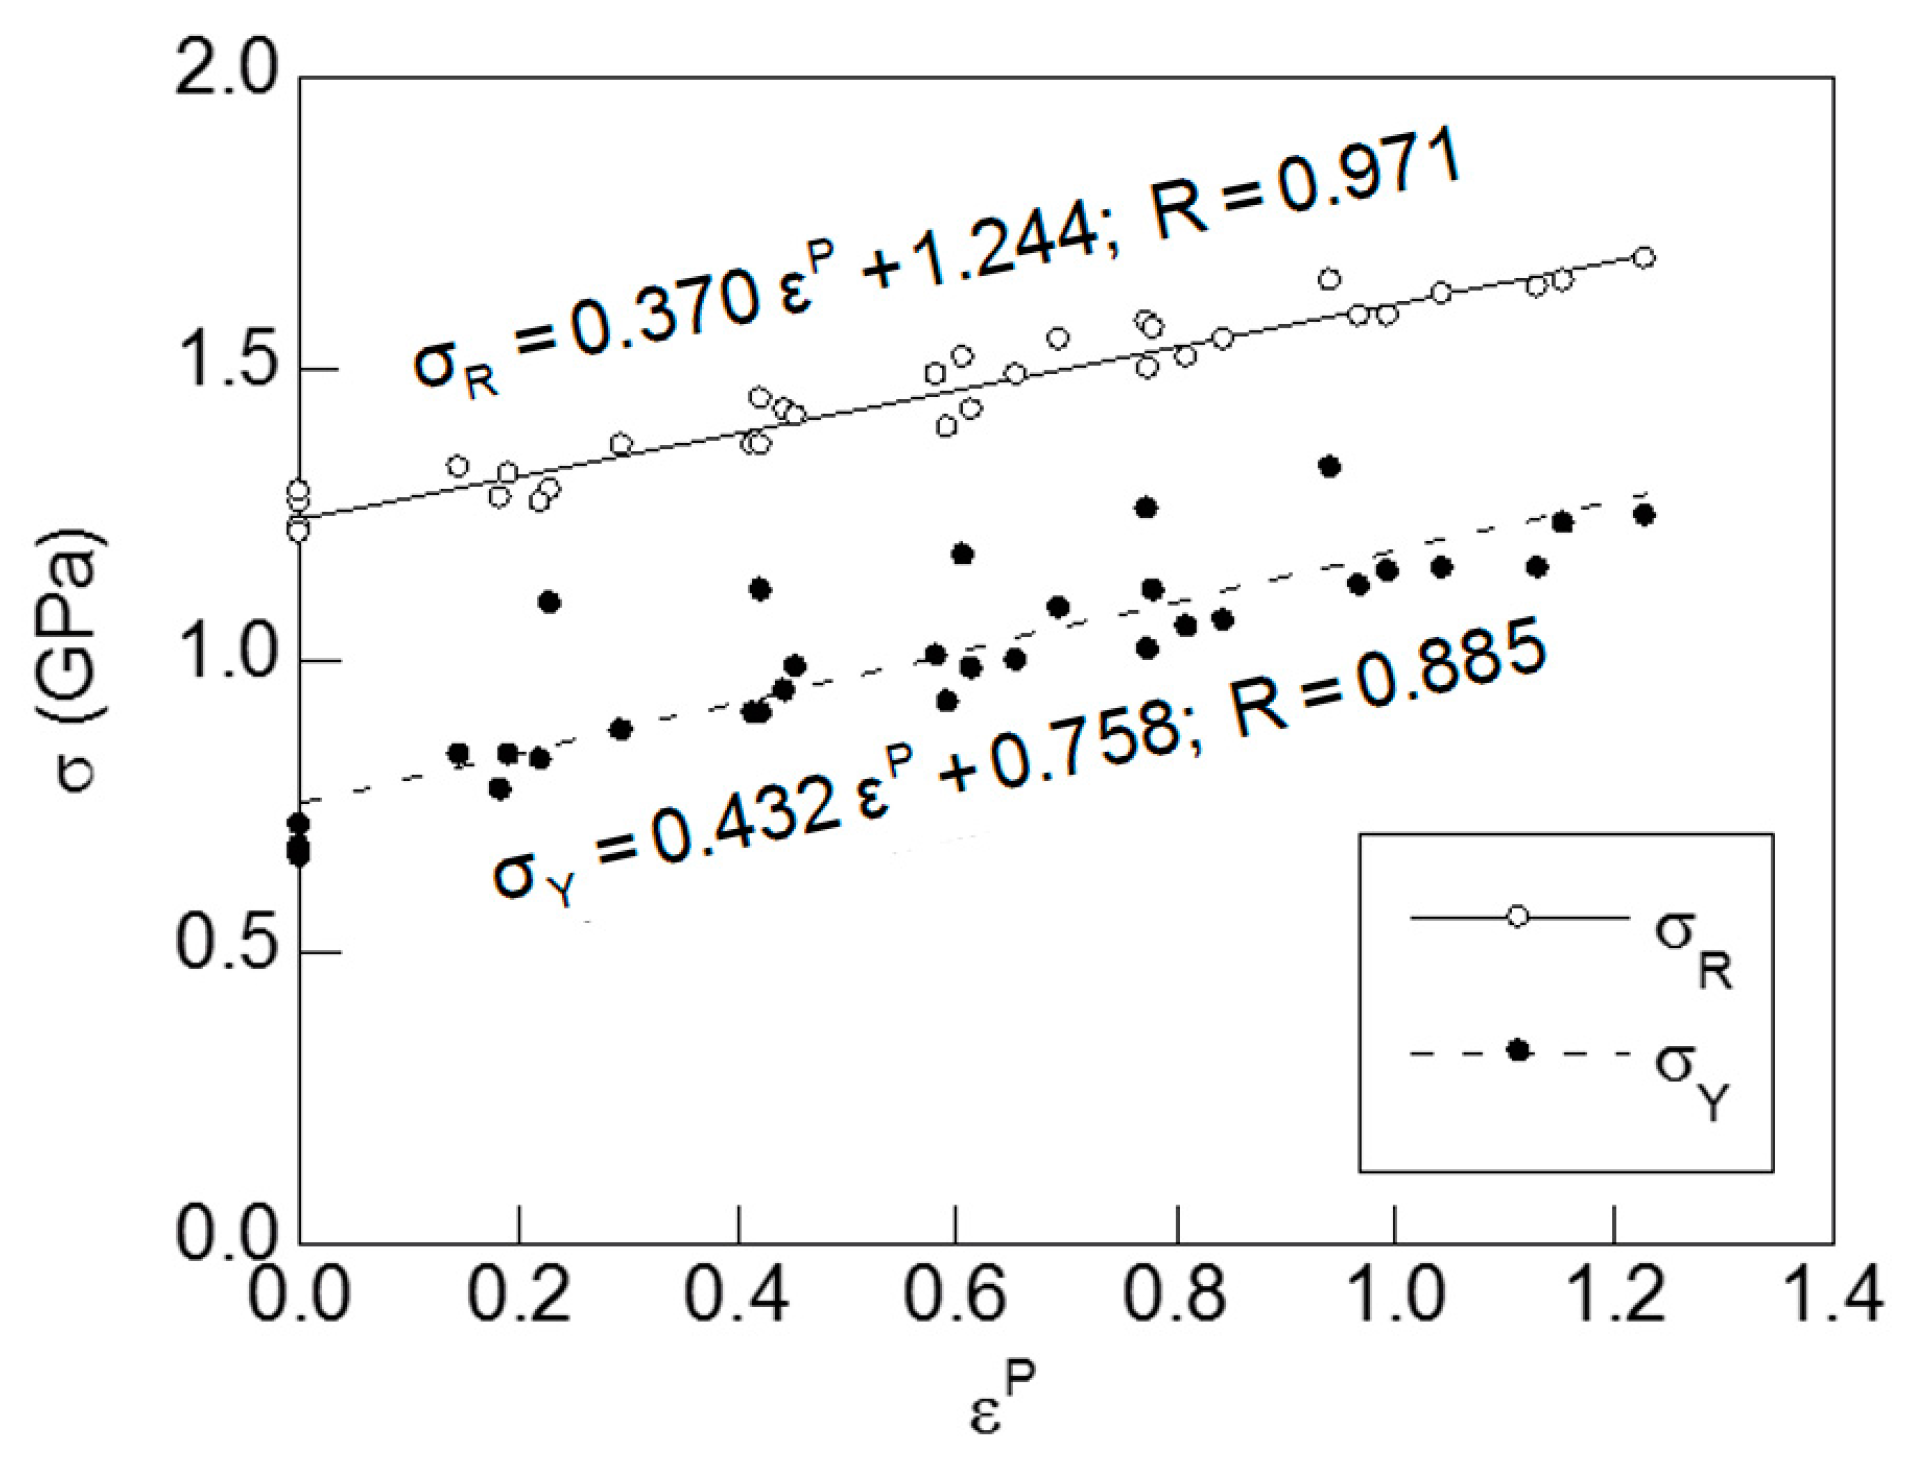
4. Mechanical Behavior of the Progressively-Drawn Wires

Conventional standard tension tests up to final fracture under a constant displacement rate of 2 mm/min were carried out using cylindrical samples of 300 mm length for each one of the drawing steps and the five families of steels used in the experimental program. Such a length was selected following the recommendation of a previous study [29]. Figure 6 shows the obtained master curves (stress vs. strain curves) as results of testing for each drawing step of the considered steels. Furthermore, Table 4 shows the values of the main mechanical properties of the previous steels.
From such curves (Figure 6), the mechanical properties can be determined and, thus, the evolution of yield strength σY (Figure 7a) and ultimate tensile strength σR (Figure 7b) with the drawing degree is revealed in terms of cumulative plastic strain (εP).
As Figure 7a,b clearly show, a quasi-linear growing trend does exist in the yield strength and UTS with cumulative plastic strain during drawing. Therefore, a linear dependence seems to exist between both parameters and the drawing degree. In order to reveal such a dependence, a mathematical fitting (Figure 8) was applied to the data included in Figure 7a,b. The last step of wire drawing was not considered, since manufacturing companies used to apply a special heat treatment after the last drawing step for relieving the residual stresses induced by manufacturing. Thus, these equations mathematically represent the increment of yield strength and the UTS of pearlitic steels due to the strain hardening mechanism. These equations could be useful for obtaining a simple estimation of the material strength after a given straining process.

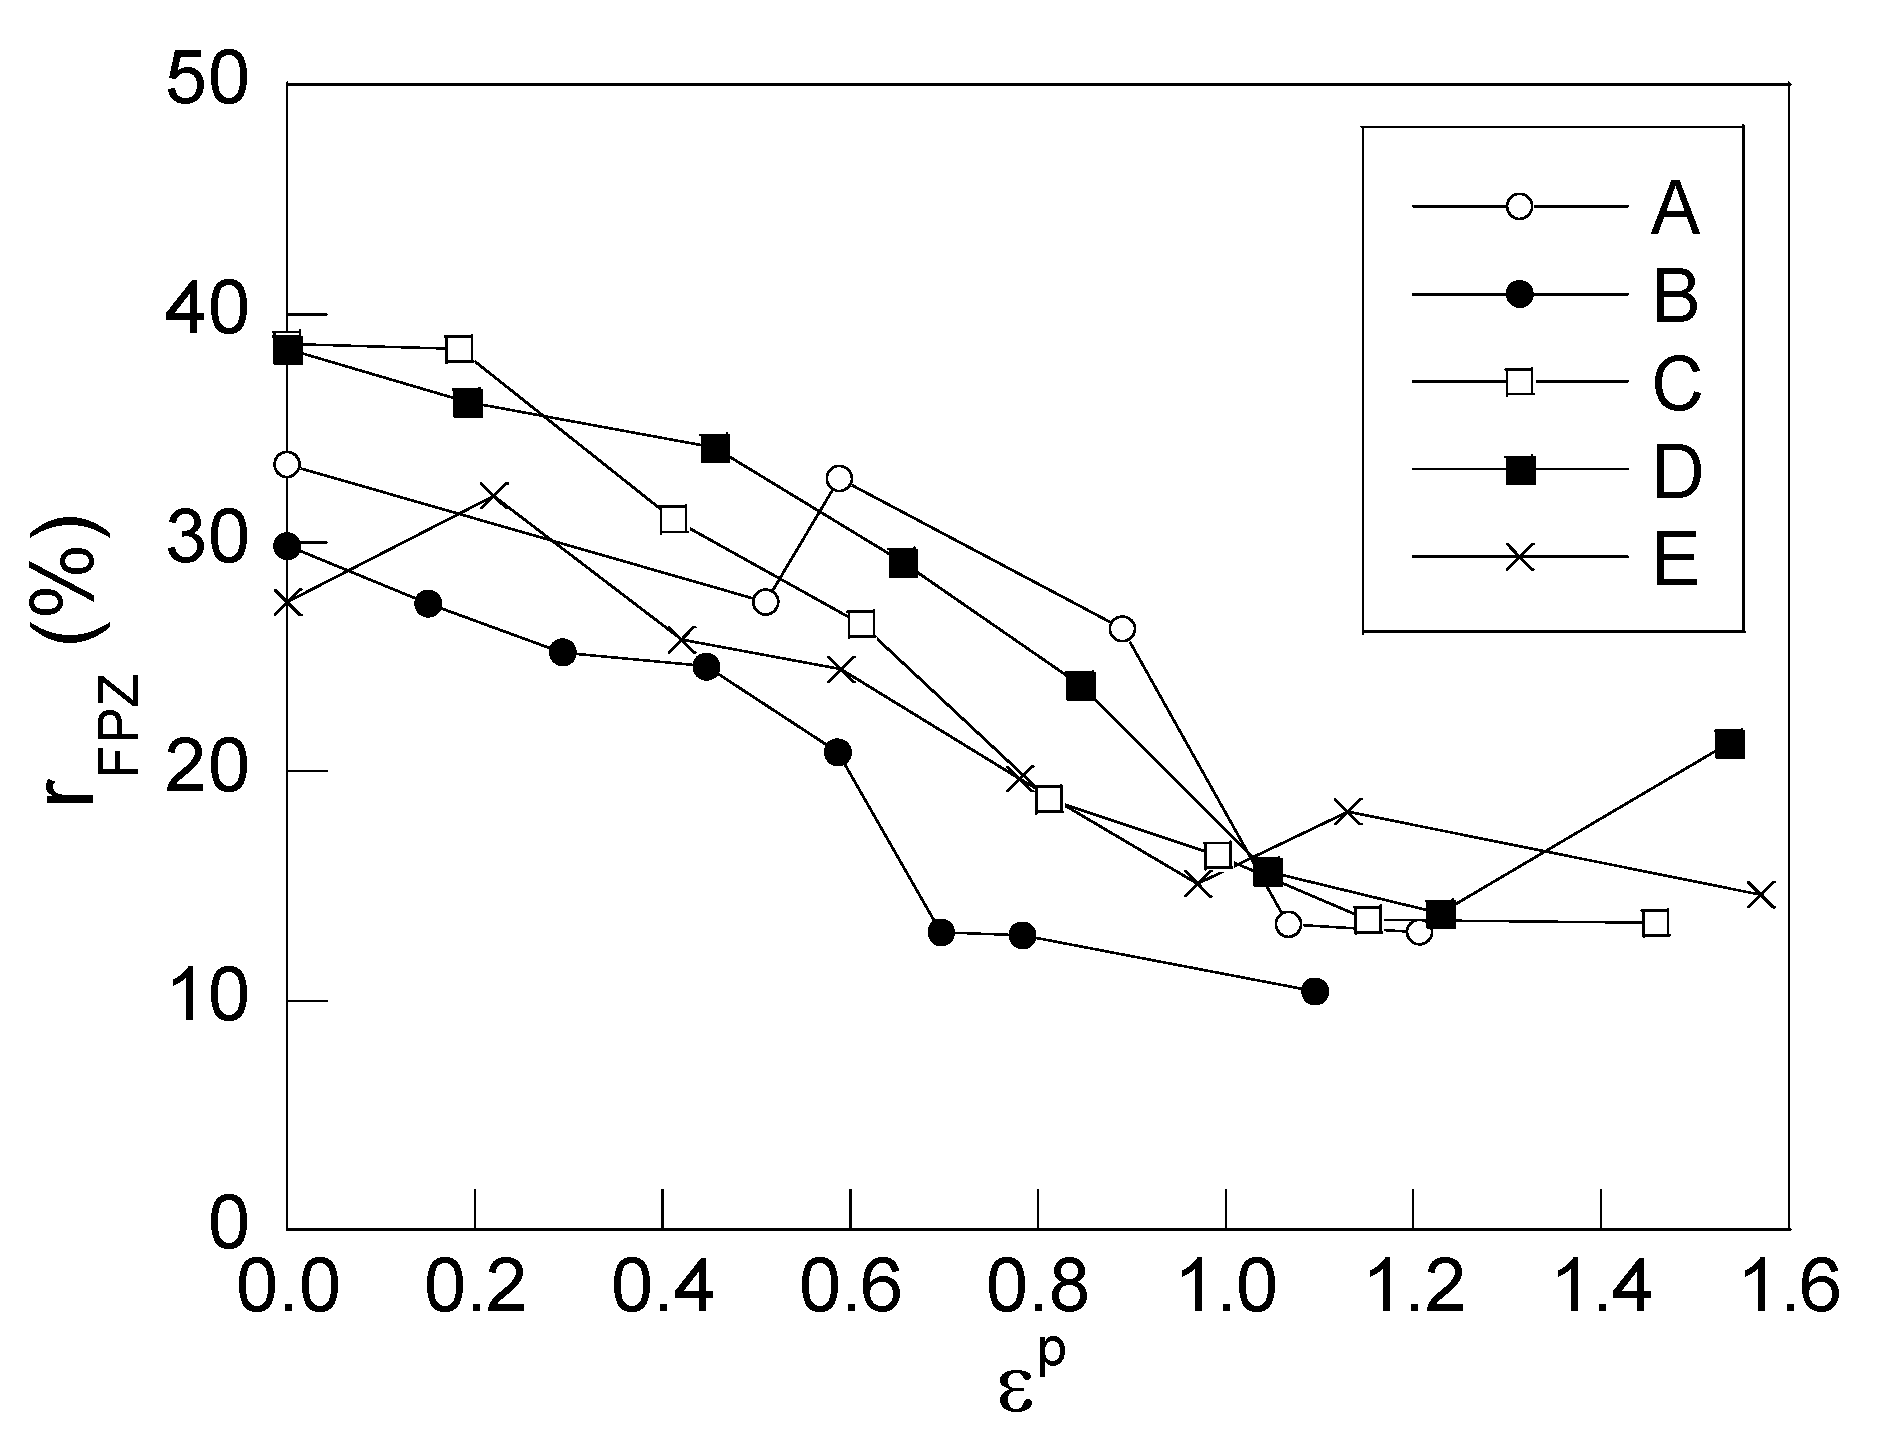
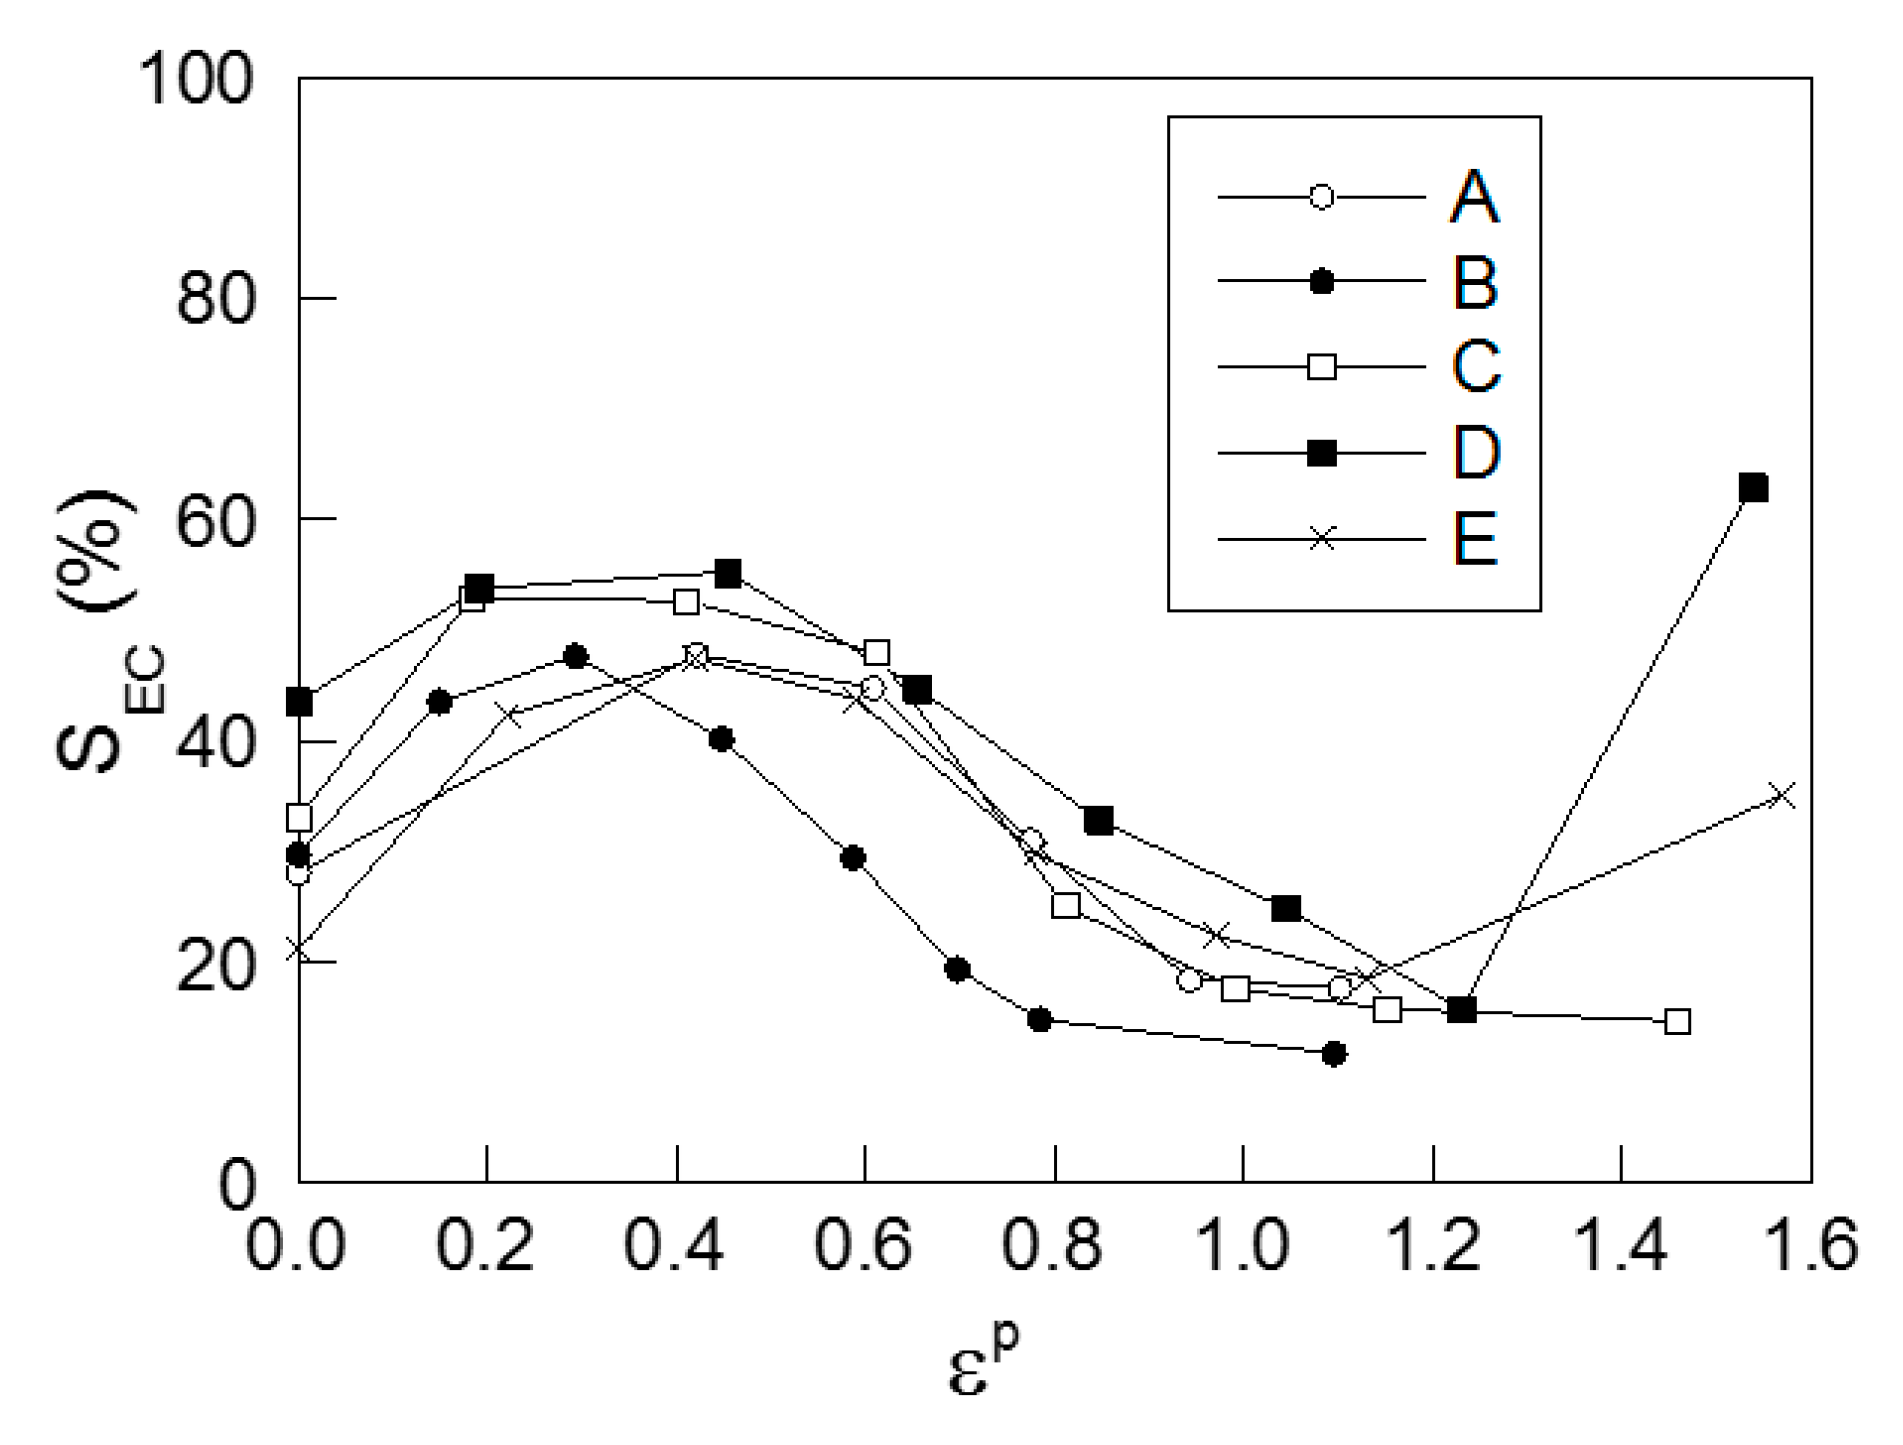
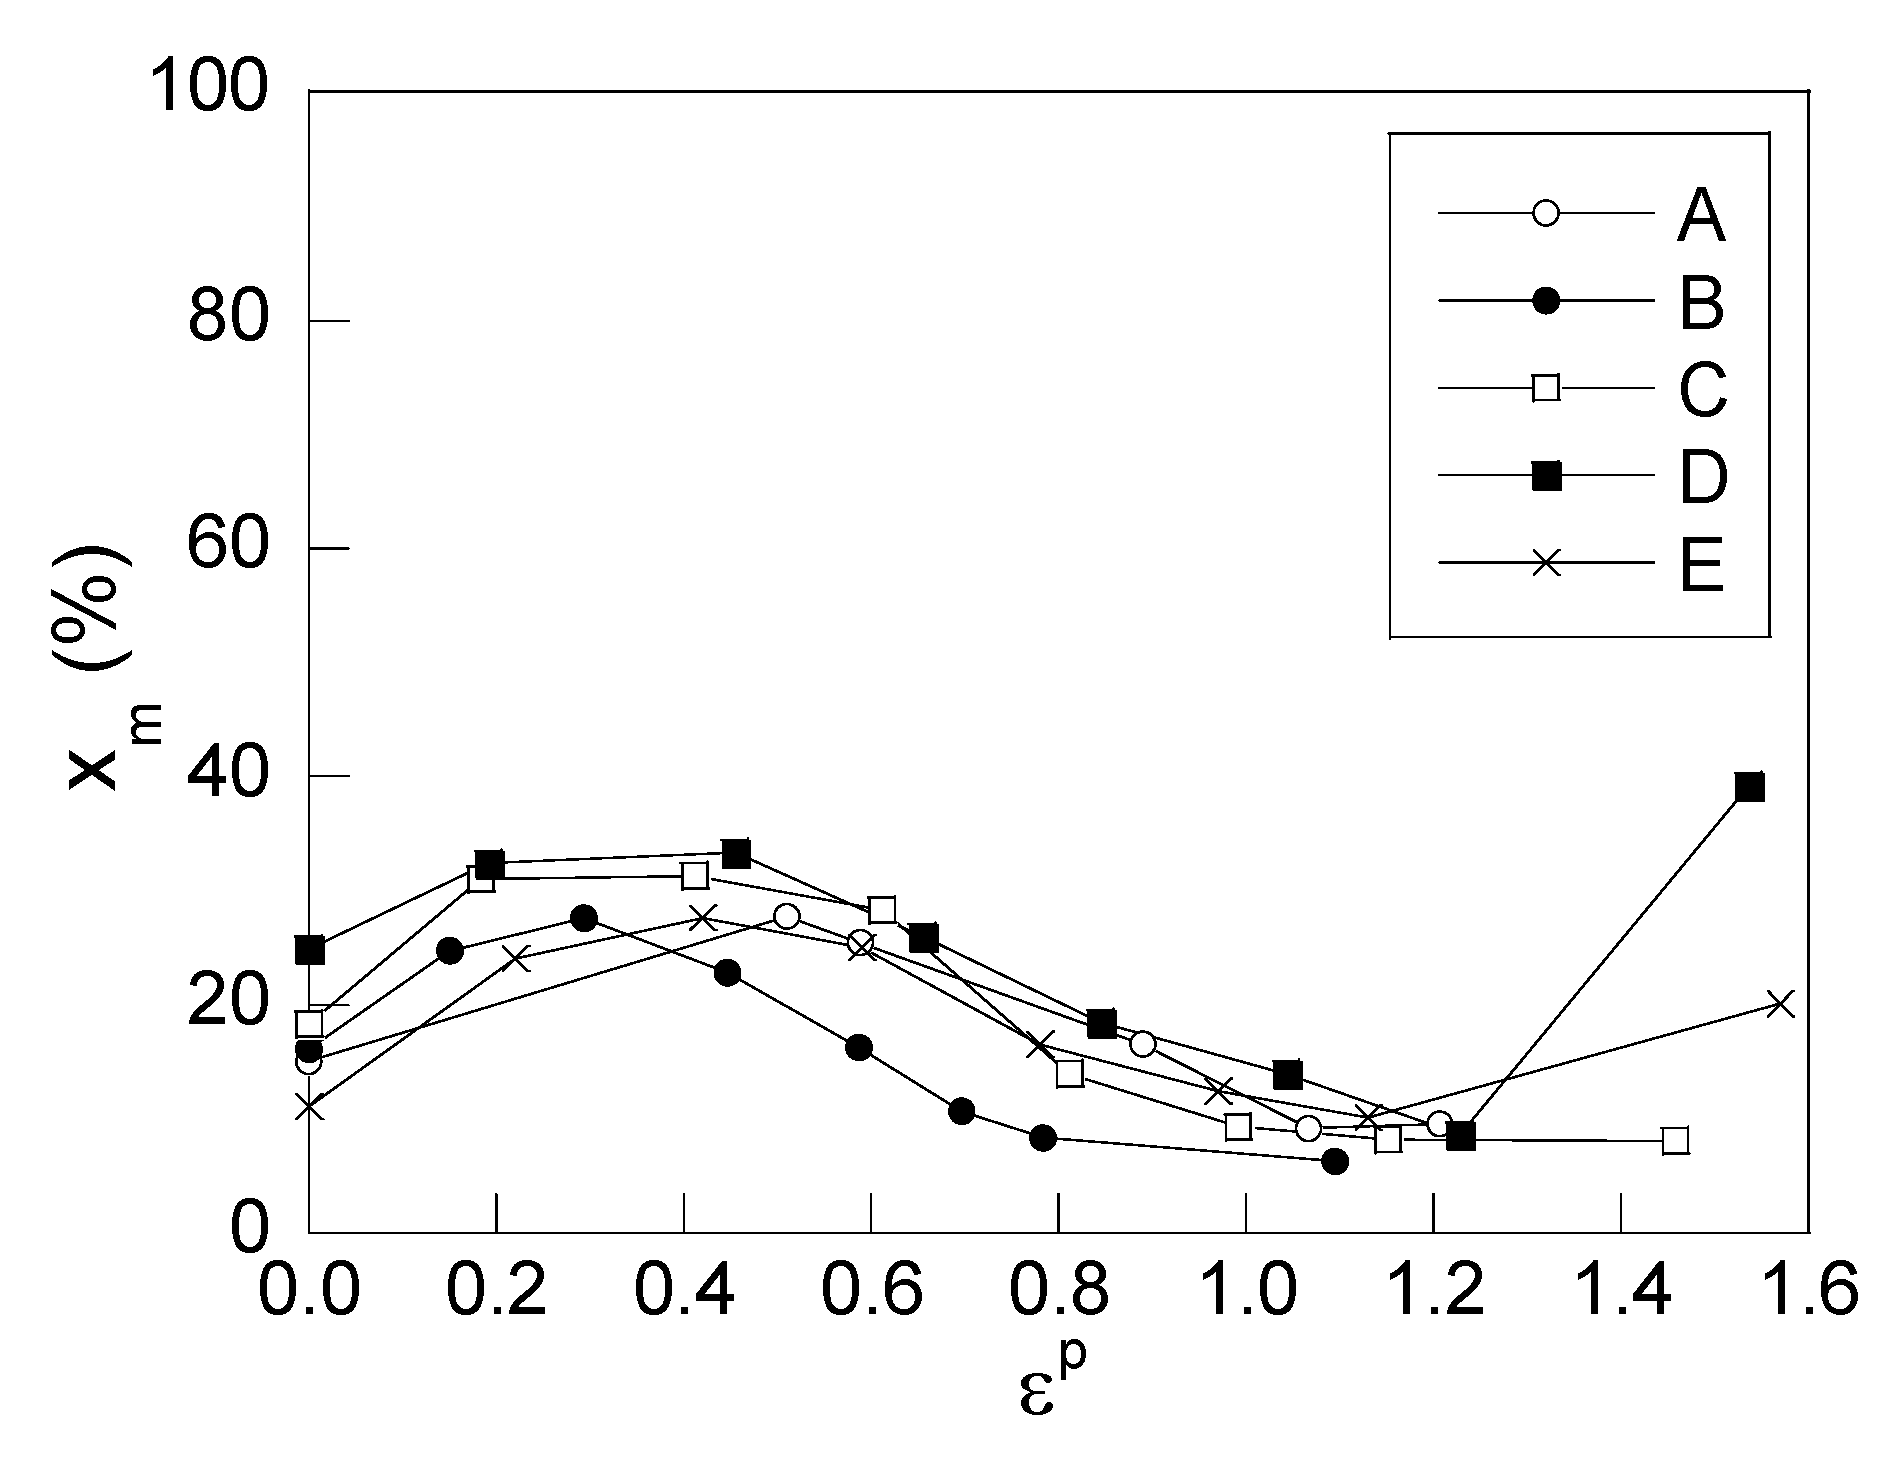
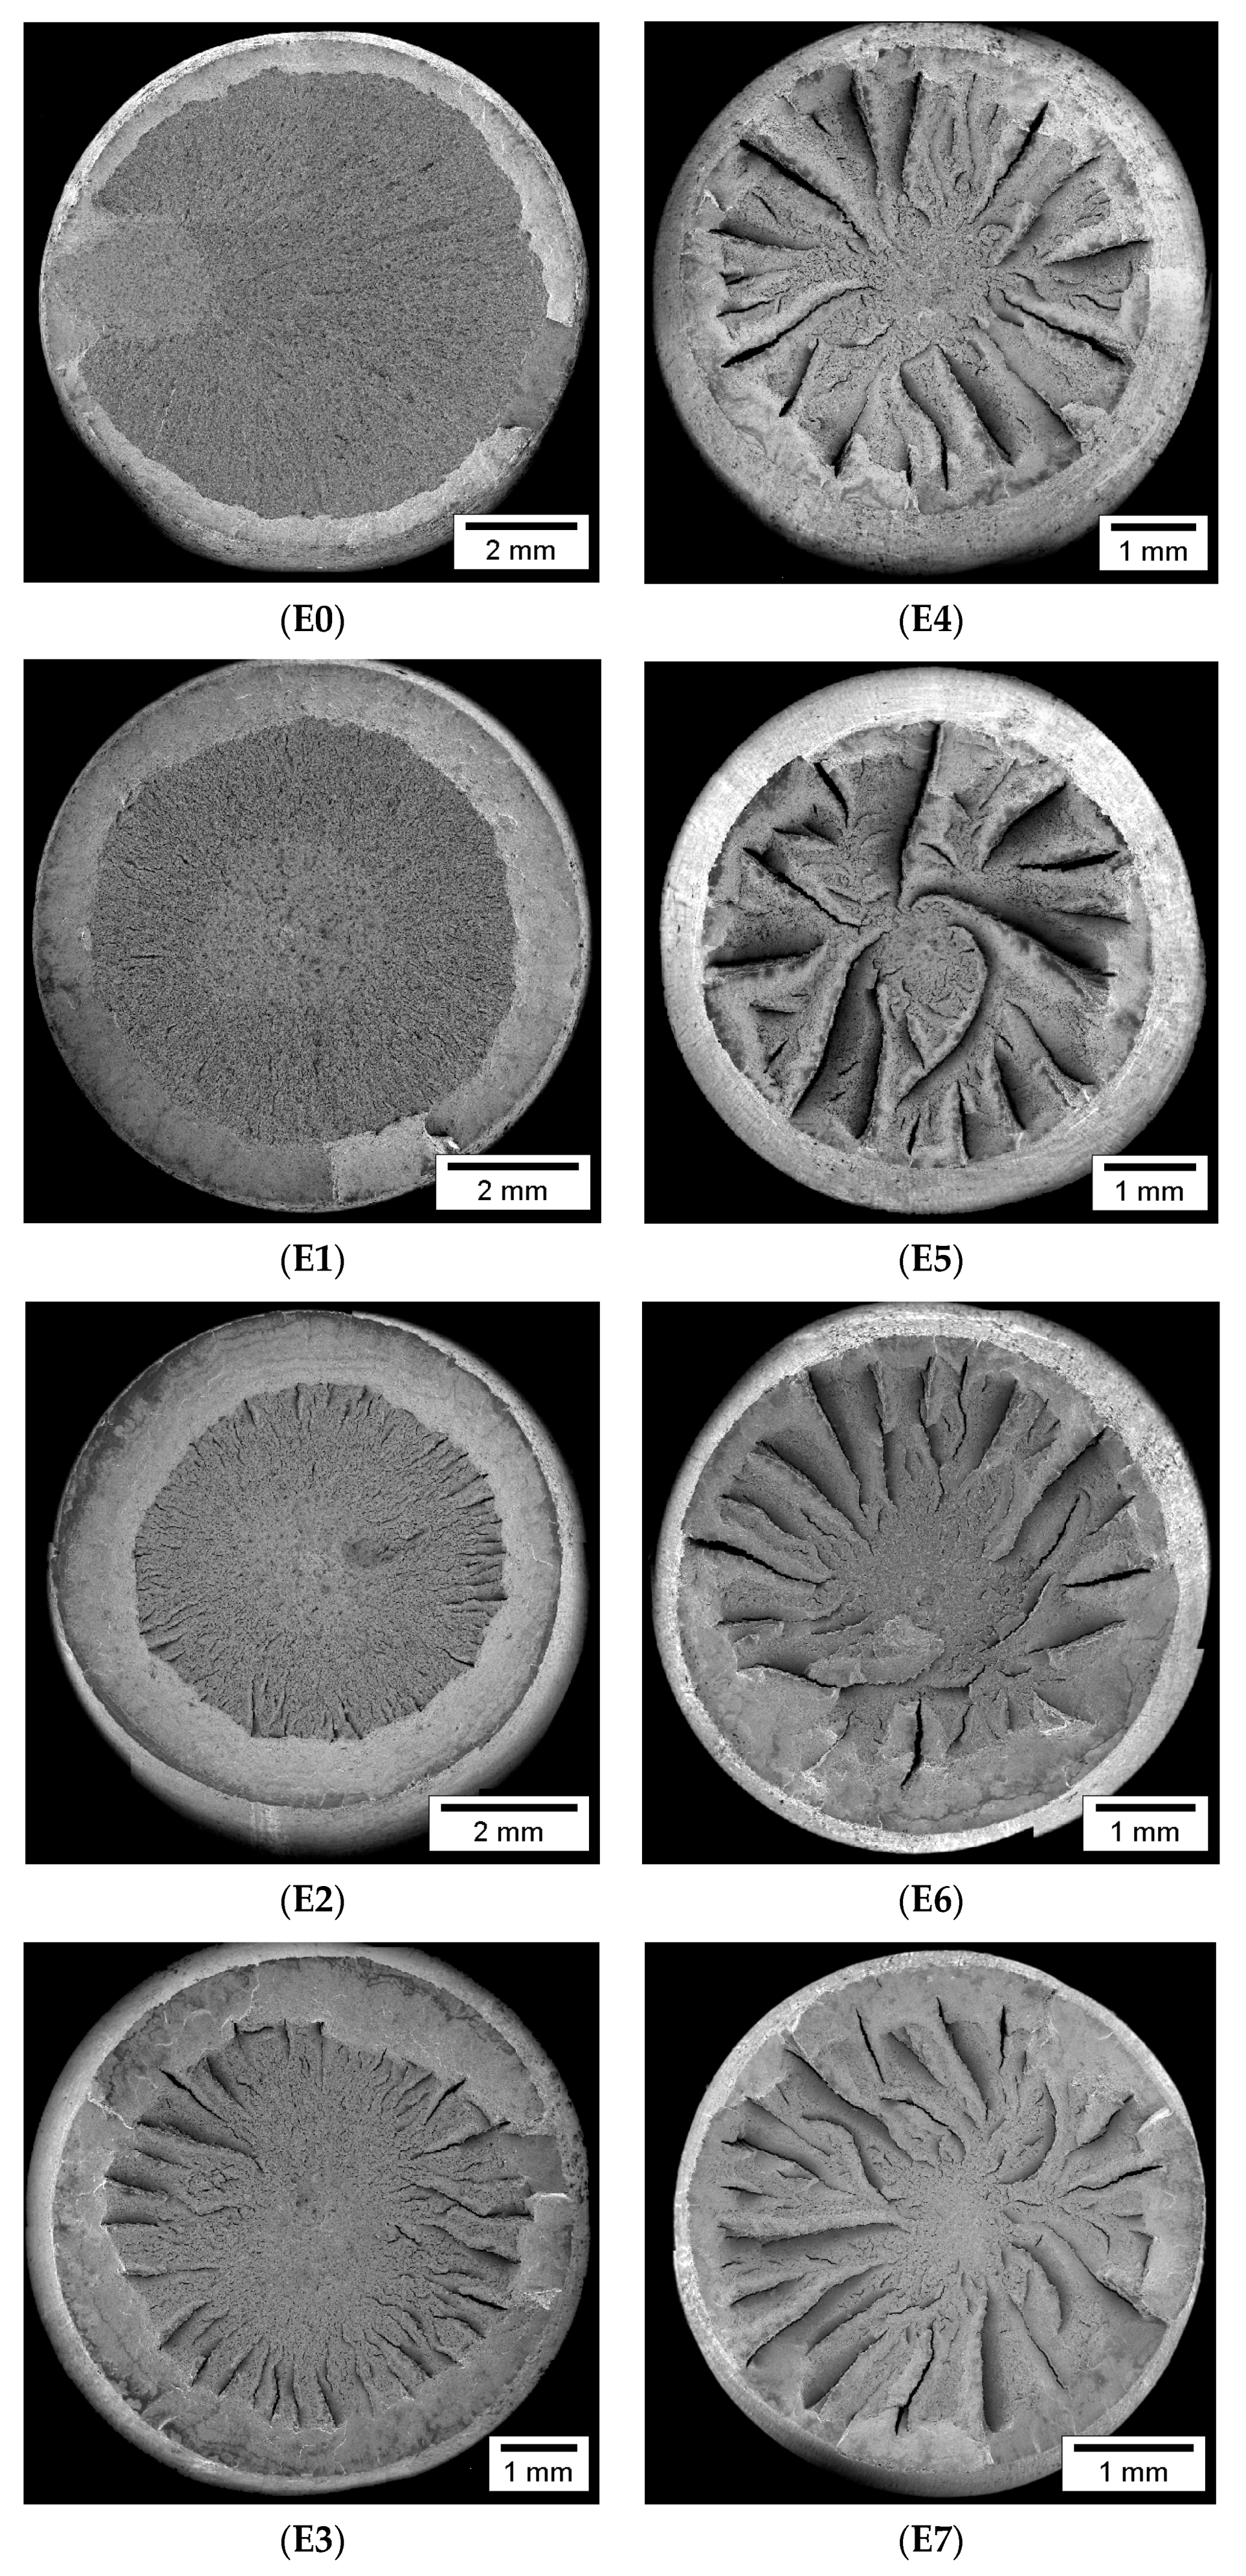
5. Fractographic Analysis

Fracture surfaces were observed by means of SEM. The fracture surface obtained after tensile testing of each drawing step of steel families B and E are shown in Figure 9 and Figure 10, respectively. For each set of three tests (of the total amount of 117) a representative fracture surface was considered in the fractographic analysis. According to the MFMs, the slightly-drawn steels exhibit an isotropic fracture behavior and a smooth fracture surface at the macroscopic scale. As the drawing degree increases the mechanical behavior is modified (σY and σR increase, Figure 8, and the fracture behavior, too, showing a more irregular fractography with numerous peaks and valleys (strength anisotropy) as a consequence of the progressive microstructural orientation after manufacture.
In all steels, fracture initiates in a central fibrous region formed by micro-void coalescence (MVC), this domain representing the fracture process zone (FPZ). In addition to the central zone of the wire with a fibrous aspect, ductile fracture appears in the form of MVC at the periphery of all the wires tested as an external ring (shear lip). The micro-void size at the central zone is higher than that observed in the external ring. In moderately-drawn wires, an intermediate zone between the external ring and the central zone was identified with a mixed fractography of MVC and cleavage (C). Radial marks in the direction from the central zone to the external ring are observed. Therefore, fracture was initiated at the wire centre (central fibrous zone by MVC) and later it propagated in radial direction towards the wire periphery. As the drawing degree increases, the area covered by brittle fracture (cleavage zone) decreases, appearing MVC instead of C. Thus, in heavily drawn wires the observed MFM is constituted in the majority of cases only by MVC.
Attention should be paid to certain exceptions to the previously depicted common trend. For instance, the fibrous zone in the specimen E0 (Figure 10) is placed close to the external ring (peripheral fracture origin). Probably this behavior is caused by surface damage generated in the hot-rolled steel during storage.
MFMs were assembled from the SEM micrographs. Later, a quantitative fractographic analysis of the fracture surfaces was carried out by a commercial image analysis software, paying special attention to the following fracture features (Figure 11):
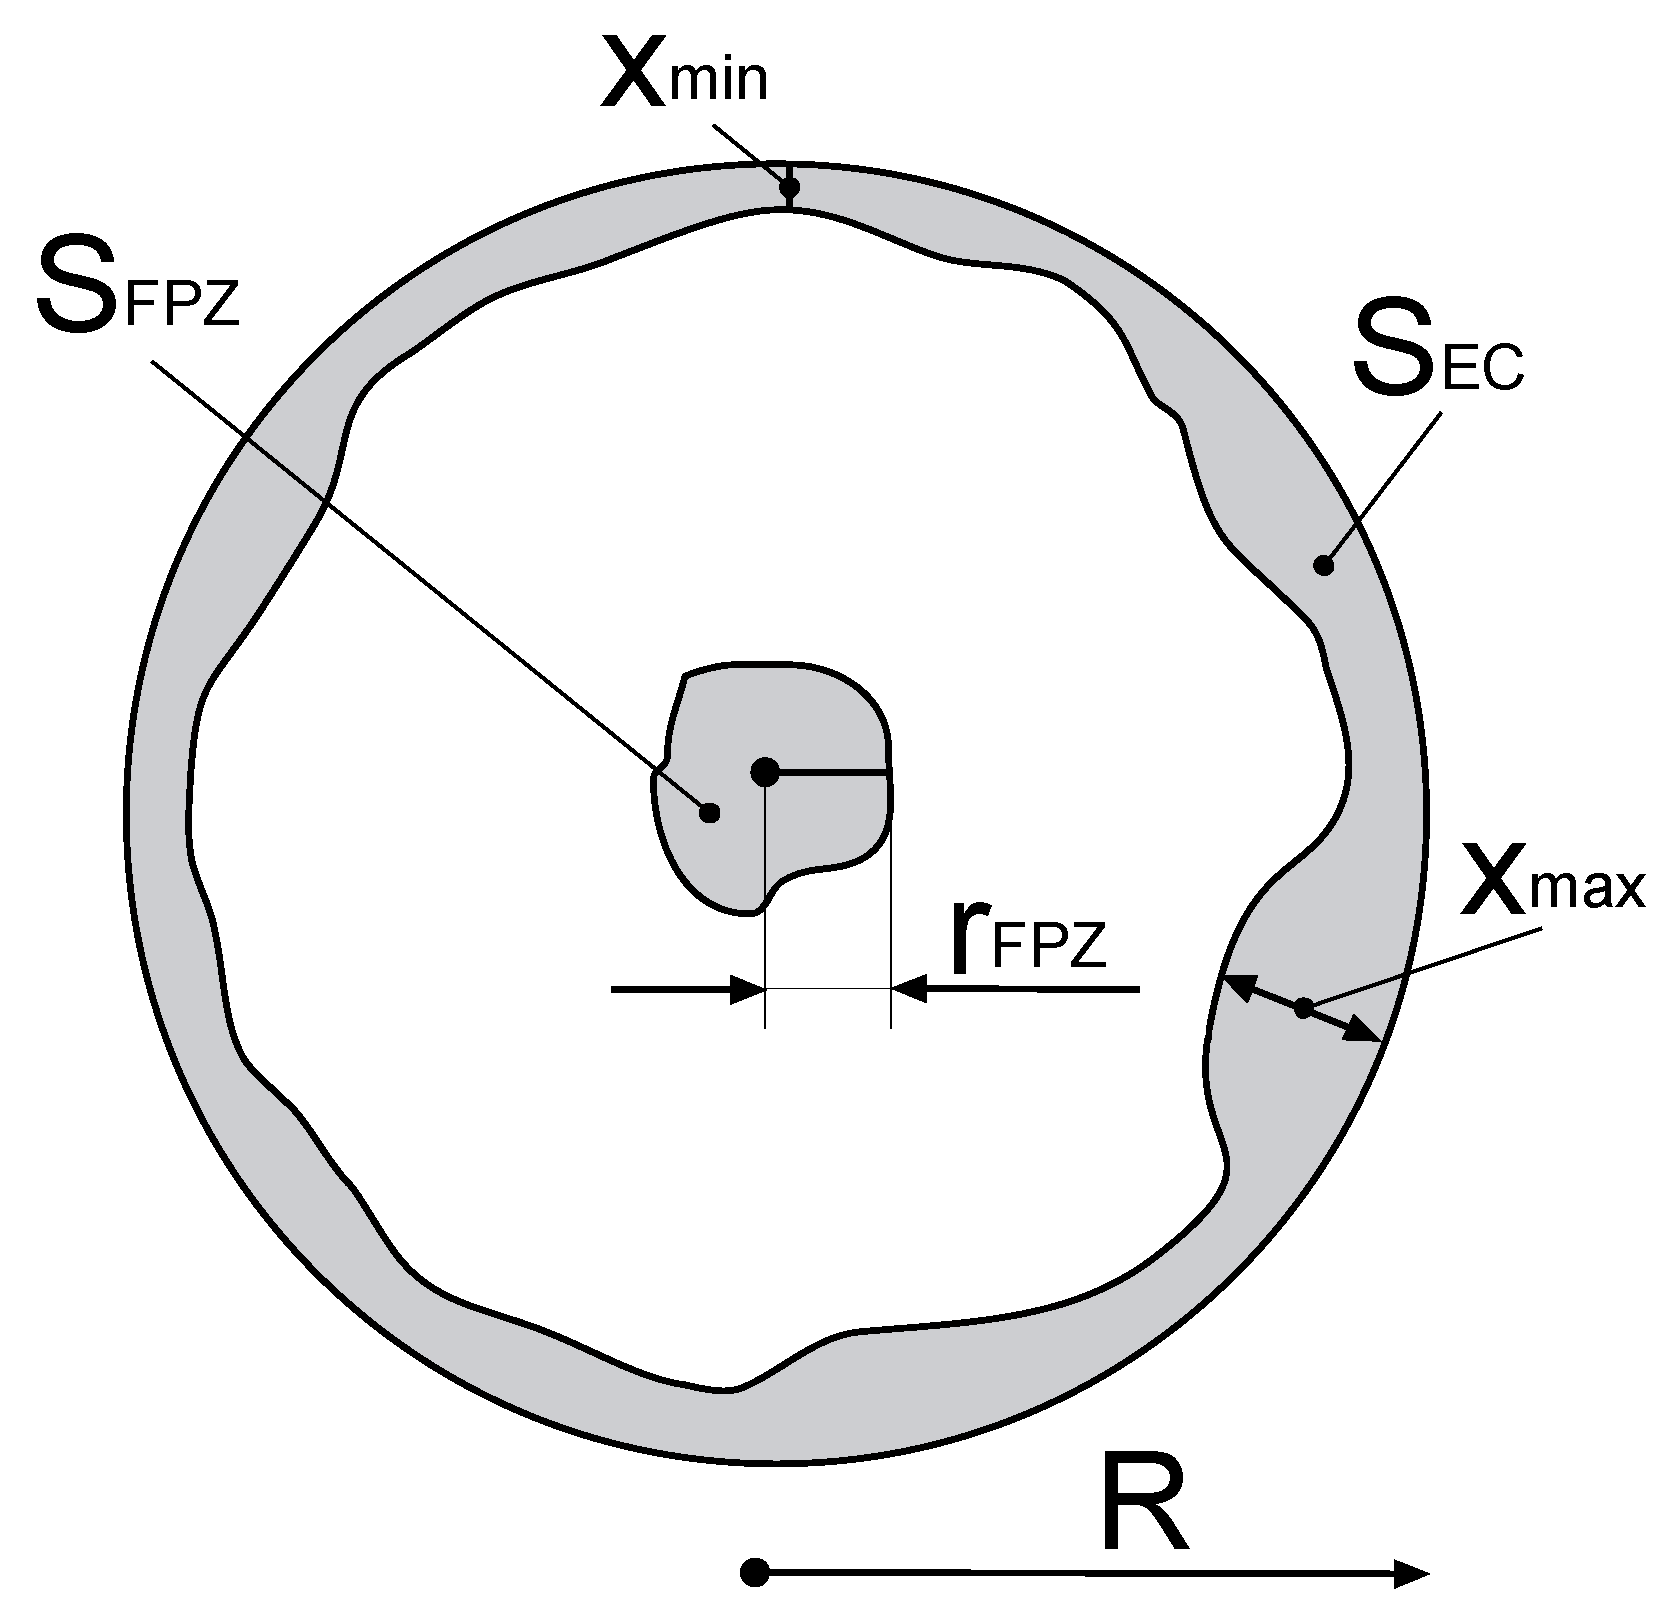
  • Total fracture surface (SF).
  • Surface of the FPZ (SFPZ).
  • Radius of the FPZ (rFPZ).
  • Surface of the external crown formed by MVC (SEC).
  • Mean or average depth (xm), maximum depth (xmax) and minimum depth (xmin) of the external crown formed by MVC.
An indicator of the steel ductility (maximum plastic strain undergone by the material up to fracture) is the reduction of the cross sectional area Z. This parameter can be obtained from the initial area of the specimens (S0) and the final area after fracture (SF) as follows:
Z ( % ) = ( S 0 S F S 0 ) × 100
The value of the areas of the FPZ (SFPZ) and the external crown (SEC) were measured in terms of the whole fracture area SF. Accordingly, the radius of the FPZ (rFPZ) and the average depth of the external ring (xm) were obtained in terms of the radius R of the fractured area by means of the following equations:
S FPZ ( % ) = ( S FPZ S F ) × 100
S EC ( % ) = ( S EC S F ) × 100
r FPZ ( % ) = ( r FPZ R ) × 100
x m ( % ) = ( x m R ) × 100

6. Discussion

The evolution of the reduction of the cross sectional area Z with cumulative plastic strain caused by wire drawing for the five drawn steels is shown in Figure 12. Two trends with the drawing degree are observed. On one hand, Z increases with the drawing degree for slightly drawn steels. On the other hand, for heavily-drawn steels the trend is the opposite, i.e., Z decreases with the drawing degree. Surprisingly, for the steel type A, Z still rises with cold drawing even in the last step, just where such a variable decreases in the other steels. This behavior can be explained on the basis of cumulative plastic strain εP and the microstructural orientation inside the steels.
Mainly, two key consequences appear at the microstructural level in steels as they are drawn: (i) the accumulation of plastic strains and increment of material strength (cold work), and (ii) a microstructure orientation in the wire axial direction. In hot rolled bar (not cold drawn at all), pearlitic colonies (micro-composed of alternated ferrite and cementite lamellae) are randomly oriented. However, as the drawing degree increases, the pearlitic colonies are progressively oriented in the cold drawing direction [13] and the ferrite/cementite lamellae do the same [15], both microstructural levels becoming quasi-aligned with the wire axis or cold drawing direction in the commercial pre-stressing steel wires (final stages of manufacture). The cumulative plastic strain at the end of the drawing chain, i.e., that necessary for the full reorientation in axial direction of both microstructural levels (hierarchical structures of pearlitic colonies and ferrite/cementite lamellae) ranges between 1.1 and 1.6 for the whole set of steel families analyzed in the present paper. This interval fully agrees with the value of 1.5, reported in the scientific literature [30,31], of the cumulative plastic strain necessary for the aforementioned completion of reorientation.
Once the microstructure (colonies and lamellae) are completely oriented in the drawing direction [13,15], the percentage of reduction of the cross sectional area Z begins to decrease, independently of the plastic strain increment (e.g., step 6 to 7 in family types B, C, D and E). The Z reduction is linked with the strong decrease of the interlamellar spacing caused during the microstructure re-orientation at the final stages of drawing [14] and the dislocation density rises in the ferrite lamellae, thus increasing the microstructural packing closeness and reducing the free path for dislocation movement during strain hardening of the progressively drawn steels.
The FPZ (fibrous zone) was characterized by means of its size SFPZ represented in Figure 13, and by its characteristic length rFPZ shown in Figure 14. As a common trend, in all analyzed steel families the two parameters decrease with cold drawing. Figure 15 shows the evolution with the drawing degree of the area of the external crown SEC. It increases up to the second step of the cold drawing process and then continuously decreases as εP rises (with certain exceptions in the last step). With regard to its average depth (Figure 16), similar results were obtained for the different steel families.

7. Conclusions

The fracture surfaces of samples corresponding to very diverse steels, with different cumulative plastic strain, were studied by means of scanning electronic microscope (SEM) and image analysis techniques. In all steels a similar fracture behavior was observed:
  • The fracture initiates at the central zone of each wire in which the fracture microscopic topography may be classified as micro-void coalescence (MVC) with fibrous aspect and propagates in a radial direction through the intermediate zone up to reaching the external ring.
  • The intermediate zone shows a fractography by cleavage and MVC. The fracture surface by cleavage diminishes in favor of MVC in the last steps of the manufacturing process by cold drawing, so that the fracture process becomes more ductile as the drawing degree increases.
  • Another important characteristic of such an intermediate zone is the presence of radial cracks oriented quasi-parallel to the drawing axis or cold drawing direction, embryos of anisotropic fracture behavior as a consequence of manufacture-induced microstructural orientation.
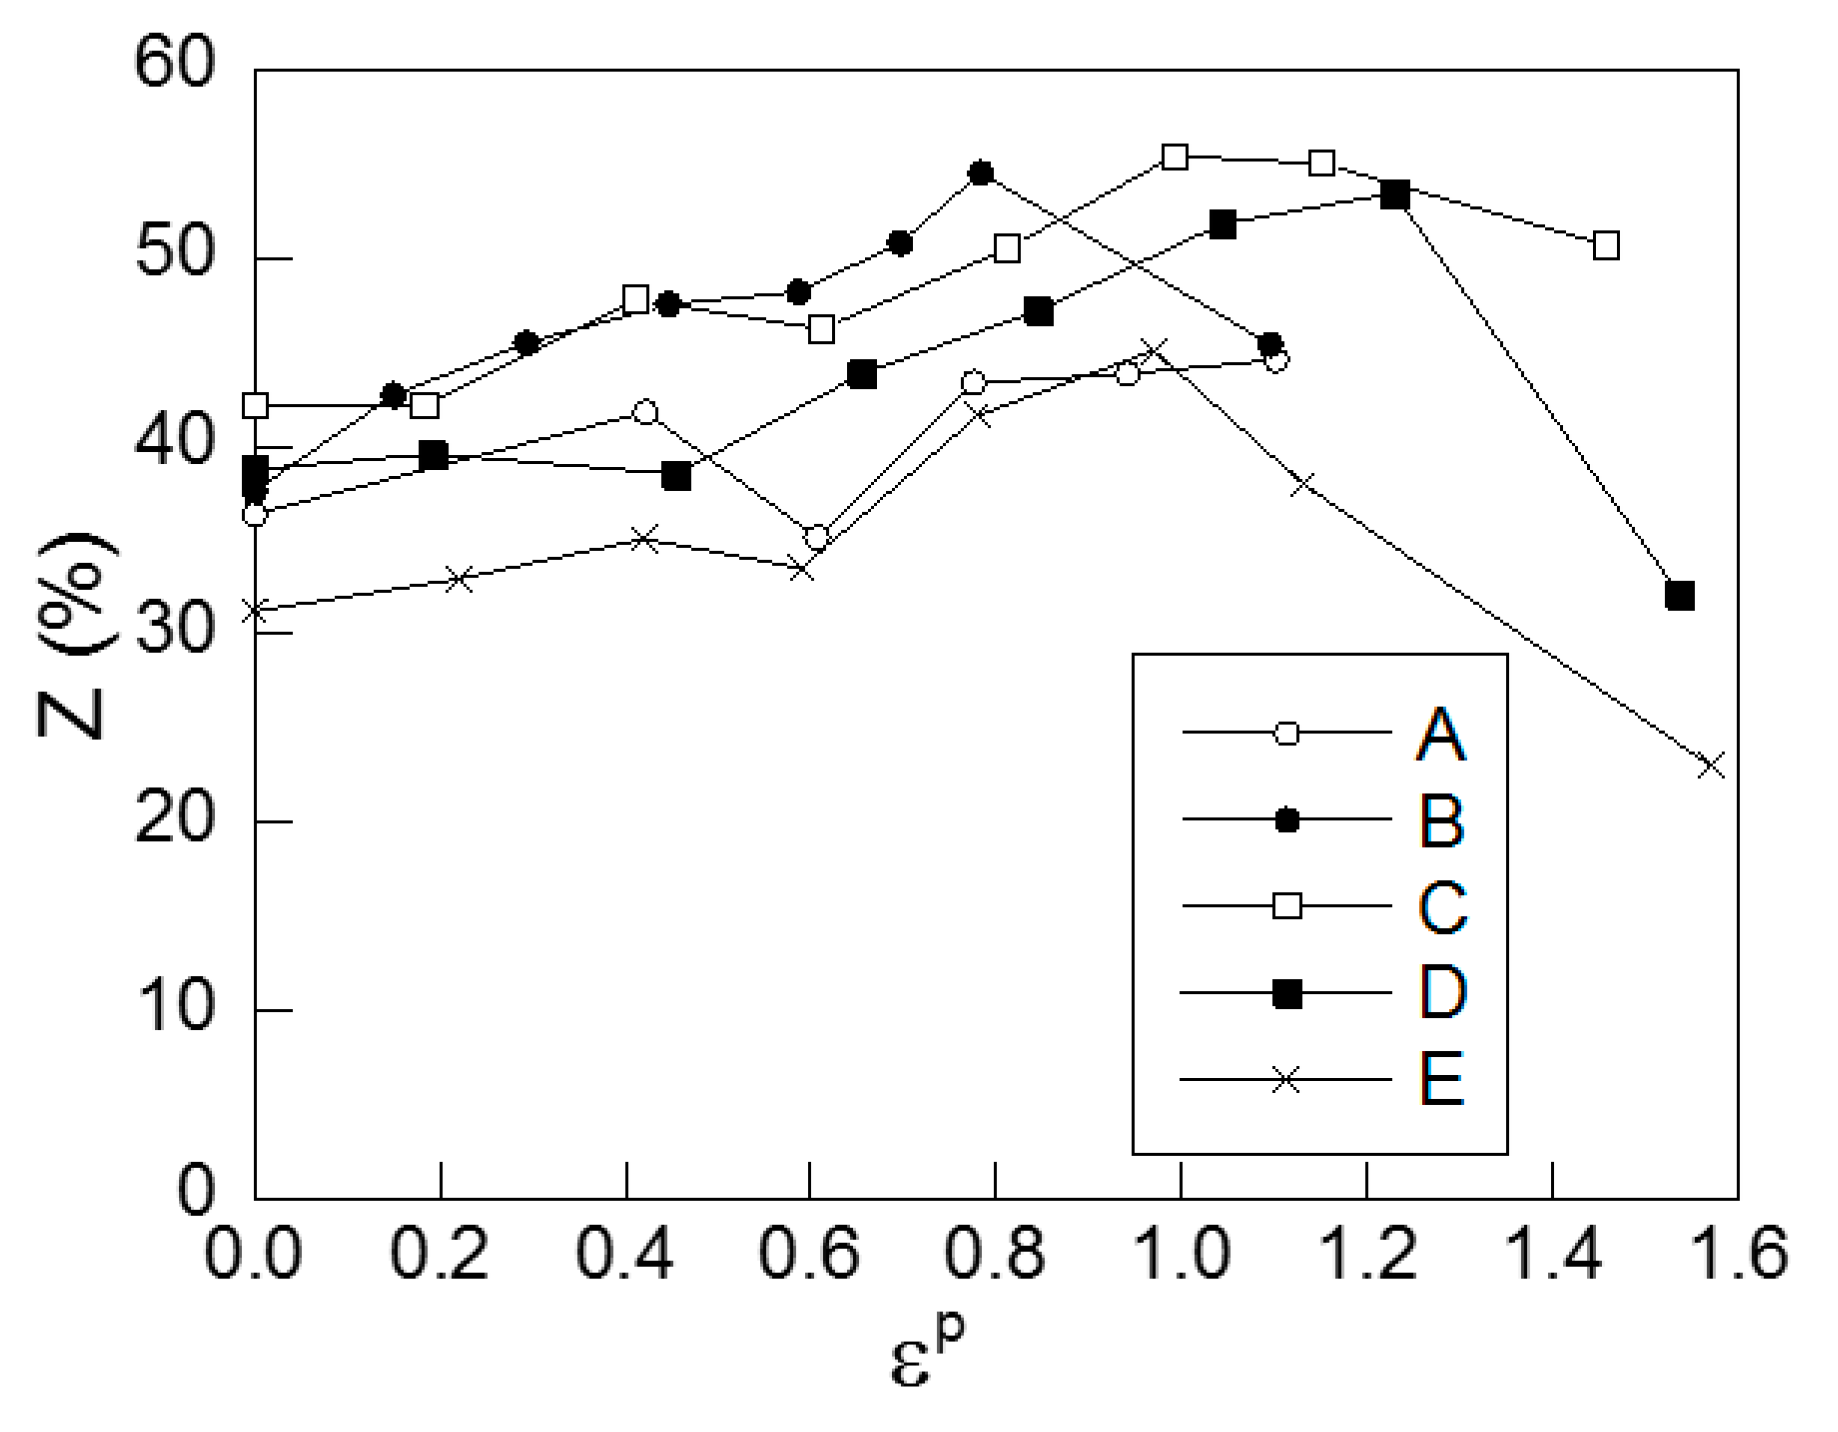
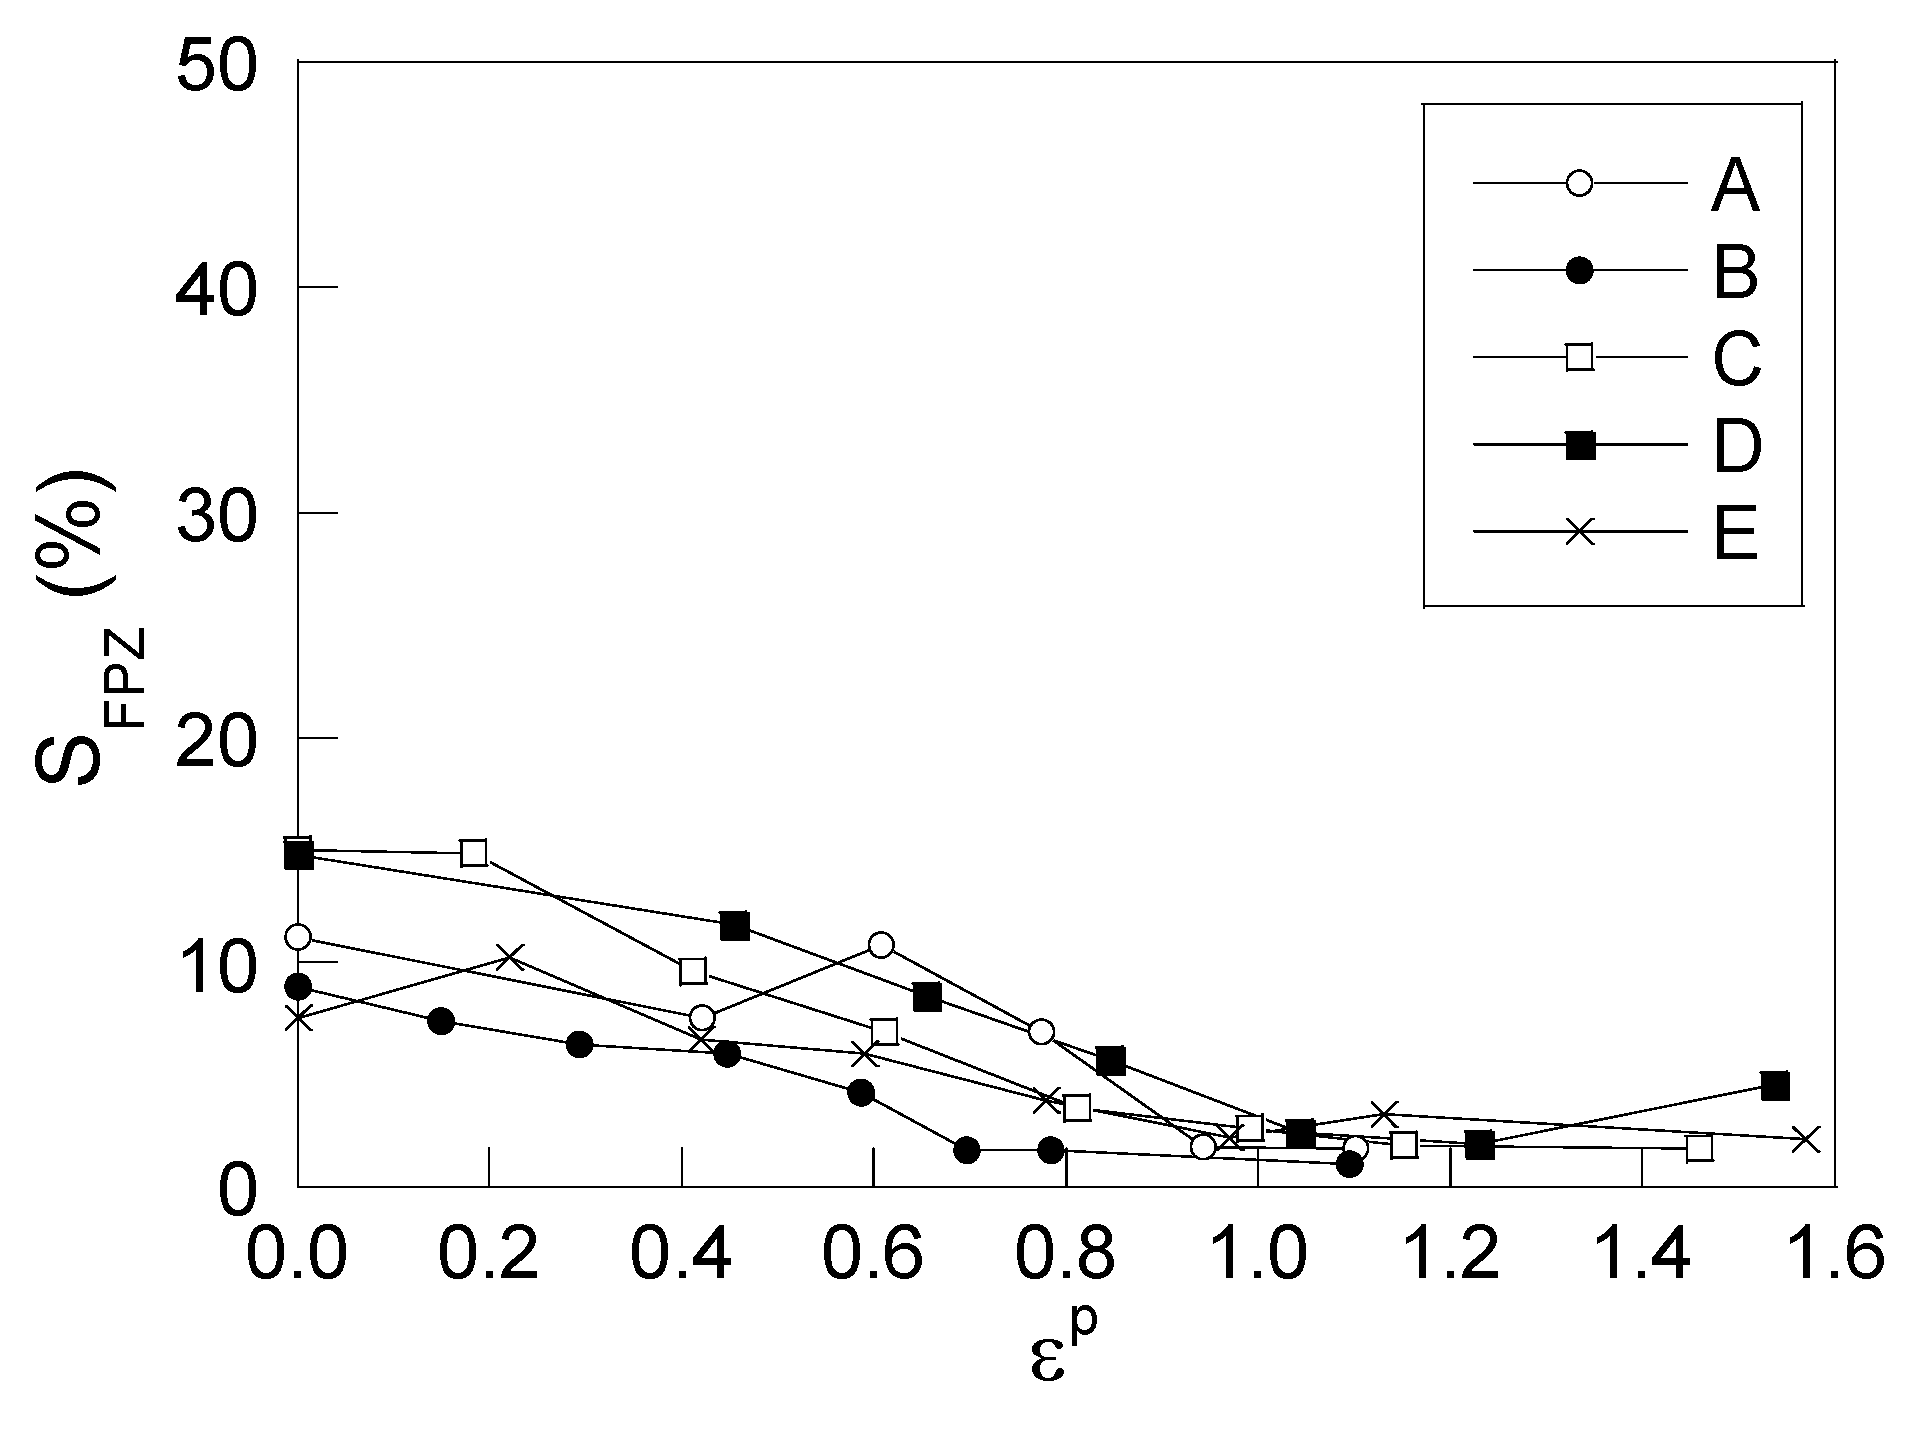
  • With regard to the percentage values of the different parts in the fracture surface, the evolution with cold drawing of the central zone of the fibrous aspect (fracture process zone or FPZ) is similar in all analyzed steels and the same happens in the matter of the external ring (shear lip).

Acknowledgments

The authors wish to acknowledge the financial support provided by the following Spanish Institutions: Ministry for Science and Technology (MICYT; Grant MAT2002-01831), Ministry for Education and Science (MEC; Grant BIA2005-08965), Ministry for Science and Innovation (MICINN; Grant BIA2008-06810), Ministry for Economy and Competitiveness (MINECO; Grant BIA2011-27870), Junta de Castilla y León (JCyL; Grants SA067A05, SA111A07 and SA039A08), and the steel supplied by Emesa Trefilería (La Coruña, Galicia, Spain) and Trefilerías Quijano (Los Corrales de Buelna, Santander, Spain).

Author Contributions

J.T. conceived and designed the experimental procedure; F.J.A., B.G., J.C.M., D.V. and M.L. performed the tests; all the authors analyzed the results and wrote the paper.

Conflicts of Interest

The authors declare no conflict of interest.

Abbreviations

The following abbreviations are used in this manuscript:
FPZ
Fracture Process Zone
SEM
Scanning Electron Microscopy
MFM
Micro-Fracture Map
MVC
Micro-Void Coalescence

References

  1. Tao, Z. Mechanical properties of prestressing steel after fire exposure. Mater. Struct. 2015, 48, 3037–3047. [Google Scholar] [CrossRef]
  2. Hredil, M.I.; Toribio, J. Corrosion resistance of prestressing steel wires. Mater. Sci. 2015, 50, 665–670. [Google Scholar] [CrossRef]
  3. Jin, X.; Wen, Z.; Xiao, X.; Zhou, Z. A numerical method for prediction of curved rail wear. Multibody Syst. Dyn. 2007, 18, 531–557. [Google Scholar] [CrossRef]
  4. Ostash, O.P.; Andreiko, I.M.; Kulyk, V.V.; Vavrukh, V.I. Influence of braking on the microstructure and mechanical behavior of railroad wheel steels. Mater. Sci. 2013, 48, 569–574. [Google Scholar] [CrossRef]
  5. Christodoulou, I.A.; Kermanidis, A.T.; Haidemenopoulos, G.N. Fatigue and fracture behavior of pearlitic Grade 900A steel used in railway applications. Theor. Appl. Fract. Mech. 2016, 83, 51–59. [Google Scholar] [CrossRef]
  6. Gamboa, E.; Atrens, A. Material influence on the stress corrosion cracking of rock bolts. Eng. Fail. Anal. 2005, 12, 201–235. [Google Scholar] [CrossRef]
  7. Lee, S.K.; Ko, D.C.; Kim, B.M. Pass schedule of wire drawing process to prevent delamination for high strength steel cord wire. Mater. Des. 2009, 30, 2919–2927. [Google Scholar] [CrossRef]
  8. Bramfitt, B.L.; Mridha, S. Steels: Near Eutectoid. In Reference Module in Materials Science and Materials; Hashmi, M.S.J., Ed.; Elsevier: Amsterdam, The Netherlands, 2016. [Google Scholar]
  9. Toribio, J.; Lorenzo, M.; Vergara, D.; Kharin, V. Hydrogen degradation of cold-drawn wires: A numerical analysis of drawing-induced residual stresses and strains. Corrosion 2011. [Google Scholar] [CrossRef]
  10. Elices, M. Influence of residual stresses in the performance of cold-drawn pearlitic wires. J. Mater. Sci. 2004, 39, 3889–3899. [Google Scholar] [CrossRef]
  11. Toribio, J.; Kharin, V.; Lorenzo, M.; Vergara, D. Role of drawing-induced residual stresses and strains in the hydrogen embrittlement susceptibility of prestressing steels. Corros. Sci. 2011, 53, 3346–3355. [Google Scholar] [CrossRef]
  12. Toribio, J.; Ovejero, E. Microstructure evolution in a pearlitic steel subjected to progressive plastic deformation. Mater. Sci. Eng. A 1997, 234–236, 579–582. [Google Scholar] [CrossRef]
  13. Toribio, J.; Ovejero, E. Microstructure orientation in a pearlitic steel subjected to progressive plastic deformation. J. Mater. Sci. Lett. 1998, 17, 1037–1040. [Google Scholar] [CrossRef]
  14. Toribio, J.; Ovejero, E. Effect of cumulative cold drawing on the pearlite interlamellar spacing in eutectoid steel. Scr. Mater. 1998, 39, 323–328. [Google Scholar] [CrossRef]
  15. Toribio, J.; Ovejero, E. Effect of cold drawing on microstructure and corrosion performance of high-strength steel. Mech. Time-Depend. Mater. 1998, 1, 307–319. [Google Scholar] [CrossRef]
  16. Zelin, M. Microstructure evolution in pearlitic steels during wire drawing. Acta Mater. 2002, 50, 4431–4447. [Google Scholar] [CrossRef]
  17. Sauvage, X.; Guelton, N.; Blavette, D. Microstructure evolutions during drawing of a pearlitic steel containing 0.7 at. % copper. Scr. Mater. 2002, 46, 459–464. [Google Scholar] [CrossRef]
  18. Guo, N.; Luan, B.; Wang, B.; Liu, Q. Deformation bands in fully pearlitic steel during wire drawing. Sci. China Technol. Sci. 2014, 57, 796–803. [Google Scholar] [CrossRef]
  19. Fang, F.; Zhao, Y.; Liu, P.; Zhou, L.; Hu, X.J.; Zhou, X.; Xie, Z.H. Deformation of cementite in cold drawn pearlitic steel wire. Mater. Sci. Eng. A 2014, 608, 11–15. [Google Scholar] [CrossRef]
  20. Zhang, X.; Godfrey, A.; Huang, X.; Hansen, N.; Liu, Q. Microstructure and strengthening mechanisms in cold-drawn pearlitic steel wire. Acta Mater. 2011, 59, 3422–3430. [Google Scholar] [CrossRef]
  21. Fang, F.; Zhou, L.; Hu, X.; Zhou, X.; Tu, Y.; Xie, Z.; Jiang, J. Microstructure and mechanical properties of cold-drawn pearlitic wires affect by inherited texture. Mater. Des. 2015, 79, 60–67. [Google Scholar] [CrossRef]
  22. Rastegari, H.; Kermanpur, A.; Najafizadeh, A. Effect of initial microstructure on the work hardening behavior of plain eutectoid steel. Mater. Sci. Eng. A 2015, 632, 103–109. [Google Scholar] [CrossRef]
  23. Toribio, J.; Kharin, V.; Ayaso, F.J.; González, B.; Matos, J.C.; Vergara, D.; Lorenzo, M. Numerical and experimental analyses of the plasticity-induced fatigue crack growth in high-strength steels. Const. Build. Mater. 2011, 25, 3935–3940. [Google Scholar] [CrossRef]
  24. Toribio, J.; Matos, J.C.; González, B. A macro- and micro-approach to the anisotropic fatigue behaviour of hot-rolled and cold-drawn pearlitic steel. Eng. Fract. Mech. 2014, 123, 70–76. [Google Scholar] [CrossRef]
  25. Toribio, J.; Ayaso, F.J.; González, B.; Matos, J.C.; Vergara, D.; Lorenzo, M. Critical stress intensity factors in steel cracked wires. Mater. Des. 2011, 32, 4424–4429. [Google Scholar] [CrossRef]
  26. Toribio, J.; González, B.; Matos, J.C. Strength anisotropy and mixed mode fracture in heavily drawn pearlitic steel. Fat. Fract. Eng. Mater. Struct. 2013, 36, 1178–1186. [Google Scholar] [CrossRef]
  27. Toribio, J.; Vergara, D.; Lorenzo, M. Influence of loading rate on the hydrogen-assisted micro-damage in bluntly notched samples of pearlitic steel. Metals 2016, 6, 11. [Google Scholar] [CrossRef]
  28. Meseguer-Valdenebro, J.L.; Miguel, V.; Caravaca, M.; Portolés, A.; Gimeno, F. Teaching mechanical properties of different steels for engineering students. J. Mater. Educ. 2015, 37, 103–118. [Google Scholar]
  29. Toribio, J. On the intrinsic character of the stress-strain curve of a prestressing steel. J. Test. Eval. 1992, 20, 357–362. [Google Scholar] [CrossRef]
  30. Zhang, X.; Godfrey, A.; Hansen, N.; Huang, X.; Liu, W.; Liu, Q. Evolution of cementite morphology in pearlitic steel wire during wet wire drawing. Mater. Charact. 2010, 61, 65–72. [Google Scholar] [CrossRef]
  31. Zhang, X.; Godfrey, A.; Hansen, N.; Huang, X. Hierarchical structures in cold-drawn pearlitic steel wire. Acta Mater. 2013, 61, 4898–4909. [Google Scholar] [CrossRef] [Green Version]
Figure 1. Number of research papers indexed in Scopus related with the following keywords: pearlitic steel, cold drawing, wire drawing, pearlite. (Data collected on February 2016).
Metals 06 00114 g001
Figure 2. Metallographic analysis of the longitudinal section of family B for diverse drawing steps.
Metals 06 00114 g002
Figure 3. Metallographic analysis of the transverse section of family B for diverse drawing steps.
Metals 06 00114 g003
Figure 4. Metallographic analysis of the longitudinal section of family E for diverse drawing steps.
Metals 06 00114 g004
Figure 5. Metallographic analysis of the transverse section of family E for diverse drawing steps.
Metals 06 00114 g005
Figure 6. Stress-strain curves of the progressively-drawn steels: (a) family A with six drawing degrees; (b) family B with seven drawing degrees; (c) family C with seven drawing degrees; (d) family D with seven drawing degrees; and (e) family E with seven drawing degrees.
Metals 06 00114 g006
Figure 7. Mechanical properties evolution with cold drawing, for each one of the five pearlitic families of steels: (a) yield strength; (b) ultimate tensile strength (UTS).
Metals 06 00114 g007
Figure 8. Mathematical fitting of the evolution of the mechanical properties (yield strength and UTS) with cumulative plastic strain of cold-drawn wires.
Metals 06 00114 g008
Figure 9. Evolution with drawing of MFMs of drawn wires corresponding to the family B.
Metals 06 00114 g009
Figure 10. Evolution with drawing of MFMs of drawn wires corresponding to the family E.
Metals 06 00114 g010
Figure 11. Scheme of the parameters used for defining the fracture surfaces in the quantitative fractographic analysis.
Metals 06 00114 g011
Figure 12. Evolution of the reduction of the cross sectional area with cold drawing.
Metals 06 00114 g012
Figure 13. Evolution of the area of the FPZ with the drawing degree.
Metals 06 00114 g013
Figure 14. Evolution of radius of the FPZ with the drawing degree.
Metals 06 00114 g014
Figure 15. Evolution of the area of the external crown with the drawing degree.
Metals 06 00114 g015
Figure 16. Evolution of the average depth of the external crown with the drawing degree.
Metals 06 00114 g016
Table 1. Chemical composition of the five families of steels.
ElementFamily of Steels
ABCDE
% C0.8000.7890.7900.7950.789
% Mn0.6900.6980.6700.6240.681
% Si0.2300.2260.2000.2240.210
% P0.0120.0110.0090.0110.010
% S0.0090.0050.0090.0080.008
% Al0.0040.0030.0030.0030.003
% Cr0.2650.0710.1870.1640.218
% V0.0600.0780.0530.0640.061
Table 2. Diameter of the wires at the end of each drawing step for the five families.
Drawing StepWire Diameter (mm)
Family AFamily BFamily CFamily DFamily E
012.1112.1010.448.5611.03
110.8011.239.527.789.90
29.8110.458.496.828.95
38.949.687.686.178.21
48.229.026.955.617.49
57.568.546.365.086.80
66.988.185.864.636.26
7-7.005.033.975.04
Table 3. Cumulative plastic strain of the progressively drawn steels.
Drawing StepεP
Family AFamily BFamily CFamily DFamily E
000000
10.2290.1490.1840.1910.216
20.4210.2930.4140.4540.418
30.6070.4460.6140.6550.591
40.7750.5880.8140.8450.774
50.9420.6970.9911.0440.967
61.1020.8001.1551.2291.133
7-1.0951.4601.5371.566
Table 4. Main mechanical properties for each drawing step of the considered families.
SteelE (GPa)σY (GPa)σR (GPa)εR
Family A
A01940.721.270.076
A12011.101.290.018
A21871.121.450.030
A31901.181.520.028
A41901.261.580.026
A51951.331.650.022
A62071.571.840.054
Family B
B02020.721.270.066
B12040.841.340.057
B22040.881.370.061
B32030.951.430.052
B42031.011.490.042
B52011.091.550.038
B62011.121.580.035
B72051.581.840.052
Family C
C02030.691.230.066
C11990.781.270.061
C22010.901.360.046
C32040.971.420.047
C42041.061.500.043
C52041.141.580.045
C62041.231.640.042
C72081.651.910.051
Family D
D01940.681.230.072
D11920.841.320.056
D21890.991.420.038
D31941.001.490.045
D42001.071.550.048
D52021.161.630.051
D62021.251.690.047
D72061.651.880.057
Family E
E01990.721.230.068
E11920.831.280.056
E21940.911.360.049
E31920.931.410.055
E41961.021.500.049
E51991.131.600.048
E62001.161.620.043
E72081.491.830.059
E: Young modulus; σY: yield strength; σR: ultimate tensile strength (UTS); εR: strain at maximum load.

