Article

Al-Co Alloys Prepared by Vacuum Arc Melting: Correlating Microstructure Evolution and Aqueous Corrosion Behavior with Co Content

by
Angeliki Lekatou
*,
Athanasios K. Sfikas
,
Christina Petsa
and
Alexandros E. Karantzalis
Department of Materials Science and Engineering, University of Ioannina, Ioannina 45110, Greece
*
Author to whom correspondence should be addressed.
Metals 2016, 6(3), 46; https://doi.org/10.3390/met6030046
Submission received: 18 January 2016 / Revised: 11 February 2016 / Accepted: 19 February 2016 / Published: 27 February 2016
(This article belongs to the Special Issue Oxidation of Metals)

Abstract

:
Hypereutectic Al-Co alloys of various Co contents (7–20 weight % (wt.%) Co) were prepared by vacuum arc melting, aiming at investigating the influence of the cobalt content on the microstructure and corrosion behavior. Quite uniform and directional microstructures were attained. The obtained microstructures depended on the Co content, ranging from fully eutectic growth (7 wt.% and 10 wt.% Co) to coarse primary Al9Co2 predominance (20 wt.% Co). Co dissolution in Al far exceeded the negligible equilibrium solubility of Co in Al; however, it was hardly uniform. By increasing the cobalt content, the fraction and coarseness of Al9Co2, the content of Co dissolved in the Al matrix, and the hardness and porosity of the alloy increased. All alloys exhibited similar corrosion behavior in 3.5 wt.% NaCl with high resistance to localized corrosion. Al-7 wt.% Co showed slightly superior corrosion resistance than the other compositions in terms of relatively low corrosion rate, relatively low passivation current density and scarcity of stress corrosion cracking indications. All Al-Co compositions demonstrated substantially higher resistance to localized corrosion than commercially pure Al produced by casting, cold rolling and arc melting. A corrosion mechanism was formulated. Surface films were identified.

Graphical Abstract

1. Introduction

During the last few decades, rapidly solidified (RS) Al-alloys have been attracting significant attention due to improved properties (such as mechanical behavior and corrosion resistance) in relation to conventional Al alloys [1,2,3,4,5,6,7,8,9,10]. Rapid solidification processes (RSP) can produce many metastable phases, such as supersaturated solid solutions, intermediate phases and metallic glasses. Karakose et al. [2] investigated the microstructure and the mechanical behavior of RS Al-3 wt.% Fe, Al-3 wt.% Cu and Al-3 wt.% Ni alloys: The RS alloys presented more uniform and fine microstructures with minor dendritic or polygonal structures in comparison with their conventional counterparts, while most of the alloying elements remained dissolved in the Al matrix; the undissolved elements formed intermetallic phases (Al3Fe, Al2Cu, Al3Ni). Gogebakan et al. [4] prepared an Al-6.5 wt.% Ni alloy by melt spinning (MS) and casting: RS led to significant hardening attributed to solid solution and grain refinement strengthening. Vidoz et al. [8] prepared Al-Li-Be alloys by melt spinning: The microstructure of the alloys consisted of a relatively featureless matrix containing a homogeneous dispersion of fine beryllium particles, mostly 50 to 500 nm in size. The alloys responded to age hardening in a manner similar to that of binary Al-Li alloys. Yoshioka et al. [9] studied the corrosion behavior of RS Al-alloys containing Mg, Ti, Mn, Cr, Fe, Ni, Cu, Zn, Zr, Nb and/or Si in deaerated 0.5 N NaCl: They reported that RS led to a notable ennoblement of the pitting potential for all alloys except those containing Mg, Fe or Zn. Zhang et al. [10] found that Al75xSi25Cux (x = 1–10 mol%) alloys prepared by MS exhibited high discharge capacity and favorable cyclic voltammetry performance as anode materials for lithium ion batteries.
Regarding RS processing of Al-Co alloys, little information is available, possibly due to their limited (until recently) application potential. Menon and Suryanarayana [11] stated that, at very high cooling rates, at least 5 wt.% Co can be dissolved in Al in the solid state. They also suggested that the tendency for formation of a quasicrystalline phase exists even at Co contents as low as 5 wt.%. Froes et al. [12] claimed that the maximum solubility of Co in Al can be extended from less than 0.01 atomic % (at.%) under equilibrium conditions to 0.5–5.0 at.% under super-cooling conditions. Adam [13] achieved a notable grain refinement of Al9Co2 dendritic crystals by MS of an Al-15.82 wt.% Co alloy in relation to die casting. Garrett and Sanders [14] produced Al-Co alloys of various compositions by MS and reported that the microstructures might contain coarse primary Al9Co2, fine Al9Co2 or primary Al dendrites with Co segregated interdendrically. Yamauchi et al. [15] obtained Ag-Co skeletal catalyst structures by chemical leaching of Al from Al-Ag-(5–12.5 wt.%)Co alloys; the latter had been prepared by RS and mechanical alloying aiming for the formation of metastable materials with pores.
Two quickly developing research fields have rekindled the interest in the Al-Co system: (a) Hydrogen Fuel Cell technologies [16] and (b) Complex Metallic Alloys (CMAs)–Quasi Crystals [17]. CMAs constitute a new class of intermetallic compounds with high structural complexity, giant unit cells containing from tens to more than a thousand atoms and lattice parameters of several nanometers [18]. CMAs have a rising potential as multifunctional materials due to properties, such as low surface energy associated properties (oxidation, corrosion and friction resistance, hydrogen sorption capacity), high hardness, low electrical conductivity and low thermal conductivity [19]. However, their low ductility limits their application potentials. The development of two- or multi-phase structures based on a soft metallic phase and the use of CMAs as coating materials are considered the most promising solutions for overcoming the low temperature ductility of CMAs [20]. The Al9Co2 intermetallic is a CMA with an intermediate structural complexity between B2-AlCo and the decagonal Al-Ni-Co quasicrystal [21]. As a CMA, Al9Co2 has an electronic structure that includes a pseudogap near the Fermi energy, which suggests that this material has a high corrosion resistance compared to simpler alloys [22].
Since corrosion in halide containing solutions is a major issue for Al-alloys [23], it is important to clarify the corrosion behavior of Al-Co alloys. However, corrosion studies have so far dealt with amorphous Al-Co-Ce alloys (Co < 10 at.%), where Co has a positive effect on ennobling the pitting potential, the repassivation potential and the rest potential [24,25,26]. Very few efforts have focused on the corrosion performance of Al-Co alloys with high amounts of CMA phases. Palcut et al. [27] fabricated an Al-29 at.% Co alloy by arc melting, which consisted of three aluminide phases (Al5Co, Al3Co and βAlCo); its corrosion resistance was evaluated in aqueous NaCl (0.6 mol·dm−3). The anodic polarization behavior of the alloy included three stages: an active corrosion stage, a very small stabilization stage and a steady current increase stage. Recently, Palcut et al. [28] fabricated Al-Co alloys of 24–28 at.% Co content, which were also entirely composed of Al-Co intermetallic phases; they observed galvanic coupling between nobler and less noble intermetallic phases and pitting in 0.6 mol·dm−3 NaCl. Previous work by the authors reported very good corrosion performances (in terms of localized corrosion susceptibility) for Al-32 wt.% Co (17.7 at.% Co) manufactured by casting, arc melting and free sintering [29]. Among the three different techniques of preparation, melting led to the lowest corrosion rate, which was attributed to the low porosity attained and the high surface area of Al13Co4. Here, it should be added that the presence of a high content of transition metals (TM) in the alumina layer is considered to improve the corrosion resistance of binary Al-TM alloys [30,31,32,33] and Al-CMAs [34,35].
The present effort presents the comparative corrosion behavior of Al-Co alloys of various compositions in the Al-Al9Co2 side of the Al-Co phase diagram [36] prepared by vacuum arc melting, with the aim to determine the Co content that leads to the highest corrosion resistance. The Al-Al9Co2 region of the Al-Co phase diagram was selected with the aim to attain a two-phase structure (Al + Al9Co2) that could combine the aforementioned beneficial features of Al9Co2, as a CMA in situ reinforcement, with the ductility/toughness of Al, as a matrix to brittle Al9Co2. The final objective (addressed in a future publication) is to determine the lowest Co content that could lead to an optimum combination of attributes, such as corrosion resistance, ductility, wear resistance, specific weight and cost of raw materials.

2. Materials and Methods

2.1. Raw Materials and Fabrication

Al-Co alloys (7, 10, 15, 20 wt.% Co or 3.3, 4.9, 7.5, 10.3 at.% Co, respectively) were fabricated by vacuum arc remelting (VAR). Appropriate mixtures of Al powder (finer than 44 μm, 99.5% purity) and Co powder (finer than 37 μm, 99.5% purity), were introduced into the furnace (placed in a water cooled copper crucible) and were melted at ~(2200–2500) °C. The input load was 3.8–4.0 g. Arc was initiated and maintained through the use of a W electrode with a direct current of 120 A. Prior to melting, the furnace chamber was evacuated and filled up with high purity argon. Each specimen was melted three times by turning over to attain chemical homogeneity. After turning-off the power, the drops were retained in the argon filled chamber for ~1 min. After extraction from the furnace chamber, the drops were left to cool in the laboratory environment. The as-fabricated drops had the shape of a meniscus, with a maximum diameter of 17–20 mm and maximum height of 8–10 mm.
It should be noted that powders of fine particle size (<325 mesh) were employed in order to ensure a satisfactory homogenization both at the mixing and the melting stages. Preliminary experiments using precursor powders of either greater particle sizes or quite different particle sizes or even in a granular form revealed an uneven distribution of the involved elements, which in turn had to be tackled with a much higher number of remelting steps. It should also be noted that alloys of Co contents higher than 20 wt.% were not prepared in this study in order to avoid the formation of accountable amounts of a second intermetallic phase (as will be seen in Section 3.1.1) that would possibly increase the brittleness of the alloy and change the corrosion mechanism.

2.2. Microstructure, Composition and Hardness Evaluation

The microstructure evaluation was performed by Scanning Electron Microscopy (SEM, JEOL, Tokyo, Japan) using the JEOL JSM 6510 LV SEM/Oxford Instruments X-Act EDX equipment (secondary electron (SE) and back scattered electron (BSE) modes). Chemical etching was conducted in order to reveal the Al grain boundaries in samples of commercially pure Al (10% HF, 10 s [37]). X-Ray Diffraction (XRD) patterns were obtained by the Bruker D8 Advance Diffractometer (Ni-filtered CuKα1 radiation (λ = 1.5418 Å), standard slit, step size: 0.02°, step time: 2 s/step, Bruker, MA, USA). The hardness of the alloys was measured by the Inovatest IN-700M tester (average of 5 measurements per sample, 2 samples, polished cross-sections, Innovatest Europe BV, Maastricht, The Netherlands). The microhardness of (Al) was measured by a Shimadzu HV-tester (8 cross-sectional measurements per sample, 2 samples, polished cross-sections, ASTM E 384, Shimadzu, Kyoto, Japan). The Co and Al contents in the final products were determined by X-Ray Fluorescence (XRF) using a flat crystal spectrometer (S4-Explorer, Bruker, MA, USA); the values reported herein are the mean values from 3 different specimens. The 2-D porosity of the specimens was estimated by image analysis (Leica 4000 optical microscope equipped with Leica AS image analysis software, Leica Microsystems, Wetzlar, Germany) on polished cross-sections (×200); the determination of porosity was based on the analysis of 10 separate fields of view. The quantitative phase composition of the alloys was also estimated by image analysis (JEOL JSM 6510 LV, Image J software, Wayne Rasband at the National Institutes of Health, Bethesda, Maryland, MD, USA) on polished cross-sections (×100, ×500); the reported values are the mean values of at least 10 measurements from different fields of view.

2.3. Corrosion Testing

For corrosion testing, the as-cast “drops” were cut in half (along the transverse axis) with a diamond saw. The resulting surfaces were ground to 1000 grit, ultrasonically cleaned and encapsulated in PTFE (Polytetrafluoroethylene), leaving a surface area of ~1 cm2 to be exposed to aerated 3.5 wt.% NaCl at 25 °C. Potentiodynamic polarization tests were performed by an ACM Gill AC potentiostat (ACM Instruments, Cumbria, UK). A standard three-electrode cell was employed with Ag/AgCl (3.5 M KCl, EAgCl = ESHE − 200 mV, SHE: Standard Hydrogen Electrode) as the reference electrode and a platinum gauze as the counter electrode. The rest potential was determined after 4 h of immersion in 3.5 wt.% NaCl (open circuit state). Following determination of the rest potential, polarization started at a scan rate of 10 mV/min.
The corrosion current densities (average of 4–5 values) were calculated by Tafel extrapolation [38]. The extrapolation was performed by linear regression analysis (least squares method) applied to the E versus log (i) data starting from potentials differing from the rest potential by at least 50 mV and extending over a current density range of at least one order of magnitude. Reasonable accuracy was ensured by conforming to several criteria, analytically reported in a previous effort [39]. Epigrammatically, the following criteria were applied: (a) A sufficiently low scan rate (10 mV/min) was employed; (b) the Tafel region was extended over a current density range of at least one order of magnitude; (c) the linear fit was only accepted if the regression coefficient was found greater than 0.98; (d) the linear regression analysis was started at sufficiently large overpotentials (differing from the rest potential by at least 50 mV); (e) only one reduction process was considered in the range of linear fit (in neutral solutions, such as naturally aerated 3.5 wt.% NaCl, the cathodic current is almost entirely consumed by the reduction of dissolved oxygen [40]); (f) if only one of the two polarization curves presented a linear region extending over a current density range of at least one order of magnitude, then Tafel extrapolation was only applied to this curve.
The susceptibility of the alloys to localized corrosion was investigated by reverse polarization. The main concept of this technique is that pitting would occur if the current density of the anodic portion of the return scan is higher than the current density of the forward scan for the same anodic potential [41]. This type of hysteresis is labelled as “negative hysteresis” (More details can be found in [42]).
The nature of the corrosion products was investigated by Raman Spectroscopy using the Labram HR Horiba Scientific spectrometer (laser excitation wavelength of 514 nm, laser power of 12 mW, power incident on the sample surface of 2 mW, focused spot diameter of ~1 μm, Horiba, Kyoto, Japan).

3. Results and Discussion

3.1. Microstructural Analysis

3.1.1. Microstructure Evolution

Figure 1 illustrates the XRD patterns of the fabricated Al-Co alloys. All specimens exhibit similar patterns that reveal the presence of αAl and Al9Co2. The increase in the Co content has led to an increase in the relative intensity of the peaks corresponding to Al9Co2 (towards the peaks of Al). At the composition of Al-20 wt.% Co, Al9Co2 has become the prevailing phase in the alloy. There is a possibility of a minimal presence of Al13Co4 in the 20 wt.% Co alloy. The presence of Al13Co4 cannot be confirmed on the basis of XRD only, since peaks that can be assigned to Al13Co4 appear at angles, where Al9Co2 and Al also present diffraction peaks, as seen in Figure 1. A minor peak at 2θ = 72.32° can be assigned solely to Al13Co4.
These results are in compliance with the Al-Co phase diagram [36]. According to the Al-Co phase diagram, under equilibrium conditions, Al9Co2 is formed by the eutectic reaction:
Al(l) = αAl(s) + Al9Co2(s) (657 °C)
The eutectic point of the system Al-Al9Co2 is located at 0.45 at.% (0.81 wt.%) Co. Therefore, the expected microconstituents for all the employed compositions (at room temperature, under equilibrium conditions) are: primary or pre-eutectic Al9Co2 and a eutectic microconstituent composed of αAl and Al9Co2. Table 1 presents the expected percentages of the microconstituents when prepared under equilibrium conditions (calculated by the lever rule).
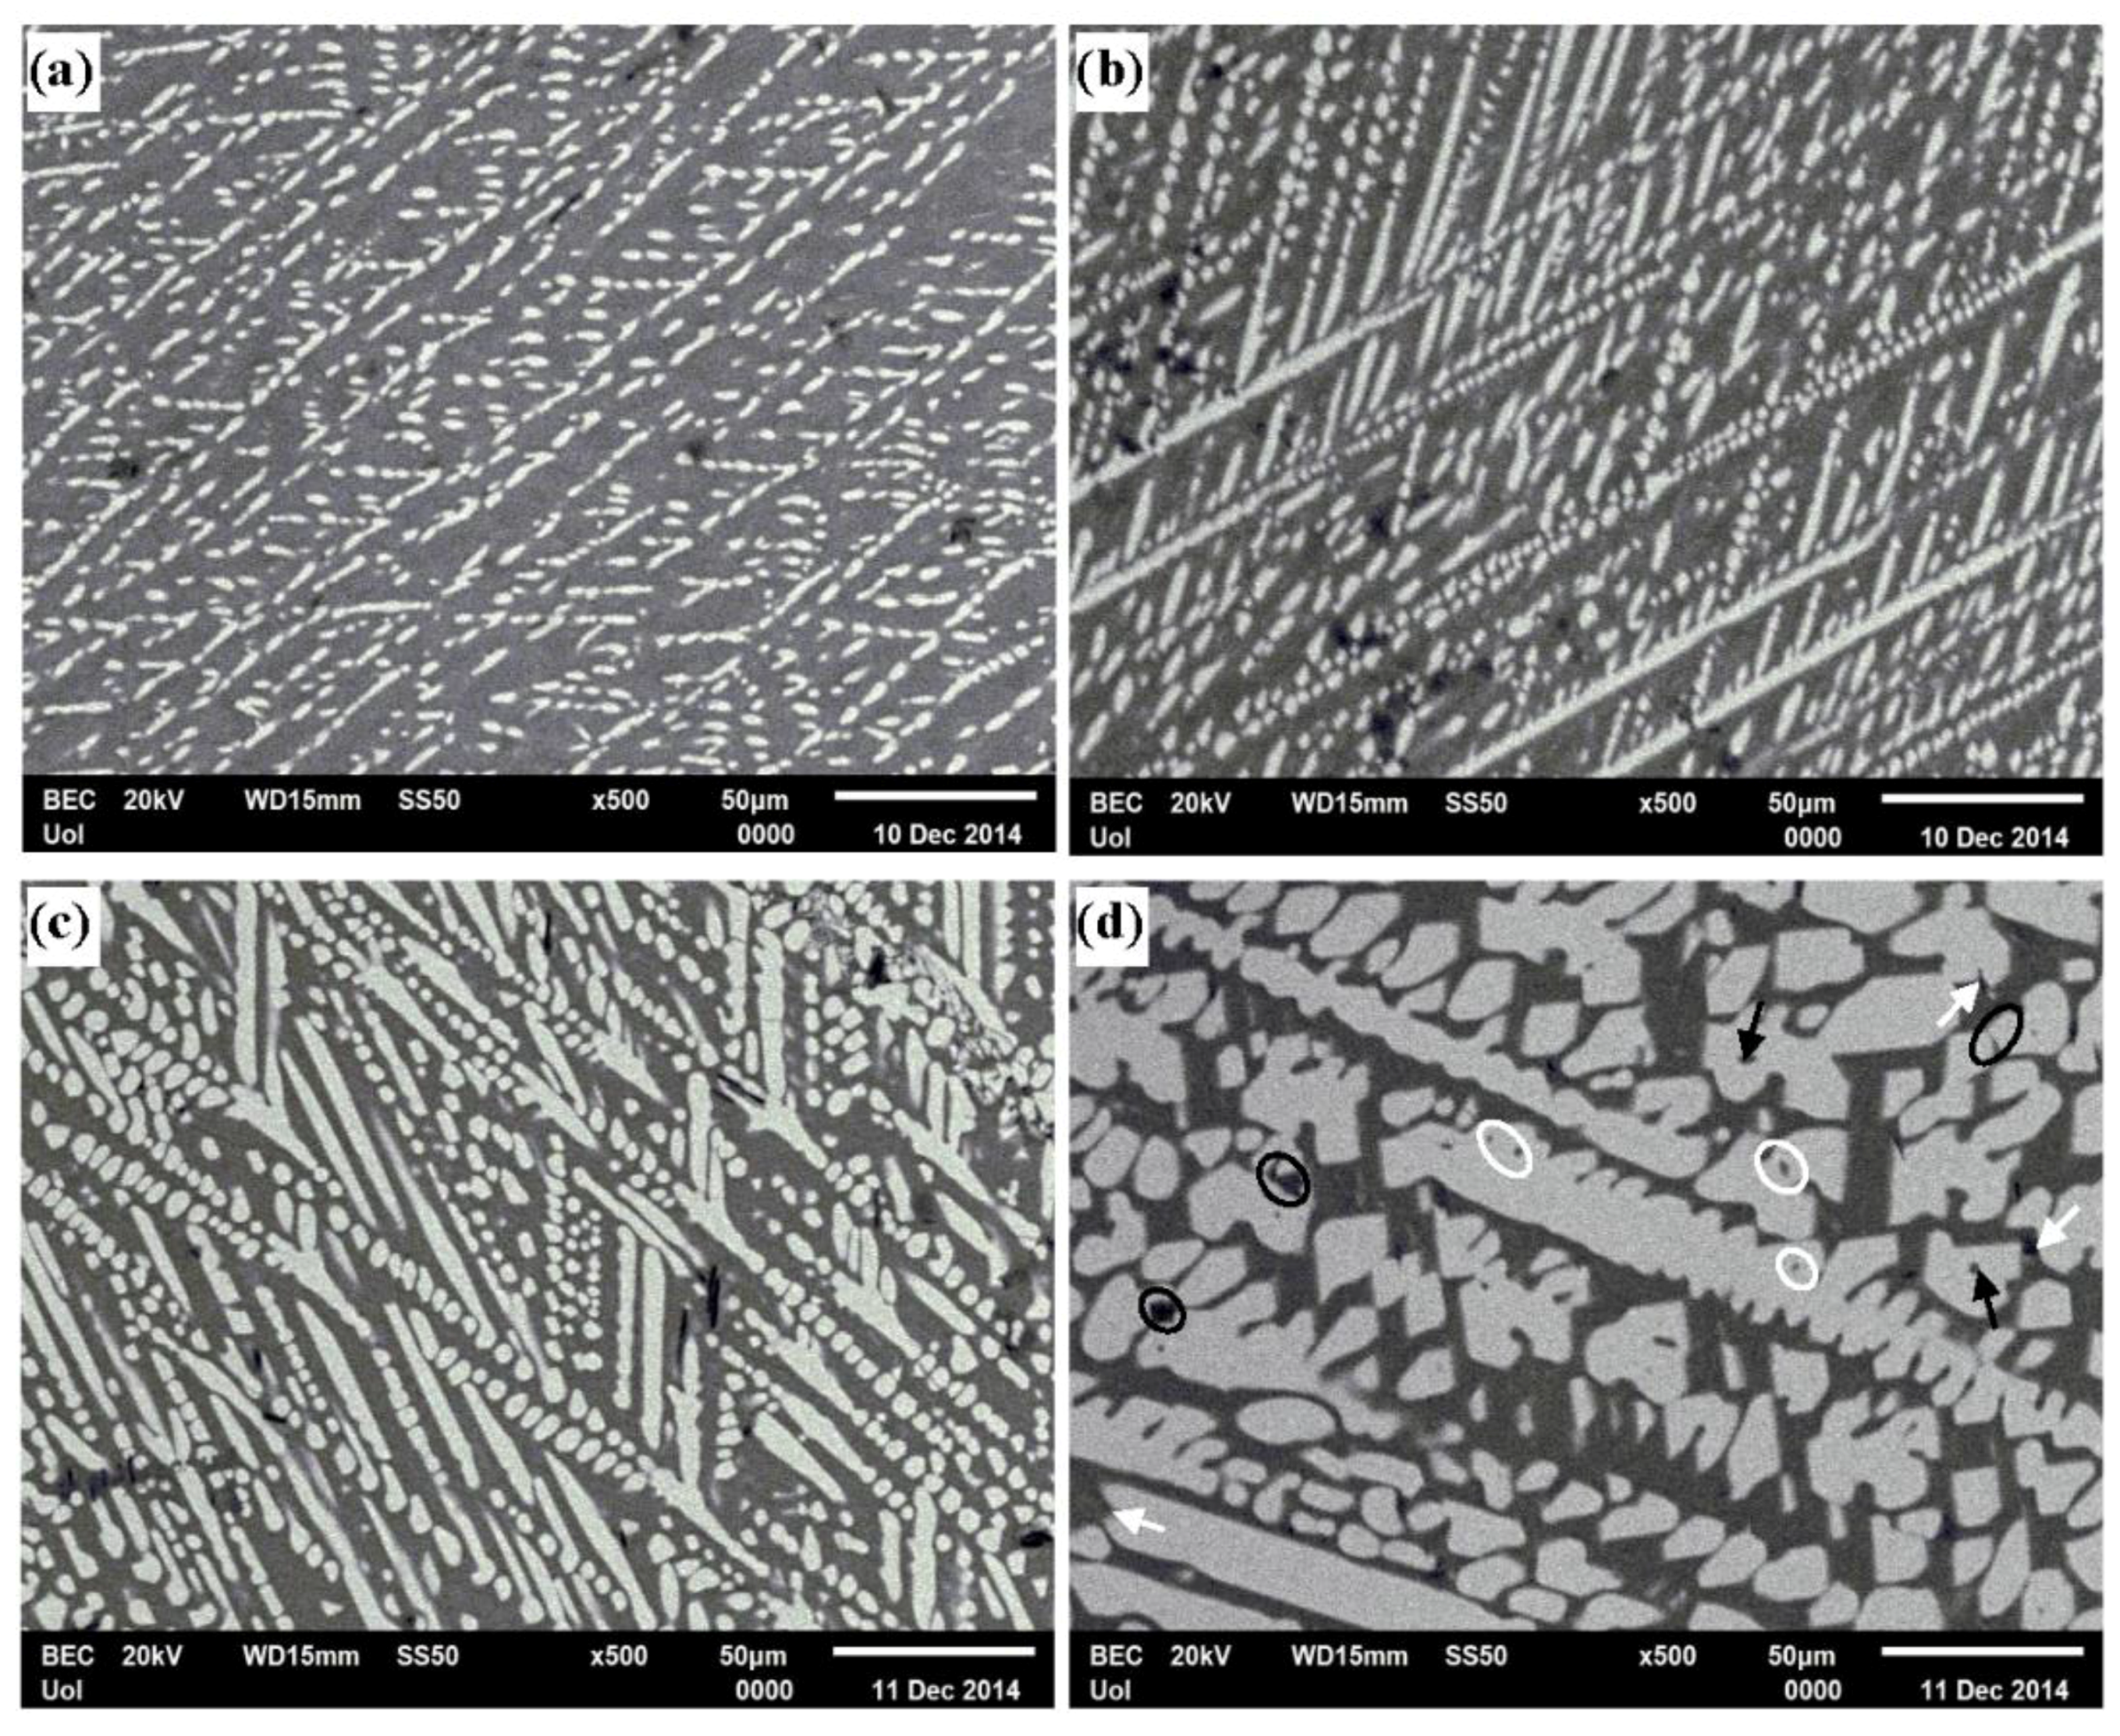
Figure 2 illustrates the microstructures of the alloys, as-fabricated. The microstructures of the alloys in Figure 2a,b (Al-7 wt.% Co and Al-10 wt.% Co, respectively) appear almost exclusively eutectic with directionality. The preferred orientation of the Al9Co2 crystallites is considered responsible for the variation in the Al9Co2 diffraction peak intensities (Figure 1) in comparison with the reference patterns in the Powder Diffraction File (PDF) database (3-0007 and 6-0699).
A likely explanation for the excessive extent of the eutectic morphology, despite the fact that the employed compositions are hypereutectic, is that rapid cooling has largely suppressed the pre-eutectic stage, not allowing the primary Al9Co2 crystallites to grow. In the case of Al-7 wt.% Co, fine plates of Al9Co2 are distributed in the ductile matrix in a uniform and highly ordered/orientated pattern. Barclay et al. [43] were the first to show that the Al-Co system is a system where aligned eutectics could be grown at off-eutectic compositions by RS.
In the case of Al-15 wt.% Co, a planar Al9Co2 phase is observed to coexist with the eutectic microconstituent composed of Al9Co2 and Al (Figure 2c).
In Figure 2a–c, it can be observed that the Al9Co2 eutectic stripes are not continuous; instead, they consist of small building brick-like units that form a pattern of characteristic directionality. It seems like the Al9Co2 phase was to grow in a continuous mode of directional stripes that were eventually chopped off in small units. The reason for such development can be sought in the solidification conditions during the eutectic reaction for the formation of Al9Co2. According to Jackson’s classic theory of nucleation [44,45], for an existing crystal to continue to grow, a certain degree of undercooling should be present and maintained in front of the advancing crystal surfaces. It is also known that the undercooling increases with a solidification cooling rate; hence, the diffusion ability of the solute in the melt decreases [46]. At the onset of a eutectic reaction, where the cooling rate is high, the first Al9Co2 eutectic block units are formed. However, their formation depletes the surrounding liquid from Co; as a consequence, the necessary undercooling for the Al9Co2 crystal advancing ceases to exist. Thus, the Al9Co2 phase cannot grow in a continuous manner, yet the directionality induced by the characteristic heat flow during VAR ensures this specific distribution pattern of the Al9Co2 eutectic units (also observed in different types of composite materials fabricated by VAR [47]).
In the case of Al-20 wt.% Co, a different morphology is observed (Figure 2d): The intermetallic phase is in the form of coarse particles and blades. This morphology indicates the possibility of extensive pre-eutectic Al9Co2 presence, consistent with Sater et al. [48,49]. More specifically, the above authors noticed that the volume fraction of coarse Al9Co2 precipitates in RS Al-alloys increased as the Co content increased or the cooling rate decreased. A likely explanation for this mode of growth is based on the different thermal conductivities of αAl and Al9Co2: Al9Co2, as a CMA, has a low thermal conductivity [50] (substantially lower than that of the highly conductive Al). As such, its cooling rate is lower than that of Al. Therefore, in the case of high Co concentration, the pre-eutectic stage cannot be suppressed and the growth of coarse primary Al9Co2 is favored. The postulation is in agreement with Garrett and Sanders [14], who claimed that coarse Al9Co2 in RS hypereutectic Al-Co alloys fabricated by MS is of pre-eutectic nature nucleating directly from the melt; its formation is associated with relatively low cooling rates. A decrease in the cooling rate has also been found responsible for the increase in the volume fraction of coarse faceted intermetallic phase (Ag3Sn) at the expense of the fine eutectic morphology of a Sn-Ag hypereutectic alloy fabricated by VAR [51]. Menon and Suryanarayana [11] offered an alternative explanation for the presence of coarse primary Al9Co2 in the microstructure of RS Al-5 wt.% Co, which is associated with the instability of the supersaturated solid solution: Due to the high contents of Co, the supersaturated α-solid solution is so unstable that, during cooling, the solute is rejected and builds up to the level required for the formation of the intermetallic phase.
To summarize, as the Co content increases, the amount of eutectic Al9Co2 decreases in favor of the amount of primary Al9Co2.

3.1.2. Microstructure and Composition Data

Table 2 lists microstructure-related and composition data of the produced alloys. XRF analysis confirmed an almost complete agreement between the targeted and the actually attained compositions (Table 2, column 2). Two main phases have been identified by quantitative EDX analysis: Al9Co2 and αAl. The volume fraction of Al9Co2 increases as the Co content increases (Table 2, column 3) in accordance with the XRD indications (Figure 1). Al9Co2 presents a composition close to the theoretical one, as the fourth column in Table 2 shows (theoretical Co content corresponding to the stoichiometry 9/2: 18.18 at.%).
Column 5 in Table 2 gives the maximum amounts of Co dissolved in αAl, as determined by quantitative EDX in different areas of each specimen and at distances greater than 2 μm from the Al9Co2/(Al) boundaries in order to avoid interference with the cobalt of Al9Co2. (The EDS spatial resolution for high atomic number elements is reported as (0.2–1) μm3 for high atomic number elements, for usual high voltage conditions (15–25 kV) [52].)
All these values are well beyond the maximum solubility of Co in Al under equilibrium, which is negligible according to the Al-Co phase diagram [36]. This supersaturation can be attributed to the high cooling rates (101–102 K/s [53]) that have led to microstructures off equilibrium and extended the solid solubility limit of Co in the (Al) matrix. The reason for reporting only the maximum content of Co dissolved in (Al) is that, in all compositions, a wide range of Co contents in the Al matrix was measured, starting from values as low as ~0.1 at.%. This scattering can partly be explained by the fact that the specimens during melting were placed in a water cooled Cu crucible; therefore, the periphery of the specimen was cooled and solidified faster than its interior leading to higher values of trapped Co in the Al lattice. A complementary explanation is related to the inherent instability of the supersaturated solid solution; due to this instability, the solid solution may start immediately decomposing, even while the solidified alloy is cooling down to room temperature [11]. According to Menon and Suryanarayana [11], a cooling rate higher than 107 K/s is required for the formation of homogeneous supersaturated solid solutions in the Al-Co system. Such a high cooling rate can only be achieved by such RS techniques as gun quenching.
Porosity in the alloys is quite low but increases as the Co content increases (Table 2, column 6). A number of reasons can account for this trend:
(a) As the Co content increases, the surface area of the coarse primary Al9Co2 particles formed directly from the melt increases; their solidification is relatively slow and precedes the solidification of eutectic Al. Owing to fast cooling, molten Al does not have the necessary time to fill the narrow and semi-closed spaces between neighboring intermetallic particles (black outlined ellipses in Figure 2d).
(b) As Co increases, stress concentration points—such as Al9Co2 blade and acicular plate tips (white arrows in Figure 2d), angles between Al9Co2 dendrite arms, intersections of dendrites and dendrite arms (white ellipses in Figure 2d)—increase.
(c) At 20 wt.% Co, pores are occasionally observed in the middle of the intermetallic particles (black arrows in Figure 2d). In this composition, the formation of Al13Co4 is a possibility at localized areas of high Co concentration, according to the XRD indications and previous work [29]. There, the coexistence of Al13Co4 and Al9Co2 is the outcome of two peritectic reactions [36]:
L + Al3Co → Al13Co4 (1093 °C)
L + Al13Co4 → A9Co2 (970 °C)
Therefore, the Al13Co4 phase is expected to be enveloped by Al9Co2 (Indeed, this envelopment will be demonstrated in Section 3.2.4). If an appreciable difference between the densities of the two solid phases involved in reaction (3) exists, then the transformation may lead to the formation of porosity at the Al13Co4/Al9Co2 interface.
(d) At the low Co contents (i.e., 7 wt.% Co, 10 wt.% Co), the fine and dense eutectic microstructure may obstruct the development of defects such as porosity.
Table 2 (column 7) also shows that the hardness of the alloy substantially increases with increasing Co content. This increase is attributed to two factors: (a) increase in the extent of the hard (but brittle) intermetallic phase of Al9Co2 and corresponding decrease in the extent of the soft Al phase; and (b) solid solution strengthening by dissolution of Co in the Al matrix. Indeed, regarding the second factor, Table 2 shows that the microhardness of Al increases with increasing Co content. These two factors surpass the hardness increasing effect of the fine microstructure observed at lower Co contents (7 wt.% Co).
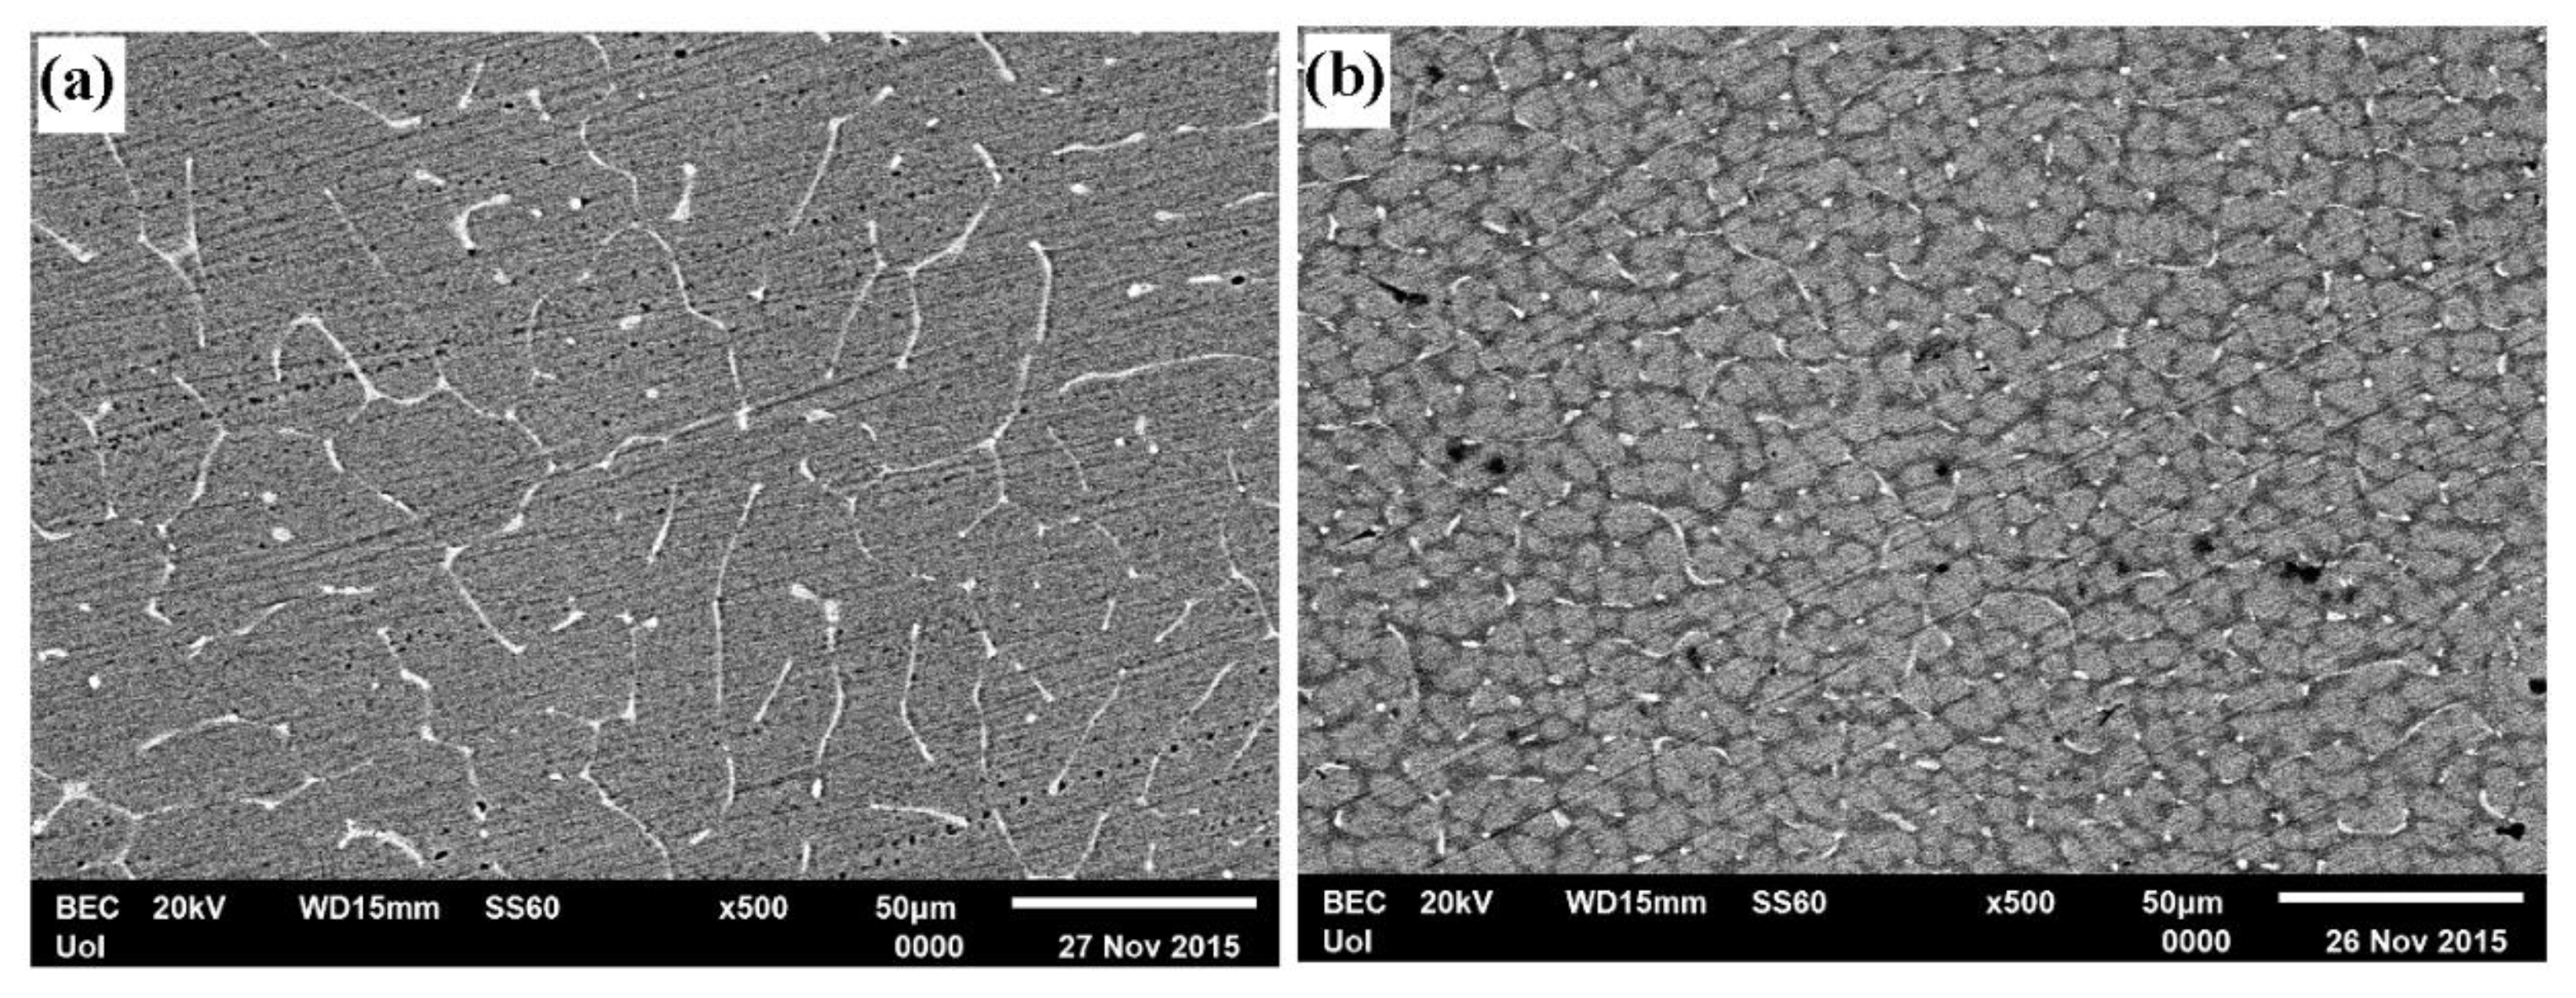
Although outside the main scope of this work, a few brief comments on the relative hardness of the three forms of commercially pure aluminum (CP-Al) in Table 2, column 7 are considered appropriate. Al1050 (wrought/sheet) presents higher hardness than conventionally stir cast Al1050 owing to the existence of a higher density of dislocations introduced by the H14 temper (H14: Cold work hardening by rolling to half hard, not annealing after rolling). Aluminum by VAR presents the highest hardness of all forms attributed to reasons due to the high cooling rate, such as grain refinement and thermal stress development. In fact, the (Al) grain refinement achieved by VAR is manifested in Figure 3.

3.2. Corrosion Performance in 3.5 wt.% NaCl

3.2.1. Polarization Behavior of Al-Co

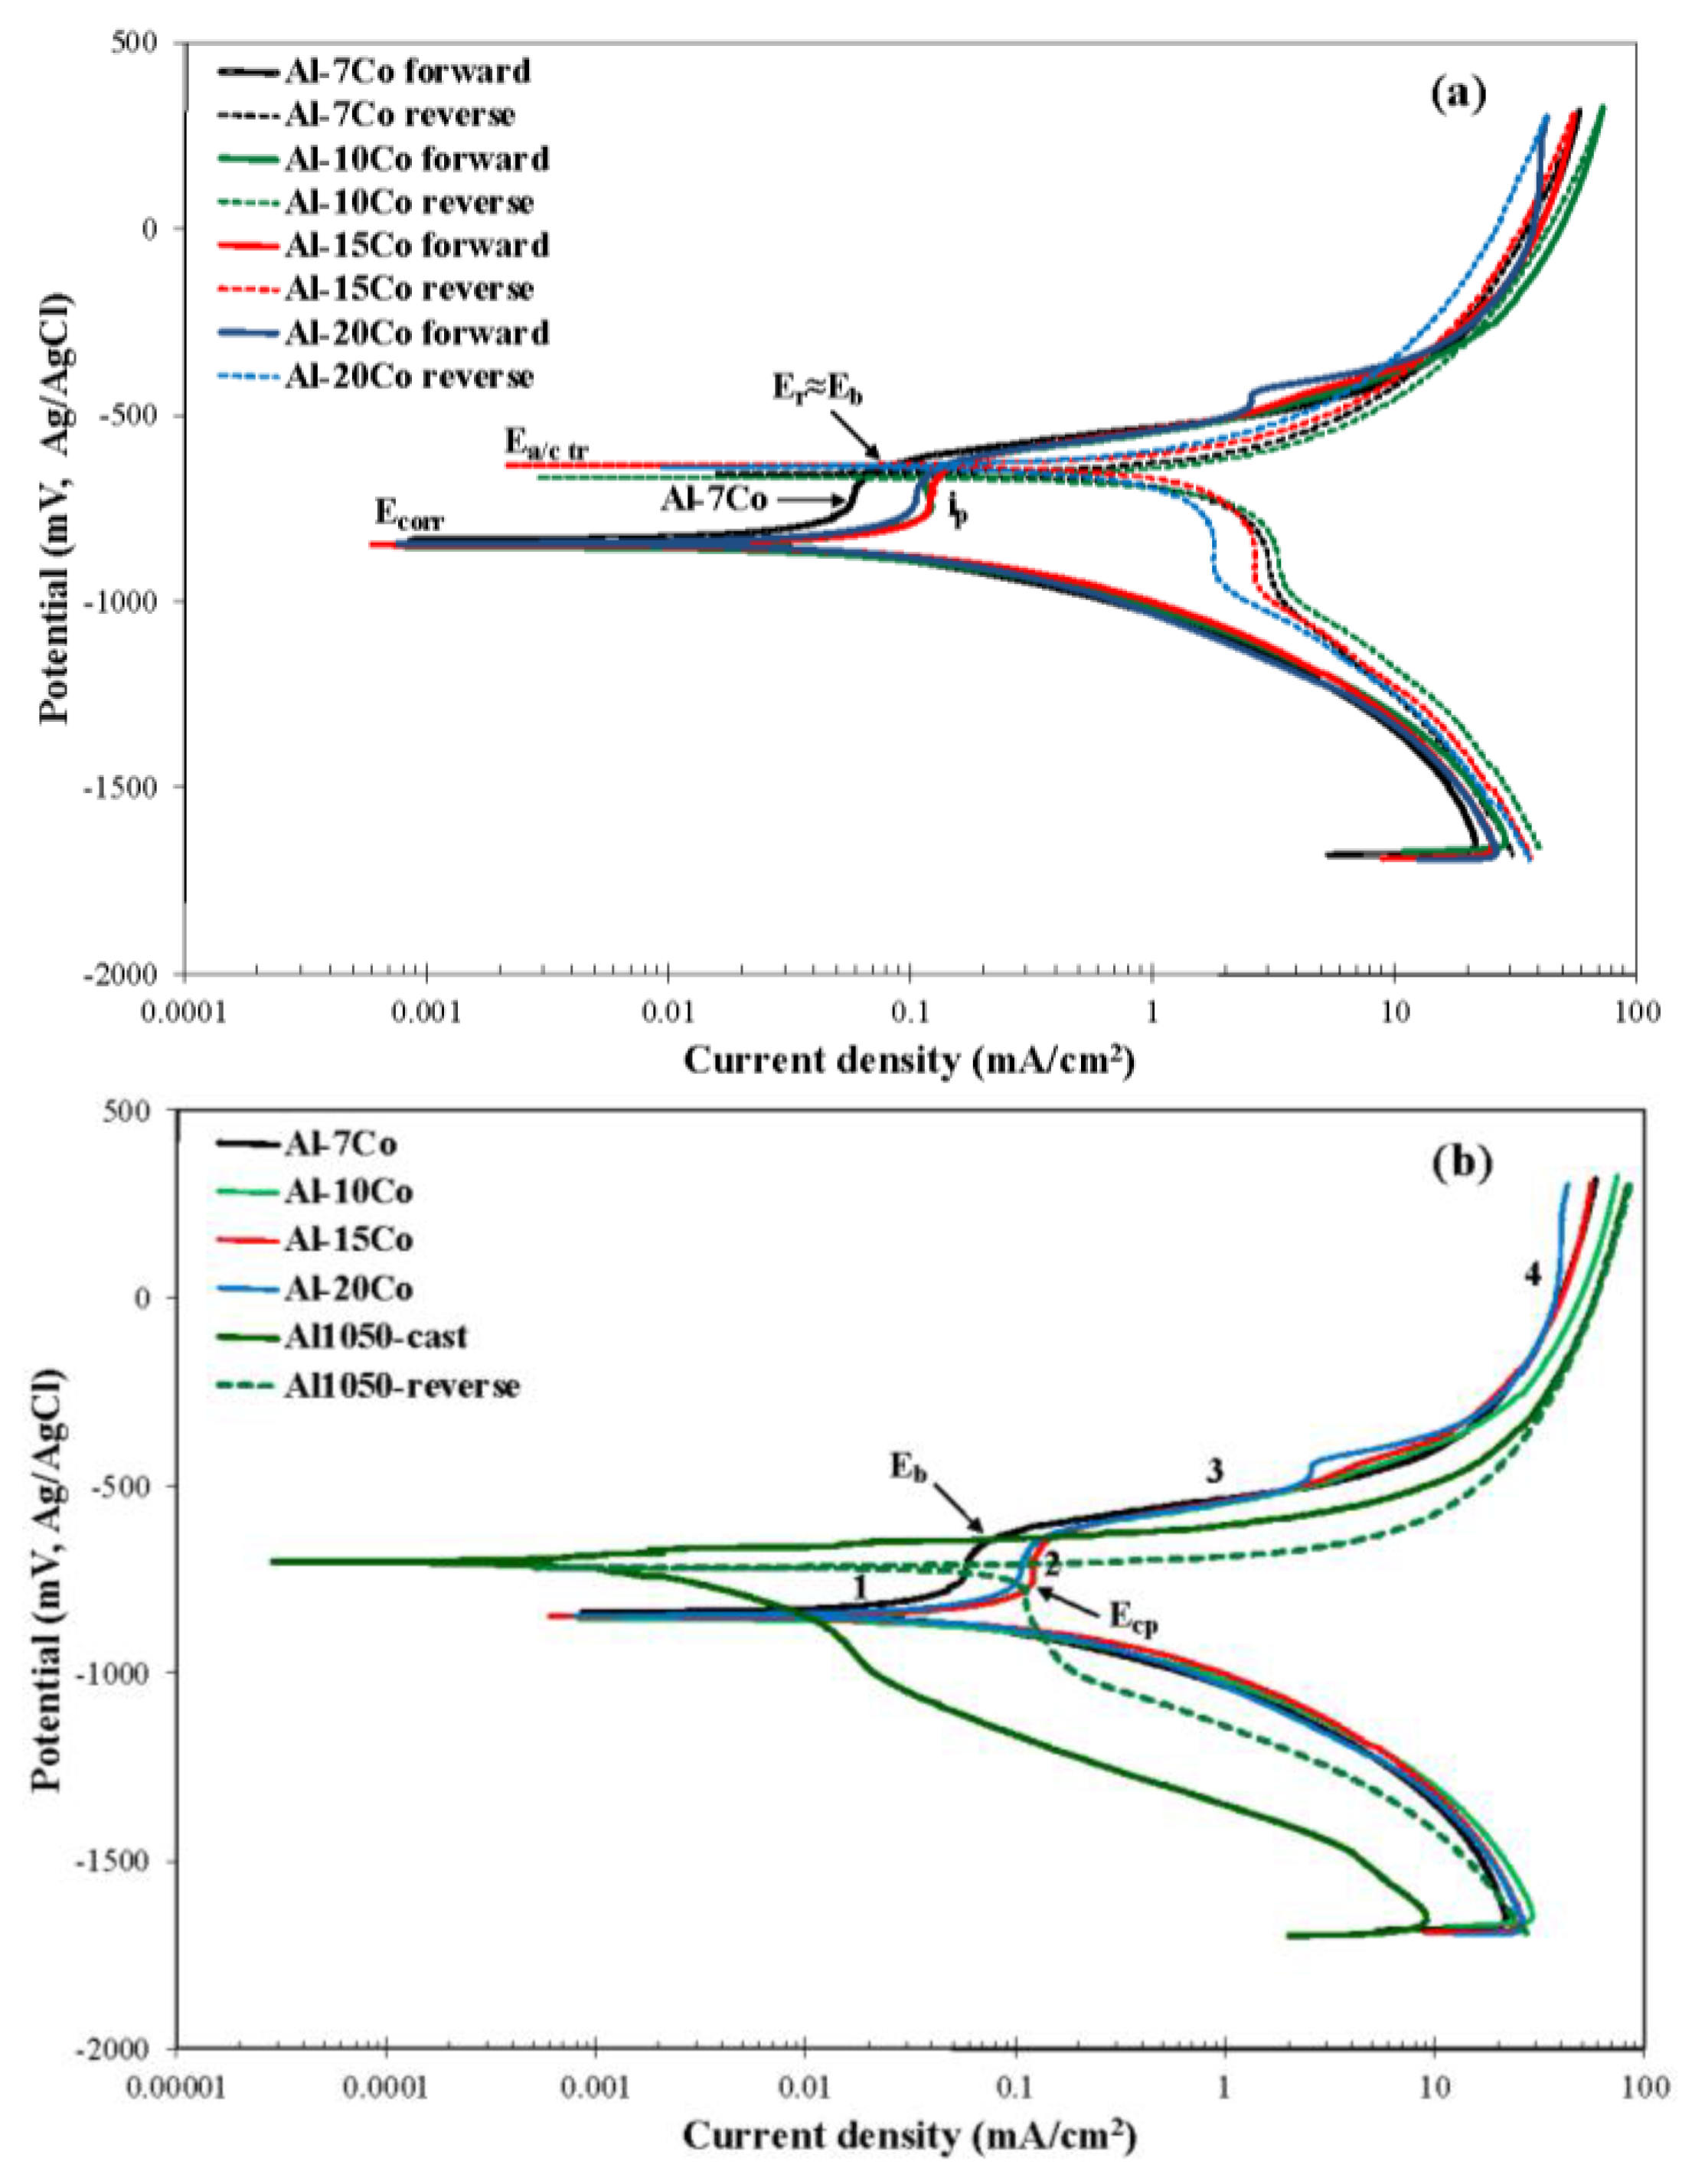
Figure 4a,b presents the potentiodynamic polarization curves of the Al-Co alloys during immersion in 3.5 wt.% NaCl at 25 °C. For comparison, the cyclic polarization curve of CP-Al (fabricated by casting of Al1050 sheet) is included in Figure 4b. Critical potential values are included in Table 3. The Tafel extrapolation results are given in Table 4. The corrosion current density was determined by Tafel extrapolation of the cathodic polarization branch only, because linear regions extending over a current density range of at least one order of magnitude could not be found in the anodic branches of the curves.
The sharp changes in the gradients of the anodic curves divide them into four stages (Figure 4b): Active corrosion (stage 1) ends in current stabilization sustained for 98 to 133 mV (stage 2). At Eb, stage 2 is succeeded by a stage of sharp increase in current by more than two orders of magnitude (stage 3). Current stabilization is then attained at very high current density values though (stage 4).
The similarity in the shapes of the polarization curves and electrochemical values (Figure 4, Table 3 and Table 4) suggest similar corrosion mechanisms for all Al-Co alloys. Stage 1 is due to the preferential corrosion of Al, since intermetallic Al9Co2 is nobler than Al [29]. Current limiting stage 2 is due to the formation of surface films on Al, as supported by the fact that the free energies of formation of aluminum oxides and their hydrates are much more negative than those of cobalt oxides and their hydrates, as shown in Table 5 [54,55,56]. The above postulation will further be justified in Sections 3.2.4–3.2.6.
Figure 4b and 5 and Table 3 show that the breakdown potentials of the Al-Co alloys are almost identical with the breakdown potential of CP-Al (cast and wrought) or a few mV decades lower than the breakdown potential of CP-Al (VAR-Al), indicating that the sustained current density increase during stage 3 is associated with pitting of the Al matrix. Indeed, the negative hysteresis loop during stage 3 along with the persistence of the current density increase in Figure 4a confirm that stage 3 is due to localized corrosion. Nevertheless, the negative hysteresis turns to positive at a potential almost equal to the breakdown potential (ErEb, Figure 4a). Additionally, the anodic-to-cathodic transition potential (Ea/c tr) is nobler than the corrosion potential, suggesting nobler surfaces upon reverse polarization (Table 3, Figure 4a). Thus, it is implied that the resistance of the Al-Co alloys to localized corrosion is high.
The high current values corresponding to stage 4 indicate that this stage is due to the concentration of dissolved cations in the anolyte and/or the deposition of unstable products in the pits/crevices. This indication will further be investigated in Sections 3.2.4 and 3.2.5.

3.2.2. Polarization Behavior of CP-Al

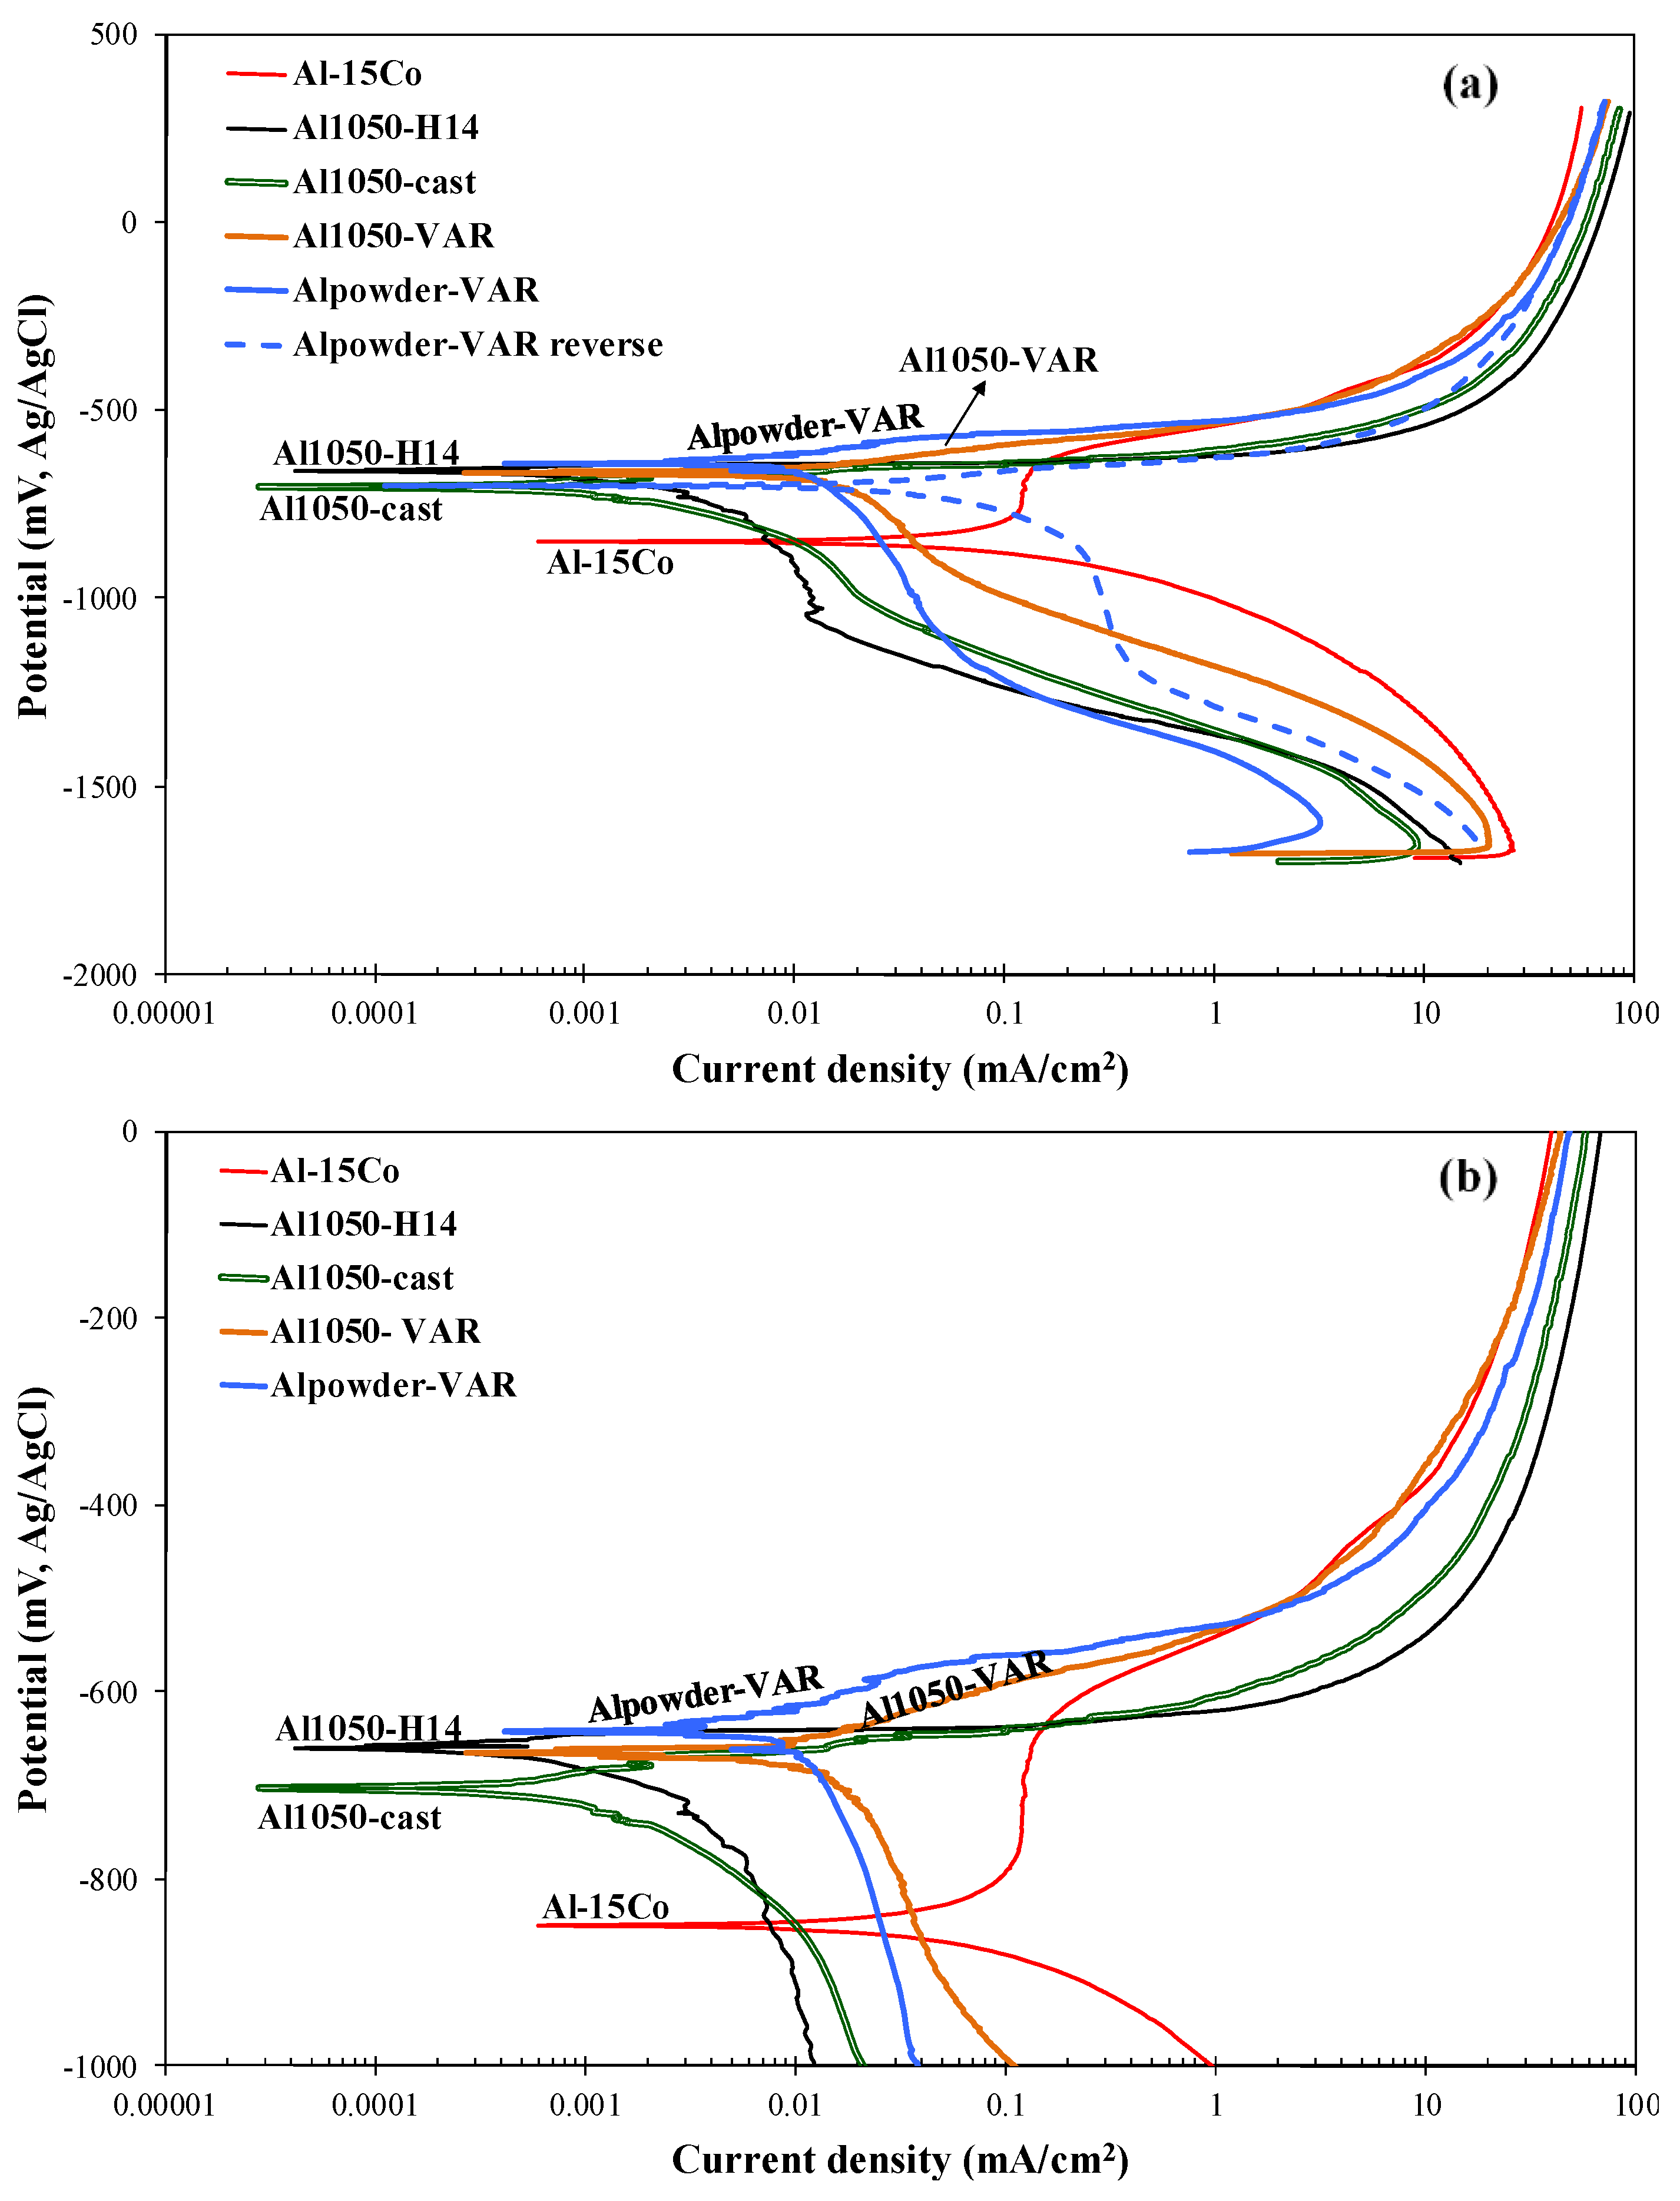
Although outside the main scope of this paper, a short note should be addressed to the polarization behavior of Al in an attempt to clarify the nature of stage 3 during the potentiodynamic polarization of Al-Co alloys. Figure 5a presents the polarization behavior of four different forms of commercially pure aluminum: CP-Al in the form of sheet (Al1050-H14), CP-Al produced by stir casting of Al1050 (Al1050-cast), CP-Al produced by VAR of Al1050 (Al1050-VAR) and CP-Al produced by VAR of Al powder (Alpowder-VAR). Figure 5b images the polarization curves in a limited range of potentials for a clearer view of the observed differences.
Figures 4b and 5 show that all forms of aluminum exhibit a polarization behavior typical of Al-alloys: The negative hysteresis loops manifest susceptibility to localized corrosion. CP-Al presents nobler corrosion potential than that of the Al-Co alloys. However, its corrosion potential is just a few decades of mV lower than its pitting potential (Eb in Table 3), as has also been observed in other Al-alloys [57,58]. This behavior is consistent with the fact that Al-alloys in aerated halide solutions usually present corrosion potentials close to their pitting potentials, suggesting that the cathodic oxygen reduction, largely within the flawed regions, is sufficient to raise the corrosion potential to the pitting potential [59]. Note that, in the case of CP-Al, these flawed regions are primarily impurities forming intergranular Al-Fe and Al-Fe-Si eutectic intermetallic compounds. The above impurities (being quite nobler than Al) form galvanic couples with adjacent Al, as soon as the semi-conductive alumina-based film on the Al/aluminide or Al/eutectic microconstituent interface is thinned by dissolution due to the adsorption of aggressive Cl anions. Localized dissolution of adjacent Al then occurs resulting in the formation of small pits [60].
VAR-Al exhibits better corrosion resistance (slightly though) than its conventional counterparts, as suggested by the higher (EbEcorr) values, lower current density values in the current limiting stage and lower rate of current density increase in the anodic dissolution stage. This can mainly be attributed to the grain refinement by rapid cooling, demonstrated in Figure 3. A higher number of grain boundaries leads to more active sites for oxidation and, consequently, more extensive surface film formation. Additionally, the grain refinement increases the overall grain boundary area, thereby optimizing the size of any detrimental cathodic precipitates [61].

3.2.3. Comparison of the Polarization Behavior of the Various Compositions

Table 4 and Figure 4 show that Al-7 wt.% Co displays the lowest corrosion current density and the lowest passivation current density (ip), though still of the same order of magnitude. The relatively low kinetic values for Al-7Co are mainly attributed to its refined and uniform microstructure (Figure 2a): Al-7Co presents the finest cathodic surfaces (Al9Co2) among the studied compositions; as such, the cathodic surfaces of Al9Co2 can provide the least effective support to the cathodic reactions, thus leading to the lowest corrosion rate. Additionally, the uniform and fine microstructure along with the low porosity give rise to the formation of uniform surface films with few defects leading to low currents in current stabilization domain 2. At higher Co contents, the cathodic surfaces of Al9Co2 are large enough to more effectively support cathodic reactions. It should be noted that, as the ratio of cathode to anode increases with increasing Co content (compare Figure 2a–d), it would be expected that icorr would also increase. However, a substantial increase in icorr with Co content is not seen in Table 4, since this is most likely counterbalanced by a simultaneous current decrease owing to two current density decreasing factors: (i) the increasing volume fraction of the corrosion resistant Al9Co2 phase (see Table 2) and (ii) the decreasing fraction of interfacial boundaries per unit surface area (compare Figure 2a–d).
The very similar corrosion potential values for all Al-Co alloys, shown in Figure 4 and Table 3, could be attributed to the fact that all alloys are essentially composed of two constituents: αAl and Al9Co2. However, one would expect that an increase in the Co content of the Al-Co alloys would lead to an increase in Ecorr, primarily owing to: (a) an increase in the amount of Co dissolved in (Al) and (b) the appearance of a third phase, namely, that of Al13Co4. (The latter is nobler than Al9Co2 [29].) All the same, Ecorr presents insignificant variations as a function of the Co percentage. One reason may be that dissolution of Co in (Al) is far from uniform, as aforementioned in Section 3.1.2. Additionally, the Al13Co4 presence is minor and occasional, as evidenced by XRD and SEM. Other reasons can be sought in other parameters affecting Ecorr besides chemical/phase composition, such as grain size, residual stresses, structural defects, surface energy, etc. For instance, an increase in the Co content of the Al-alloy is expected to lead to an increase in the residual stresses, as indicated by the increase in the supersaturation level of (Al), the blade-like shape of coarse Al9Co2 particles and the density difference between Al and Al9Co2. Regarding the phase of Al9Co2, it has been claimed that coarse Al9(Fe,Co,Ni)2 particles in a high solute Al-Fe-Co-Ni alloy tended to act as stress concentrators [14]. It has long been known that stresses (either by applied loads or residual ones) may increase the internal energy level of the metal system and cause a possible shift of electrochemical potential to a more active direction [62].
The superiority of the localized corrosion behavior of the Al-Co alloys over that of CP-Al is manifested in Figure 4 and Figure 5: Al-Co presents passivity (over a small range of anodic potentials), nobler Ea/c tr as compared to Ecorr (negative hysteresis turns to positive at Ea/c tr Eb) and lower current densities in stage 4 as compared to the respective ones of CP-Al; CP-Al is in a pitting state even at Ecorr.

3.2.4. Microstructure of Corrosion

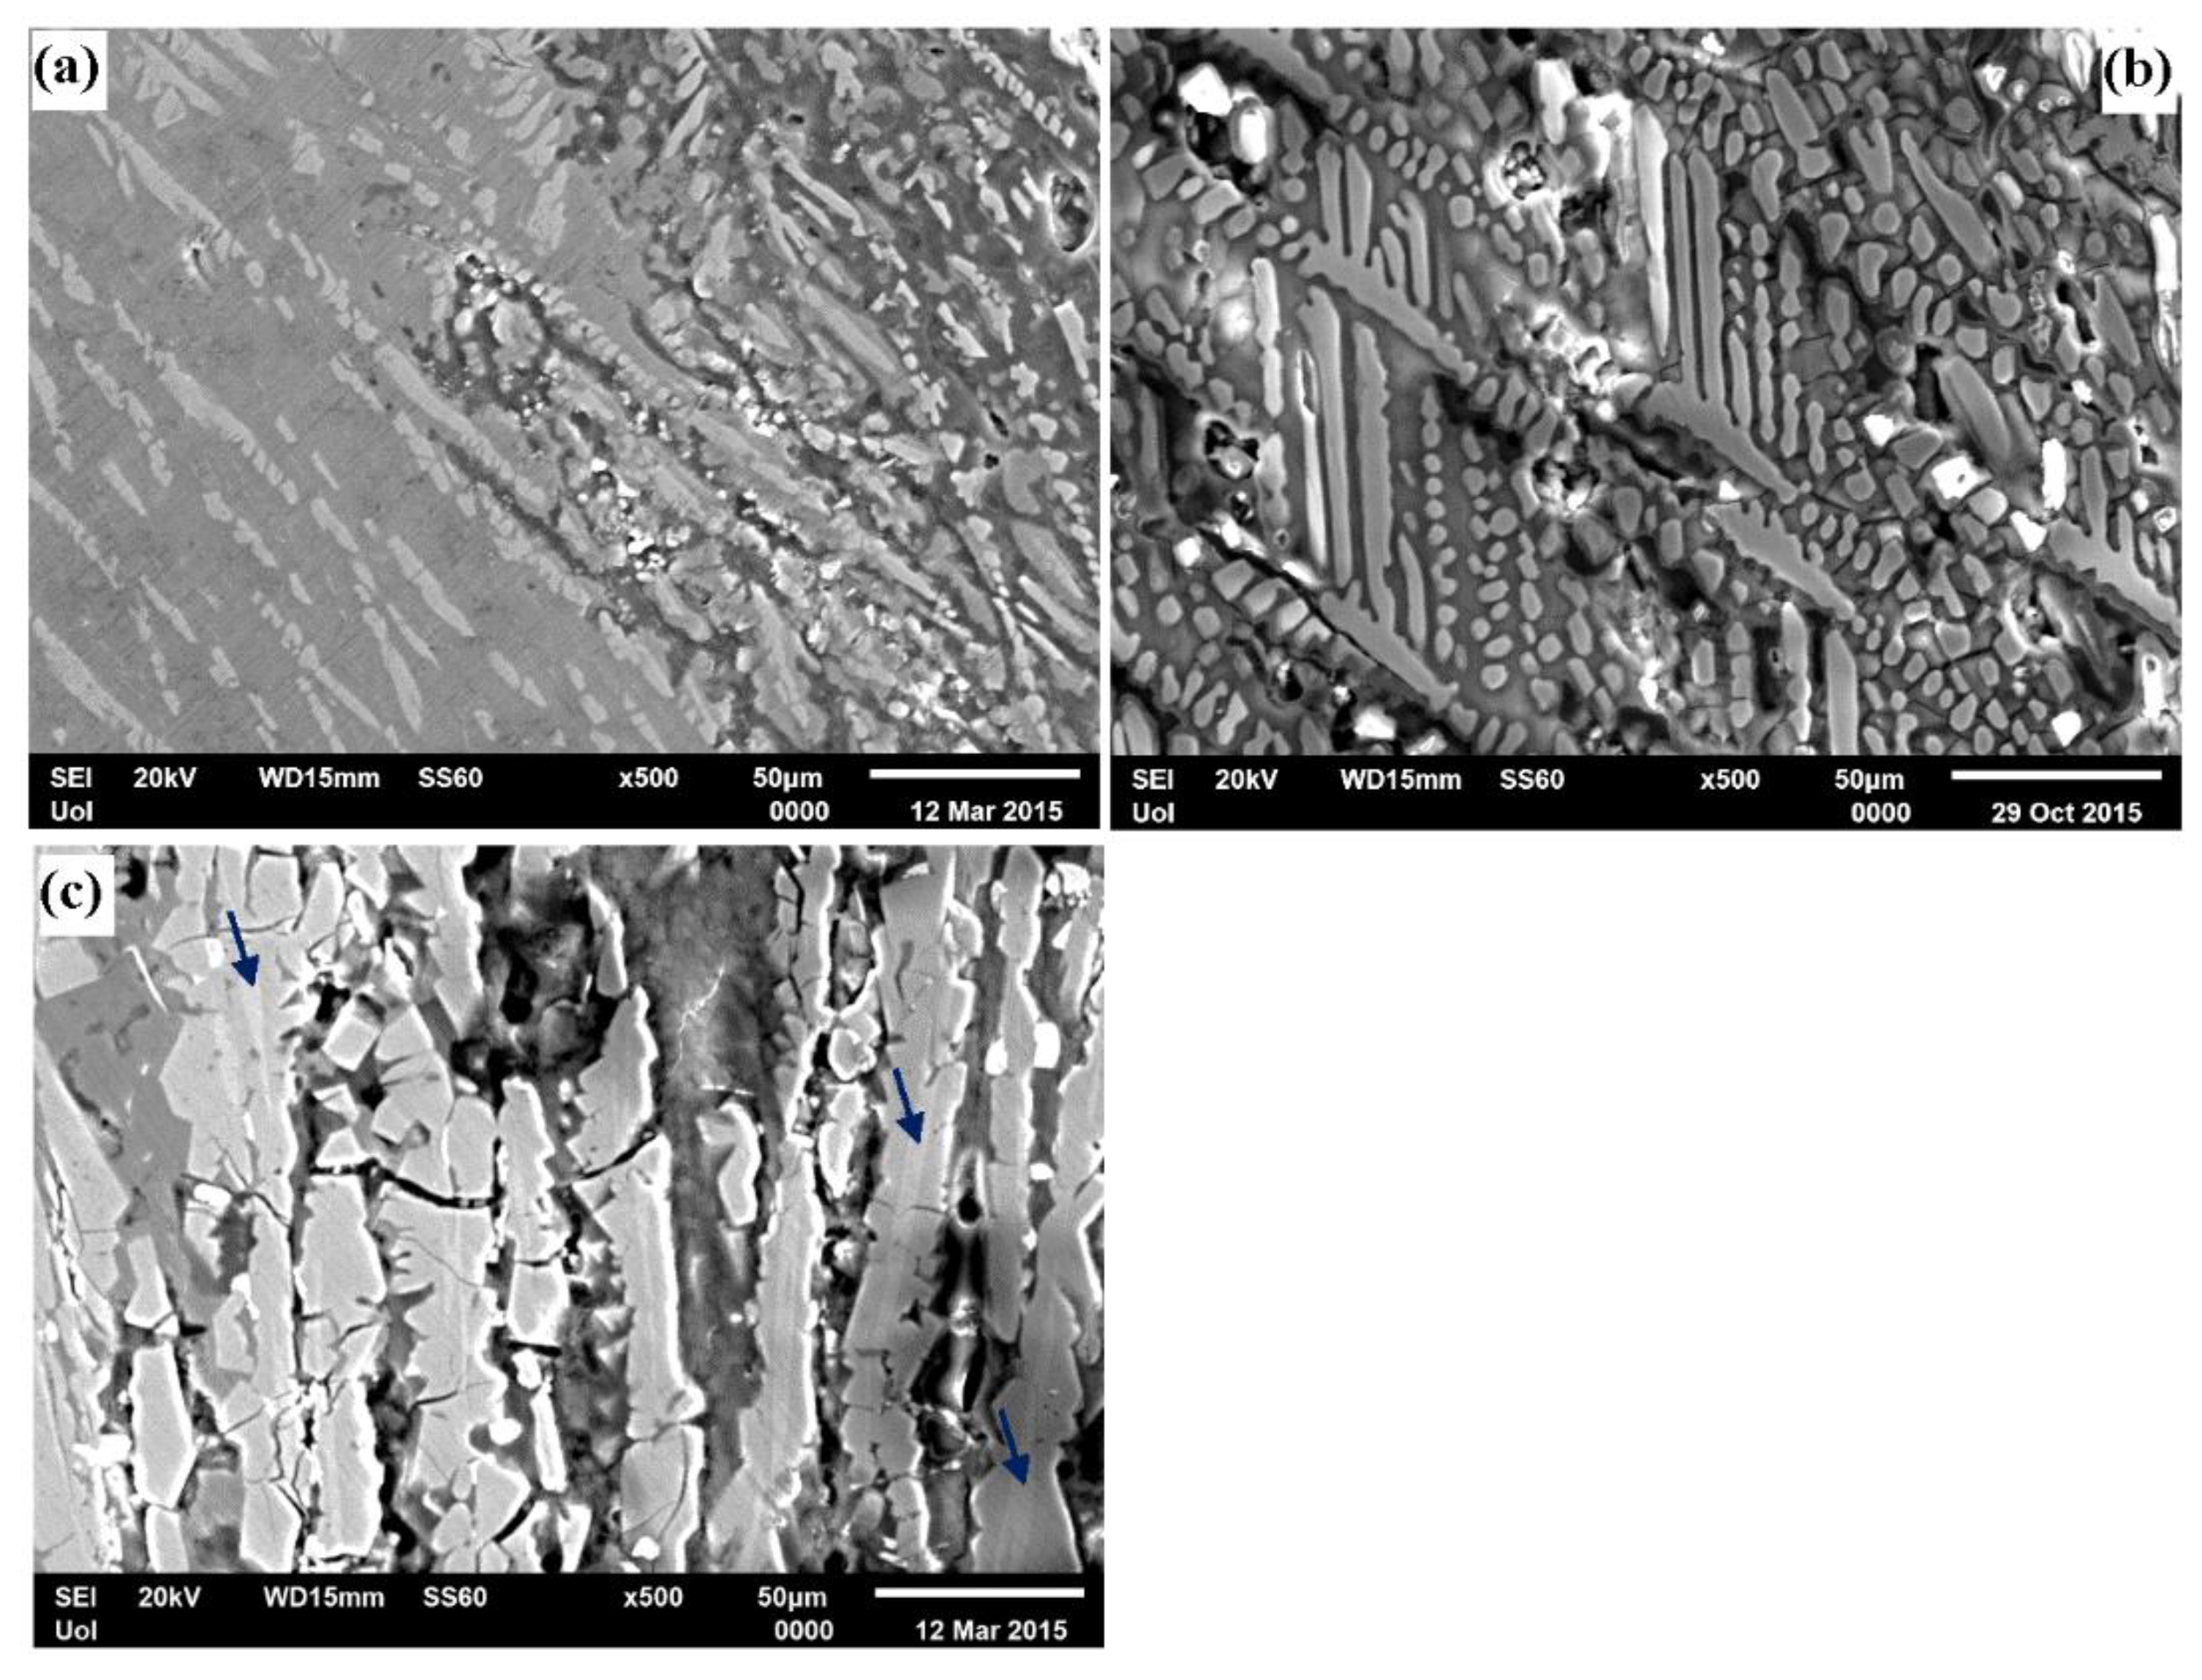
Figure 6 presents the microstructural state of Al-7 wt.% Co (Figure 6a), Al-15 wt.% Co (Figure 6b) and Al-20 wt.% Co (Figure 6c) after potentiodynamic polarization. The electrolyte has selectively attacked the (Al) matrix, whereas the Al9Co2 phase has remained intact of corrosion signs. This confirms that: (a) Active corrosion (stage 1) has been caused by the dissolution of the (Al) phase; and (b) the “breakdown” of the Al-Co alloys (stage 3) is associated with the pitting of the (Al) phase, as mentioned in Section 3.2.1. Corrosion in Figure 6 is mainly indicated by the following: (a) Crevices are observed in the (Al) phase along the (Al)/Al9Co2 boundaries; (b) (Al) zones appear excavated; (c) in the case of Al-20 wt.% Co, the coarse plates of Al9Co2 appear cracked; (d) in the case of Al-20 wt.% Co, fragments of Al9Co2 have filled up gaps remaining after dissolution of Al. (A close observation of Figure 6c reveals that some Al9Co2 blades enclose a second phase of lighter contrast in the form of narrow blades. EDX analysis has shown that this phase belongs to Al13Co4, confirming the XRD indications in Section 3.1.1.)
EDX analysis in the corroded regions (Figure 7, Figure 8, Figure 9 and Figure 10) reveals two more corrosion indications:
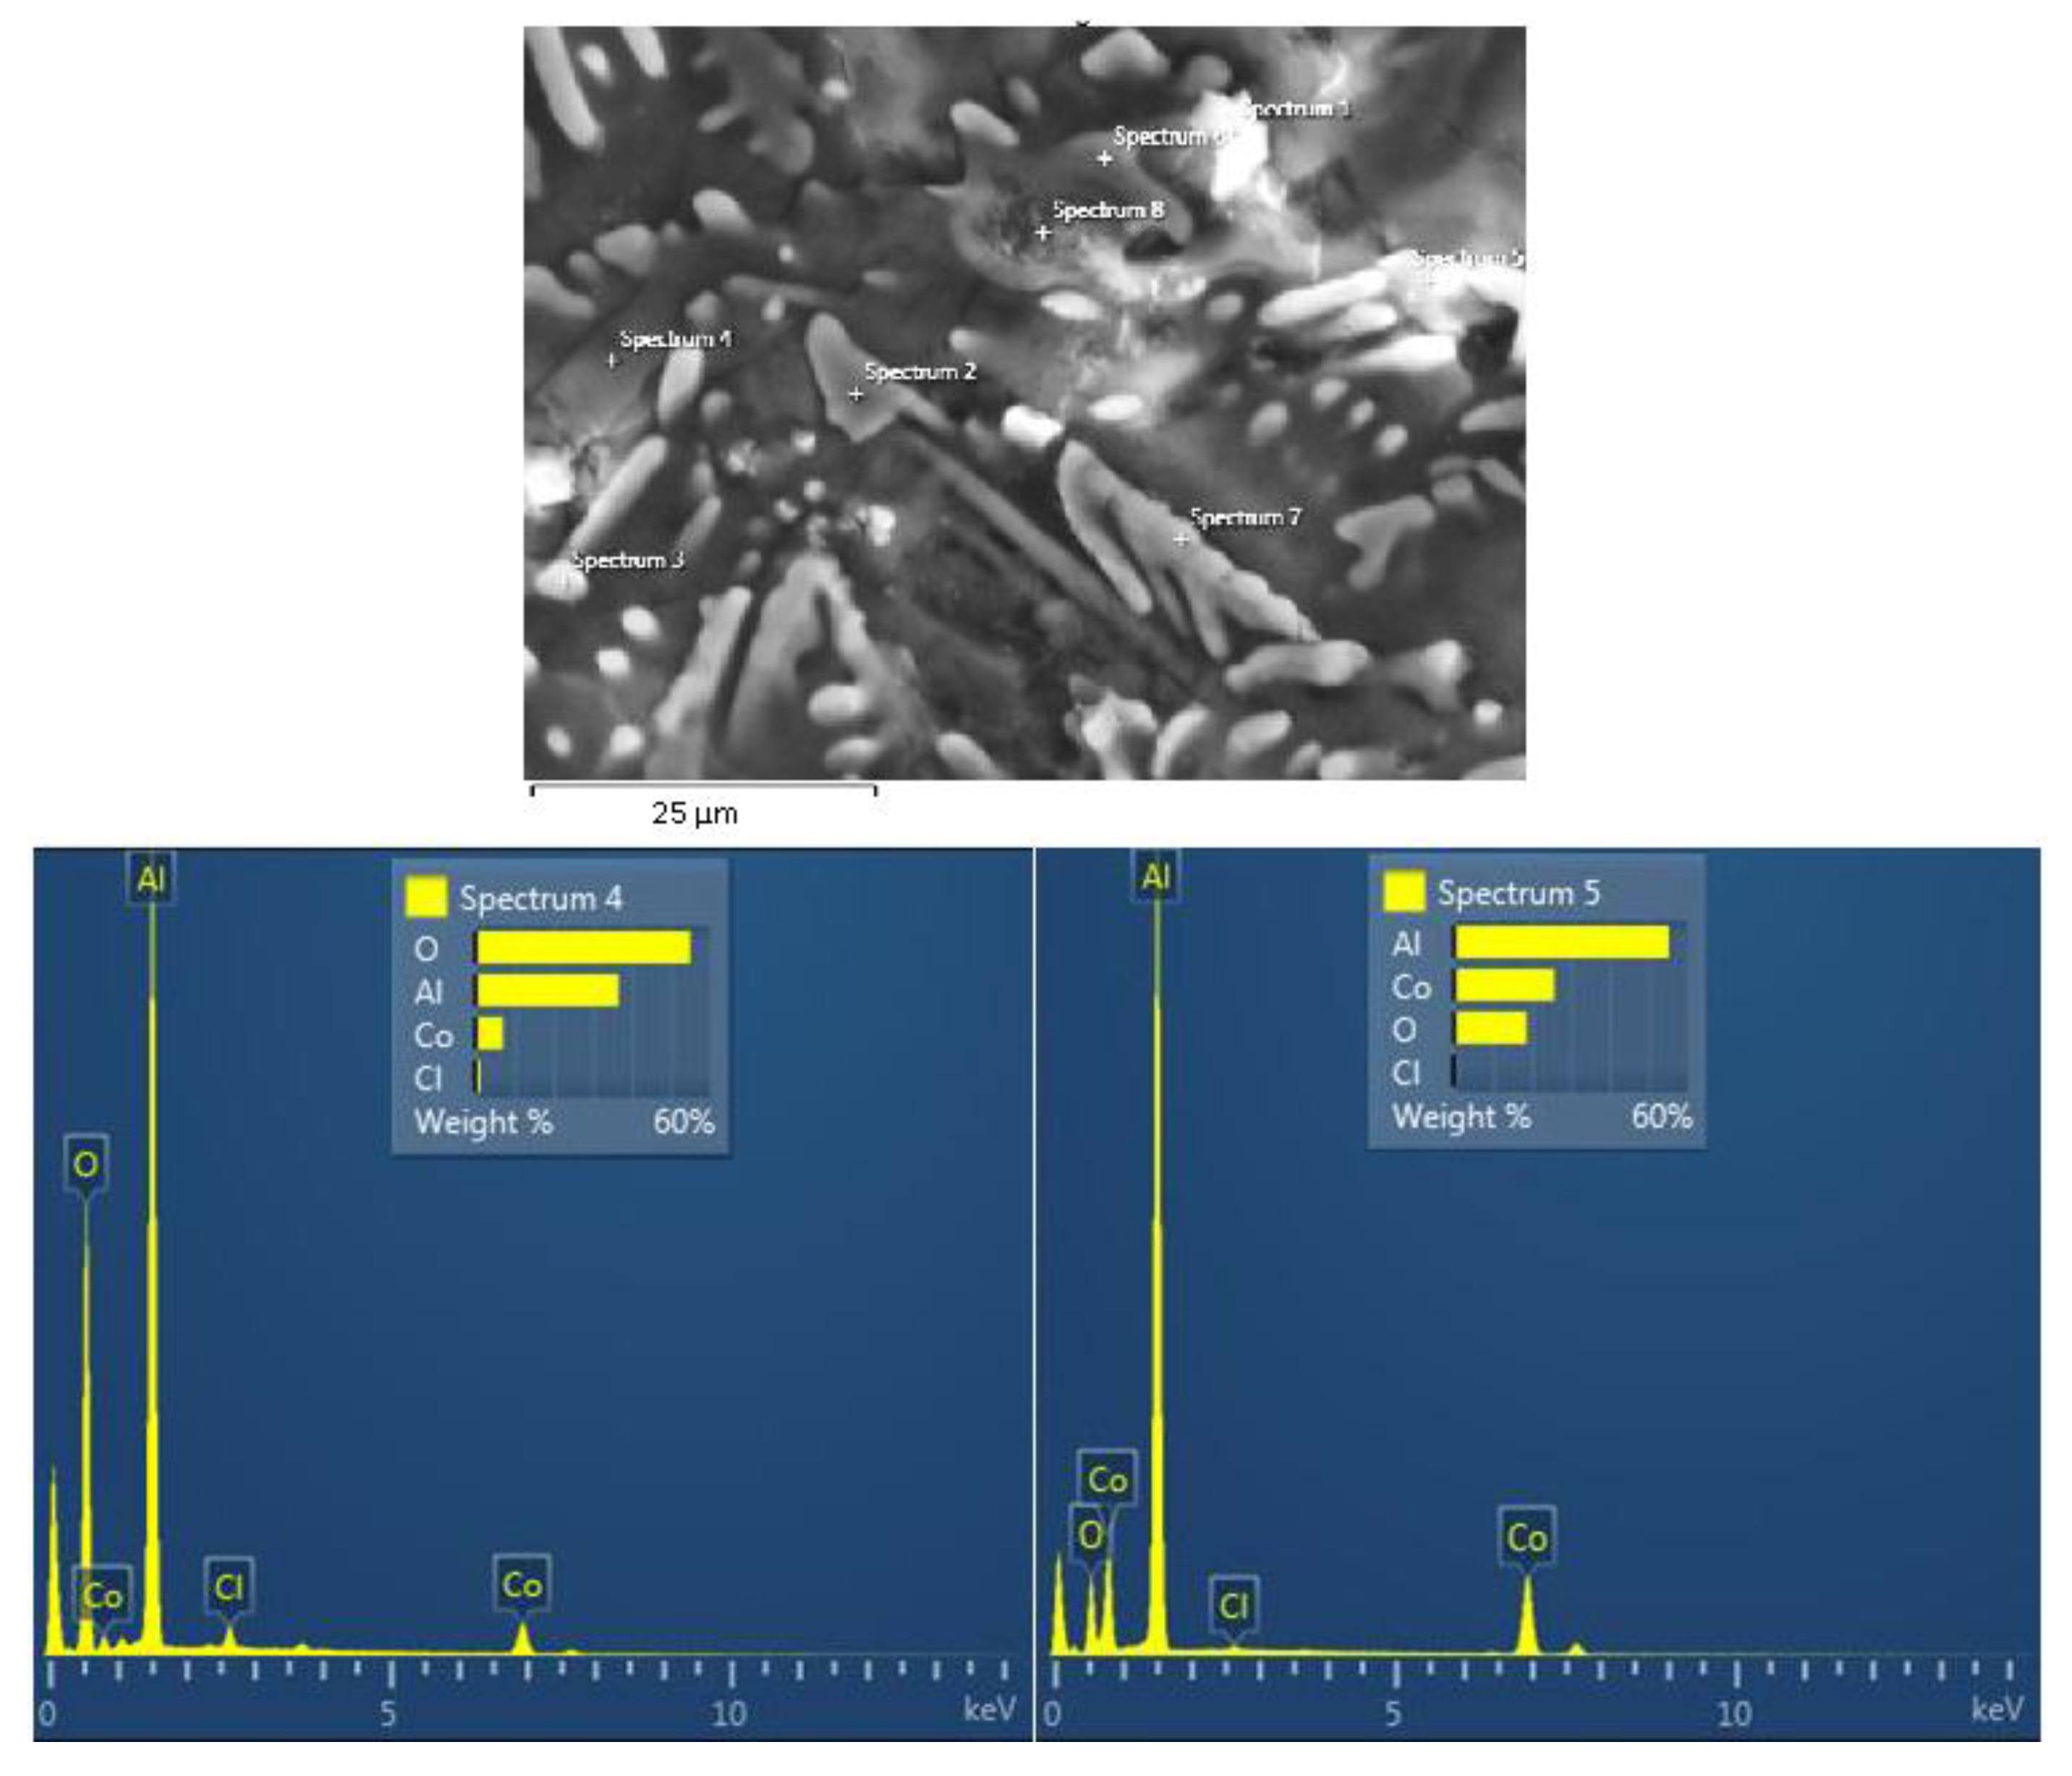
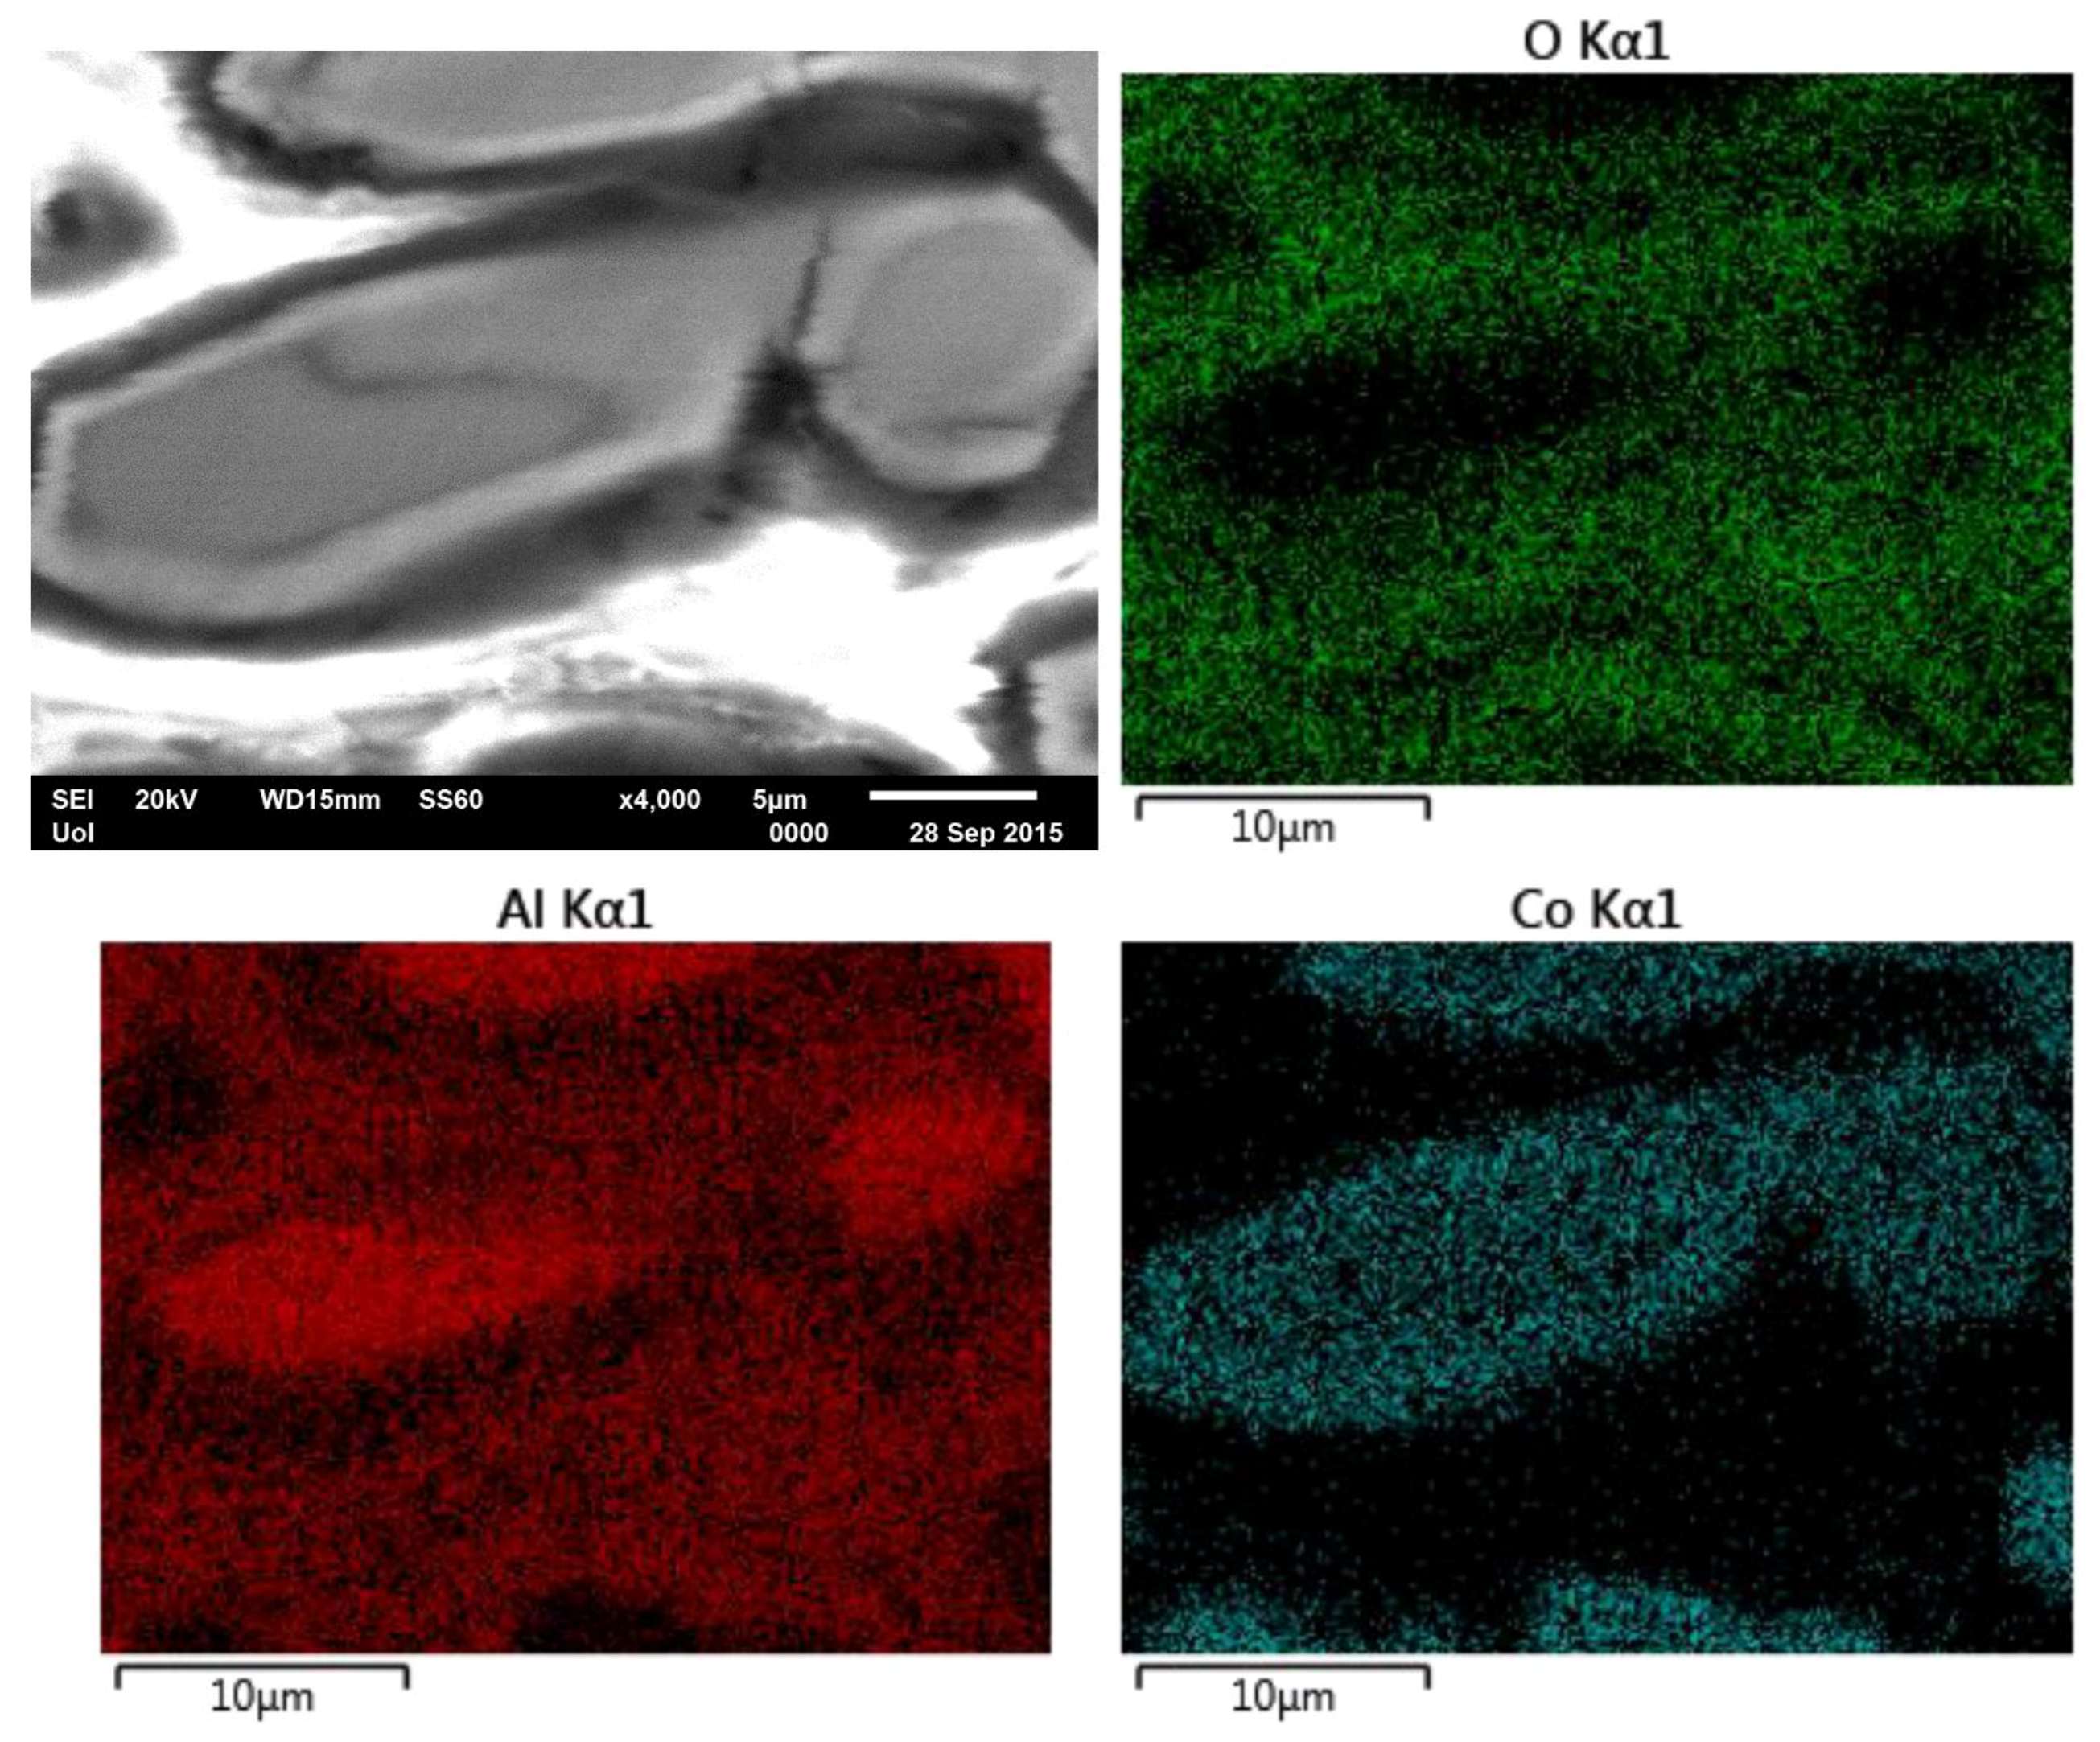
(e) a surface layer has been formed on the (Al) matrix (Figure 7-spectrum 4, Figure 10-oxygen map), confirming that current stabilization stage 2 is due to passivation of Al. EDX spectrum 4 in Figure 7 reveals the presence of small quantities of Co in the surface film of the (Al) phase. As mentioned in the Introduction, the incorporation of transition metals (TM) in the surface film of aluminum enhances the protectiveness of the film in crystalline Al-TM alloys [30,31,32,33] and Al-Cr-Fe CMAs [34,35]. Detection of Cl in the EDX spectra of Al (spectrum 4) and Al9Co2 (spectrum 5) provides evidence of interaction of Cl on the surface film of a metal, consistent with previous works [63,64].
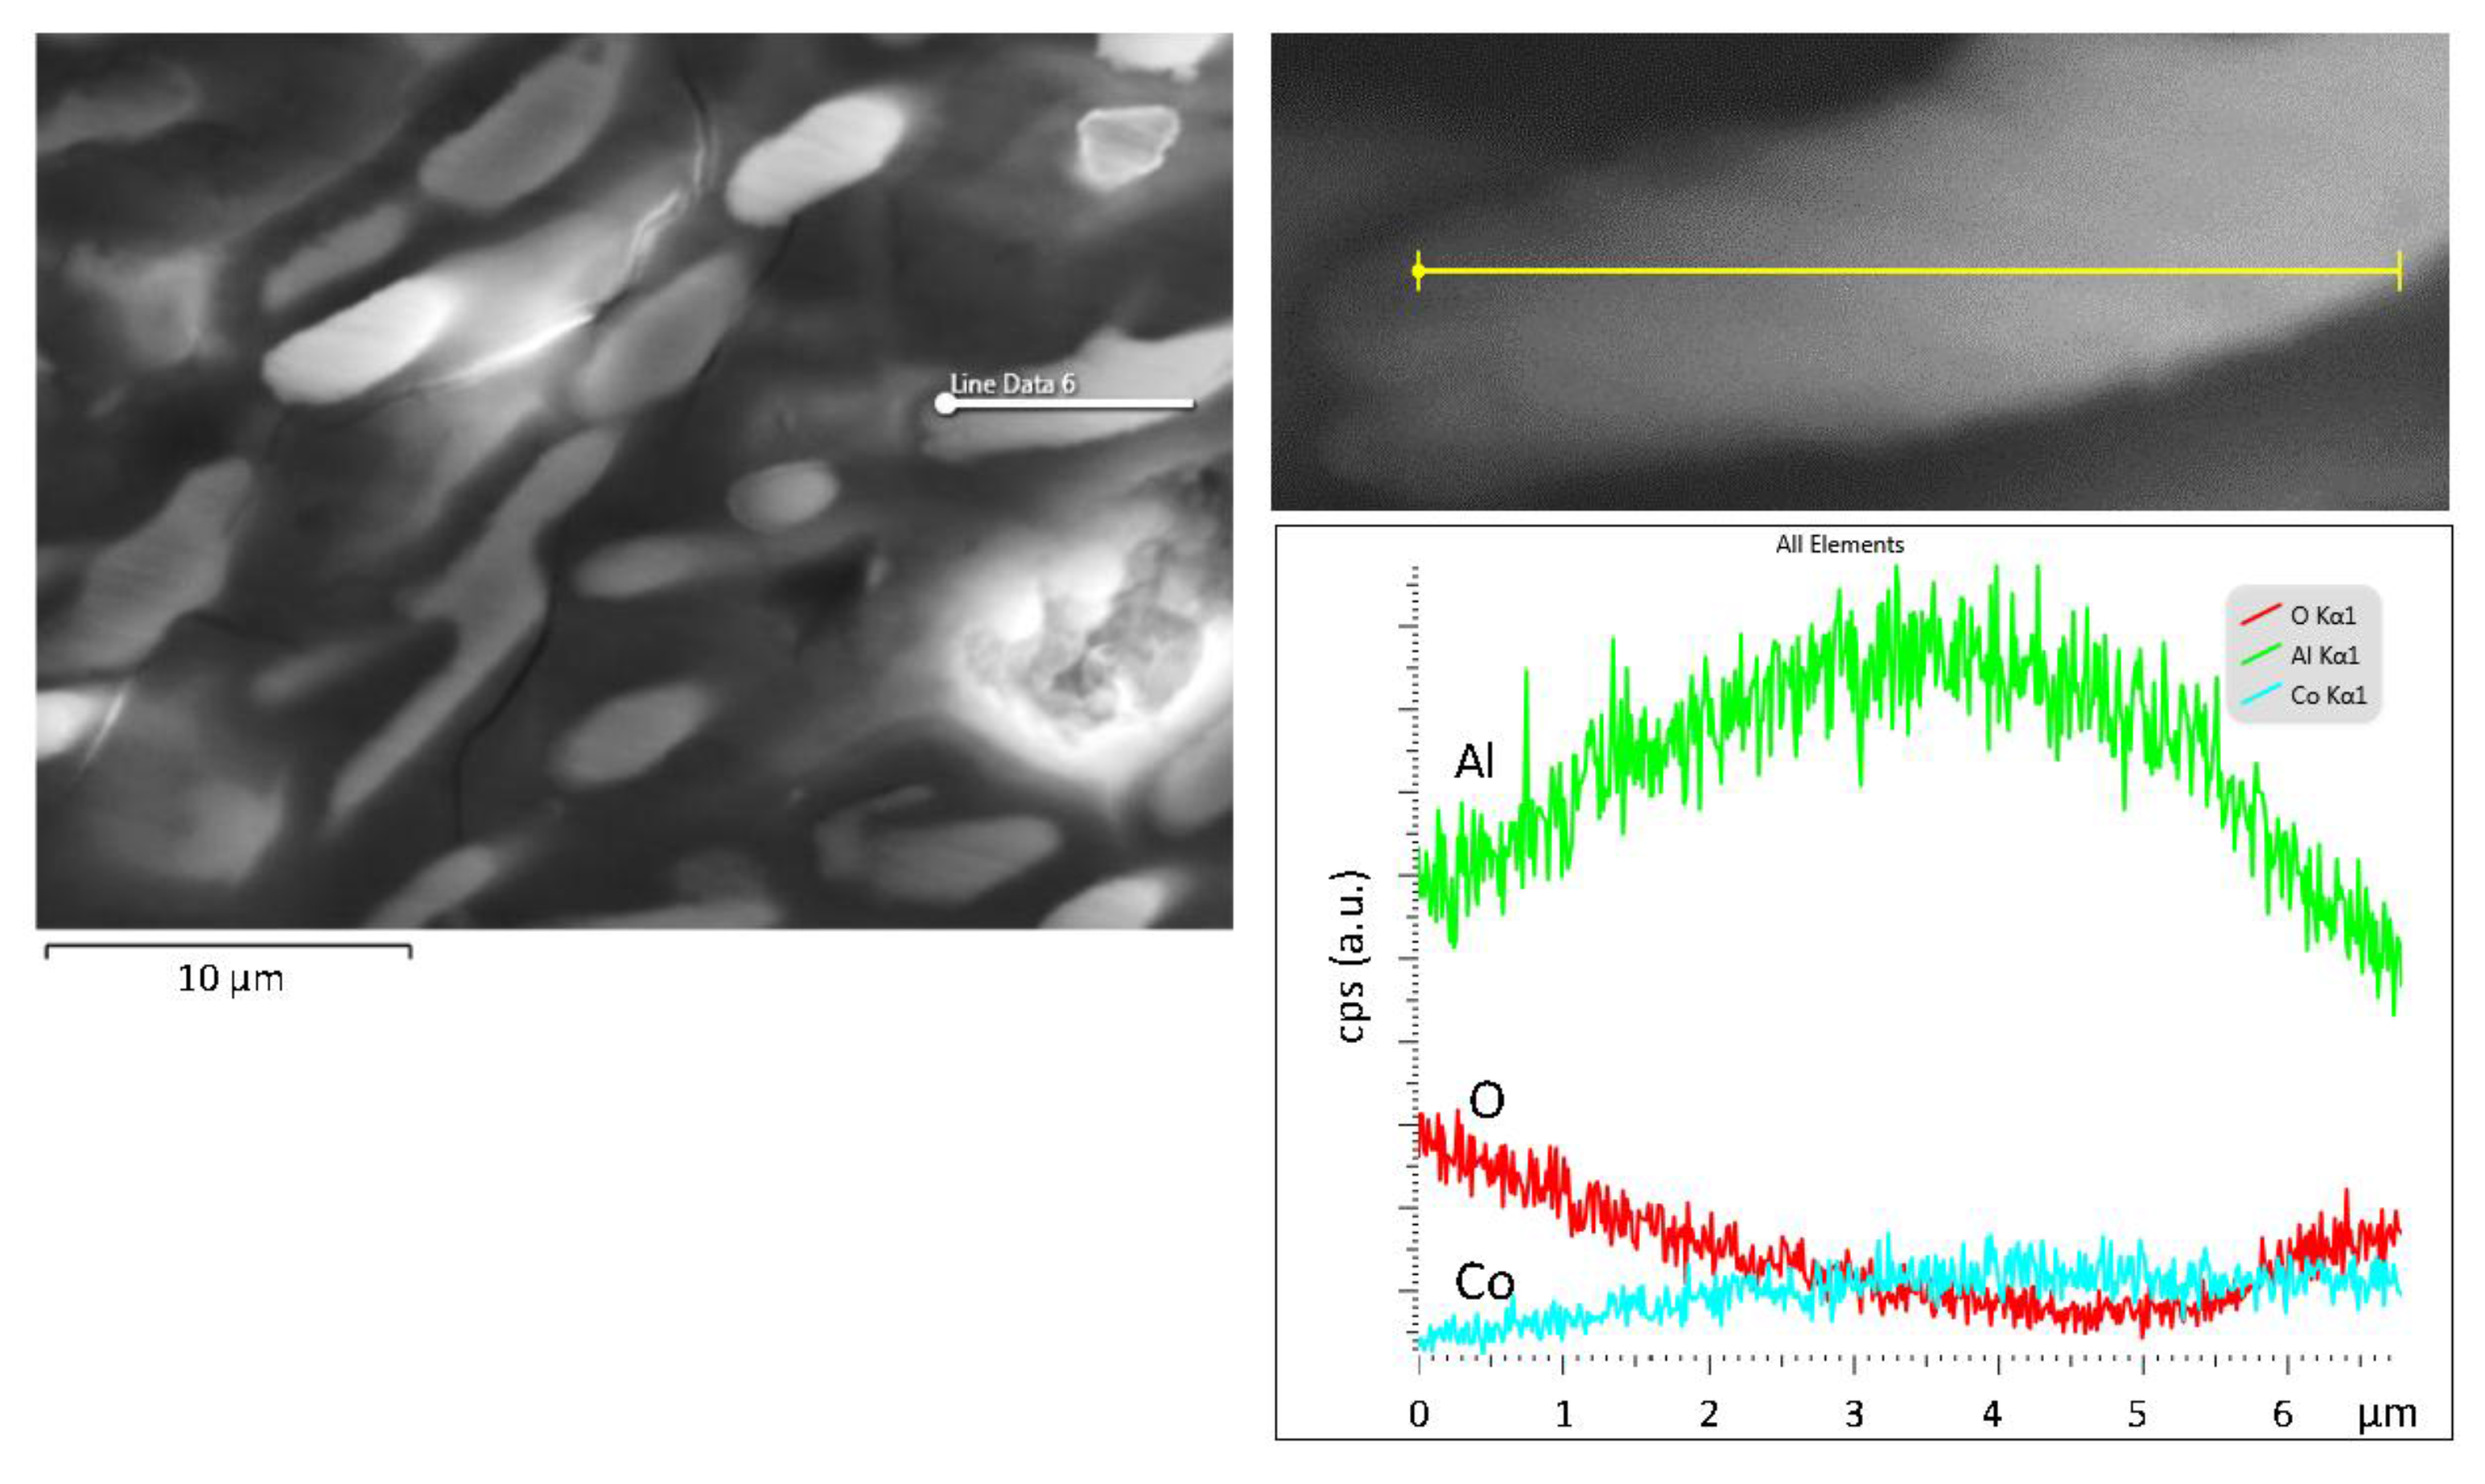
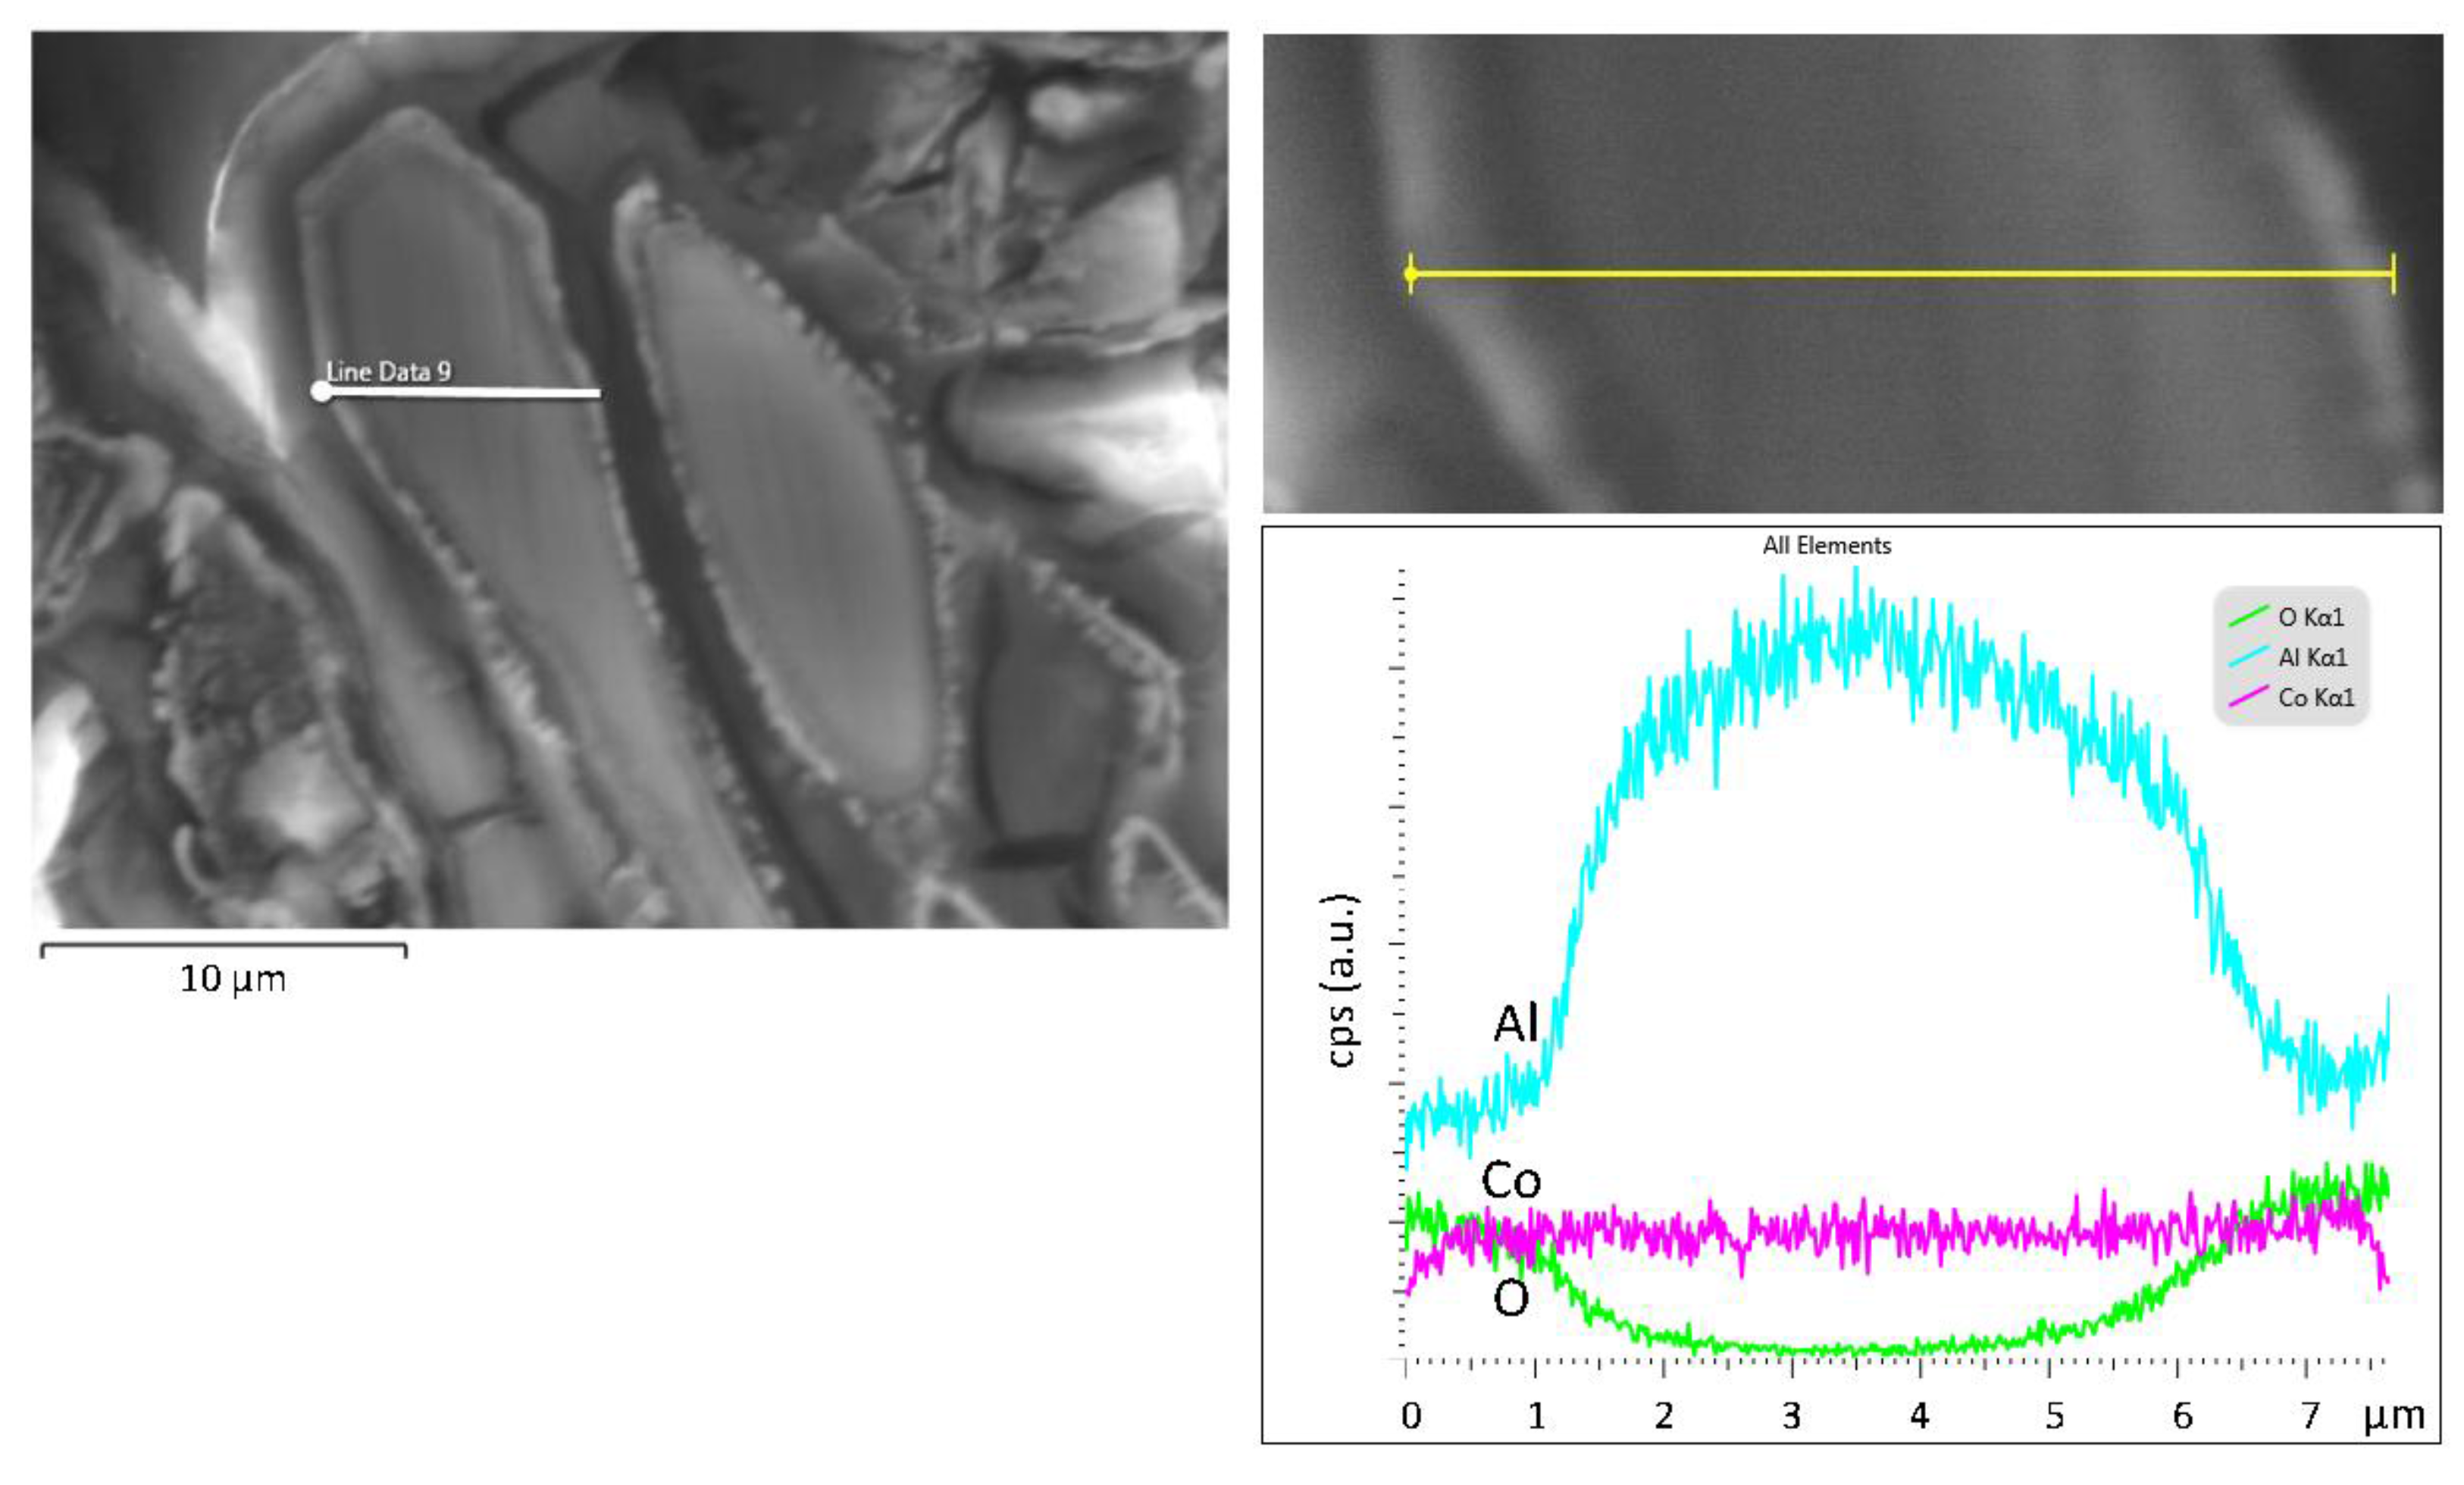
(f) The periphery of the Al9Co2 phase has also been subjected to oxidation (Figure 7-spectrum 5, Figure 8-line scan, Figure 9-line scan and Figure 10-elemental mapping). Previous work [29] has shown that oxidation of Al9Co2 in 3.5 wt.% NaCl is possible at potentials higher than −623 ± 40 mV vs. Ag/AgCl, namely, stage 3-potentials. Furthermore, Alarcon-Villaseka et al. [22] have proved, by using both experimental methods and first principles calculations, that the formation of Al2O and Al2O3 on the (001) surface of Al9Co2 upon oxidation is to be expected. They also noted that, even if the topmost layer of the (001) surface of Al9Co2 is a pure aluminum termination, the sublayer contains cobalt atoms, which strongly influence the values of the adsorption energies and surface reactivity.
The volume expansion accompanying the-stage 2-oxidation of Al to oxide-based compounds is possibly responsible for the cracking of the inherently brittle Al9Co2 phase, seen in Figure 6c.

3.2.5. Surface Film Identification

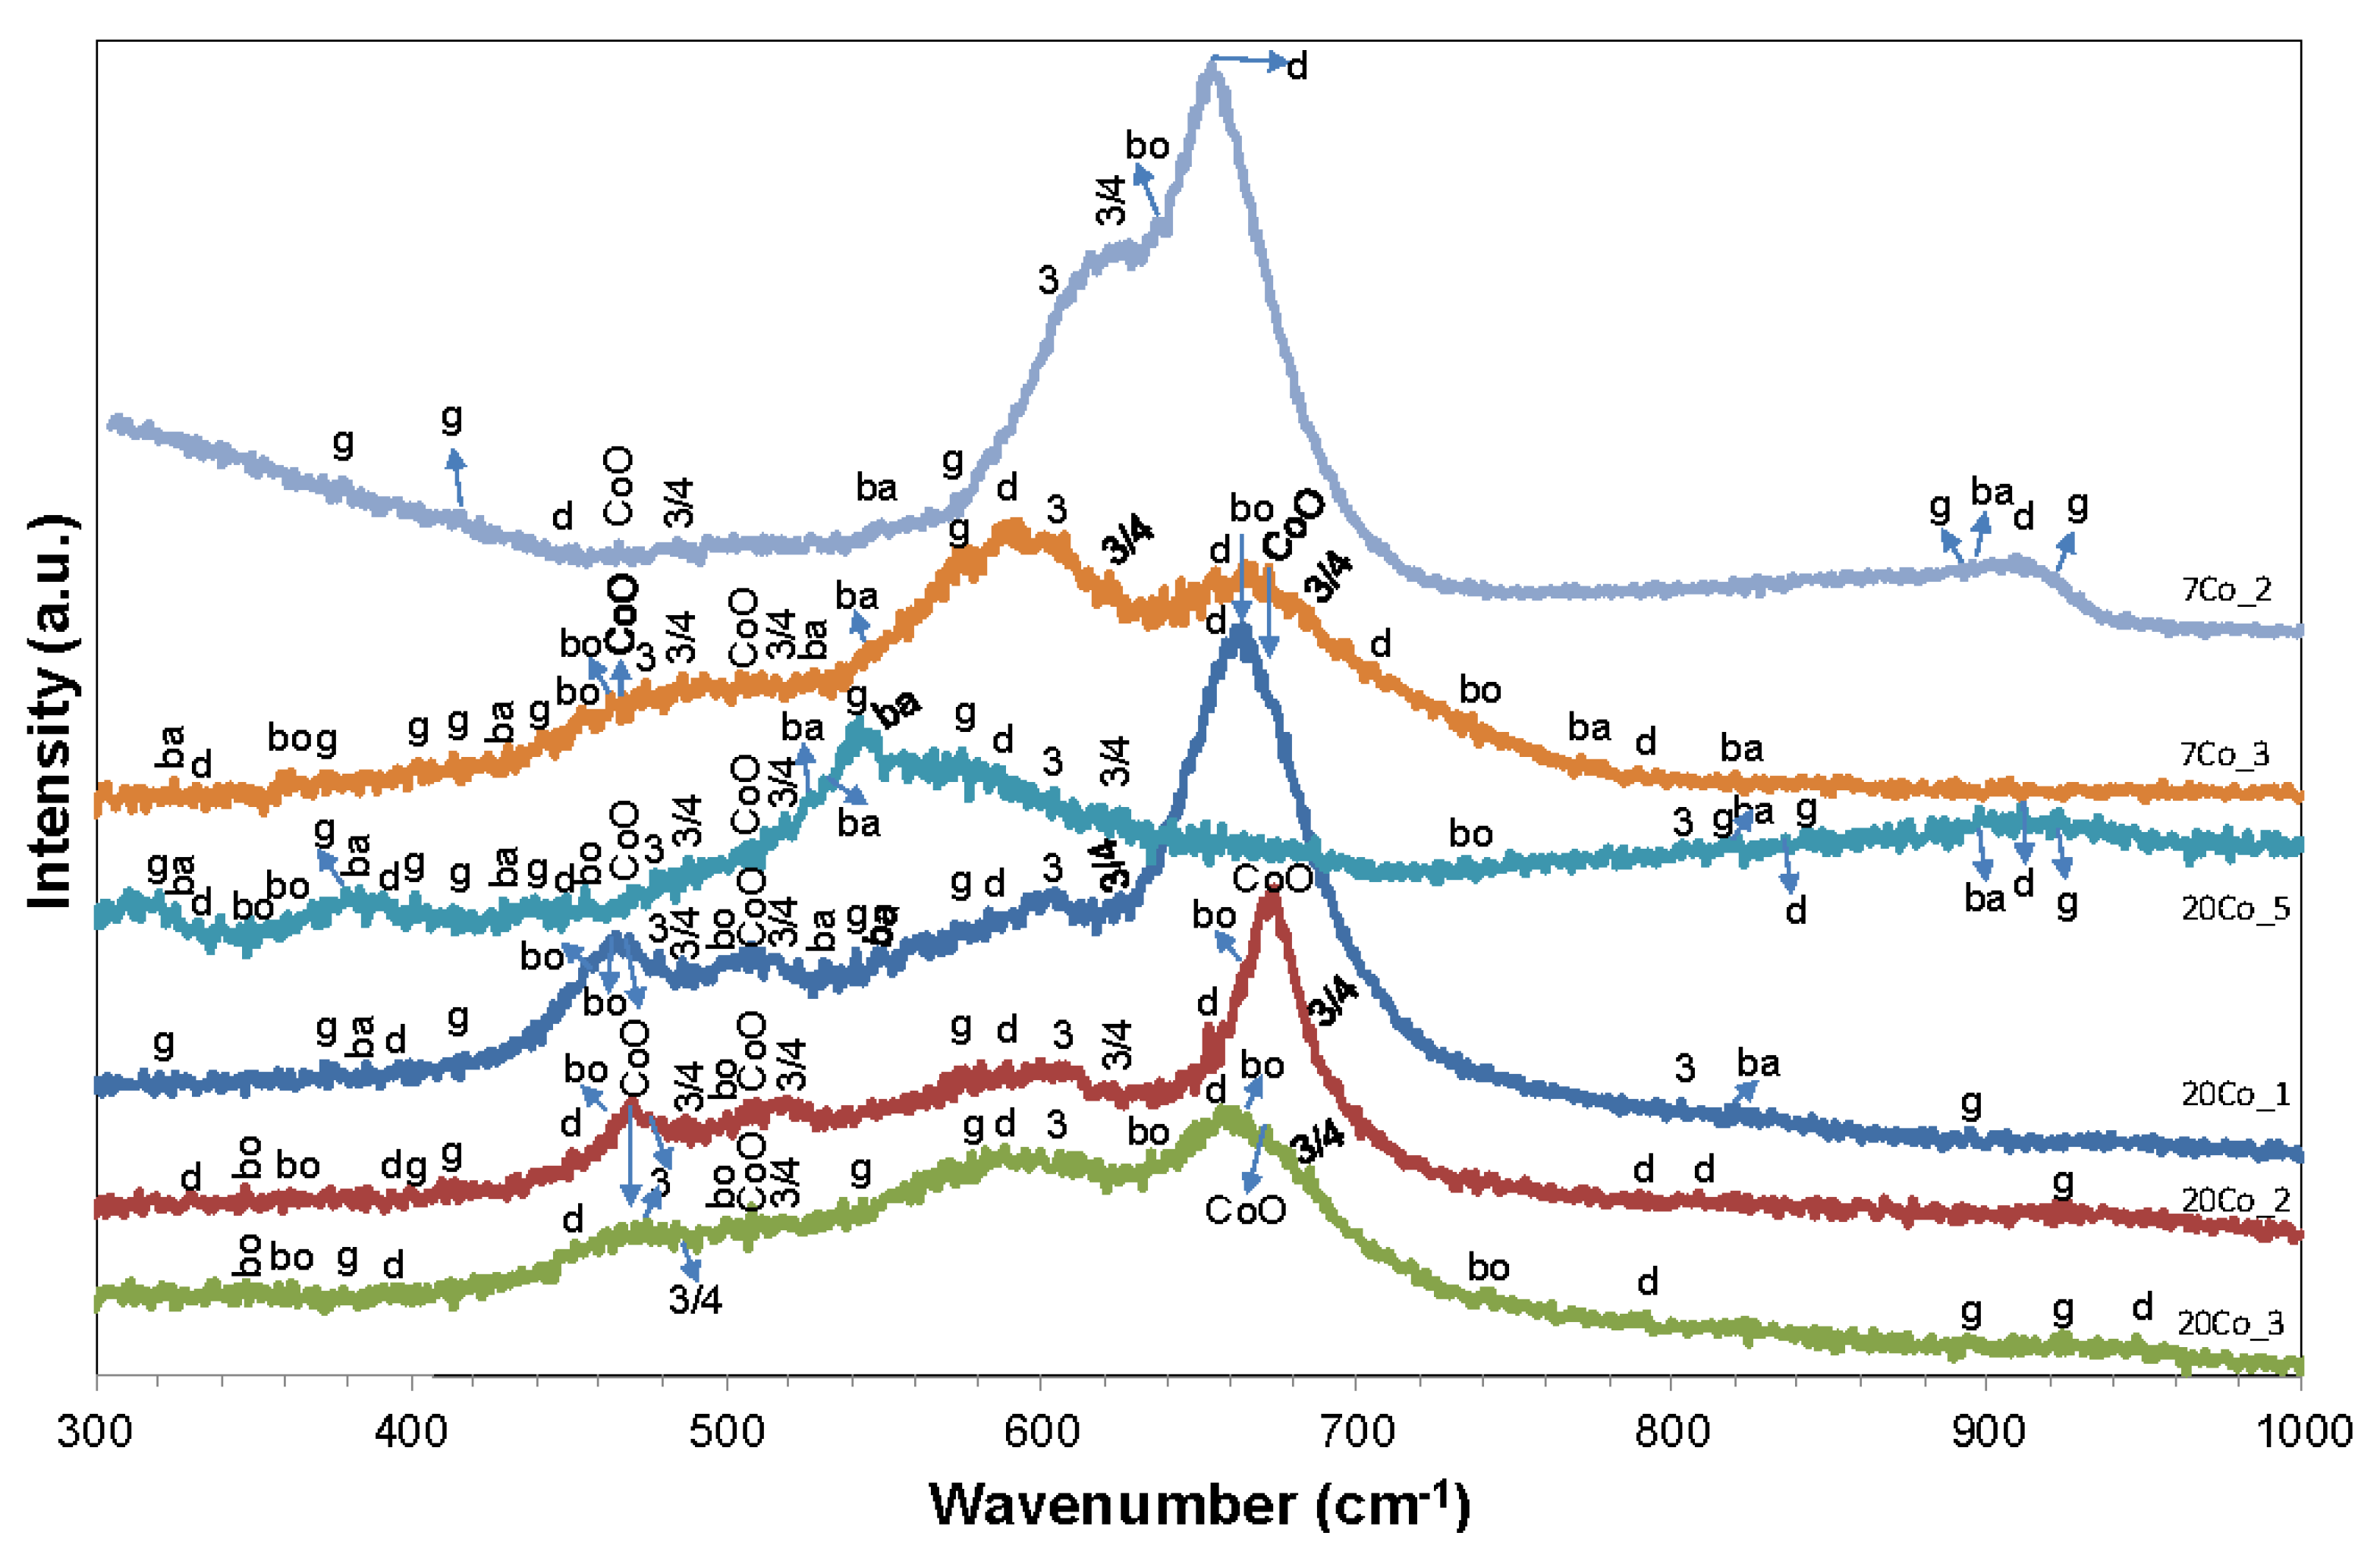
Representative Raman spectra from the surfaces of Al-7 wt.% Co and Al-20 wt.% Co specimens, after cyclic polarization in 3.5 wt.% NaCl, are presented in Figure 11. The Raman spectra are characterized by broad bands. The broadness of the bands is indicative of amorphicity [65]. Nevertheless, several broad peaks of high intensity are distinguished. Additionally, quite a few peaks of low intensity project from humps of “jagged” morphology. Hence, it is implied that the surface films consist of mixtures of amorphous and crystalline phases. This claim is consistent with the long-known bi-layered structure of the passive film on aluminum: The inner layer is a compact amorphous layer, while the outer layer is a permeable hydrated oxide layer [66]. Moreover, the majority of the Raman spectra present a wide hump starting from about 450 cm1 and extending up to about 600 cm1. This amorphicity can be attributed to the presence of amorphous cobalt oxide or cobalt oxide dispersed species [67,68]. The main peaks of Co3O4, CoO and CoOOH are discerned protruding from this hump along with peaks assigned to Al2O3-hydrates. All four main forms of alumina hydroxides/oxyhydroxides have been detected, namely, bayerite {α-Al(OH)3} and gibbsite {γ-Al(OH)3}, diaspore {α-AlOOH}, and boehmite {γ-AlOOH}. A differentiation between the various forms of alumina hydrates, as well as cobalt oxides/hydroxides on the basis of the observed peak wavenumbers and relevant literature [39,67,69,70,71,72,73,74,75,76,77], is attempted in Table 6.
Three main types of Raman spectra are observed in Figure 11:
(i) Spectra with predominance of bands corresponding to aluminum hydroxides/oxyhydroxides, where bands ascribed to characteristic vibrations of Co–O–Co bonds also present accountable intensity (7Co_2, 7Co_3, 20Co_1, 20Co_3).
(ii) Spectra with clear predominance of bands assigned to alumina hydrates, where the presence of bands due to vibrations in the lattice of Co-oxides/oxyhydroxides is minimal (20Co_5). The detection of bands corresponding to Co-oxides/oxyhydroxides is consistent with the presence of Co in the EDX spectra of Al-matrix after cyclic polarization (spectrum 4 in Figure 7).
(iii) Spectra with predominance of bands characterizing Co-oxides, where bands ascribed to Al2O3-hydrates have also a notable presence (20Co_2).
It is suggested that the third type and possibly the first type of Raman spectra characterize surface films on the intermetallic phase. Indeed, mixed aluminum and iron oxidized structures have been reported to compose the film on Fe-Al intermetallic compounds [78,79]. The second type of Raman spectra and possibly the first type of Raman spectra most likely correspond to films on the Al-matrix. The detection of mixtures of aluminum oxyhydroxides/hydroxides and cobalt oxides/oxyhydroxide is consistent with the aforementioned work of Vilaseka et al. [22].

3.2.6. Mechanism of Corrosion

Based on the electrochemical, microstructural and Raman spectroscopy findings, the following mechanism is considered to have taken place during the anodic polarization of the Al-Co alloys prepared in this investigation:
Stage 1: Selective dissolution of Al took place at the (Al)/Al9Co2 interface induced by the electrochemical potential difference of the two phases.
Stage 2: Formation of surface films on (Al) followed. Volume expansion due to (Al) surface oxidation exerted stresses on the adjacent Al9Co2 walls.
Stage 3: Once Cl adsorption on the aluminum oxide surface film at the (Al)/Al9Co2 interface occurred, an active center was developed. The active center was then the site for accelerated film thinning [80]. Once the film was sufficiently thinned, direct attack of the exposed Al occurred. Due to the electrochemical potential difference between Al and Al9Co2, dissolution of (Al) at the (Al)/Al9Co2 interface occurred. Small pits were initially formed. Pitting was evolved to crevice corrosion along the (Al)/Al9Co2 boundaries. In this stage, oxidation of Al9Co2 also took place, possibly at the high potentials; at these potentials, Al9Co2 was no longer cathodically protected by (Al), since the latter had been dissolved or oxidized to Al2O3 hydrates.
Stage 4: In the case of Al-7 wt.% Co, the resulting microstructure after stage 3 was fine plates of Al9Co2 protruding from a dissolved matrix (Figure 6a). Current stabilization had been attained owing to the deposition of hydrated oxides on (Al), as well as the passivation of Al9Co2. In the case of Al-20 wt.% Co, the cracked Al9Co2 blades fragmented because the much narrower embrittled zones of matrix could not any more support the brittle and cracked intermetallic blades. (The (Al) zones are considered embrittled because of: (i) increased Co entrapment and (ii) surface oxidation and expansion of matrix in stage 2). The fragments were accumulated in the gaps formed after dissolution of (Al) or soluble hydroxides, where they formed dense piles (Figure 6c). These piles obstructed further access of the electrolyte to the inner parts of the gaps.
During reverse polarization through stage 4, surface films and piles of fragments still protected the alloy, as the positive hysteresis loops show. However, hysteresis turned to negative as soon as reverse scanning reached potentials of stage 3: Pits were reactivated owing to the re-dissolution of the unstable surface films. Nevertheless, the reverse anodic scan intersects the forward anodic scan at a potential (Er) almost equal to the breakdown potential (Eb), as shown in Figure 4a. The closeness of the Er and Eb values constitutes further evidence of the high resistance of the alloy to localized corrosion [41].
To sum up, no significant differences between the corrosion resistances of the different alloy compositions were observed. On the one hand, the fine and uniform microstructure of Al-7 wt.% Co induced the formation of a relatively uniform surface film, as indicated by the relatively low current densities in stage 2. On the other hand, accumulation of Al9Co2 fragments in pits and crevices of Al-20 wt.% Co during stage 4 obstructed access of the electrolyte to the inner parts. Nevertheless, a slight superiority in the corrosion performance of Al-7 wt.% Co was indicated, considering the comparatively low values of general corrosion rate (icorr) and current density in current limiting stage 2 (ip), as well as the scarcity of stress corrosion cracking indications.
Despite the relatively low hardness of Al-7 wt.% Co (still significantly higher than that of CP-Al, as shown in Table 2), the high localized corrosion resistance of the alloy constitutes a promising attribute, taking into account the desire for low weight, low cost of raw materials, high ductility and high fracture toughness.

4. Conclusions

(1) Al-Co alloys (7, 10, 15, 20 wt.% Co) were prepared by vacuum arc remelting. Highly directional microstructures were attained. The microstructure of Al-7 wt.% Co and Al-10 wt.% Co consisted of eutectic A9Co2 in the form of fine plate arrays uniformly distributed in a Co-supersaturated Al-matrix. Eutectic growth and planar pre-eutectic growth were the main modes of microstructure evolution in Al-15 wt.% Co. In Al-20 wt.% Co, coarse particles and blades of Al9Co2 (most likely of pre-eutectic nature) uniformly distributed in Co-supersaturated αAl was the predominant microstructural morphology.
(2) By increasing the Co content of the alloy, the fraction of Al9Co2, the amount of Co dissolved in the Al matrix and the hardness of the alloy increased.
(3) All the compositions demonstrated very similar potentiodynamic polarization behaviors in 3.5 wt.% NaCl, at 25 °C, suggesting similar corrosion mechanisms.
(4) All the alloys regardless of the Co content, exhibited low susceptibility to localized corrosion in 3.5 wt.% NaCl. Localized corrosion was associated with pitting of the Al matrix.
(5) Al-7 wt.% Co showed a slightly higher corrosion resistance than the other compositions, in terms of corrosion rate, passivation current density and stress corrosion cracking indications.
(6) All Al-Co compositions demonstrated substantially higher resistance to localized corrosion than commercially pure Al produced by conventional and rapid solidification techniques.
(7) CP-Al produced by VAR showed higher corrosion resistance than CP-Al produced by stir casting or cold rolling.
(8) The corrosion mechanism during anodic potentiodynamic polarization included four stages: (i) active corrosion of the (Al) phase; (ii) passivation of (Al), which in the case of Al-20 wt.% Co caused stress corrosion cracking (SCC) of the coarse Al9Co2 blades; (iii) disruption of the passive film at the Al/Al9Co2 interface and dissolution of the exposed Al due to galvanic coupling with the nobler intermetallic. Pitting of Al evolving to crevice corrosion along the Al/Al9Co2 boundaries were the main corrosion forms in stage 3. Oxidation of Al9Co2 also occurred in this stage; (iv) pseudopassivation owing to the deposition of unstable hydrated oxides on (Al) and passivation of Al9Co2; at the high Co contents, fragmentation of Al9Co2 and piling up of the fragments in the gaps (resulting from (Al) dissolution) retarded further attack of the electrolyte.
(9) Surface films on both phases, (Al) and Al9Co2, consisted of mixtures of alumina hydrates (Al(OH)3 and AlOOH) and Co-oxides/oxyhydroxide (Co3O4/CoO/CoOOH) along with amorphous Co-oxide or Co-oxide dispersed species.

Acknowledgments

The authors would like to thank Cristina Papachristodoulou for acquiring the XRD diffractograms, Harissis Zoubos for the XRF measurements and Kiriaki Tsirka for obtaining the Raman spectra.

Author Contributions

Angeliki Lekatou analyzed the data and wrote the paper; Angeliki Lekatou and Athanasios K. Sfikas conceived and designed the experiments; Athanasios K. Sfikas and Christina Petsa performed the experiments; Alexandros E. Karantzalis contributed to materials/analysis tools.

Conflicts of Interest

The authors declare no conflict of interest.

Abbreviations

The following abbreviations are used in this manuscript:
RS
Rapid solidification
MS
Melt spinning
CMA
Complex metallic alloys
TM
Transition metals
VAR
Vacuum arc remelting
CP
Commercially pure
SE
Secondary electron
BSE
Back scattered electron

References

  1. Sater, J.M.; Jha, S.C.; Sanders, T.H., Jr. Microstructure and Properties of Rapidly Solidified Aluminum-Transition Metal Alloys in Aluminum Alloys. In Aluminum alloys-Contemporary Research and Applications, Treatise on Materials Science and Technology; Vasudevadan, A.K., Doherty, R.D., Eds.; Academic Press Inc.: San Diego, CA, USA, 1989; pp. 410–442. [Google Scholar]
  2. Karakose, E.; Keskin, M. Structural investigations of mechanical properties of Al based rapidly solidified alloys. Mater. Des. 2011, 32, 4970–4979. [Google Scholar] [CrossRef]
  3. Nayak, S.S.; Chang, H.J.; Kim, D.H.; Pabi, S.K.; Murty, B.S. Formation of metastable phases and nanocomposite structures in rapidly solidified Al-Fe alloys. Mater. Sci. Eng. A 2011, 528, 5967–5973. [Google Scholar] [CrossRef]
  4. Gogebakan, M.; Uzun, O.; Karaaslan, T.; Keskin, M. Rapidly solidified Al-6.5 wt.% Ni alloy. J. Mater. Process. Technol. 2003, 142, 87–92. [Google Scholar] [CrossRef]
  5. Katgerman, L.; Dom, F. Rapidly solidified aluminium alloys by melt spinning. Mater. Sci. Eng. A 2004, 375–377, 1212–1216. [Google Scholar] [CrossRef]
  6. Lufti Ovekoglu, M.; Unlu, N.; Eruslu, N.; Genc, A. Characterization investigations of a melt-spun ternary Al-8Si-5.1Cu (in wt.%) alloy. Mater. Lett. 2003, 57, 3296–3301. [Google Scholar] [CrossRef]
  7. Karakose, E.; Keskin, M. Microstructure and microhardness evolutions of melt-spun Al-8Ni-5Nd-4Si alloy. Mater. Character. 2012, 65, 37–47. [Google Scholar] [CrossRef]
  8. Vidoz, A.E.; Crooks, D.D.; Lewis, R.E.; Palmer, I.G.; Wadsworth, J. Ultralow-Density, High-Modulus, and High-Strength RSP Al-Li-Be Alloys. In Rapidly Solidified Powder Aluminum Alloys; Fine, M.E., Starke, E.A., Jr., Eds.; ASTM: Philadelphia, PA, USA, 1986; pp. 237–251. [Google Scholar]
  9. Yoshioka, H.; Yoshida, S.; Kawashima, A.; Asami, K.; Hashimoto, K. The pitting corrosion behavior of rapidly solidified aluminum alloys. Corros. Sci. 1986, 26, 795–812. [Google Scholar] [CrossRef]
  10. Zhang, L.; Wang, F.; Liang, P.; Song, X.; Hu, Q.; Sun, Z.; Song, X.; Yang, S.; Wang, L. The electrochemical properties of melt-spun Al-Si-Cu alloys. Mater. Chem. Phys. 2011, 129, 1006–1010. [Google Scholar] [CrossRef]
  11. Menon, J.; Suryanarayana, C. Metallography of a melt-quenched aluminum-cobalt alloy. Metallography 1988, 21, 179–197. [Google Scholar] [CrossRef]
  12. Froes, F.H.; Kim, Y.W.; Murthy, S.K. Rapid solidification of lightweight metal alloys. Mater. Sci. Eng. A 1989, 117, 19–32. [Google Scholar] [CrossRef]
  13. Adam, A.M. Influence of Rapid Solidification on the Microstructure of Aluminium Rich Hypereutectic Al-Co Alloys; U.P.B. Sci. Bull. Ser. B; University Polytechnica of Bucharest: Bucharest, Romania, 2011; Volume 73, pp. 217–228. [Google Scholar]
  14. Garrett, R.K., Jr.; Sanders, T.H., Jr. The formation of coarse intermetallics in rapidly solidified Al-Co alloys. Mater. Sci. Eng. 1983, 60, 269–274. [Google Scholar] [CrossRef]
  15. Yamauchi, I.; Kawamura, H.; Nakano, K.; Tanaka, T. Formation of fine skeletal Co-Ag by chemical leaching of Al-Co-Ag ternary alloys. J. Alloys Compd. 2005, 287, 187–192. [Google Scholar] [CrossRef]
  16. Armbrüster, M.; Schlögl, R.; Grin, Y. Intermetallic compounds in heterogeneous catalysis—A quickly developing field. Sci. Technol. Adv. Mater. 2014, 15, 17. [Google Scholar] [CrossRef]
  17. Dubois, J.M.; Belin-Ferré, E.; Feuerbacher, M. Introduction to the Science of Complex Metallic Alloys. In Complex Metallic Alloys: Fundamentals and Applications; Dubois, J.M., Belin-Ferré, E., Eds.; Wiley-VCH Verlag GmbH: Weinheim, Germany, 2011; pp. 1–39. [Google Scholar]
  18. Urban, K.; Feuerbacher, M. Structurally complex alloy phases. J. Non-Cryst. Solids 2004, 334–335, 143–150. [Google Scholar] [CrossRef]
  19. Barthes-Labrousse, M.G.; Dubois, J.M. Quasicrystals and complex metallic alloys: Trends for potential applications. Philos. Mag. 2008, 88, 2217–2225. [Google Scholar] [CrossRef]
  20. Eckert, J.; Scudino, S.; Stoica, M.; Kenzari, S.; Sales, M. Mechanical Engineering Properties of CMAs. In Complex Metallic Alloys: Fundamentals and Applications; Dubois, J.M., Belin-Ferré, E., Eds.; Wiley-VCH Verlag GmbH: Weinheim, Germany, 2011; pp. 273–315. [Google Scholar]
  21. Alarcon Villaseca, S.; Ledieu, J.; Serkovic Loli, L.N.; De Weerd, M.C.; Gille, P.; Fournée, V.; Dubois, J.M.; Gaudry, E. Structural investigation of the (001) surface of the Al9Co2 Complex Metallic Alloy. J. Phys. Chem. 2011, C115, 14922–14932. [Google Scholar]
  22. Alarcon Villaseca, S.; Serkovic Loli, L.N.; Ledieu, J.; Fournée, V.; Gille, P.; Dubois, J.M.; Gaudry, E. Oxygen adsorption on the Al9Co2(001) surface: First principles and STM study. J. Phys. Condens. Matter. 2013, 25, 13. [Google Scholar] [CrossRef] [PubMed]
  23. Hollingsworth, E.H.; Hunsicker, H.Y. Corrosion of Aluminium and Aluminium alloys. In ASM Handbook (Vol. 13): Corrosion, 9th ed.; Davis, J.R., Ed.; ASM International: Ohio, OH, USA, 1987; pp. 583–609. [Google Scholar]
  24. Lucente, A.M.; Scully, J.R. Pitting of Al-based amorphous nanocrystalline alloys with solute-lean nanocrystals. Electrochem. Solid-State Lett. 2007, 10, C39–C43. [Google Scholar] [CrossRef]
  25. Goldman, M.A.; Unlu, N.; Shiflet, G.J.; Scully, J.R. Selected corrosion properties of a novel amorphous Al-Co-Ce alloy system. Electrochem. Solid-State Lett. 2005, 8, B1–B5. [Google Scholar] [CrossRef]
  26. Presuel-Moreno, F.; Jakab, M.A.; Tailleart, N.; Goldman, M.; Scully, J.R. Corrosion resistant metallic coatings. Mater. Today 2008, 11, 14–23. [Google Scholar] [CrossRef]
  27. Palcut, M.; Priputen, P.; Kusy, M.; Janovec, J. Corrosion behaviour of Al-29 at.%Co in aqueous NaCl. Corros. Sci. 2013, 75, 461–466. [Google Scholar] [CrossRef]
  28. Palcut, M; Priputen, P.; Salgo, K.; Janovec, J. Phase constitution and corrosion resistance of Al-Co alloys. Mater. Chem. Phys. 2015, 166, 95–104. [Google Scholar]
  29. Lekatou, A.; Sfikas, A.K.; Karantzalis, A.E.; Sioulas, D. Microstructure and corrosion performance of Al-32% Co alloys. Corros. Sci. 2012, 63, 193–209. [Google Scholar] [CrossRef]
  30. Stoloff, N.; Liu, C.; Deevi, S. Emerging applications of intermetallics. Intermetallics 2000, 8, 1313–1320. [Google Scholar] [CrossRef]
  31. Principe, E.; Shaw, B.; Davis, G. Role of oxide/metal interface in corrosion resistance: Al-W and Al-Mo systems. Corrosion 2003, 59, 295–313. [Google Scholar] [CrossRef]
  32. Zamanzade, M.; Barnoush, A. Effect of chromium on the electrochemical properties of iron aluminide intermetallics. Corros. Sci. 2014, 78, 223–232. [Google Scholar] [CrossRef]
  33. Rajamure, R.S.; Vora, H.D.; Srinivasan, S.G.; Dahotre, N.D. Laser alloyed Al-W coatings on aluminum for enhanced corrosion resistance. App. Surf. Sci. 2015, 328, 205–214. [Google Scholar] [CrossRef]
  34. Ura-Binczyk, E.; Homazava, N.; Ulrich, A.; Hauert, R.; Lewandowska, M.; Kurzydlowski, K.J.; Schmutz, P. Passivation of Al–Cr–Fe and Al–Cu–Fe–Cr complex metallic alloys in 1 M H2SO4 and 1 M NaOH solutions. Corros. Sci. 2011, 53, 1825–1837. [Google Scholar] [CrossRef]
  35. Beni, A.; Ott, N.; Ura-Binczyk, E.; Rasinski, M.; Bauer, B.; Gille, P.; Ulrich, A.; Schmutz, P. Passivation and localised corrosion susceptibility of new Al–Cr–Fe complex metallic alloys in acidic NaCl electrolytes. Electrochim. Acta 2011, 56, 10524–10532. [Google Scholar] [CrossRef]
  36. McAllister, A.J. The Al-Co system. Bull. Alloy Phase Diagr. 1989, 10, 646–650. [Google Scholar] [CrossRef]
  37. Warmuzek, M. Metallographic Techniques for Aluminum and Its Alloys. In ASM Handbook, Vol. 9: Metallography and Microstructures; Vander Voort, G.F., Ed.; ASM Int.: Ohio, OH, USA, 2004; pp. 711–751. [Google Scholar]
  38. Stern, M.; Geary, A.L. Electrochemical polarization I. A theoretical analysis of the shape of polarization curves. J. Electrochem. Soc. 1957, 104, 56–61. [Google Scholar] [CrossRef]
  39. Lekatou, A.; Zois, D.; Karantzalis, A.E.; Grimanelis, D. Electrochemical behaviour of cermet coatings with a bond coat on Al7075: Pseudopassivity, localized corrosion and galvanic effect considerations in a saline environment. Corros. Sci. 2010, 52, 2616–2635. [Google Scholar] [CrossRef]
  40. McCafferty, E. Validation of corrosion rates measured by the Tafel extrapolation method. Corros. Sci. 2005, 47, 3202–3215. [Google Scholar] [CrossRef]
  41. Silverman, D.C. Practical Corrosion Prediction Using Electrochemical Techniques. In Uhlig’s Corrosion Handbook, 3rd ed.; Revie, R.W., Ed.; Wiley & Sons: New York, NY, USA, 2011; pp. 1129–1166. [Google Scholar]
  42. Lekatou, A.; Sioulas, D.; Karantzalis, A.E.; Grimanelis, D. A comparative study on the microstructure and surface property evaluation of coatings produced from nanostructured and conventional WC-Co powders HVOF-sprayed on Al 7075. Surf. Coat. Tech. 2015, 276, 539–556. [Google Scholar] [CrossRef]
  43. Barclay, R.S.; Kerr, H.W.; Niessen, P. Off-eutectic composite solidification and properties in Al-Ni and Al-Co alloys. J. Mater. Sci. 1971, 6, 1168–1173. [Google Scholar] [CrossRef]
  44. Jackson, K.A. Crystal growth kinetics. Mater. Sci. Eng. 1984, 65, 7–13. [Google Scholar] [CrossRef]
  45. Jackson, K.A. The interface kinetics of crystal growth processes. Interface Sci. 2002, 10, 159–169. [Google Scholar] [CrossRef]
  46. Chen, Y.; Wang, H.M. Growth morphologies and mechanism of TiC in the laser surface alloyed coating on the substrate of TiAl intermetallics. J. Alloy Compd. 2003, 351, 304–308. [Google Scholar]
  47. Karantzalis, A.E.; Lekatou, A.; Georgatis, E.; Arni, Z.; Dracopoulos, V. Solidification observations of vacuum arc melting processed FeAl-TiC composites: TiC precipitation mechanisms. Mater. Character. 2011, 62, 1196–1204. [Google Scholar] [CrossRef]
  48. Sater, J.M.; Sanders, T.H.; Garrett, R.K. Characterization of Rapidly Solidified Materials. In Rapidly Solidified Powder Aluminum Alloys; Fine, M.E., Starke, E.A., Eds.; ASTM STP 890, ASTM: Philadelphia, PA, USA, 1986; pp. 83–117. [Google Scholar]
  49. Sater, J.M.; Sanders, T.H. A Quantitative Microscopy Investigation of Melt Spun AI-10 wt.% Co. In Rapidly Solidified Materials; Lee, P.W., Carbonara, R.S., Eds.; ASM: Ohio, OH, USA, 1986; pp. 357–366. [Google Scholar]
  50. Bilušić, A.; Smiljanić, I.; Bihar, Ž.; Stanić, D.; Smontara, A. Heat Conduction in Complex Metallic Alloys. Croat. Chem. Acta 2010, 83, 21–25. [Google Scholar]
  51. Shen, J.; Liu, Y.; Han, Y.; Zhang, P.; Gao, H. Formation of bulk intermetallic compound Ag3Sn in slowly-cooled lead-free Sn-4.0 wt pct Ag solders. J. Mater. Sci. Technol. 2005, 21, 827–830. [Google Scholar]
  52. Wille, G.; Bourrat, X.; Maubec, N.; Guegan, R.; Lahfid, A. Raman-in-SEM Studies of Inorganic Materials. In Spectroscopic Properties of Inorganic and Organometallic Compounds: Techniques, Materials and Applications; Yarwood, J., Douthwaite, R., Duckett, S.B., Eds.; The Royal Society of Chemistry: London, UK, 2014; Volume 45, pp. 79–116. [Google Scholar]
  53. Osório, W.R.; Spinelli, J.E.; Ferreira, I.L.; Garcia, A. The roles of macrosegregation and of dendritic array spacings on the electrochemical behavior of an Al-4.5 wt.% Cu alloy. Electrochim. Acta 2007, 52, 3265–3273. [Google Scholar] [CrossRef]
  54. Robie, R.A.; Bruce, R.; Hemingway, S. Thermodynamic Properties of Minerals and Related Substances at 298.15 K and 1 Bar (105 Pascals) Pressure and at Higher Temperatures; U.S. Geological Survey Bulletin 2131; U.S. Department of the Interior: Washington DC, WA, USA, 1995. [Google Scholar]
  55. Hemingway, B.S.; Robie, R.A.; Kittrick, J.A. Revised values for the Gibbs free energy of formation of [Al(OH)4 aq-], diaspore, boehmite and bayerite at 298.15 K and 1 bar, the thermodynamic properties of kaolinite to 800 K and 1 bar, and the heats of solution of several gibbsite samples. Geochim. Cosmochim. Acta 1978, 42, 1533–1543. [Google Scholar] [CrossRef]
  56. Hem, J.D.; Roberson, C.E.; Lind, C.J. Thermodynamic stability of CoOOH and its coprecipitation with manganese. Geochim. Cosmochim. Acta 1985, 49, 801–810. [Google Scholar] [CrossRef]
  57. Wang, X.; Nie, M.; Wang, C.T.; Wang, S.C.; Gao, N. Microhardness and corrosion properties of hypoeutectic Al–7Si alloy processed by high-pressure torsion. Mater. Des. 2015, 83, 193–202. [Google Scholar]
  58. Santos, S.L.D.; Antunes, R.A.; Santos, S.F. Influence of injection temperature and pressure on the microstructure, mechanical and corrosion properties of a AlSiCu alloy processed by HPDC. Mater. Des. 2015, 88, 1071–1081. [Google Scholar]
  59. Stansbury, E.E.; Buchanan, R.A. Fundamentals of Electrochemical Corrosion; ASM Int.: Materials Park, Ohio, OH, USA, 2000; p. 328. [Google Scholar]
  60. Lekatou, A.; Karantzalis, A.E.; Evangelou, A.; Gousia, V.; Kaptay, G.; Gácsi, Z.; Baumli, P.; Simon, A. Aluminium reinforced by WC and TiC nanoparticles (ex-situ) and aluminide particles (in-situ): Microstructure, wear and corrosion behaviour. Mater. Des. 2015, 65, 1121–1135. [Google Scholar] [CrossRef]
  61. Ghali, E. Magnesium and Magnesium Alloys. In Uhlig’s Corrosion Handbook, 3rd ed.; Revie, R.W., Ed.; Wiley & Sons: New York, NY, USA, 2011; pp. 809–836. [Google Scholar]
  62. Harwood, J.J. The influence of stress on corrosion (part 1 of two parts). Corrosion 1950, 6, 249–259. [Google Scholar] [CrossRef]
  63. Szklarska-Smialowska, Z. Mechanism of pit nucleation by electrical breakdown of the passive film. Corros. Sci. 2002, 44, 1143–1149. [Google Scholar] [CrossRef]
  64. Wang, B.; Zhang, L.; Su, Y.; Mou, X.; Xiao, Y.; Liu, J. Investigation on the corrosion behavior of aluminum alloys 3A21 and 7A09 in chloride aqueous solution. Mater. Des. 2013, 50, 15–21. [Google Scholar] [CrossRef]
  65. Ohtsuka, H.; Tabata, T.; Okada, O.; Sabatino, L.M.F.; Bellussi, G. A study on selective reduction of NOx by propane on Co-Beta. Catal. Lett. 1997, 44, 265–270. [Google Scholar] [CrossRef]
  66. Hunter, M.S.; Fowle, P. Naturally and thermally formed oxide films on aluminum. J. Electrochem. Soc. 1956, 103, 482–485. [Google Scholar] [CrossRef]
  67. Tyczkowski, J.; Kapica, R.; Lojewska, J. Thin cobalt oxide films for catalysis deposited by plasma-enhanced metAl-organic chemical vapor deposition. Thin Solid Films 2007, 515, 6590–6595. [Google Scholar] [CrossRef]
  68. Vuurman, M.A.; Stufkens, D.J.; Oskam, A.; Deo, G.L.; Wachs, I.E. Combined Raman and IR study of MOX–V2O5/Al2O3 (MOx = MoO3, WO3, NiO, CoO) catalysts under dehydrated conditions. J. Chem. Soc. Faraday Trans. 1996, 92, 3259–3265. [Google Scholar] [CrossRef]
  69. Ruan, H.D.; Frost, R.L.; Kloprogge, J.T. Comparison of Raman spectra in characterizing gibbsite, bayerite, diaspore and boehmite. J. Raman Spectrosc. 2001, 32, 745–750. [Google Scholar] [CrossRef] [Green Version]
  70. Chen, Y.; Hyldtoft, J.; Jacobsen, C.J. H; Nielsen, O.F. NIR FT Raman spectroscopic studies of γ-Al2O3 and Μο/γAl2O3 catalysts. Spectrochim. Acta 1995, 51A, 2161–2169. [Google Scholar] [CrossRef]
  71. Dyer, C.; Hendra, P.J.; Forsling, W.; Ranheimer, M. Surface hydration of aqueous γ-Al2O3 studied by Fourier transform Raman and infrared spectroscopy-I Initial results. Spectrochim. Acta 1993, 49A, 691–705. [Google Scholar] [CrossRef]
  72. Mariotto, G.; Cazzanelli, E.; Carturan, G.; Di Maggio, R.; Scardi, P. Raman and X-ray diffraction study of boehmite gels. J. Solid State Chem. 1990, 86, 263–274. [Google Scholar] [CrossRef]
  73. Kiss, A.B.; Keresztury, G.; Farkas, L. Raman and i.r. spectra and structure of boehmite (γ-AlOOH). Evidence for the recently discarded D172h space group. Spectrochim. Acta 1980, A36, 653–658. [Google Scholar] [CrossRef]
  74. Gwag, J.S.; Sohn, Y.K. Interfacial natures and controlling morphology of Co oxide nanocrystal structures by adding spectator Ni ions. Bull. Korean Chem. Soc. 2012, 33, 505–510. [Google Scholar] [CrossRef]
  75. Tang, C.W.; Wang, C.B.; Chien, S.H. Characterization of cobalt oxides studied by FT-IR, Raman, TPR and TG-MS. Thermochim. Acta 2008, 473, 68–73. [Google Scholar] [CrossRef]
  76. Gallant, D.; Pézolet, M.; Simard, S. Inhibition of cobalt active dissolution by benzotriazole in slightly alkaline bicarbonate aqueous media. J. Phys. Chem. 2006, B110, 6871–6880. [Google Scholar] [CrossRef] [PubMed]
  77. Hadjiev, V.G.; Iliev, M.N.; Vergilov, I.N. The Raman spectra of Co3O4. J. Phys. C Solid State Phys. 1988, 21, 199–201. [Google Scholar] [CrossRef]
  78. Rao, V.S. A review of the electrochemical corrosion behaviour of iron aluminides. Electrochim. Acta 2004, 49, 4533–4542. [Google Scholar] [CrossRef]
  79. Palm, M.; Krieg, R. Neutral salt spray tests on Fe–Al and Fe–Al–X. Corros. Sci. 2012, 64, 74–81. [Google Scholar] [CrossRef]
  80. Foley, R.T. Localized corrosion of aluminum alloys—A review. Corrosion 1986, 42, 277–288. [Google Scholar] [CrossRef]
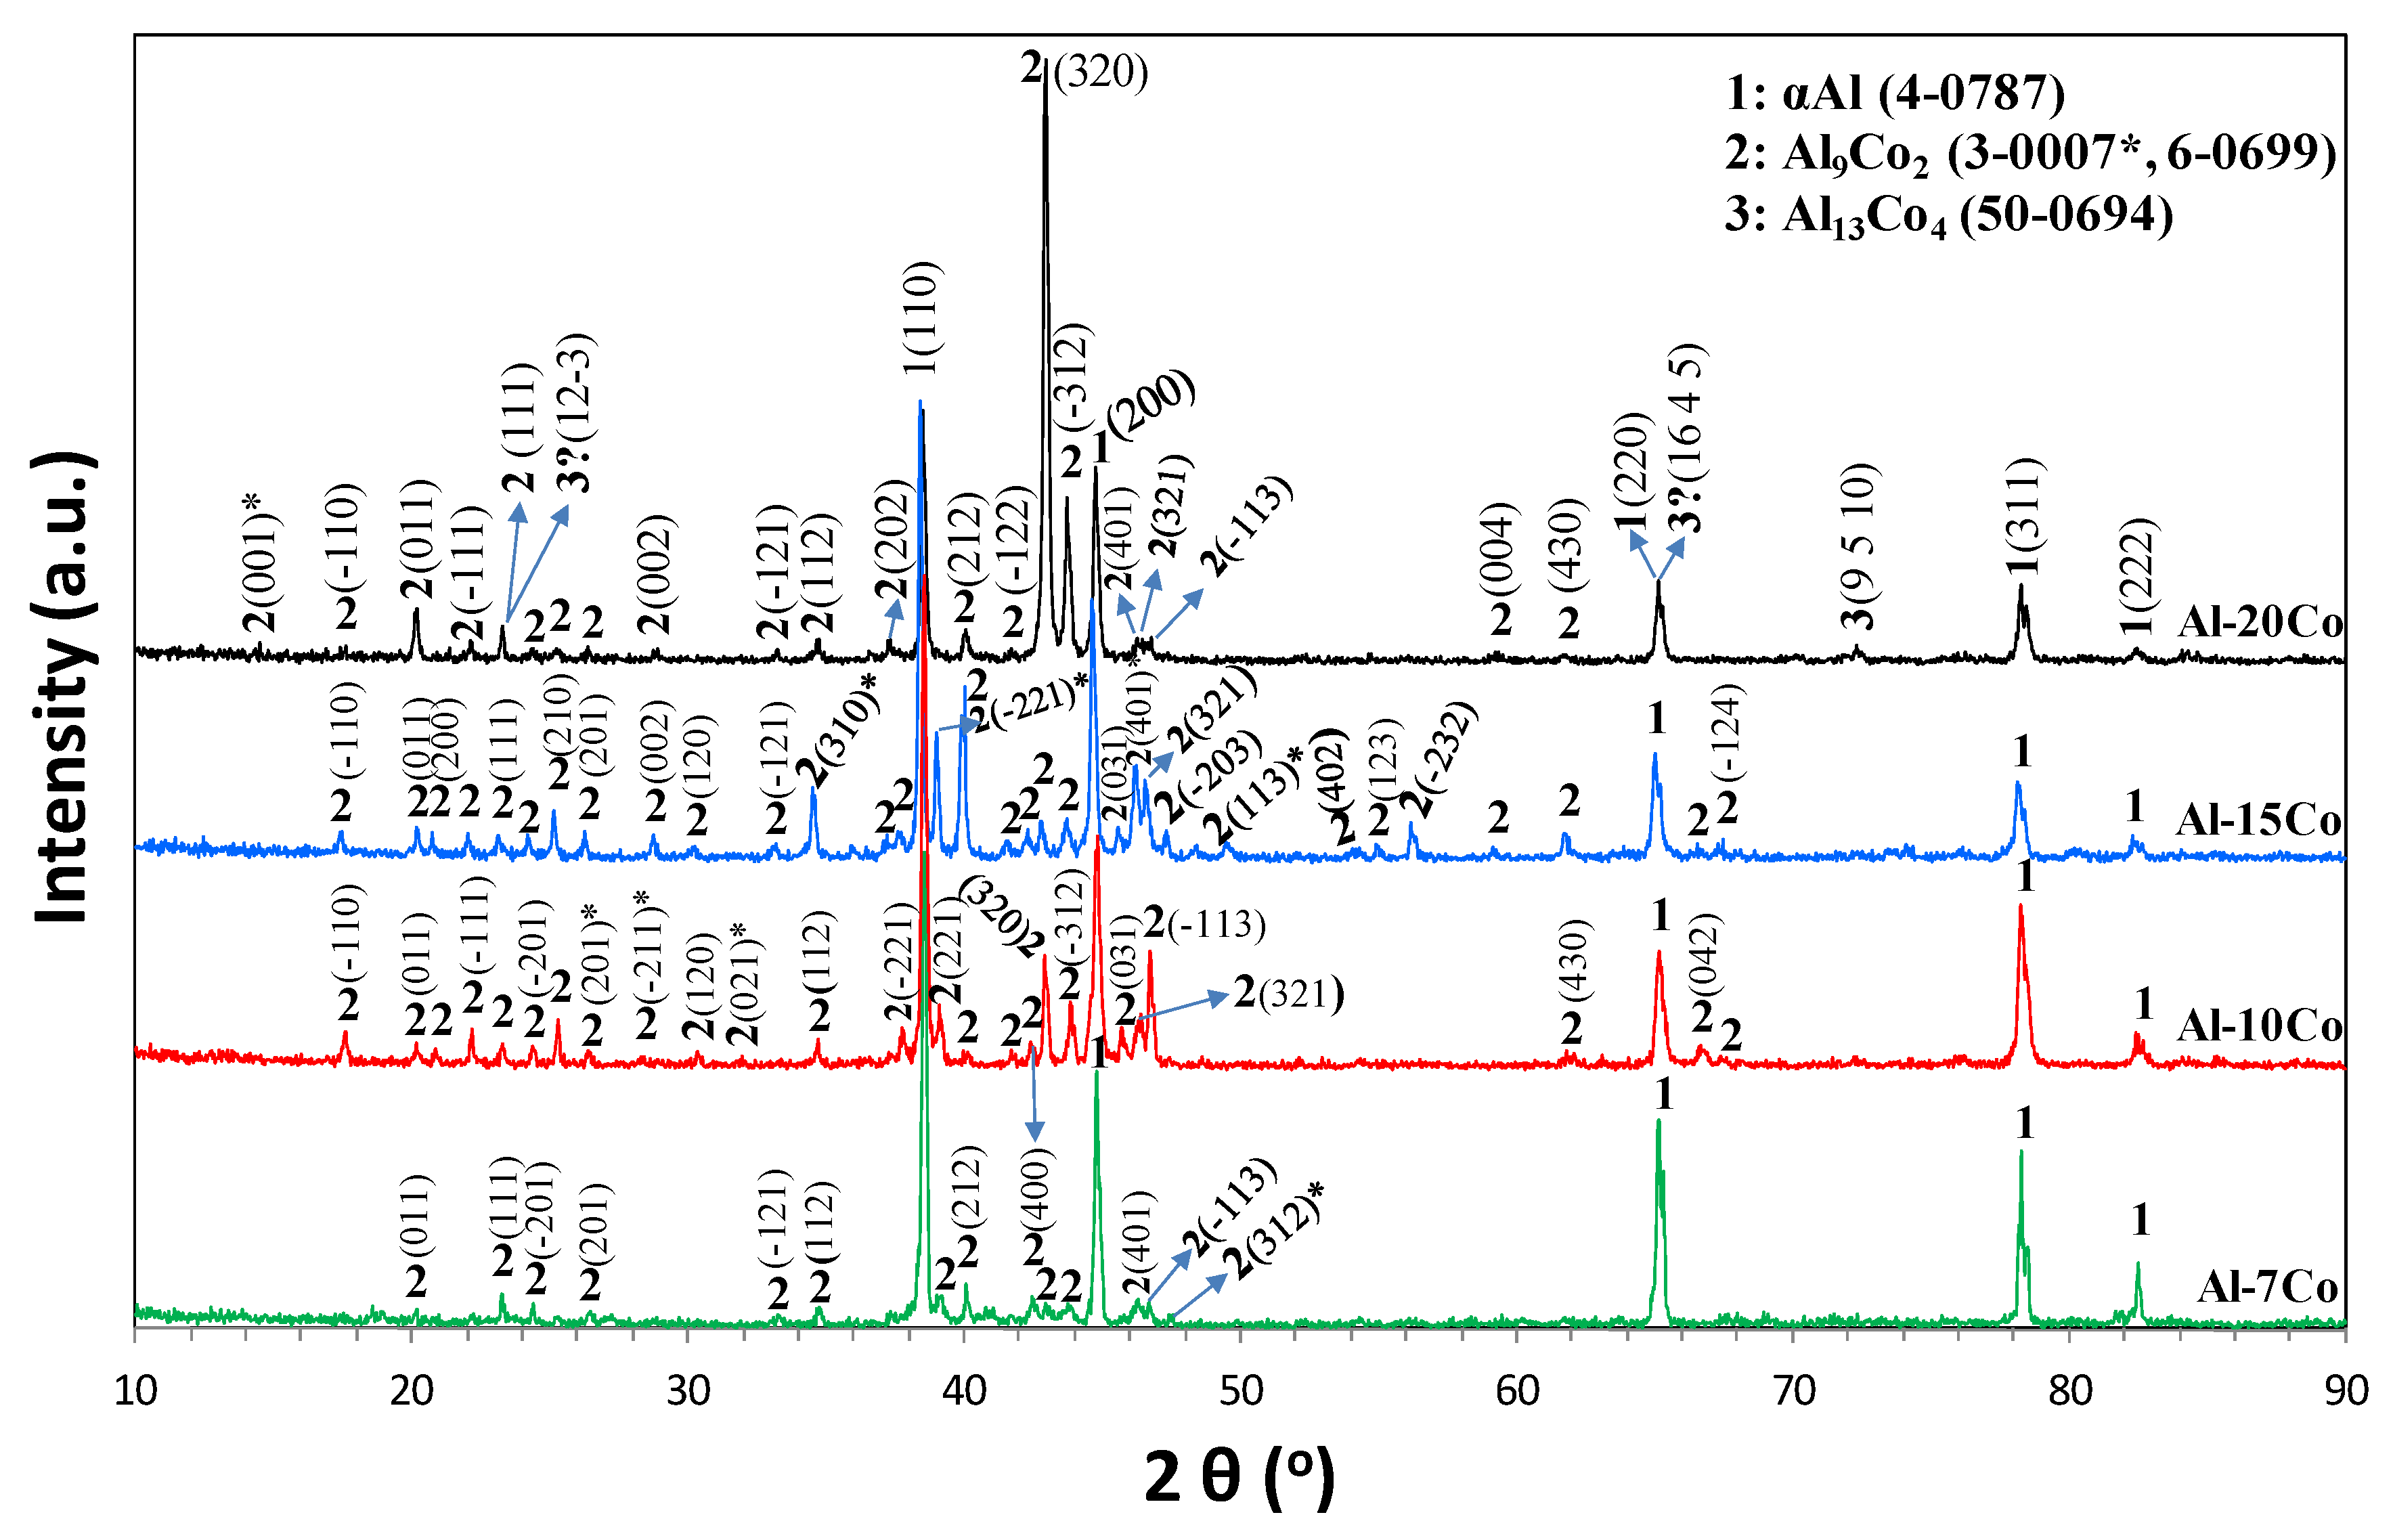
Figure 1. XRD patterns of the Al-Co alloys (7, 10, 15, 20 wt.% Co).
Metals 06 00046 g001
Figure 2. Microstructure of the alloys, as fabricated (BSE mode): (a) Al-7wt.% Co; (b) Al-10 wt.% Co; (c) Al-15 wt.% Co; (d) Al-20 wt.% Co; white outlined ellipses: pores at the intersections of dendrites and dendrite arms; black outlined ellipses: narrow and closed gaps in the matrix between Al9Co2 particles; white arrows: pores, microdefects at sharp points of Al9Co2 particles; black arrows: pores in the middle of Al9Co2 phase.
Metals 06 00046 g002
Figure 3. Microstructures of CP-Al produced by (a) stir casting of Al1050-H14 and (b) vacuum arc remelting of Al1050-H14.
Metals 06 00046 g003
Figure 4. Potentiodynamic polarization behavior of the various alloys and CP-Al fabricated by casting of Al1050 sheet (Al1050-cast) in 3.5 wt.% NaCl, at 25 °C. (a) Al-Co cyclic polarization; (b) Al-Co forward polarization and CP-Al cast cyclic polarization.
Metals 06 00046 g004
Figure 5. Potentiodynamic polarization performance of CP-Al produced by VAR of CP-Al powder (Alpowder-VAR), VAR of Al1050 sheet (Al1050-VAR), casting of Al1050 (Al1050-cast), cold rolling (Al1050-H14) and Al-15 wt.% Co produced by VAR (3.5 wt.% NaCl, 25 °C); (a) full view; (b) magnified view at a selected range of potentials.
Metals 06 00046 g005
Figure 6. Cross sections (SE mode) of (a) Al-7 wt.% Co, (b) Al-15 wt.% Co and (c) Al-20 wt.% Co after cyclic polarization (3.5 wt.% NaCl, 25 °C); the blue arrows in Figure 6c point at the Al13Co4 phase.
Metals 06 00046 g006
Figure 7. Cross-section (SE mode) of Al-7 wt.% Co after cyclic polarization (3.5 wt.% NaCl, 25 °C) and EDX analysis in the (Al) phase (spectrum 4) and the Al9Co2 phase (spectrum 5).
Metals 06 00046 g007
Figure 8. Cross-section (SE mode) of Al-7 wt.% Co after cyclic polarization (3.5 wt.% NaCl, 25 °C) and EDX line scan across a plate of Al9Co2.
Metals 06 00046 g008
Figure 9. Cross-section (SE mode) of Al-15 wt.% Co after cyclic polarization (3.5 wt.% NaCl, 25 °C) and EDX line scan across a blade of Al9Co2.
Metals 06 00046 g009
Figure 10. Cross-section (SE mode) of Al-20 wt.% Co after cyclic polarization (3.5 wt.% NaCl, 25 °C) and EDX elemental mapping.
Metals 06 00046 g010
Figure 11. Representative Raman spectra from the surface of Al-7 wt.% Co and Al-20 wt.% Co, after cyclic polarization (3.5 wt.% NaCl, 25 °C). d: diaspore, b: boehmite, g: gibbsite, ba: bayerite, 3/4: Co3O4, 3: CoOOH.
Metals 06 00046 g011
Table 1. Expected percentages of the microconstituents of the Al-Co alloys when prepared under equilibrium conditions.
Alloy (Al-wt.% Co)Primary Al9Co2 (wt.%)Eutectic Microconstituent
αAl (wt.%)Al9Co2 (wt.%)
Al-7Co19.478.52.1
Al-10Co28.869.41.8
Al-15Co44.554.11.4
Al-20Co60.238.81.0
Table 2. Compositional, porosity and hardness data of the alloys, as-fabricated.
Alloy DesignationCo in the Alloy (wt.%)Al9Co2 in the Alloy (vol.%)Co in Al9Co2 (at.%)Max Co in αAl (wt.%)2-D Porosity (%)Hardness (HB10)Microhardness of αAl (HV1 gf/10 s)
Al1050-H14 (wrought)35 ± 1
Al1050-cast 132 ± 033 ± 2 3
Alpowder-VAR 239 ± 24
Al-7 Co7.0 ± 0.536 ± 316.25 ± 1.190.590.33 ± 0.0752 ± 457 ± 3
Al-10 Co10.0 ± 0.541 ± 117.35 ± 0.551.890.40 ± 0.0355 ± 671 ± 11
Al-15 Co15.5 ± 1.550 ± 117.10 ± 0.861.820.57 ± 0.0665 ± 676 ± 11
Al-20 Co21.0 ± 2.063 ± 117.14 ± 1.355.510.59 ± 0.0495 ± 1094 ± 17 5
1 prepared by casting of Al1050; 2 prepared by VAR of CP-Al powder; 3 after light etching; 4 grain size too small to extract reliable microhardness values; 5 the value is reported with cautiousness due to marginally sufficient space from Al9Co2 boundaries.
Table 3. Electrochemical values of the alloys immersed in 3.5 wt.% NaCl, at 25 °C. Ecorr: corrosion potential; Ea/c tr: anodic-to-cathodic transition potential; Ecp: critical “passivation” potential (stage 2); Eb: breakdown potential. (The reported values are average of four to five responses).
AlloyEcorr
(mV vs. Ag/AgCl)
Ea/c tr
(mV vs. Ag/AgCl)
Eb
(mV vs. Ag/AgCl)
Ecp
(mV vs. Ag/AgCl)
Ea/c trEcorr (mV)EcpEcorr (mV)EbEcp
(mV)
EbEcorr
(mV)
Alpowder-VAR−649 ± 11−711 ± 18−578 ± 13−62 ± 771 ± 2
Al1050-VAR−661 ± 19−701 ± 3−585 ± 14−40 ± 1676 ± 5
Al1050 cast−682 ± 36−726 ± 12−628 ± 42−44 ± 2454 ± 6
Al1050-H14−657 ± 4−754 ± 19−634 ± 15−97 ± 1523 ± 11
Al-7 Co−826 ± 36−655 ± 17−647 ± 12−772 ± 12171 ± 1954 ± 2498 ± 0179 ± 24
Al-10 Co−829 ± 23−641 ± 25−637 ± 25−763 ± 21188 ± 266 ± 2126 ± 4192 ± 2
Al-15 Co−805 ± 23−643 ± 15−640 ± 15−755 ± 23162 ± 850 ± 0115 ± 8165 ± 8
Al-20 Co−822 ± 22−627 ± 18−630 ± 8−763 ± 15195 ± 459 ± 7133 ± 7192 ± 14
Table 4. Data extracted from Tafel extrapolation on the polarization curves of the Al-Co alloys: icorr, corrosion current density; β, the Tafel slope; α, constant in Tafel equation; r2, regression coefficient of the linear fit; ΔE, overpotential range for the linear fit; Δi, current density range for the linear fit; index c, cathodic polarization curves. Additionally, ip, current density in the middle of current limiting stage 2.
Alloy (wt.% Co)icorr (mA/cm2)βc (mV/decade)αc (mV)rc2ΔE (mV vs. Ag/AgCl)Δi (mA/cm2)ip (mA/cm2)
Al-7 Co0.03 ± 0.01−140 ± 4−1022 ± 130.992 ± 0.003(−1021) − (−884)0.09 − 0.970.04 ± 0.01
Al-10 Co0.06 ± 0.02−153 ± 11−1012 ± 110.987 ± 0.003(−1045) − (−892)0.14 − 1.640.08 ± 0.02
Al-15 Co0.07 ± 0.02−163 ± 9−995 ± 110.986 ± 0.003(−1032) − (−869)0.15 − 1.50.09 ± 0.03
Al-20 Co0.09 ± 0.02−175 ± 5−004 ± 250.984 ± 0.001(−1065) − (−895)0.15 − 1.540.12 ± 0.03
Table 5. Free energies of formation of compounds possibly included in the corrosion products of the Al-Co alloys [54,55,56].
CompoundΔGof, 298 (kJ/mol)
α-Al2O3−1582
γ-Al2O3−1563
α-Al(OH)3 (bayerite)−1153
γ-Al(OH)3 (gibbsite)−1155
α-AlOOH (diaspore)−923
γ-AlOOH (boehmite)−918
Co3O4−775
Co(OH)2−450
CoOOH−386
CoO−214
Table 6. Raman band wavenumbers and oxide/hydroxide/oxyhydroxide assignments for the surface films of the Al-Co alloys after cyclic polarization, in 3.5 wt.% NaCl, at 25 °C.
CompoundRaman Wavenumbers (cm−1)
Al-Oγ(OH)δ(OH)Ref.
Bayerite
α-Al(OH)3
322–325, 387, 430–432525–527, 532–533, 545–548, 767–771, 817–818, 898–899[69,70,71]
Gibbsite
γ-Al(OH)3
320–321, 369–372, 377–379, 398–400, 410–413539–541, 569–571, 816, 844–845, 893–895924–925[69]
Diaspore
α-AlOOH
331–333, 392–396, 448–452583–587, 654–658, 703–708, 786–790, 809, 836911–913[69]
Boehmite
γ-AlOOH
348–349, 363–365, 499–500636, 669-674, 731-735[69,70,72,73]
EgF2gA1g
CO3O4485–488519–524, 617–622685–689[39,67,74,75,76,77]
CoO463–470508–510672–674[39,75]
CoOOH476–480602–606804–806[75]