
Effect of Finish Rolling Temperature on the Microstructure and Tensile Properties of Nb–Ti Microalloyed X90 Pipeline Steel

Abstract
:1. Introduction
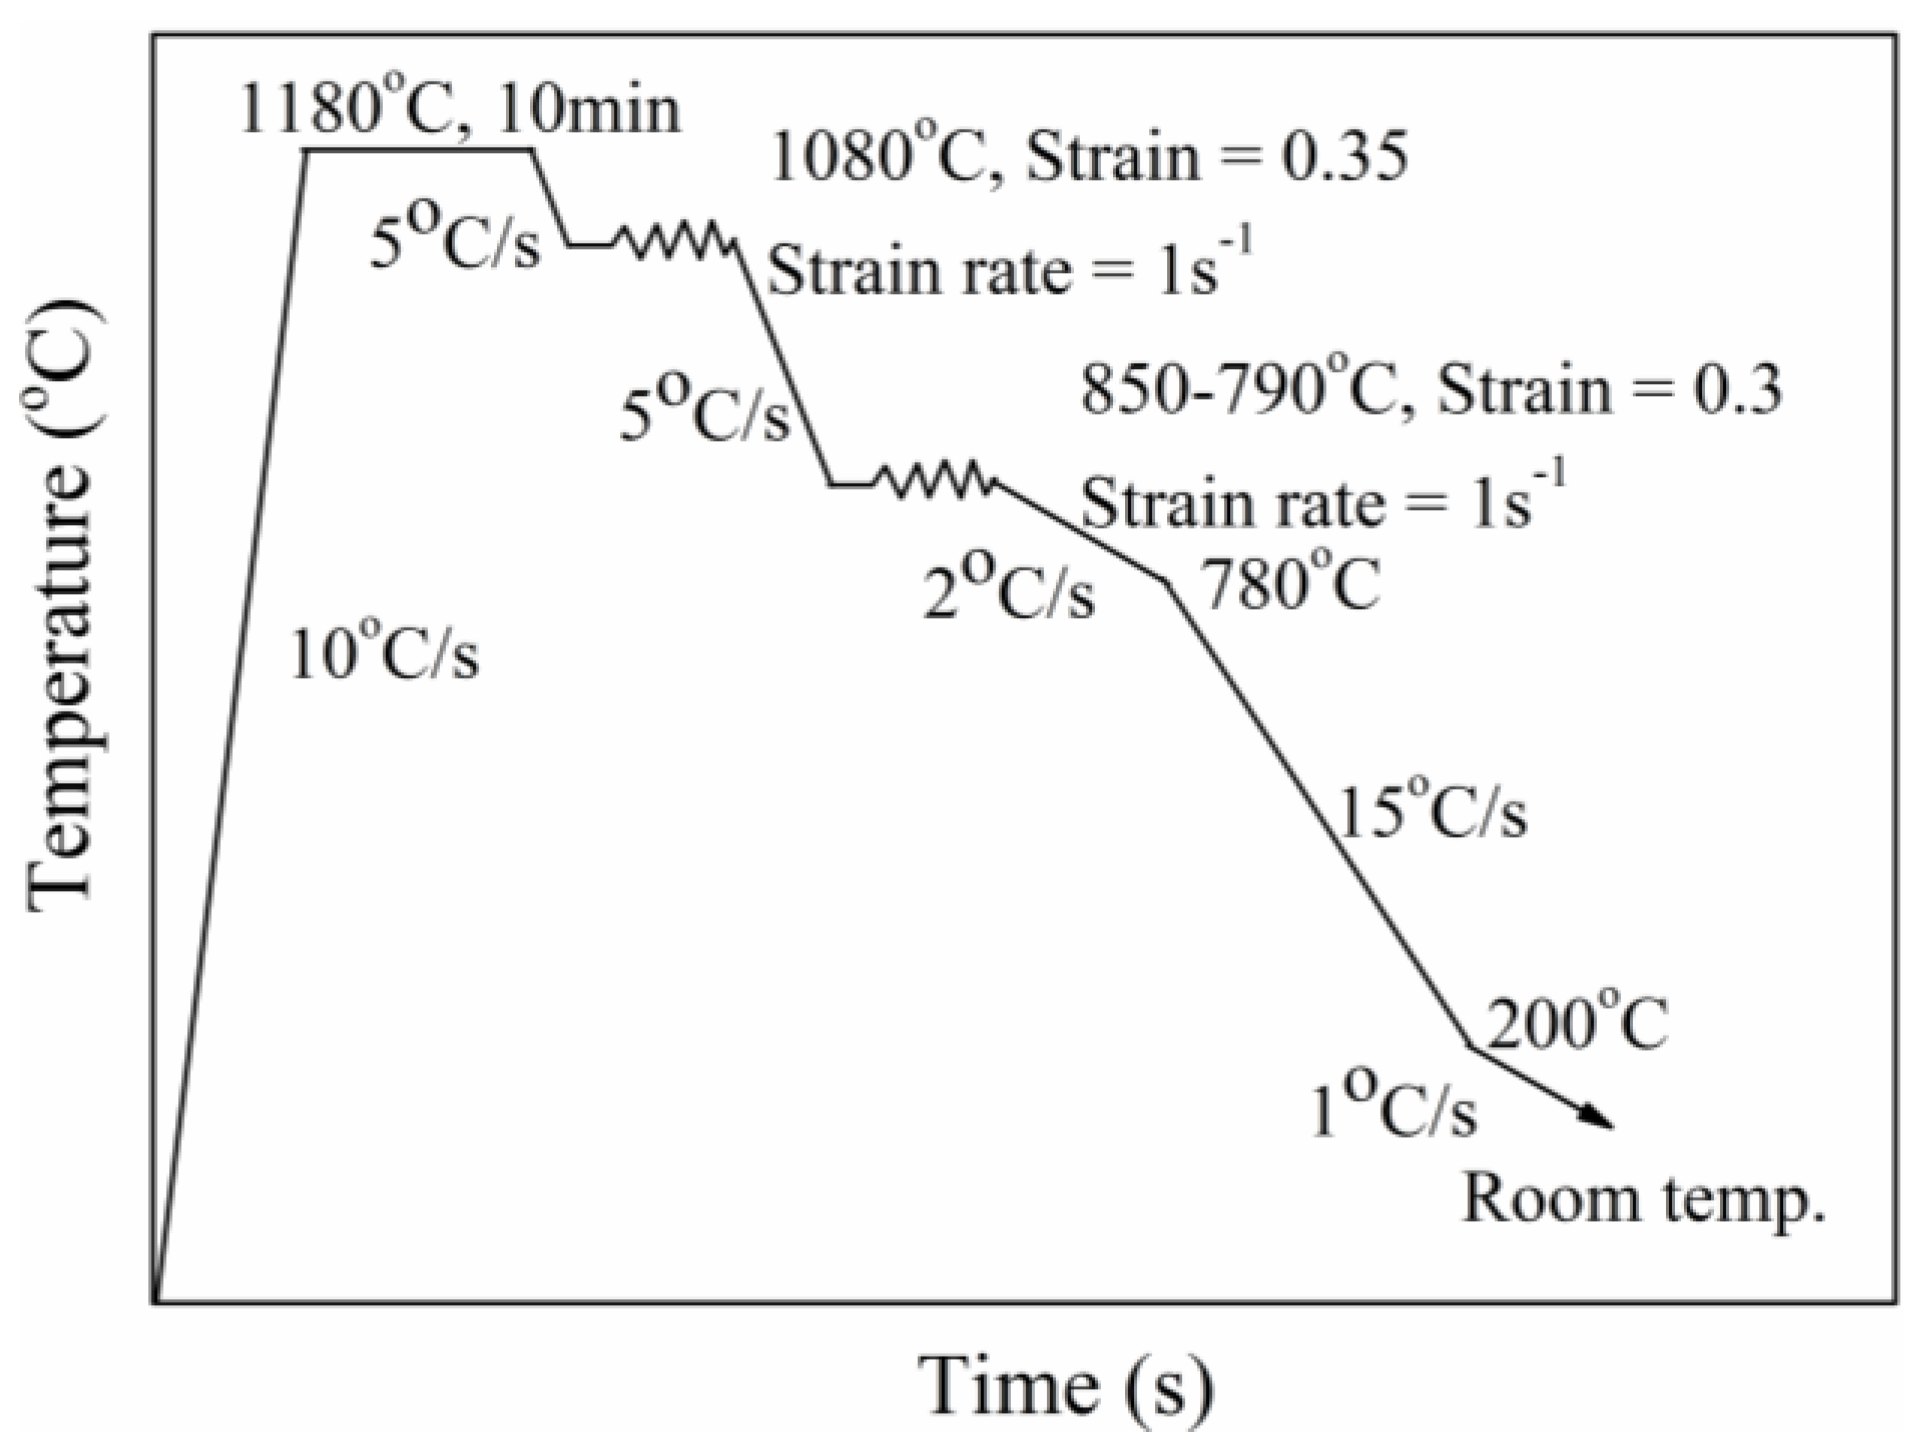
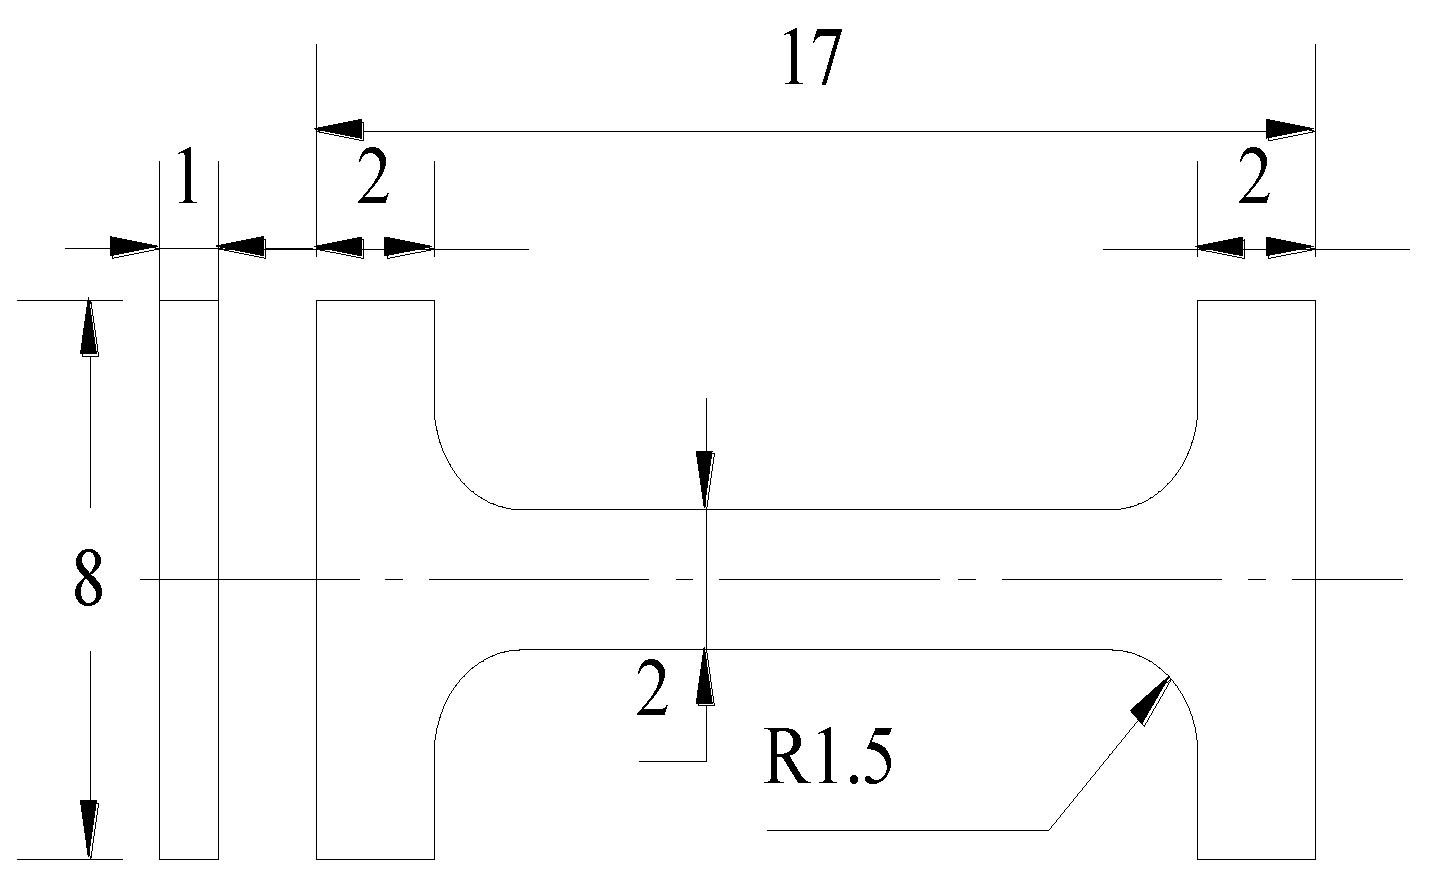
2. Experimental Material and Procedures
3. Experiment Results
3.1. Tensile Properties
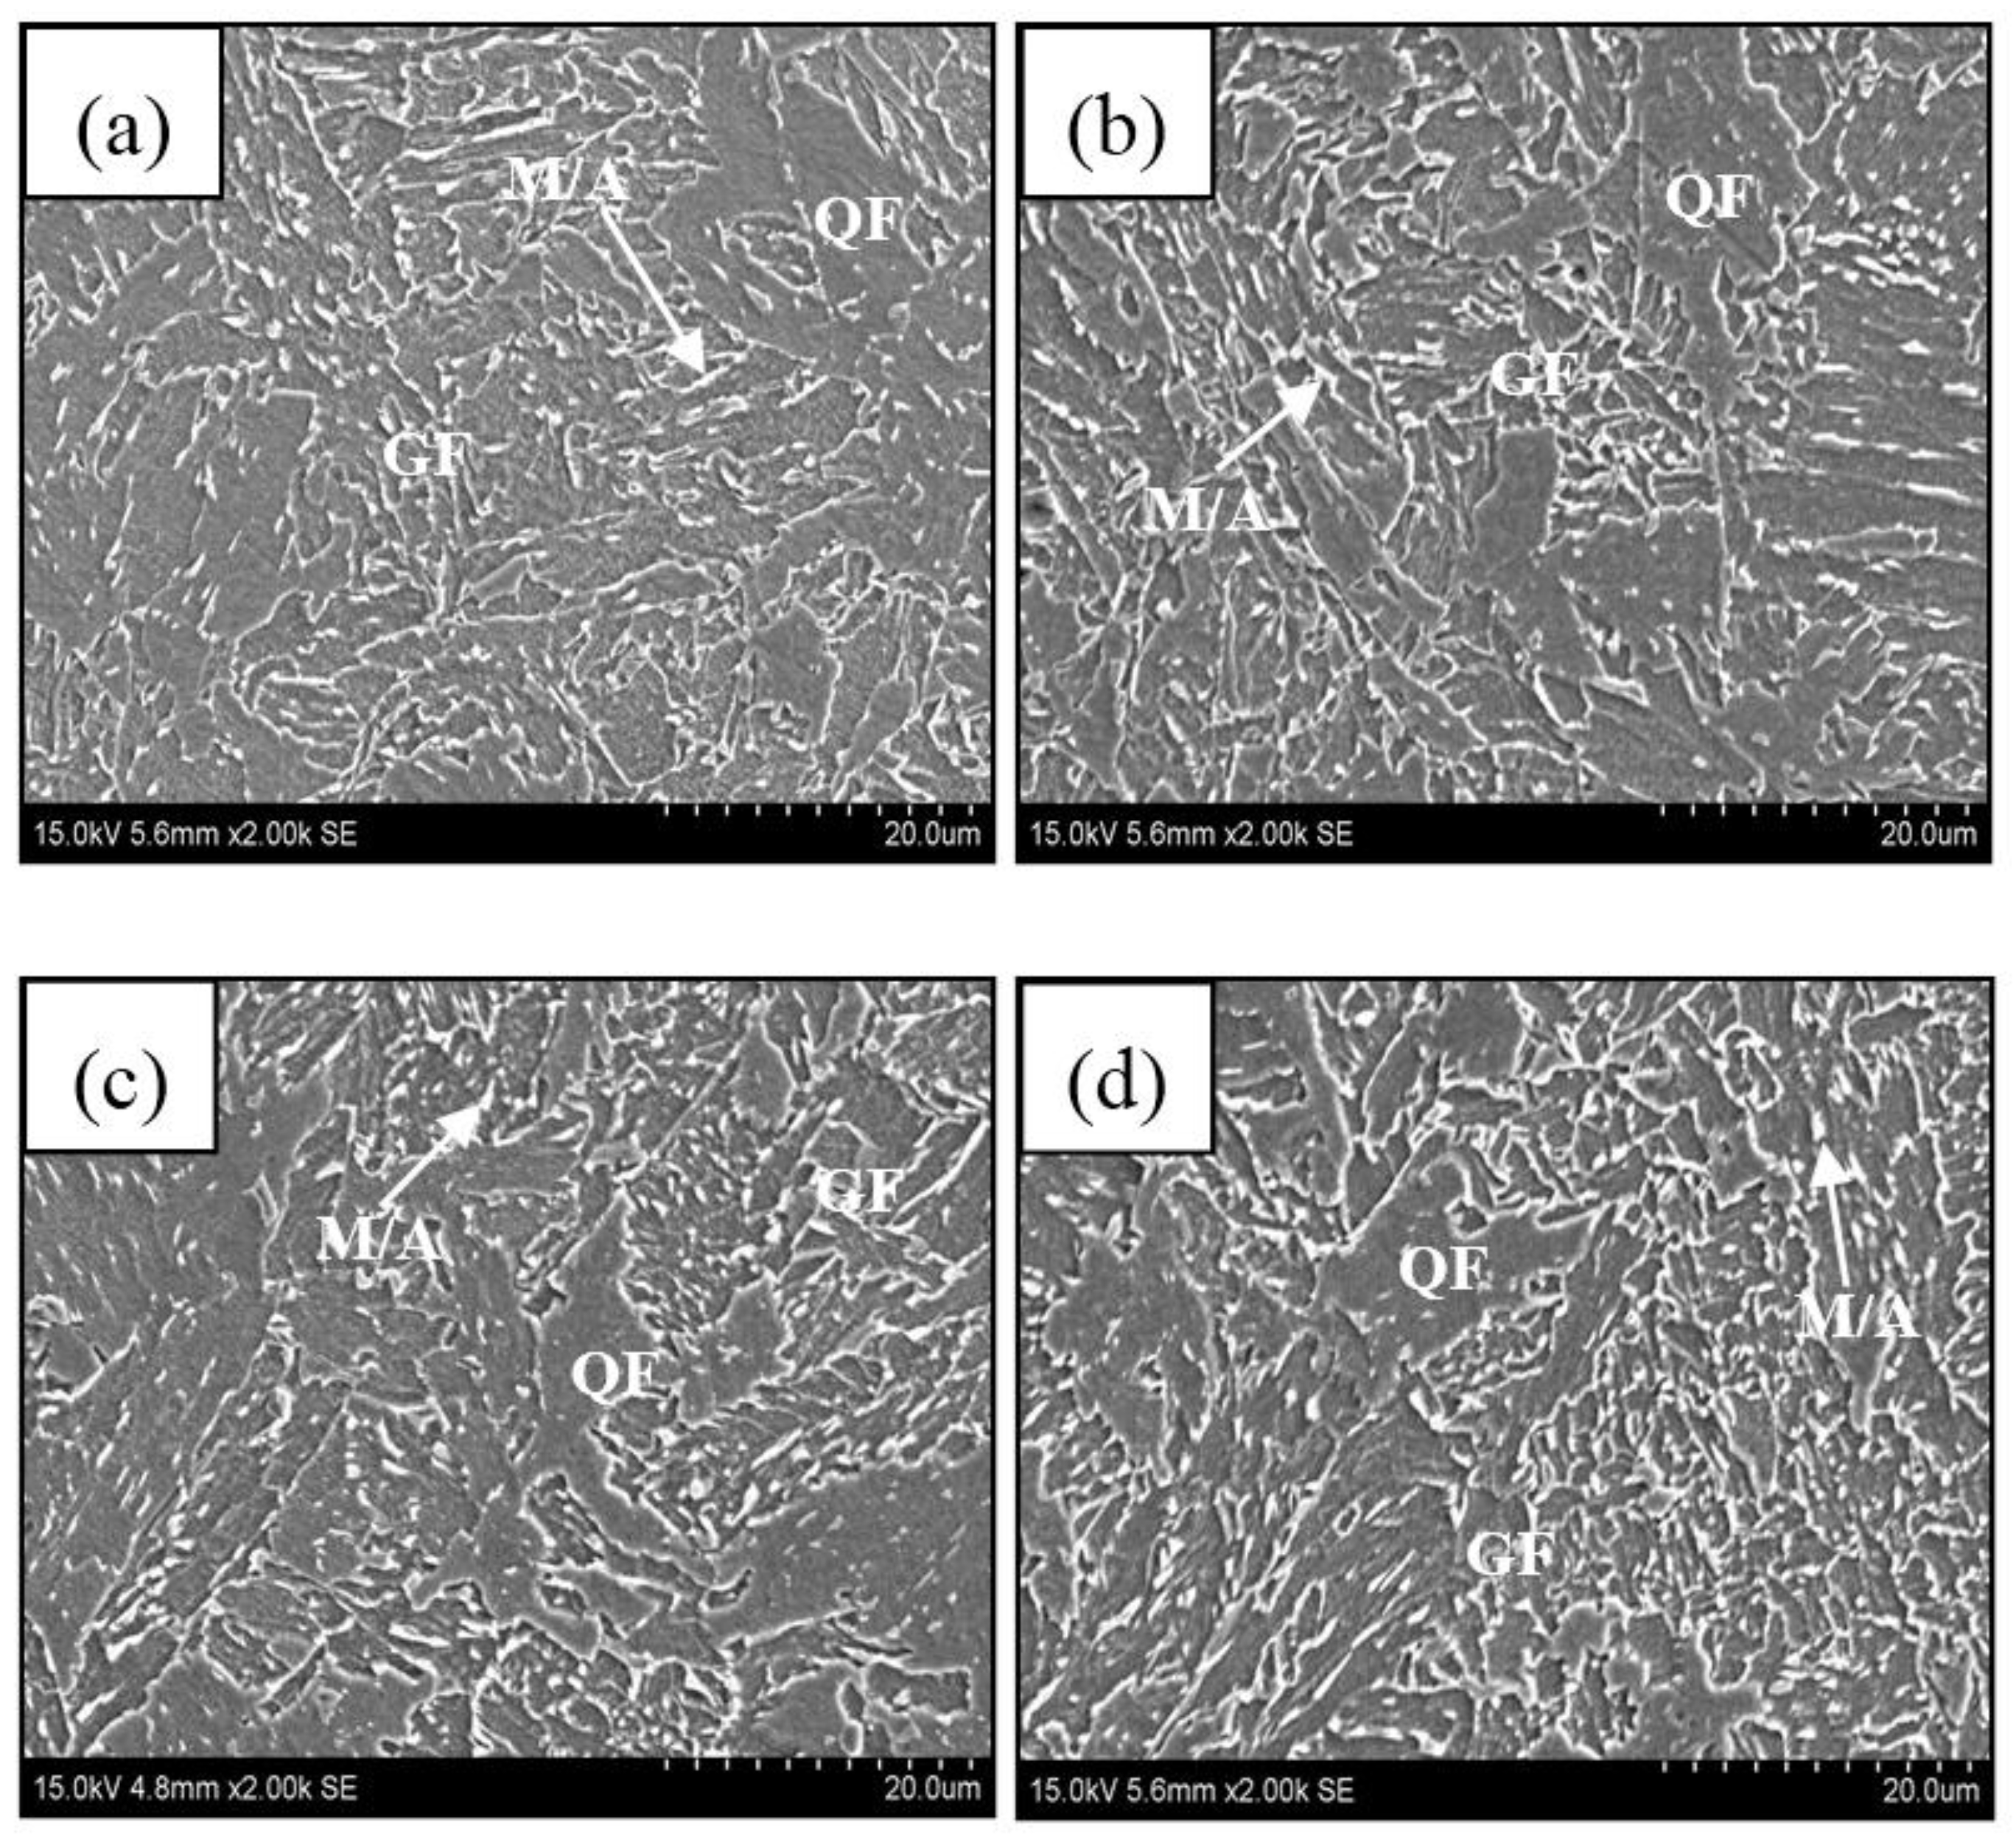
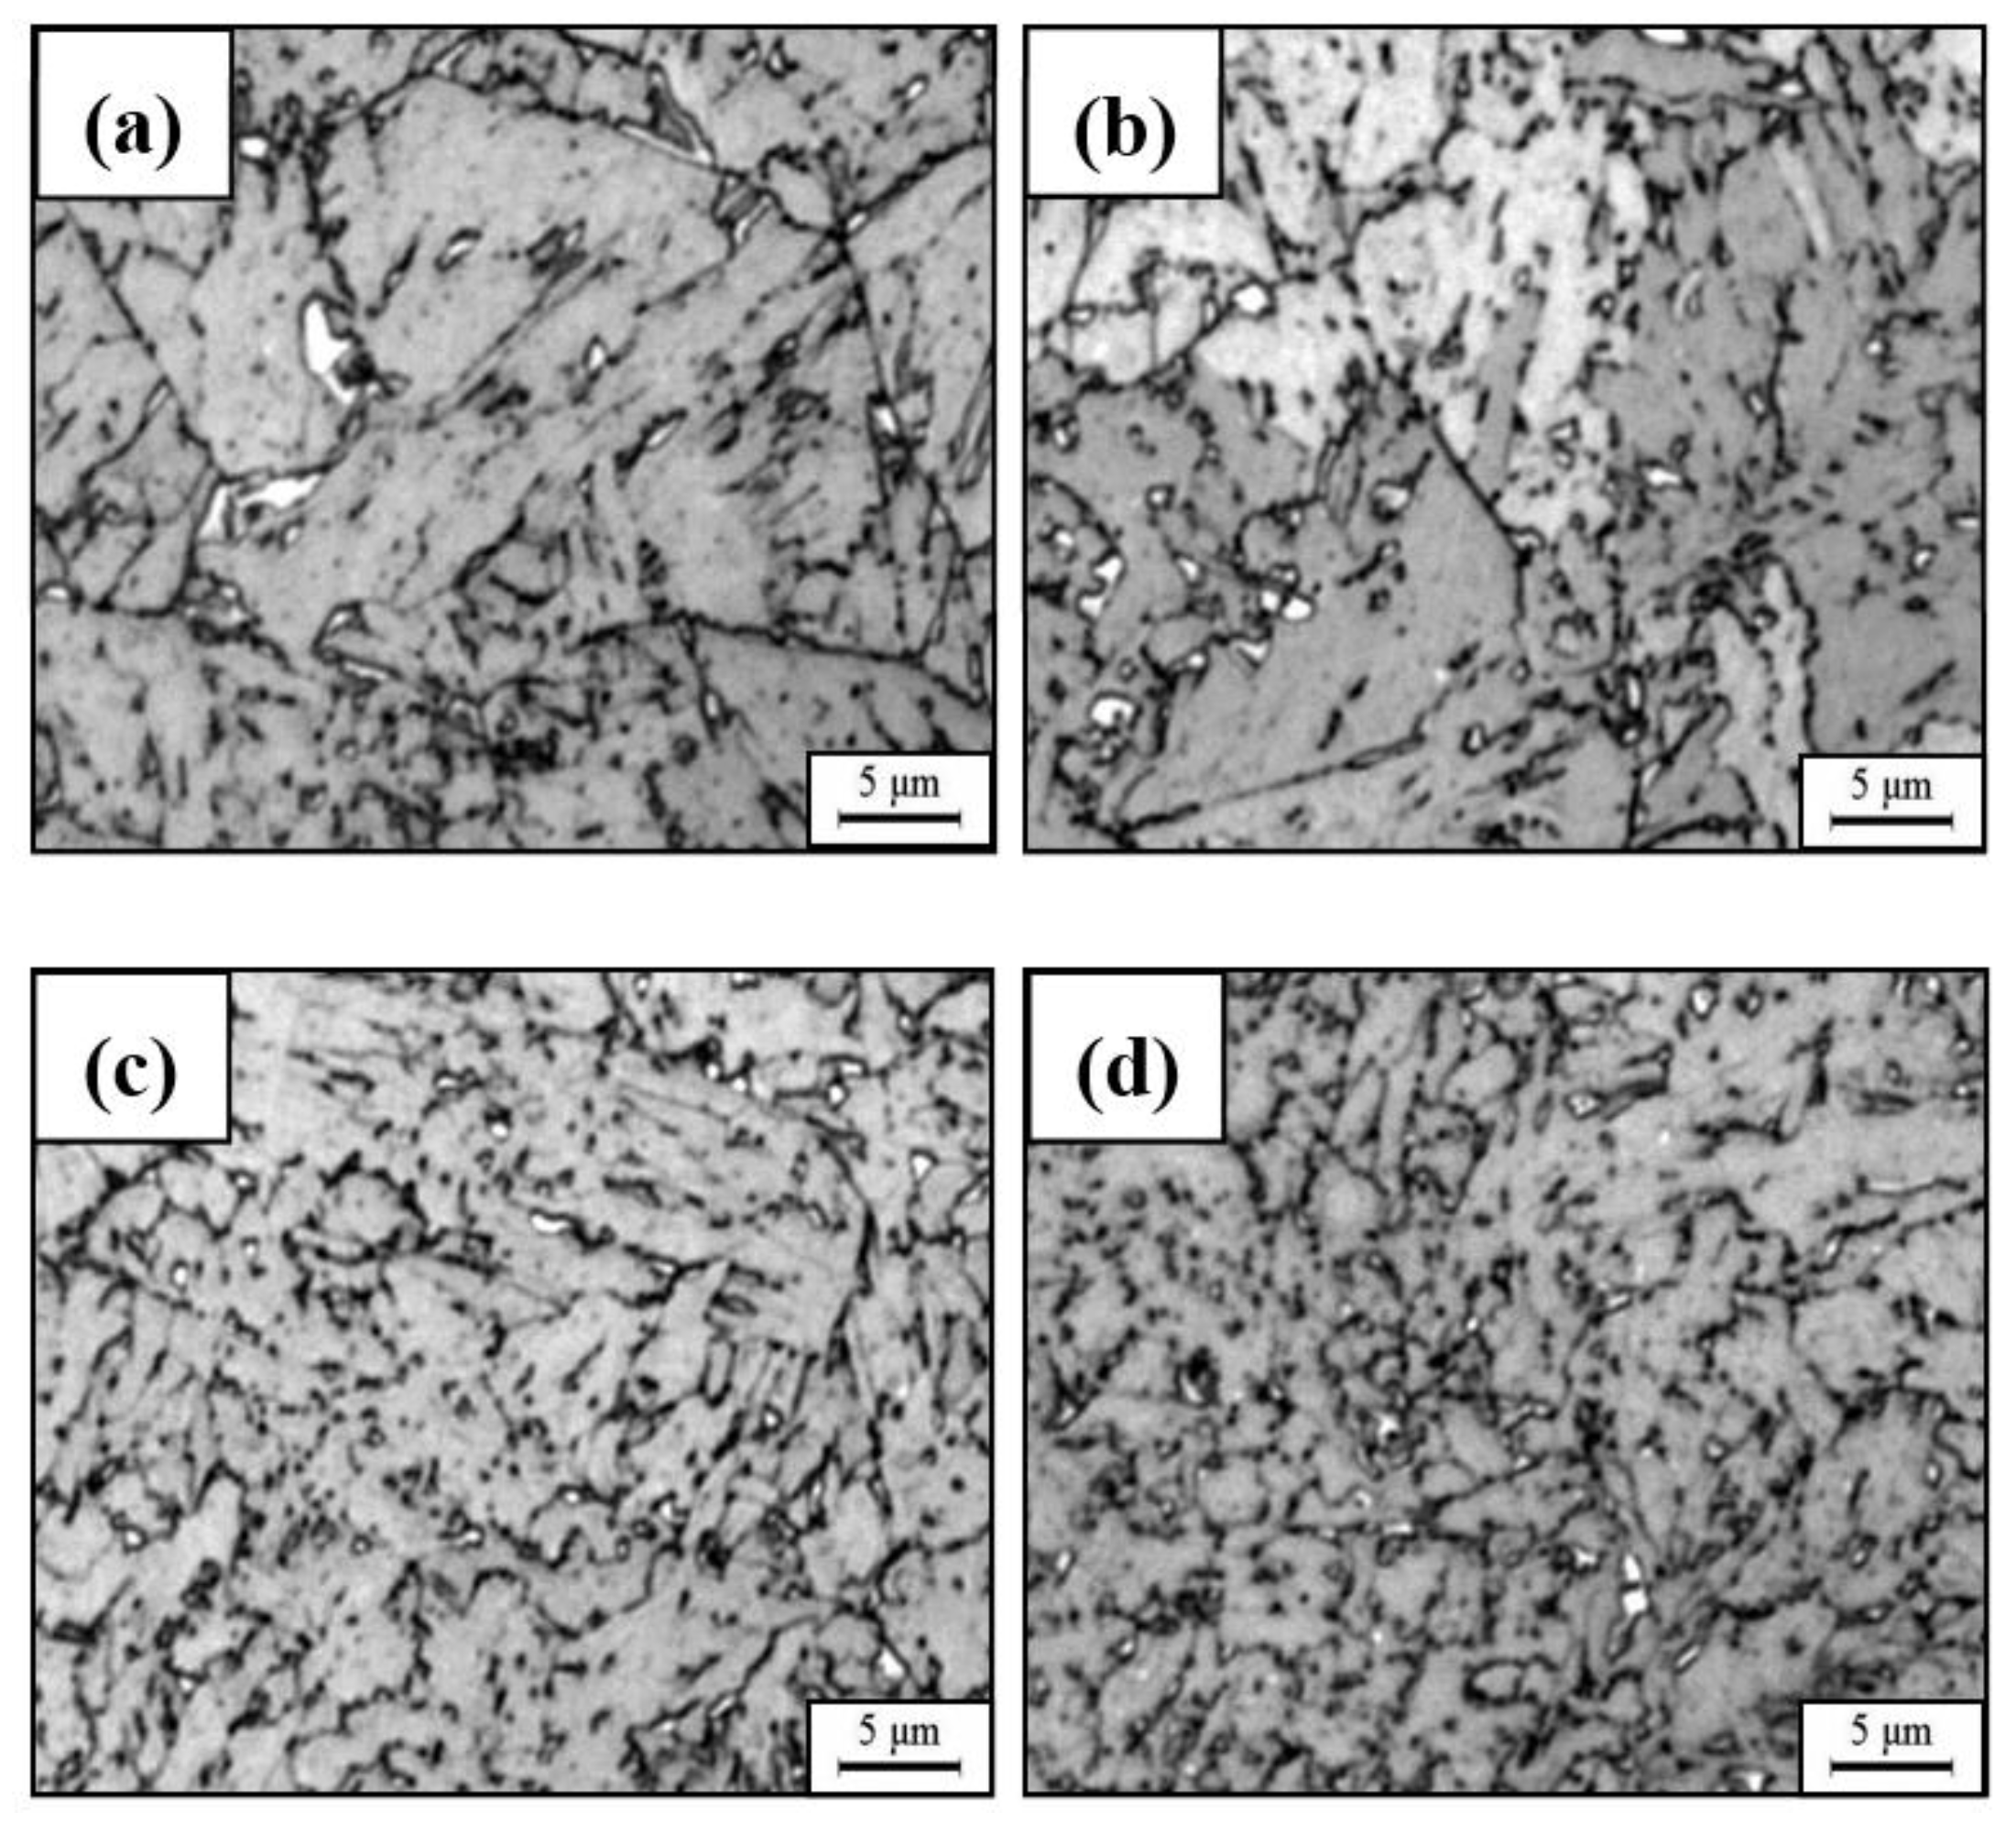
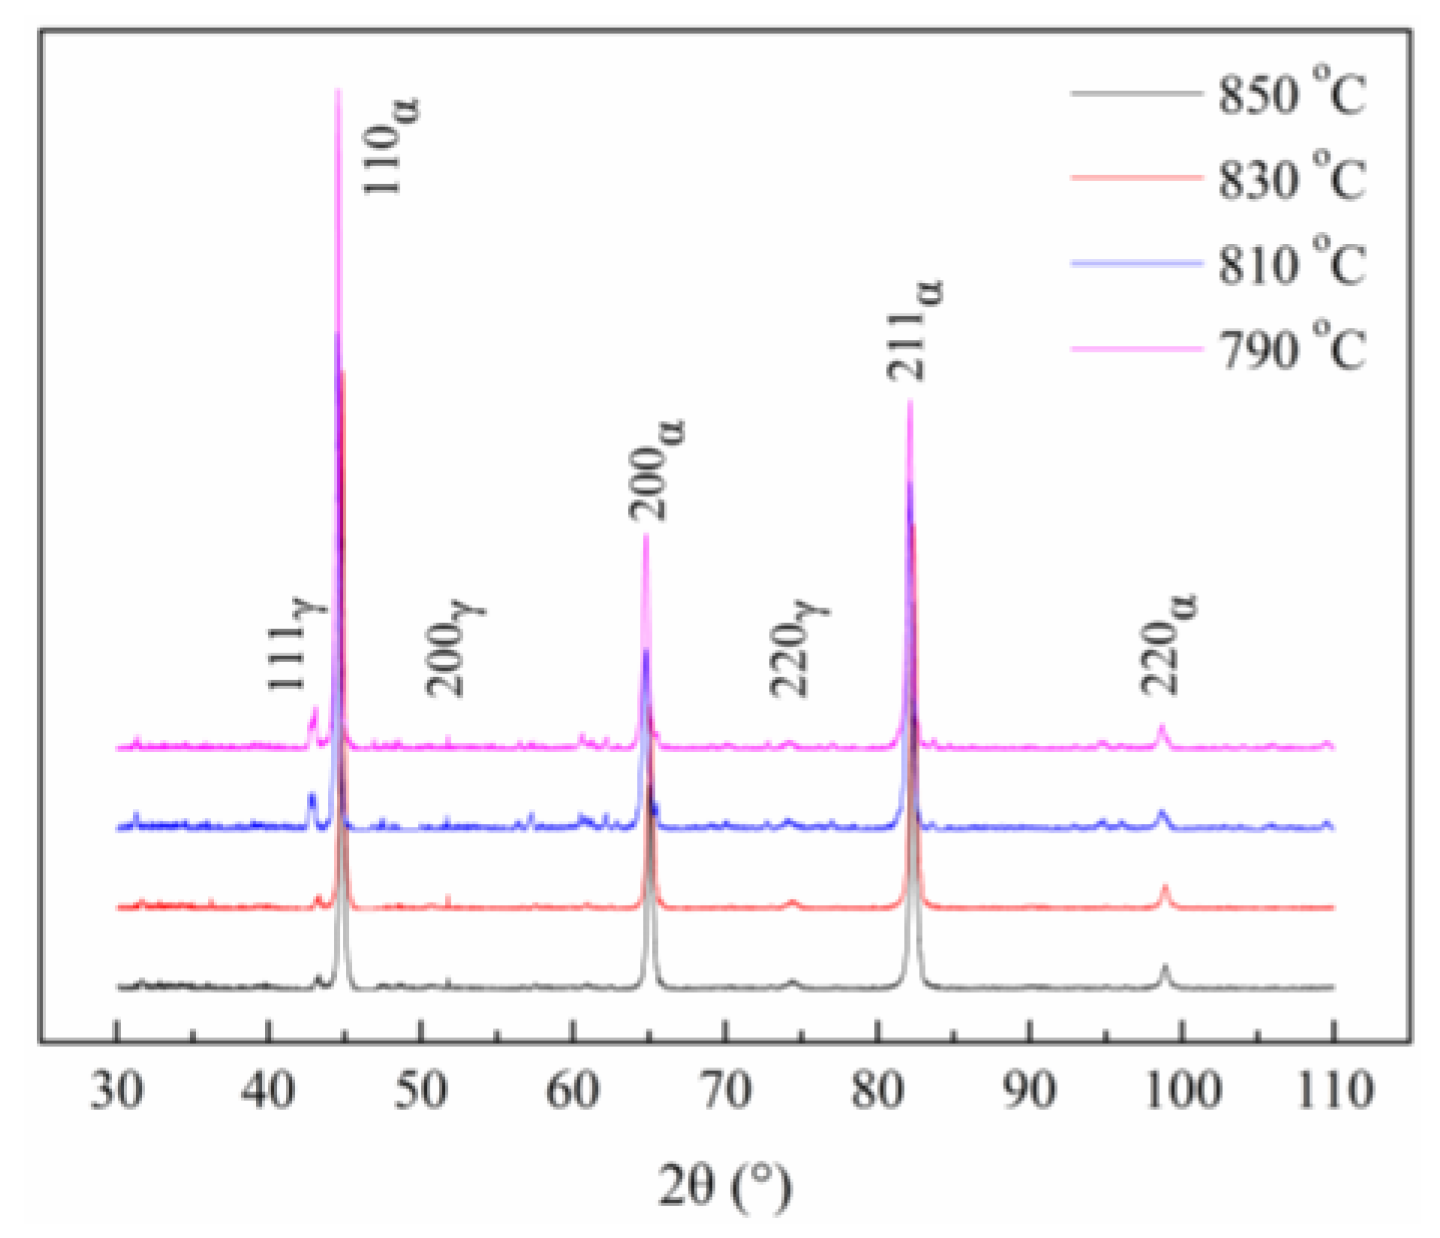
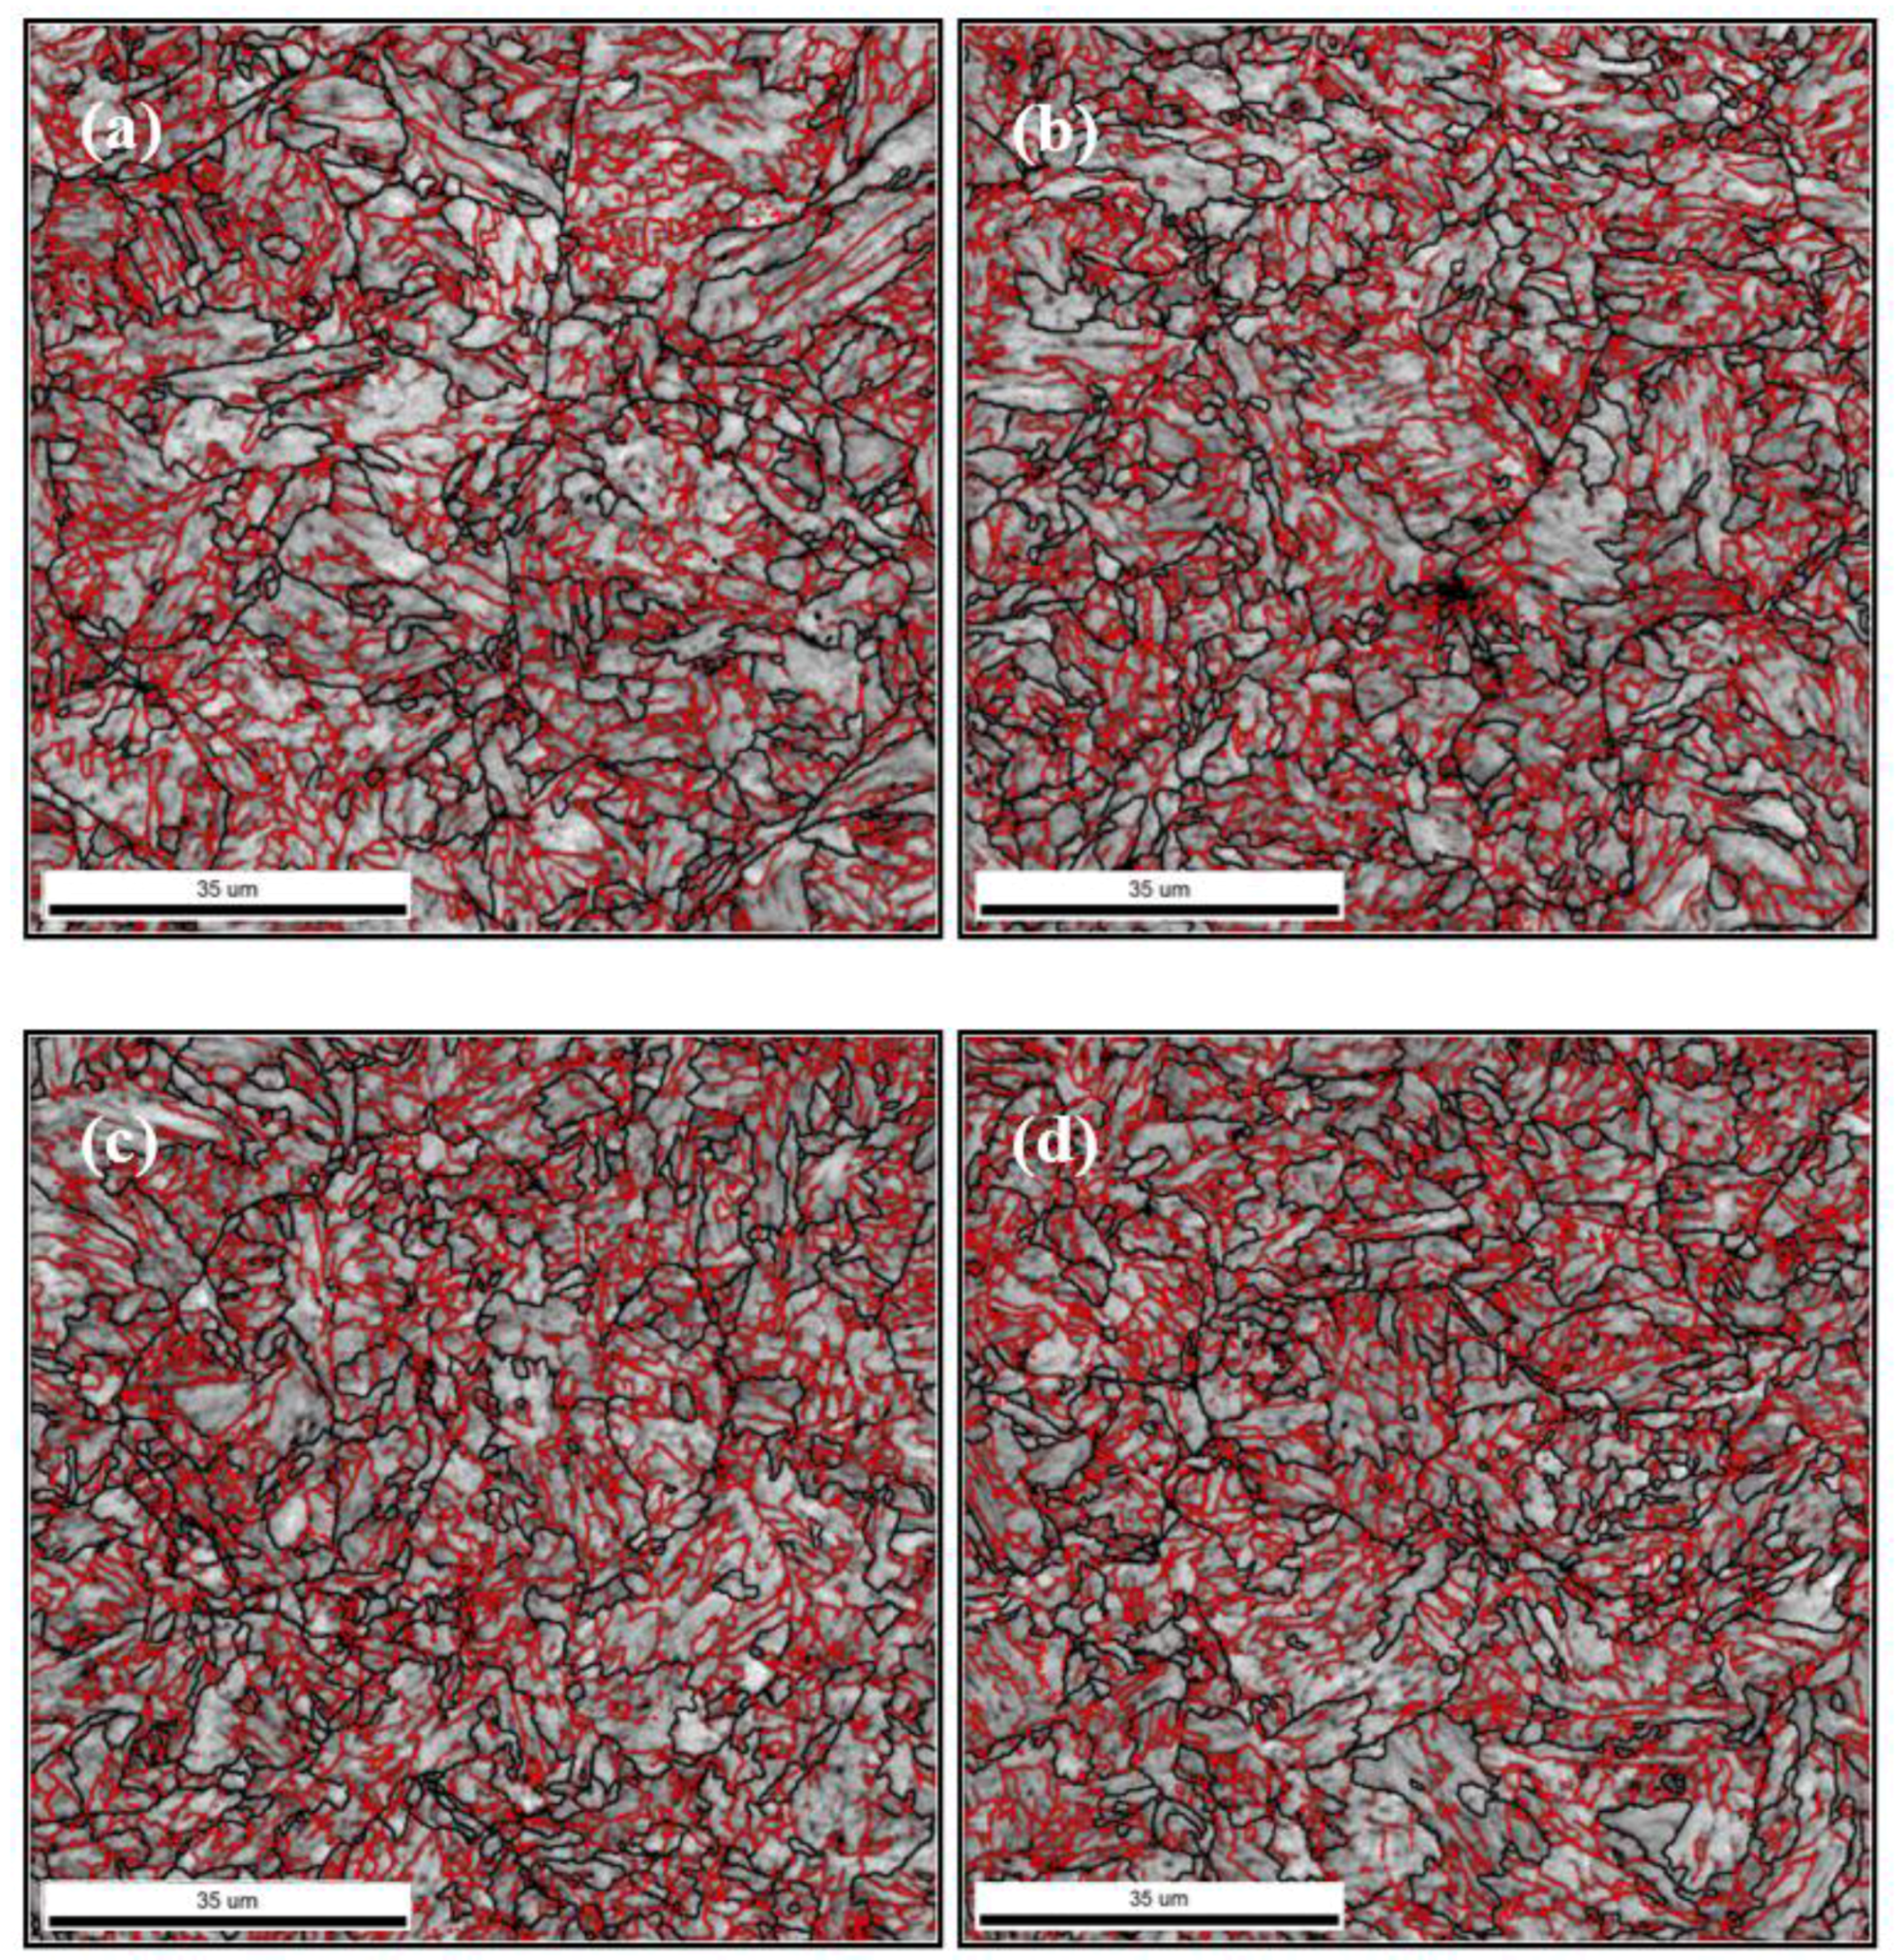
3.2. Microstructure
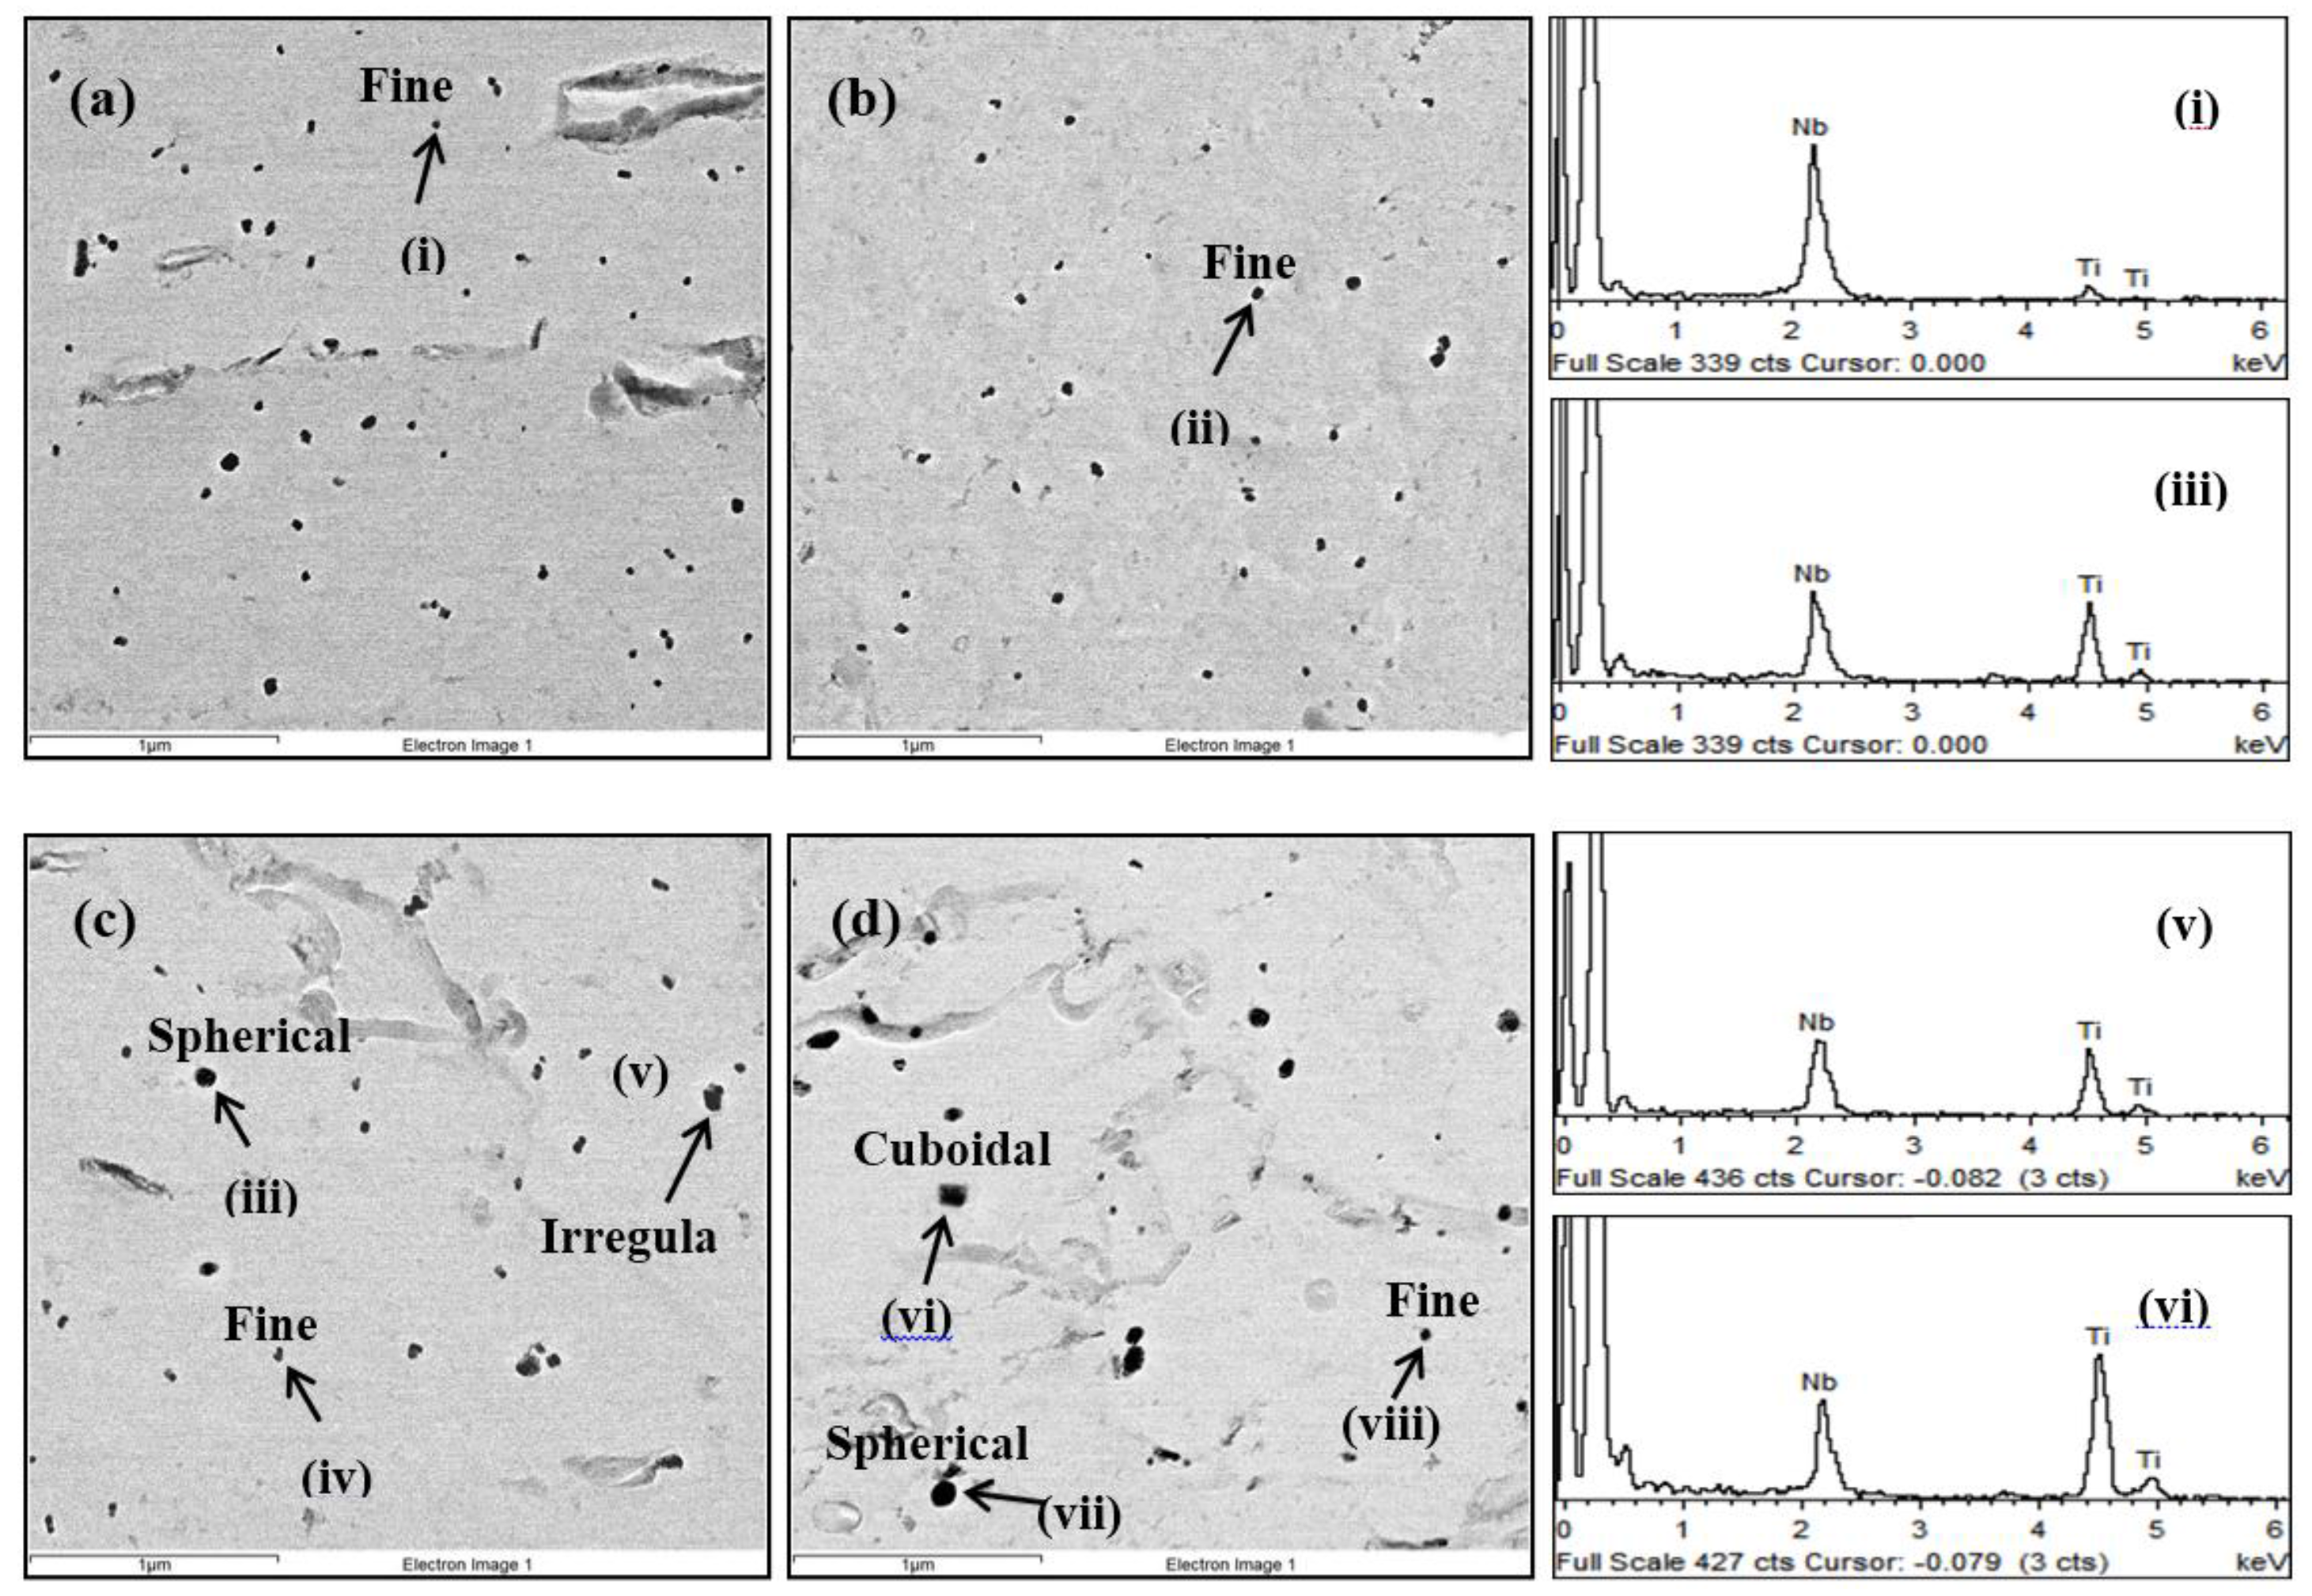
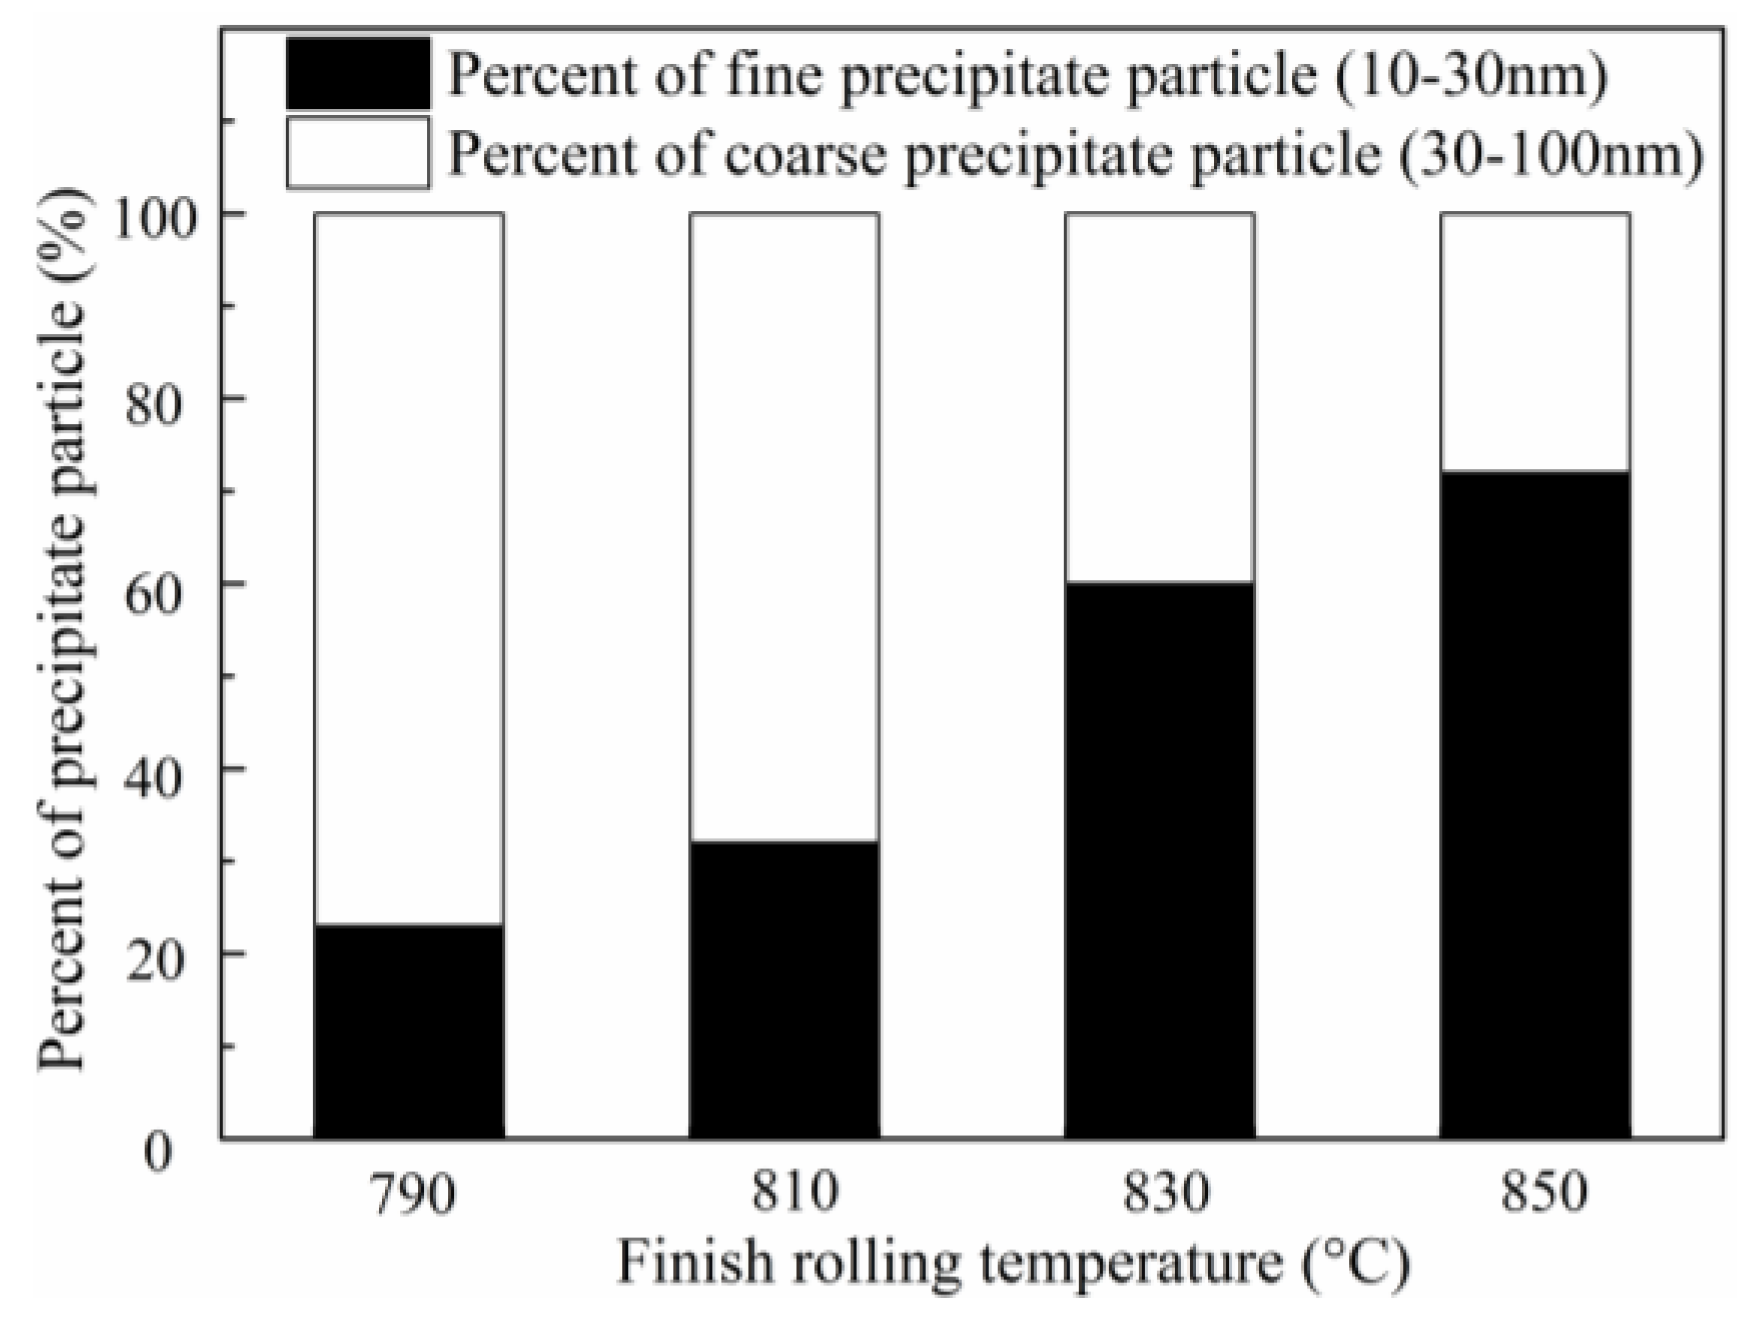
3.3. Precipitation
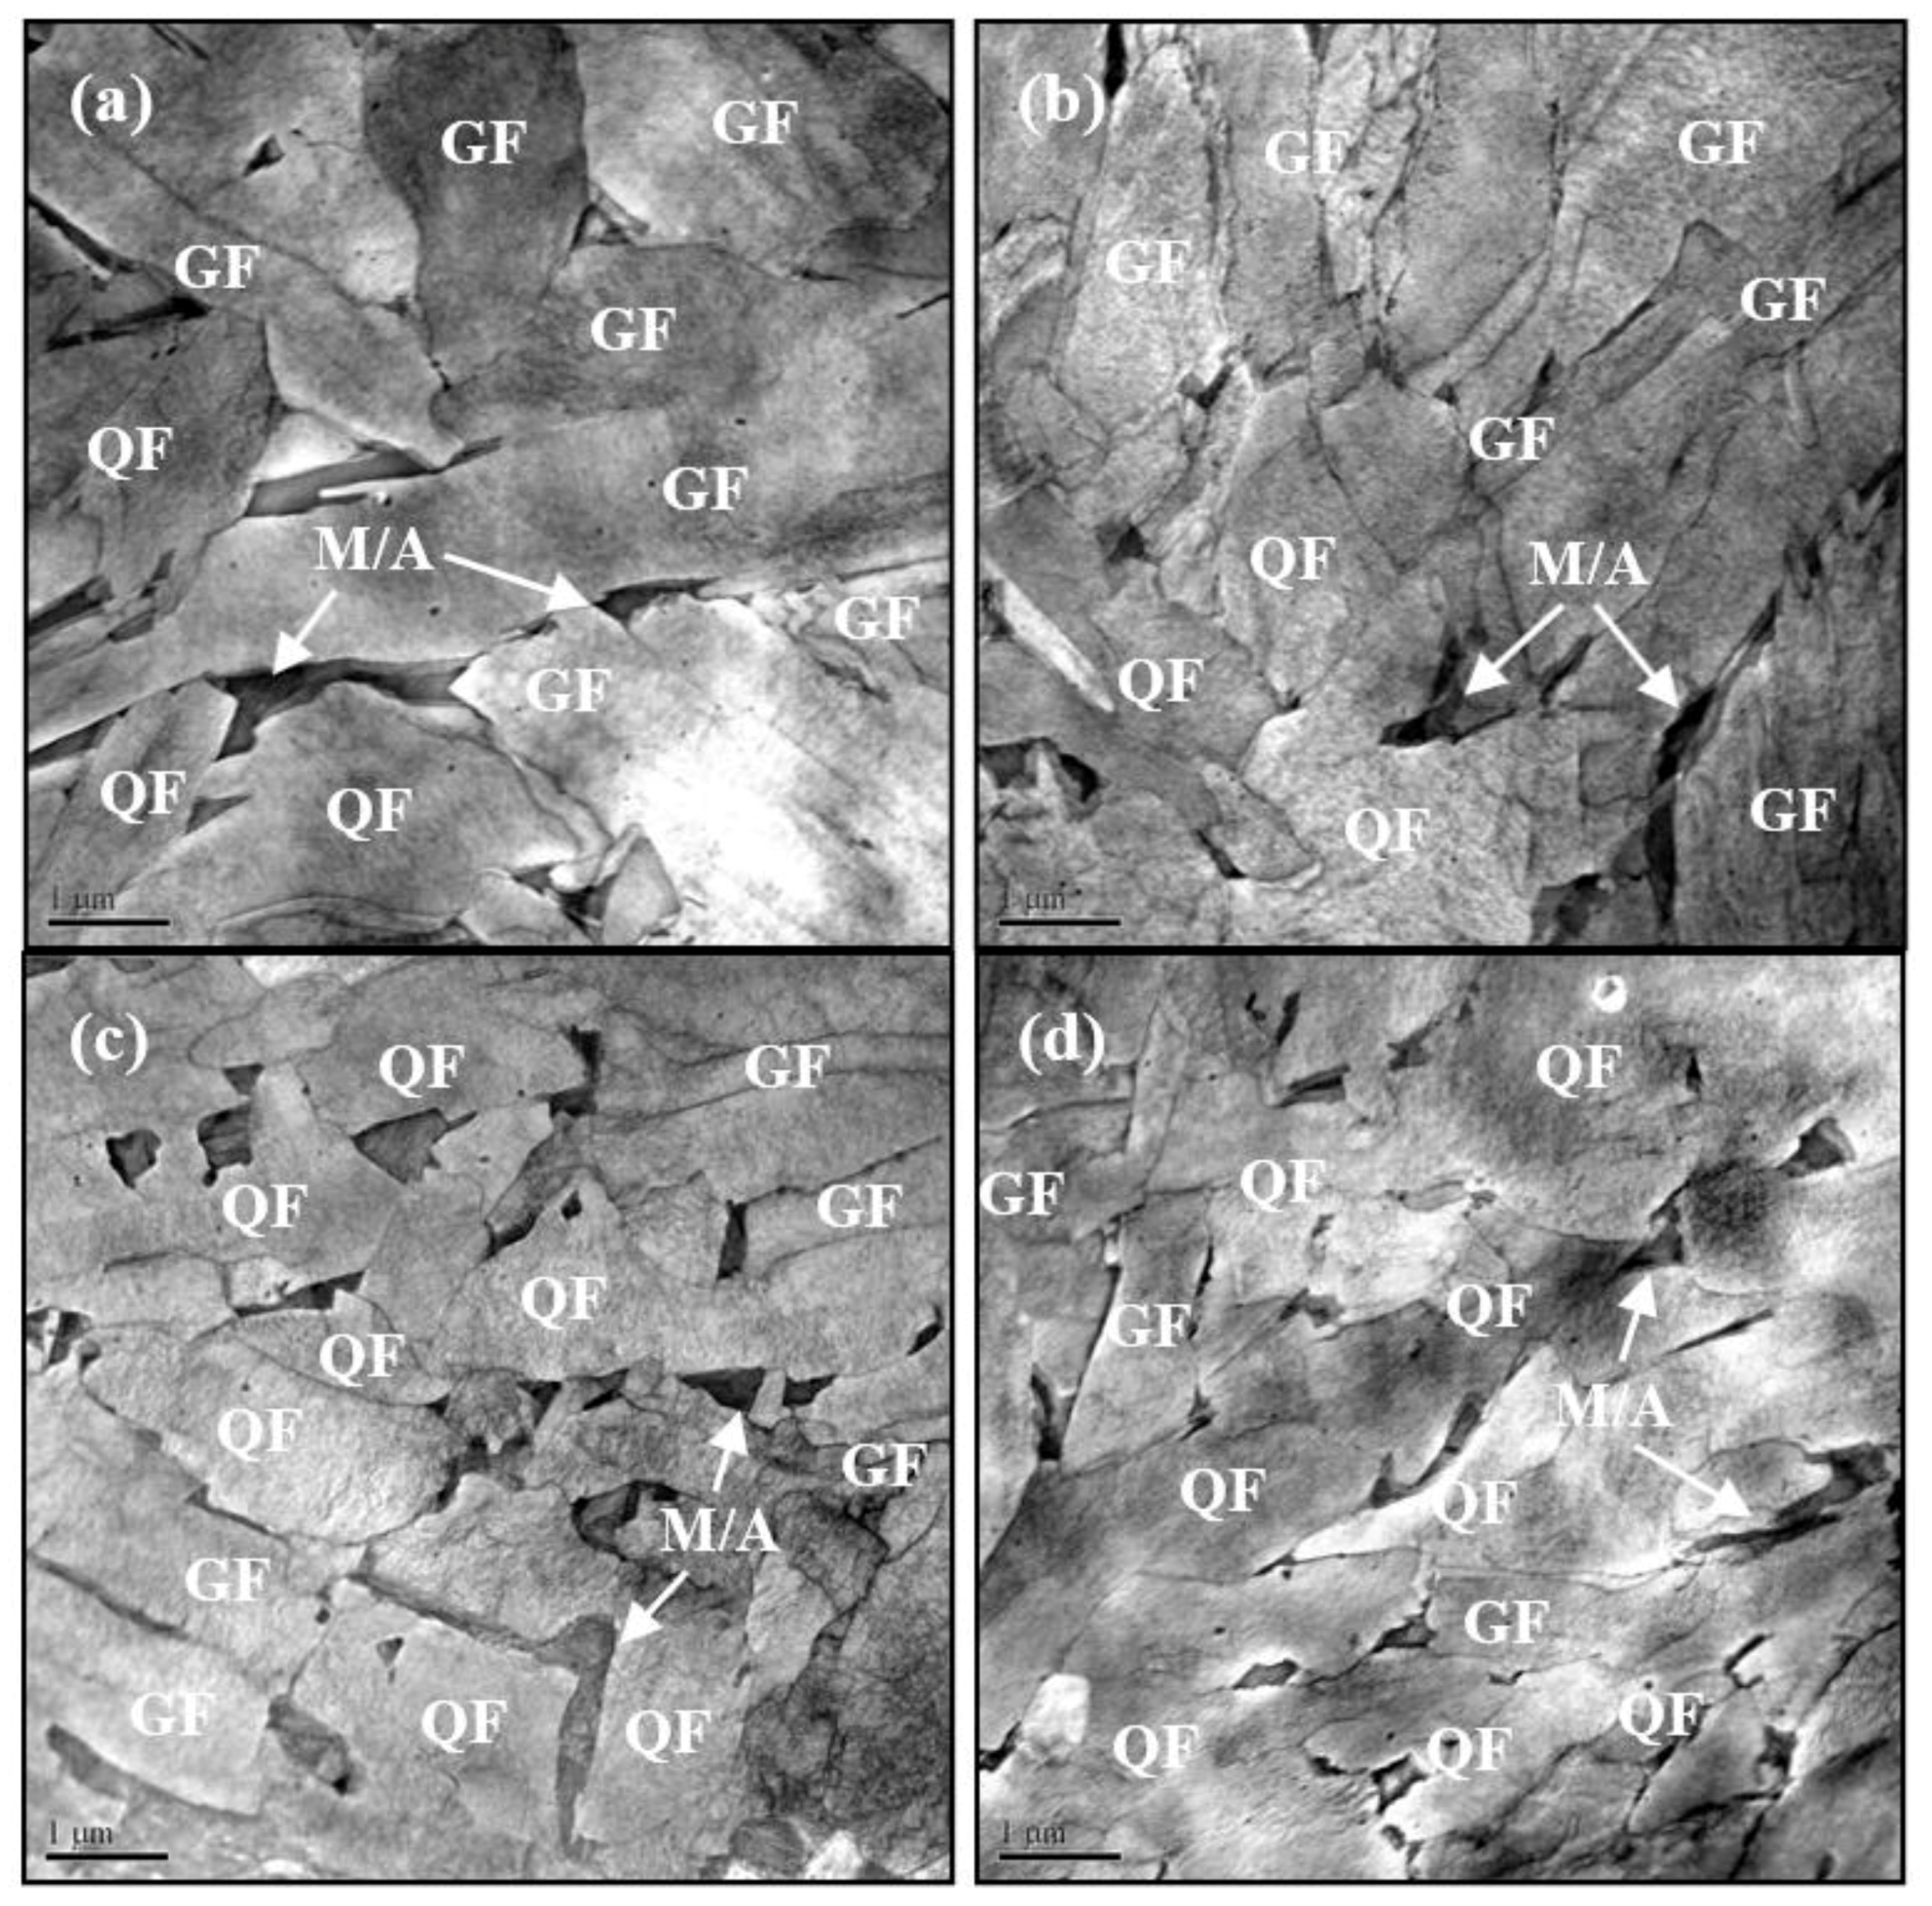
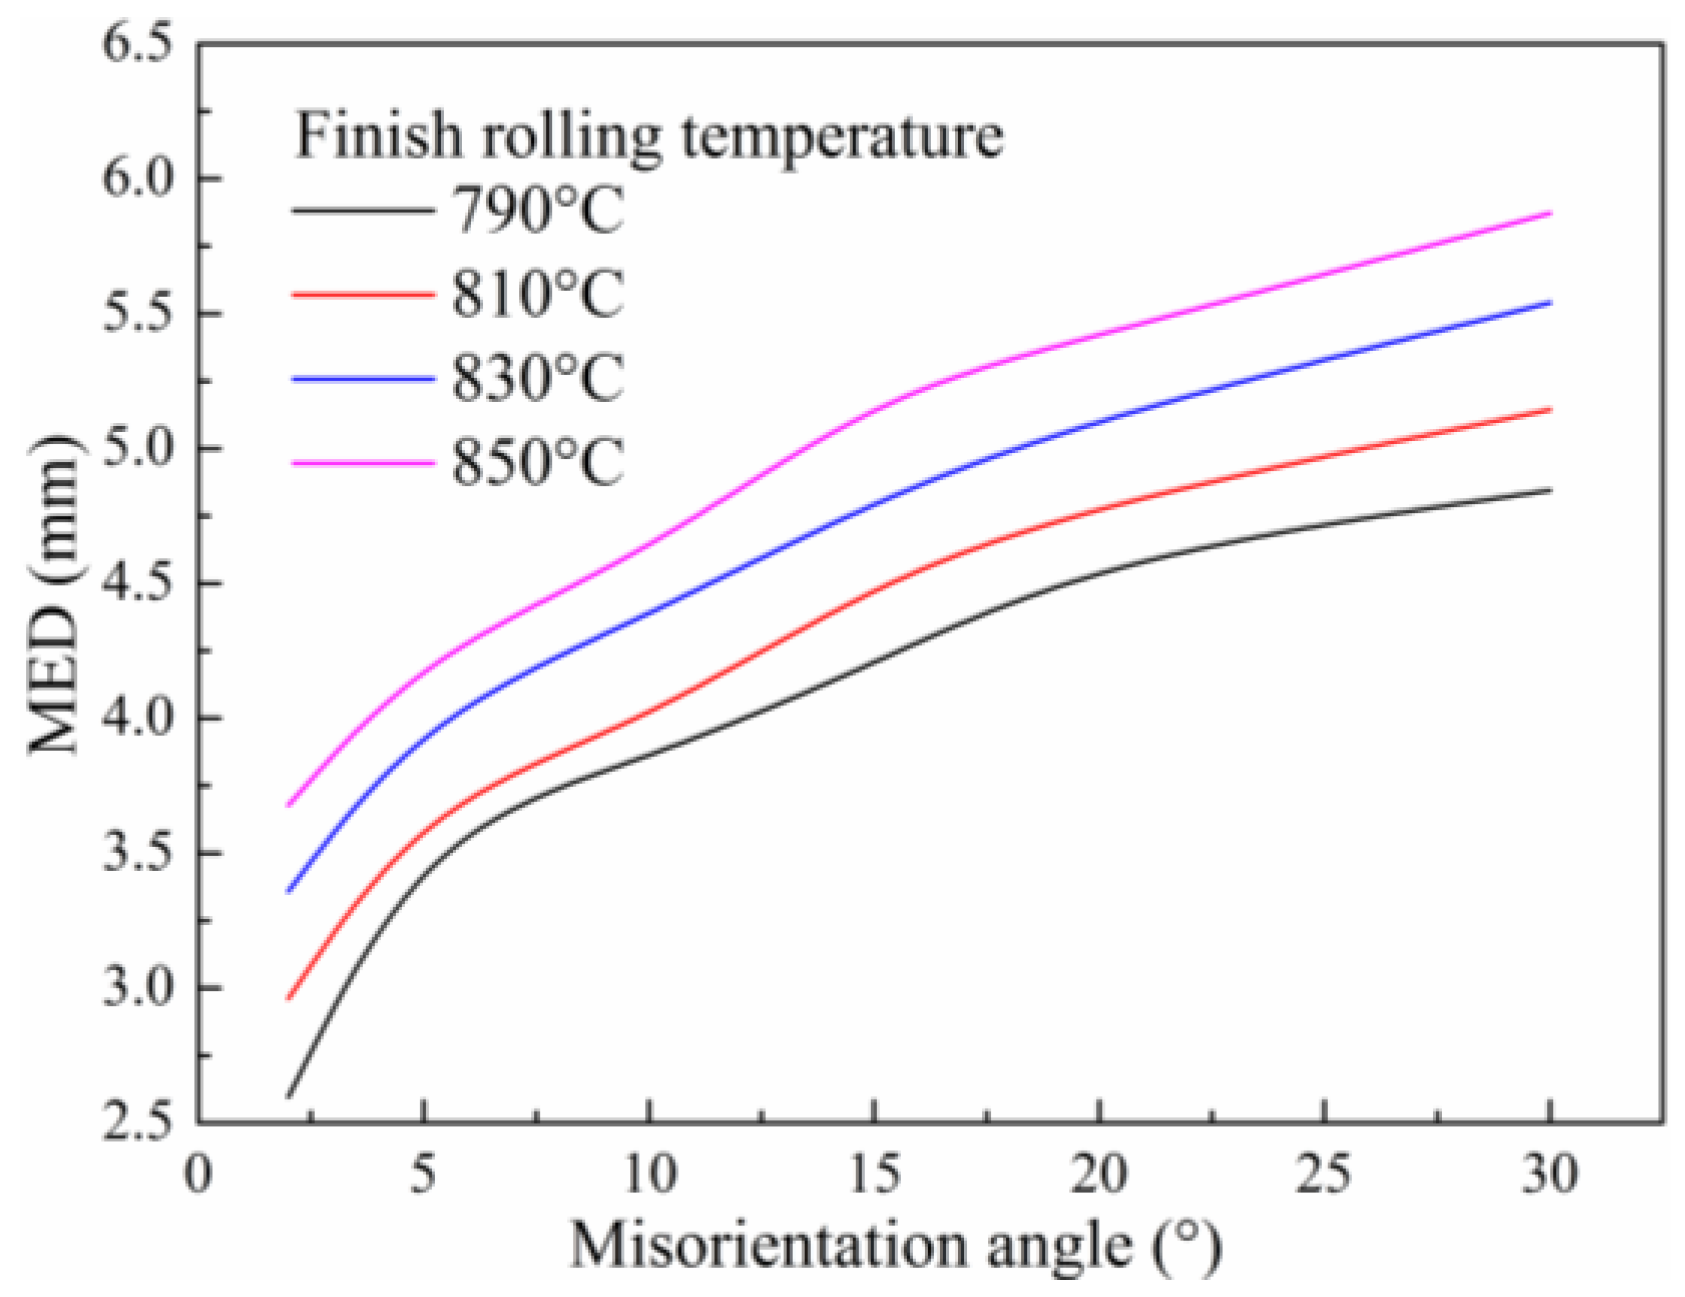
3.4. Dislocations
4. Discussion
4.1. Effect of Finish Rolling Temperature on Microstructure Evolution
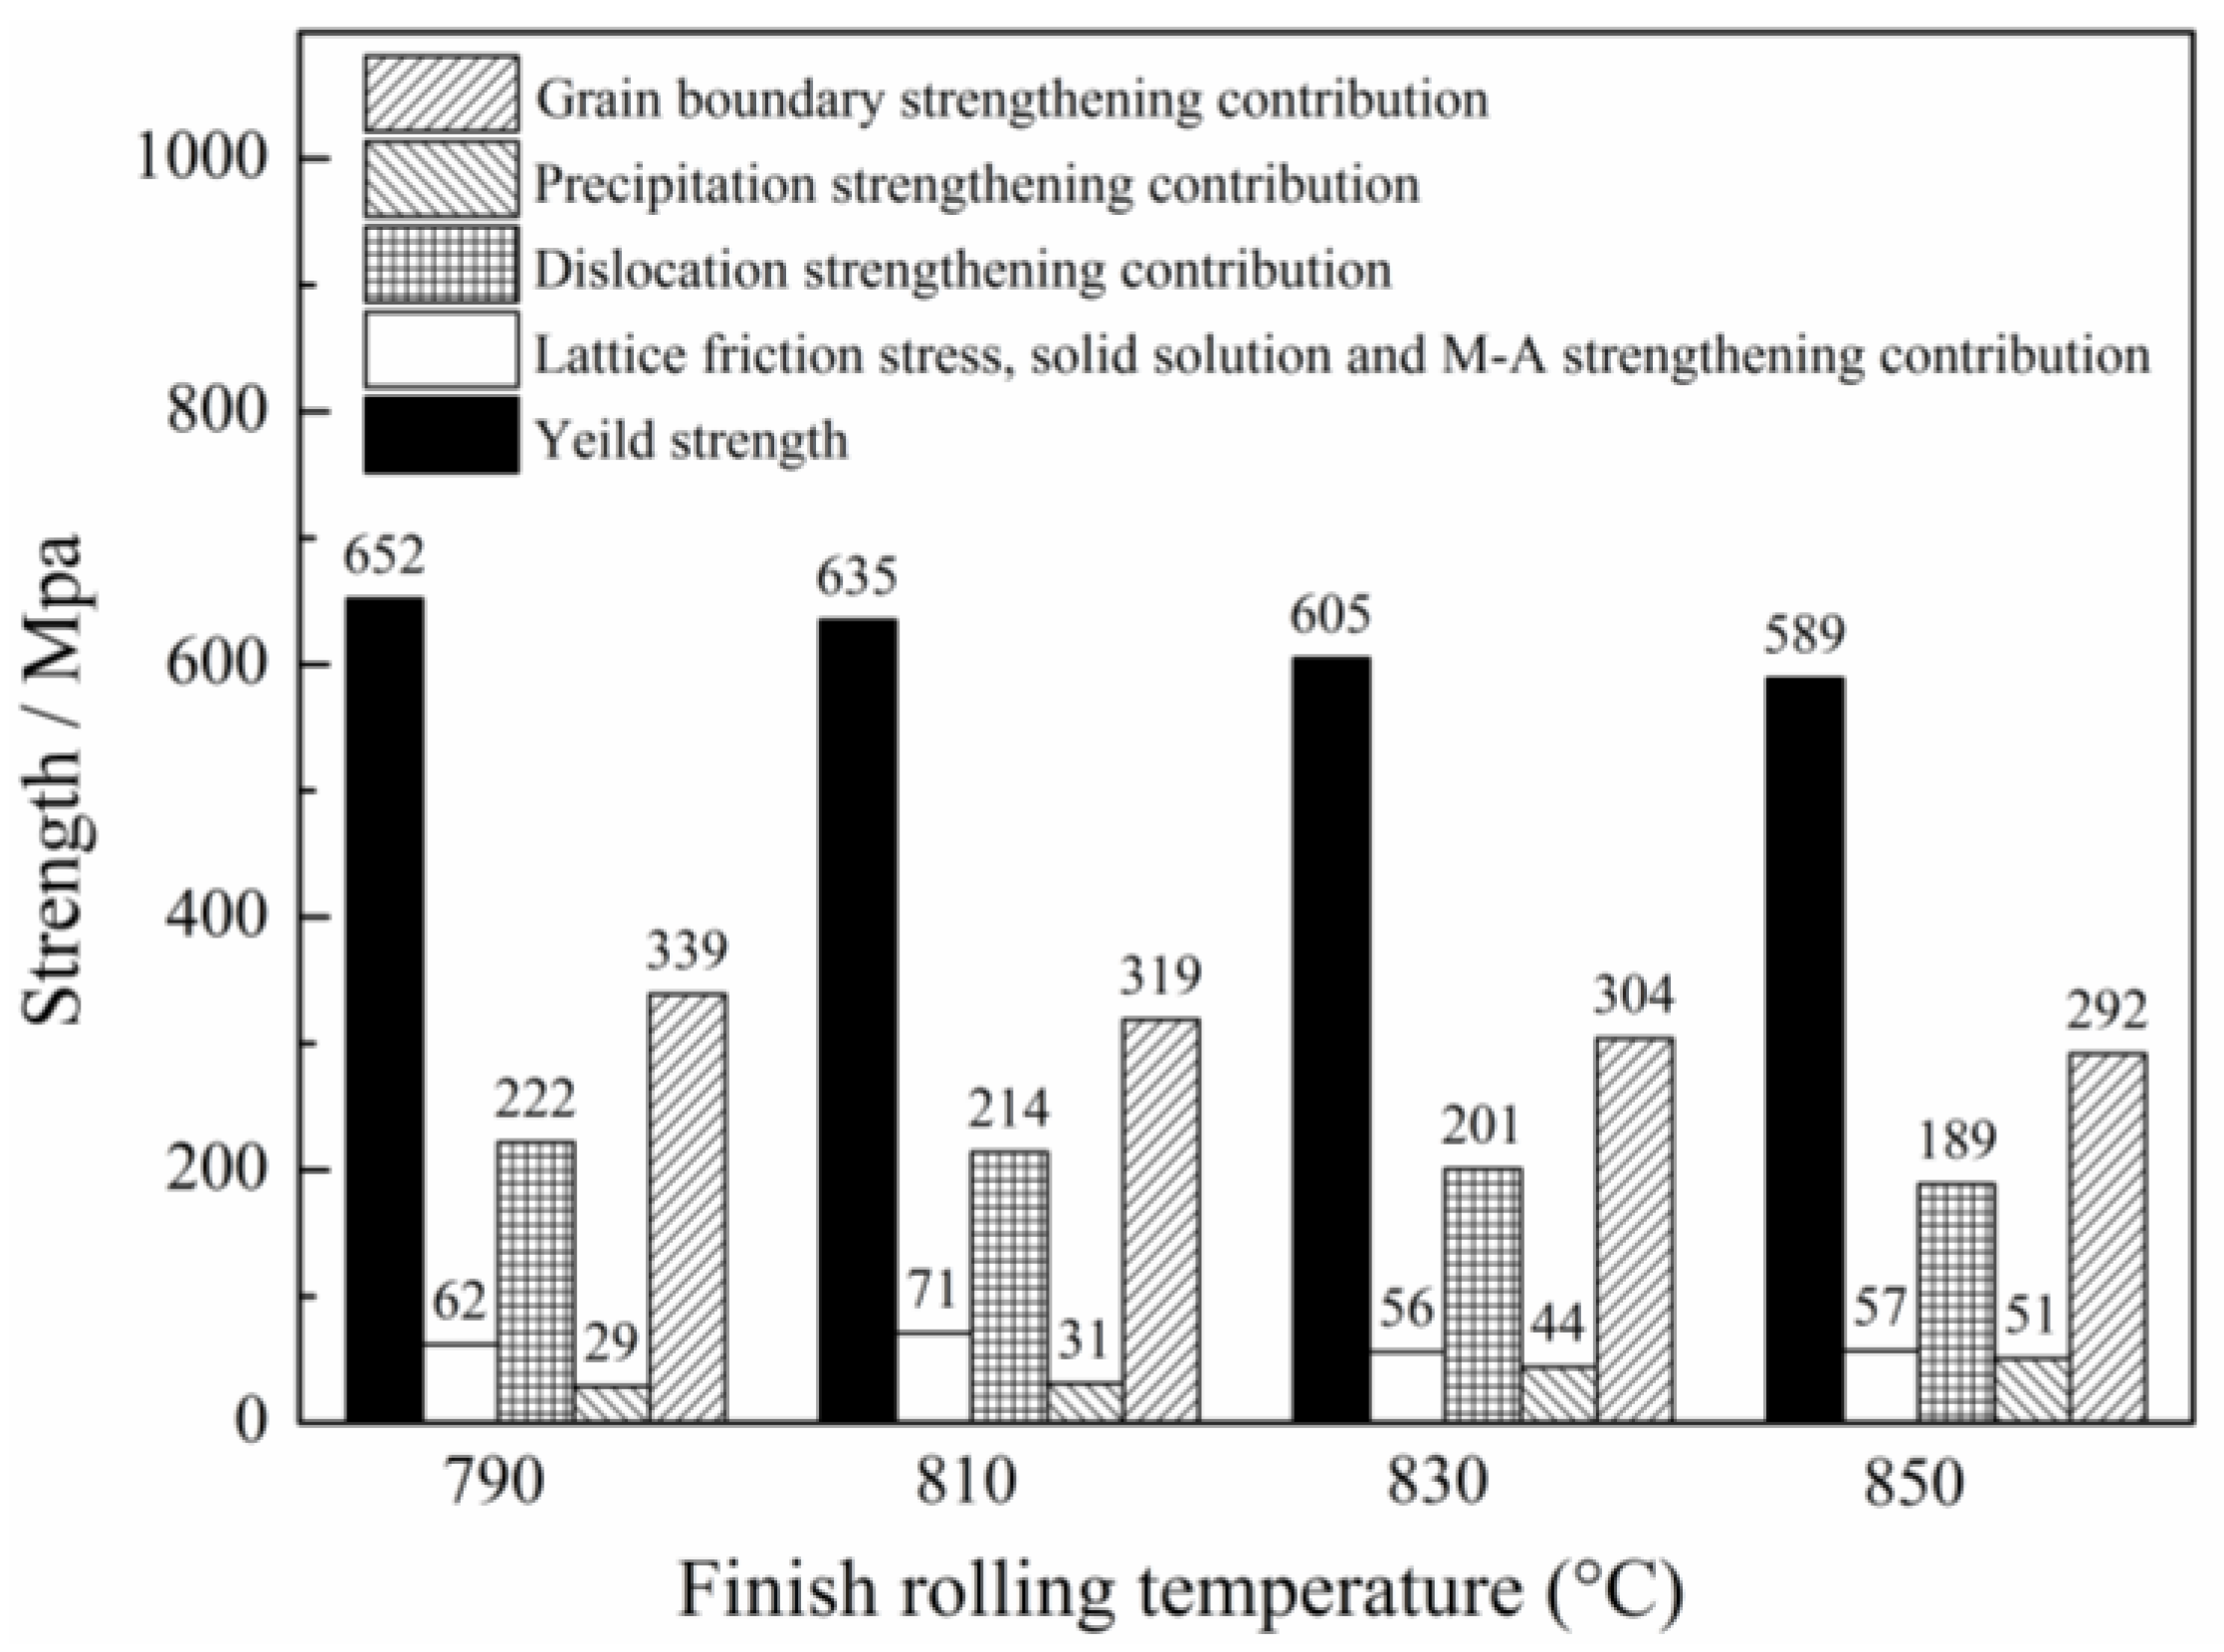
4.2. Effect of Finish Rolling Temperature on Tensile Properties
5. Conclusions
- The microstructure is primarily composed of non–equiaxed ferrite with martensite/austenite (M/A) constituent dispersed at grain boundaries for the specimens with different finish rolling temperatures. With the finish rolling temperature decreased, ferrite grains are refined and M/A constituent becomes smaller accompanied by a decrease of amount.
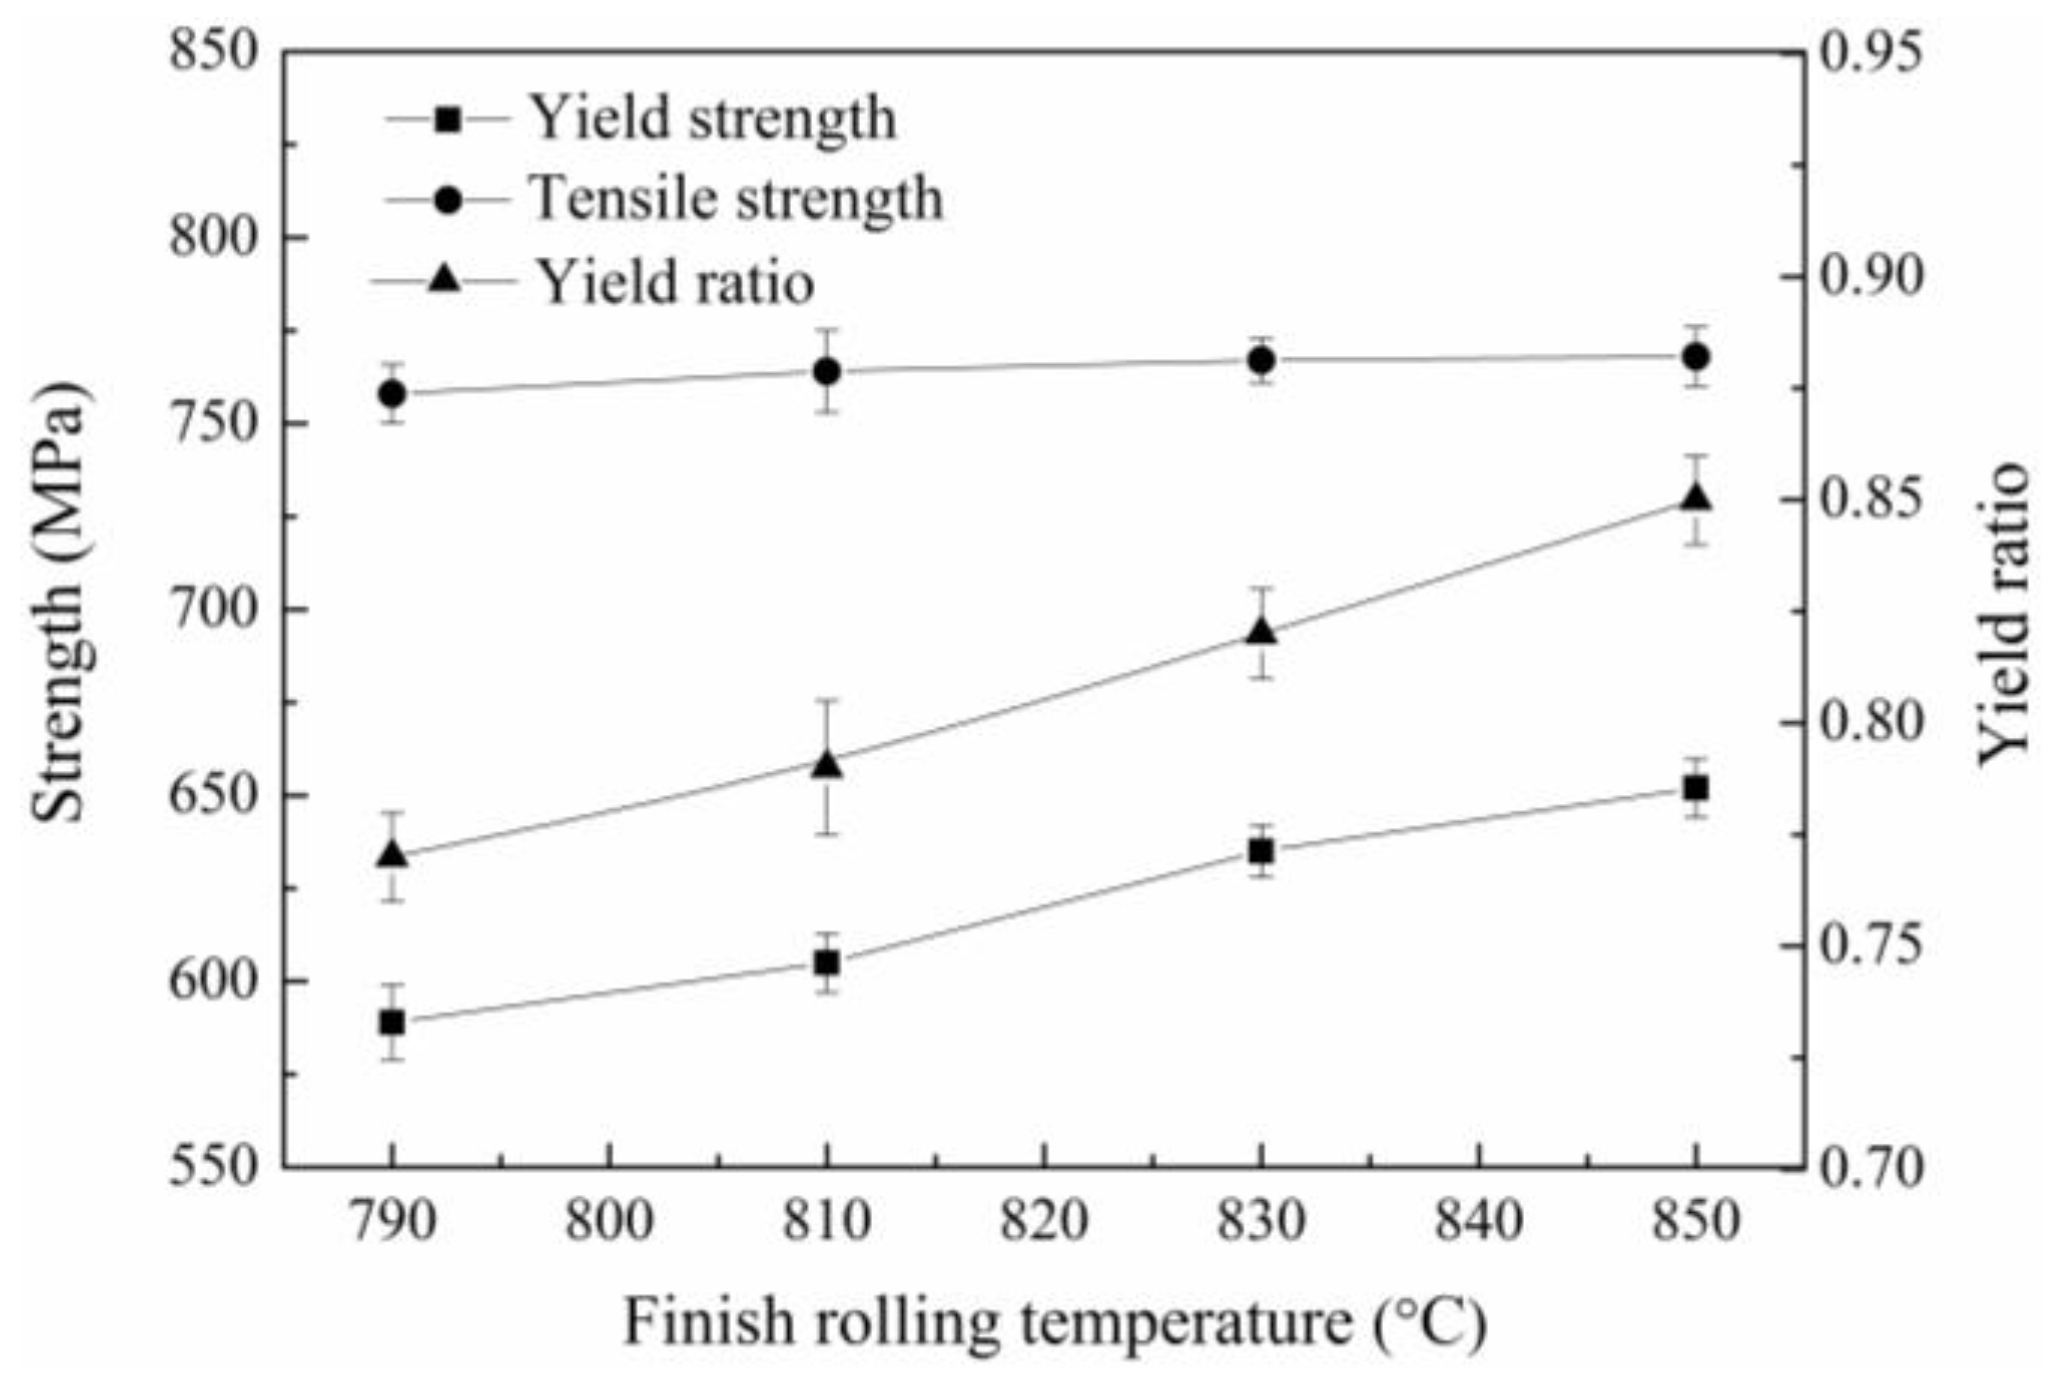
- With the decreasing finish rolling temperature, the yield strength increases, despite the declining precipitation strengthening contribution. This indicates that the increasing grain boundary strengthening contribution and the dislocation strengthening contribution overwhelm the decreasing precipitation strengthening part and are the dominating strengthening mechanism of the steel.
- The strain hardening capacity gradually declines, indicated by the increase of the yield ratio when the finish rolling temperature decreases, which are the consequences of decrements derived from the decreasing amount of hard M-A constituent and the refined ferrite grain, respectively.
Acknowledgments
Author Contributions
Conflicts of Interest
References
- Zhao, M.C.; Yang, K.; Shan, Y. The effects of thermo-mechanical control process on microstructures and mechanical properties of a commercial pipeline steel. Mater. Sci. Eng. A 2002, 335, 14–20. [Google Scholar] [CrossRef]
- Kim, Y.M.; Kim, S.K.; Lim, Y.J.; Kim, N.J. Effect of microstructure on the yield ratio and low temperature toughness of linepipe steels. ISIJ Int. 2002, 42, 1571–1577. [Google Scholar] [CrossRef]
- Bott, I.; de Souza, L.F.G.; Teixeira, J.C.G.; Rios, P.R. High-strength steel development for pipelines: A brazilian perspective. Metall. Mater. Trans. A 2005, 36A, 443–454. [Google Scholar] [CrossRef]
- Xu, J.; Misra, R.D.K.; Guo, B.; Jia, Z.; Zheng, L. Understanding variability in mechanical properties of hot rolled microalloyed pipeline steels: Process–structure–property relationship. Mater. Sci. Eng. A 2013, 574, 94–103. [Google Scholar] [CrossRef]
- Smith, Y.E.; Coldren, A.P.; Cryderman, R.L. Toward Improved Ductility and Toughness; Climax Molybdenum Company (Japan) Ltd.: Tokyo, Japan, 1972; pp. 119–142. [Google Scholar]
- Wang, W.; Yan, W.; Zhu, L.; Hu, P.; Shan, Y.; Yang, K. Relation among rolling parameters, microstructures and mechanical properties in an acicular ferrite pipeline steel. Mater. Des. 2009, 30, 3436–3443. [Google Scholar] [CrossRef]
- Kong, J.; Zhen, L.; Guo, B.; Li, P.; Wang, A.; Xie, C. Influence of Mo content on microstructure and mechanical properties of high strength pipeline steel. Mater. Des. 2004, 25, 723–728. [Google Scholar]
- Sun, J.-Q.; Dai, H.; Zhang, Y.-C. Research on mathematical model of thermal deformation resistance of X80 pipeline steel. Mater. Des. 2011, 32, 1612–1616. [Google Scholar] [CrossRef]
- Shanmugam, S.; Misra, R.D.K.; Hartmann, J.E.; Jansto, S.G. Microstructure of high strength niobium-containing pipeline steel. Mater. Sci. Eng. A 2006, 441, 215–229. [Google Scholar] [CrossRef]
- Babu, S.S. The mechanism of acicular ferrite in weld deposits. Curr. Opin. Solid State Mater. Sci. 2004, 8, 267–278. [Google Scholar] [CrossRef]
- Babu, S.S.; Bhadeshia, H.K.D.H. Transition from Bainite to Acicular Ferrite in Reheated Fe-Cr-C Weld Deposits. Mater. Sci. Technol. 1990, 6, 1005–1020. [Google Scholar] [CrossRef]
- Byun, J.S.; Shim, J.H.; Suh, J.Y.; Oh, Y.J.; Cho, Y.W.; Shim, J.D.; Lee, D.N. Inoculated acicular ferrite microstructure and mechanical properties. Mater. Sci. Eng. A 2001, 319, 326–331. [Google Scholar] [CrossRef]
- Diaz-Fuentes, M.; Gutierrez, I. Analysis of different acicular ferrite microstructures generated in a medium-carbon molybdenum steel. Mater. Sci. Eng. A 2003, 363, 316–324. [Google Scholar] [CrossRef]
- Yakubtsov, I.A.; Poruks, P.; Boyd, J.D. Microstructure and mechanical properties of bainitic low carbon high strength plate steels. Mater. Sci. Eng. A 2008, 480, 109–116. [Google Scholar] [CrossRef]
- Yakubtsov, I.A.; Boyd, J.D. Bainite transformation during continuous cooling of low carbon microalloyed steel. Mater. Sci. Technol. 2001, 17, 296–301. [Google Scholar] [CrossRef]
- Li, X.; Fan, Y.; Ma, X.; Subramanian, S.V.; Shang, C. Influence of martensite-austenite constituents formed at different intercritical temperatures on toughness. Mater. Des. 2014, 67, 457–463. [Google Scholar] [CrossRef]
- Wang, B.X.; Liu, X.H.; Wang, G.D. Effect of deformation of austenite and cooling rates on transformation microstructures in a Mn–Cr gear steel. Mater. Des. 2009, 30, 2198–2204. [Google Scholar] [CrossRef]
- Wang, W.; Shan, Y.; Yang, K. Study of high strength pipeline steels with different microstructures. Mater. Sci. Eng. A 2009, 502, 38–44. [Google Scholar] [CrossRef]
- Kang, N.; Lee, Y.; Byun, S.; Kim, K.; Chuang, J.; Cho, K. Quantitative analysis of microstructural and mechanical behavior for Fe–0.1C–(V, Nb) steels as a function of the final rolling temperature. Mater. Sci. Eng. A 2009, 499, 157–161. [Google Scholar] [CrossRef]
- Sung, H.K.; Sohn, S.S.; Shin, S.Y.; Lee, S.; Kim, N.J.; Chon, S.H.; Yoo, J.Y. Effects of finish rolling temperature on inverse fracture occurring during drop weight tear test of API X80 pipeline steels. Mater. Sci. Eng. A 2014, 541, 181–189. [Google Scholar] [CrossRef]
- Olalla, V.C.; Bliznuk, V.; Sanchez, N.; Thibaux, P.; Kestens, L.A.I.; Petrov, R.H. Analysis of the strengthening mechanisms in pipeline steels as a function of the hot rolling parameters. Mater. Sci. Eng. A 2014, 604, 46–56. [Google Scholar] [CrossRef]
- Kim, Y.W.; Kim, J.H.; Hong, S.G.; Lee, C.S. Effects of rolling temperature on the microstructure and mechanical properties of Ti–Mo microalloyed hot-rolled high strength steel. Mater. Sci. Eng. A 2014, 605, 244–252. [Google Scholar] [CrossRef]
- Kostryzhev, A.G.; Al Shahrani, A.; Zhu, C.; Cairney, J.M.; Ringer, S.P.; Killmore, C.R.; Pereloma, E.V. Effect of niobium clustering and precipitation on strength of an NbTi-microalloyed ferritic steel. Mater. Sci. Eng. A 2014, 607, 226–235. [Google Scholar] [CrossRef]
- García-Mateo, C.; Caballero, F.G.; Bhadeshia, H.K.D.H. Mechanical properties of low-temperature bainite. Mater. Sci. Forum 2005, 500–501, 495–502. [Google Scholar] [CrossRef]
- Tang, Z.; Stumpf, W. The effect of microstructure and processing variables on the yield to ultimate tensile strength ratio in a Nb–Ti and a Nb–Ti–Mo line pipe steel. Mater. Sci. Eng. A 2008, 490, 391–402. [Google Scholar] [CrossRef]
- Liu, H.; Lu, X.; Jin, X.; Dong, H.; Shi, J. Enhanced mechanical properties of a hot stamped advanced high-strength steel treated by quenching and partitioning process. Scr. Mater. 2011, 64, 749–752. [Google Scholar] [CrossRef]
- Fan, L.; Wang, T.; Fu, Z.; Zhang, S.; Wang, Q. Effect of heat-treatment on-line process temperature on the microstructure and tensile properties of a low carbon Nb-microalloyed steel. Mater. Sci. Eng. A 2014, 607, 559–568. [Google Scholar] [CrossRef]
- Han, Y.; Shi, J.; Xu, L.; Cao, W.Q.; Dong, H. Effect of hot rolling temperature on grain size and precipitation hardening in a Ti-microalloyed low-carbon martensitic steel. Mater. Sci. Eng. A 2012, 553, 192–199. [Google Scholar] [CrossRef]
- Kim, Y.M.; Lee, H.; Kim, N.J. Transformation behavior and microstructural characteristics of acicular ferrite in linepipe steels. Mater. Sci. Eng. A 2008, 478, 361–370. [Google Scholar] [CrossRef]
- Wang, S.C.; Yang, J.R. Effects of chemical composition, rolling and cooling conditions on the amount of martensite/austenite (M/A) constituent formation in low carbon bainitic steels. Mater. Sci. Eng. A 1992, 154, 43–49. [Google Scholar] [CrossRef]
- Fan, L.; Zhou, D.; Wang, T.; Li, S.; Wang, Q. Tensile properties of an acicular ferrite and martensite/austenite constituent steel with varying cooling rates. Mater. Sci. Eng. A 2014, 590, 224–231. [Google Scholar] [CrossRef]
- Calvo, J.; Jung, I.H.; Elwazri, A.M.; Bai, D.; Yue, S. Influence of the chemical composition on transformation behaviour of low carbon microalloyed steels. Mater. Sci. Eng. A 2009, 520, 90–96. [Google Scholar] [CrossRef]
- Lanzagorta, J.L.; Jorge-Badiola, D.; Guiterrez, I. Effect of the strain reversal on austenite–ferrite phase transformation in a Nb-microalloyed steel. Mater. Sci. Eng. A 2010, 527, 934–940. [Google Scholar] [CrossRef]
- Dutta, B.; Palmiere, E.J.; Sellars, C.M. Modelling the kinetics of strain induced precipitation in Nb microalloyed steels. Acta Mater. 2001, 49, 785–794. [Google Scholar] [CrossRef]
- Chatterjee, S.; Wang, H.S.; Yang, J.R.; Bhadeshia, H.K.D.H. Mechanical stabilisation of austenite. Mater. Sci. Technol. 2006, 22, 641–644. [Google Scholar] [CrossRef]
- Iza-Mendia, A.; Gutiérrez, I. Generalization of the existing relations between microstructure and yield stress from ferrite–pearlite to high strength steels. Mater. Sci. Eng. A 2013, 561, 40–51. [Google Scholar] [CrossRef]
- Hansen, N.; Huang, X.; Winther, G. Grain orientation, deformation microstructure and flow stress. Mater. Sci. Eng. A 2008, 494, 61–67. [Google Scholar] [CrossRef]
- Kestenbach, H. Dispersion hardening by niobium carbonitride precipitation in ferrite. Mater. Sci. Technol. 1997, 13, 731–739. [Google Scholar] [CrossRef]
- Stoller, R.E.; Zinkle, S.J.; Nucl, J. On the relationship between uniaxial yield strength and resolved shear stress in polycrystalline materials. J. Nucl. Mater. 2000, 283–287, 349–352. [Google Scholar] [CrossRef]
- Rosenberg, J.M.; Piehle, H.R. Calculation of the taylor factor and lattice rotations for bcc metals deforming by pencil glide. Metall. Mater. Trans. 1971, 2B, 257–259. [Google Scholar] [CrossRef]
- Hughes, D.A. Microstructure evolution, slip patterns and flow stress. Mater. Sci. Eng. A 2001, 319–321, 46–54. [Google Scholar] [CrossRef]
- Zare, A.; Ekrami, A. Effect of martensite volume fraction on work hardening behavior of triple phase (TP) steels. Mater. Sci. Eng. A 2011, 528, 4422–4426. [Google Scholar] [CrossRef]
- Prasad, S.N.; Sarma, D.S. Influence of thermomechanical treatment on microstructure and mechanical properties of Nb bearing weather resistant steel. Mater. Sci. Eng. A 2005, 408, 53–63. [Google Scholar] [CrossRef]
- Ishikawa, N.; Parks, D.M.; Kurihara, M. Micromechanism of Ductile Crack Initiation in Structural Steels Based on Void Nucleation and Growth. ISIJ Int. 2000, 40, 519–527. [Google Scholar] [CrossRef]


| C | Si | Mn | P | S | Mo + Ni + Cu | Nb + Ti + V |
|---|---|---|---|---|---|---|
| 0.06 | 0.30 | 1.90 | 0.005 | 0.002 | ≤0.98 | ≤0.19 |
| Finish Rolling Temperature (°C) | M/A Constituent (%) | M/A Constituent MED (μm) | Low Angle Boundaries (2° ≤ θ < 15°) | |
|---|---|---|---|---|
| Mean Misorientation (°) | Fraction | |||
| 850 | 4.5 ± 0.3 | 1.7 ± 0.2 | 6.2 ± 0.2 | 0.40 ± 0.02 |
| 830 | 5.4 ± 0.4 | 1.5 ± 0.3 | 6.2 ± 0.1 | 0.41 ± 0.01 |
| 810 | 6.3 ± 0.3 | 1.2 ± 0.2 | 6.1 ± 0.2 | 0.43 ± 0.01 |
| 790 | 7.4 ± 0.2 | 0.8 ± 0.1 | 6.1 ± 0.1 | 0.44 ± 0.02 |
| Precipitate | Morphology | Size Range (nm) |
|---|---|---|
| Ti-rich (Ti, Nb)C | Spherical/Irregular | 30–100 |
| Cuboidal | ||
| Nb-rich (Nb, Ti)C | Spherical | 10–30 |
| Finish Rolling Temperature (°C) | x (nm) | Volume Fraction f |
|---|---|---|
| 850 | 29.3 ± 0.1 | 10.8 ± 0.2 × 10⁻⁴ |
| 830 | 33.6 ± 0.2 | 9.4 ± 0.1 × 10⁻⁴ |
| 810 | 48.2 ± 0.2 | 8.1 ± 0.3 × 10⁻⁴ |
| 790 | 50.3 ± 0.1 | 7.6 ± 0.1 × 10⁻⁴ |
| Finish Rolling Temperature (°C) | ρ/× 1014 m−2 |
|---|---|
| 850 | 5.2 ± 0.05 |
| 830 | 5.9 ± 0.04 |
| 810 | 6.7 ± 0.07 |
| 790 | 7.2 ± 0.07 |
© 2016 by the authors; licensee MDPI, Basel, Switzerland. This article is an open access article distributed under the terms and conditions of the Creative Commons Attribution (CC-BY) license (http://creativecommons.org/licenses/by/4.0/).
Share and Cite
Guo, B.; Fan, L.; Wang, Q.; Fu, Z.; Wang, Q.; Zhang, F. Effect of Finish Rolling Temperature on the Microstructure and Tensile Properties of Nb–Ti Microalloyed X90 Pipeline Steel. Metals 2016, 6, 323. https://doi.org/10.3390/met6120323
Guo B, Fan L, Wang Q, Fu Z, Wang Q, Zhang F. Effect of Finish Rolling Temperature on the Microstructure and Tensile Properties of Nb–Ti Microalloyed X90 Pipeline Steel. Metals. 2016; 6(12):323. https://doi.org/10.3390/met6120323
Chicago/Turabian StyleGuo, Bin, Lei Fan, Qian Wang, Zhibin Fu, Qingfeng Wang, and Fucheng Zhang. 2016. "Effect of Finish Rolling Temperature on the Microstructure and Tensile Properties of Nb–Ti Microalloyed X90 Pipeline Steel" Metals 6, no. 12: 323. https://doi.org/10.3390/met6120323
APA StyleGuo, B., Fan, L., Wang, Q., Fu, Z., Wang, Q., & Zhang, F. (2016). Effect of Finish Rolling Temperature on the Microstructure and Tensile Properties of Nb–Ti Microalloyed X90 Pipeline Steel. Metals, 6(12), 323. https://doi.org/10.3390/met6120323