Article

Deformation in Metallic Glasses Studied by Synchrotron X-Ray Diffraction

1
Department of Materials Science and Engineering, Joint-Institute for Neutron Sciences, University of Tennessee, Knoxville, TN 37996, USA
2
Department of Physics and Astronomy, University of Tennessee, Knoxville, TN 37996, USA
3
Oak Ridge National Laboratory, Materials Science and Technology Division, Oak Ridge, TN 37831, USA
4
Department of Mechanical and Biomedical Engineering, City University of Hong Kong, Hong Kong, China
*
Author to whom correspondence should be addressed.
These authors contributed equally to this work.
Metals 2016, 6(1), 22; https://doi.org/10.3390/met6010022
Submission received: 10 December 2015 / Revised: 6 January 2016 / Accepted: 7 January 2016 / Published: 11 January 2016
(This article belongs to the Special Issue Metals Challenged by Neutron and Synchrotron Radiation)

Abstract

:
High mechanical strength is one of the superior properties of metallic glasses which render them promising as a structural material. However, understanding the process of mechanical deformation in strongly disordered matter, such as metallic glass, is exceedingly difficult because even an effort to describe the structure qualitatively is hampered by the absence of crystalline periodicity. In spite of such challenges, we demonstrate that high-energy synchrotron X-ray diffraction measurement under stress, using a two-dimensional detector coupled with the anisotropic pair-density function (PDF) analysis, has greatly facilitated the effort of unraveling complex atomic rearrangements involved in the elastic, anelastic, and plastic deformation of metallic glasses. Even though PDF only provides information on the correlation between two atoms and not on many-body correlations, which are often necessary in elucidating various properties, by using stress as means of exciting the system we can garner rich information on the nature of the atomic structure and local atomic rearrangements during deformation in glasses.

Graphical Abstract

1. Introduction

Glass generally is a symbol of something extremely fragile. Indeed, conventional glasses, mostly oxide glasses, shatter helplessly upon impact. However, a relatively new family member of glasses, metallic glass, is stronger and tougher than oxide glasses, and even compares favorably to most of crystalline metallic materials in their mechanical properties. For this reason they are promising as structural materials [1], and are beginning to be used in watches and mobile phones. However, it is not easy to understand why they are strong and how they mechanically fail. Crystalline materials lattice defects, such as dislocations, can be readily defined as deviations from lattice periodicity, and crystalline materials fail because of the motion of these defects. In glasses, defects cannot be uniquely defined because of the extensive disorder in their structures. Nevertheless, phenomenologically structural defects, such as the shear-transformation-zones (STZs), have been postulated and have facilitated elucidation of mechanical properties [2,3]. However, atomistic details of STZs remain elusive.
Diffraction measurements, by their nature, provide only the information on two-atom positional correlation. However, most physical properties depend on more collective atomic correlations, which diffraction measurements cannot directly assess. Luckily, in crystalline materials, because of lattice symmetry and periodicity, it is possible to construct an accurate three-dimensional model out of two-body correlation alone. However, we are unable to do so with liquids and glasses, and it is not possible because of the extensive structural disorder. The structures of liquids and glasses are usually expressed in terms of the atomic pair-distribution function (PDF), g(r), which describe the probability of finding two atoms separated by the distance, r. PDF has an advantage that it can be determined through the Fourier-transformation of the structure function, S(Q), which can be directly measured by diffraction experiments [4,5]. However, all PDFs, more or less, look alike, and they are not strongly discriminatory in determining the structure, allowing high degeneracy of similar structures.
On the other hand, if the system is perturbed by a field, such as a stress field, the response often reveals the nature of the structure more informatively. Usually, the symmetry is broken by the field, so that response can be accurately detected by symmetry discrimination. In this article we discuss how the measurement of response of metallic glasses to the applied stress contribute to the understanding of the subtle nature of the glassy system. In our view, it constitutes one of the triumphs of synchrotron radiation research in interrogating the nature of metallic materials.

2. Synchrotron X-Ray Diffraction Measurement under Stress

2.1. Anisotropic PDF Analysis

The structure of a macroscopically isotropic glass or liquid is usually described by the atomic pair-density function (PDF) defined by:
ρ 0 g ( r ) = 1 4 π r 2 N i , j δ ( r | r i j | )
where ρ0 is the atomic number density, N the number of atoms in the system, and δ(x) is the delta function [4,5]. PDF is related to the structure function S(Q) by:
ρ 0 g ( r ) = 1 2 π 2 r 0 S ( Q ) 1 sin ( Q r ) Q d Q
where Q is the scattering vector (= 4πsinΘ/λ, Θ is the diffraction angle and λ is the wavelength of the probe). S(Q) can be determined by X-ray, neutron, or electron diffraction measurement after correction for geometry, absorption and background [4,5]. Theoretically, the integration in Equation (2) should be carried out to infinity. However, in reality, because sinΘ is equal or less than unity the maximum value of Q that can be attained, QMax, is less than 4π/λ. Therefore we have to use high-energy X-ray to access a wide range of Q. Synchrotron radiation is an ideal probe for such a purpose, and X-rays with energy higher than 100 keV are routinely used for PDF measurement. Furthermore, by using a two-dimensional X-ray detector S(Q) can be measured over a wide range of Q at once, making the diffraction measurement very fast [6].
The PDF analysis usually assumes that the sample is isotropic, so S(Q) depends only on the magnitude of Q, not the direction. However, when a solid is subjected to shear or uniaxial stress the sample is no longer isotropic, and both g(r) and S(Q) depend on the direction of r and Q. In this case, we use the spherical harmonics expansion:
g ( r ) = , m g m ( r ) Y m ( r / r )
S ( Q ) = , m S m ( Q ) Y m ( Q / Q )
which are connected through:
ρ 0 g m ( r ) = i 2 π 2 0 S m ( Q ) J ( Q r ) Q 2 d Q
where J(x) is the spherical Bessel function [5,7]. For the isotropic ( = 0) component, S00(Q), Equation (5) is reduced to Equation (1), because J0(x) = sinx/x. The anisotropic structure function, Sm(Q) can be determined from S(Q) by:
S m ( Q ) = S ( Q ) Y m ( Q / Q ) d Ω
where dΩ = d(cosθ)dϕ, making use of the orthonormal properties of the spherical harmonics. In the case of a sample deformed under a uniaxial stress applied along the z-axis, with the X-ray beam along the y-axis, the data from the two-dimensional detector takes the form of S(Q, θ). In most cases, the only relevant terms in Equation (4) are S00(Q) (isotropic structure function) and the anisotropic term, S20(Q), which are obtained by:
S 0 0 ( Q ) = 1 1 S ( Q , θ ) d cos θ
S 2 0 ( Q ) = 1 2 1 1 S ( Q , θ ) [ 3 cos 2 θ 1 ] d cos θ
If the deformation is affine, that is, the strain is uniform, and the displacement of the i-th atom is given by a single strain tensor:
Δ r i α = ε α β r i β
Then, it can be shown that S20(Q) s given by:
S 2 , a f f i n e 0 ( Q ) = ε ( 1 5 ) 1 / 2 2 ( 1 + ν ) 3 Q d d Q S 0 0 ( Q )
In the same way the anisotropic PDF for affine deformation is given by:
g 2 , a f f i n e 0 ( r ) = ε ( 1 5 ) 1 / 2 2 ( 1 + ν ) 3 r d d r g 0 0 ( r )
Therefore, the measurement of S20(Q) does not provide any new information. In general, however, deformation in glasses is heterogeneous at the atomic level, and the real anisotropic S(Q) and PDF deviate from Equations (10) and (11). In such a case, the measurement does provide new and unique information. Below we describe how the determination of the anisotropic PDF of a metallic glass sample deformed by thermomechanical creep by a diffraction experiment using high-energy X-ray from a synchrotron radiation source facilitated understanding of the microscopic process of deformation.

2.2. Procedure of Determining Anisotropic PDF

The anisotropy in S(Q) is often small, and care has to be exercised in order to measure it accurately. In particular, the sensitivity of a two-dimensional (2D) detector is always slightly inhomogeneous and anisotropic. If we did not compensate for this anisotropy, the data could become very distorted. We make it a standard practice to repeat measurements at two sample orientations, rotated by 90 degrees to each other. In this section, we discuss the procedure of such a measurement in the case of samples processed by thermomechanical (creep) deformation.

2.2.1. Sample Preparation

1)
Prepare a cylindrical or rectangular sample of bulk metallic glass of chosen composition. Make sure that the two end surfaces are smooth and parallel to each other.
2)
Subject the sample to uniaxial stress, and raise the temperature to Ta, which has to be below the glass transition temperature, Tg. One has to be careful to keep the stress level below the yield stress at that temperature, because the yield stress is strongly temperature dependent, particularly near Tg.
3)
Cool the sample down to room temperature with the stress still applied.
4)
Remove the stress, and cut a sample thin enough for X-ray diffraction (~0.5 mm) from the crept sample. The cut should be made parallel to the stress axis so that, in transmission geometry, the scattering vector Q probes the direction parallel and normal to the applied stress.
5)
The reference sample annealed in the same conditions (same temperature and time) should be prepared with a similar thickness. In general, the thickness is chosen in reference to absorption of X-rays (tμ < 0.2, t is the thickness and μ is the absorption coefficient) and samples containing heavy elements should be thinner.

2.2.2. Diffraction Measurement

6)
Set-up the beam line for a high-energy PDF experiment with a 2D detector. The detector should be placed at a distance that covers enough Q space for reliable normalization and Fourier transformation, up to 18–25 Å−1.
7)
Place the sample with the plane normal to the beam and the stress axis aligned vertically to the ground.
8)
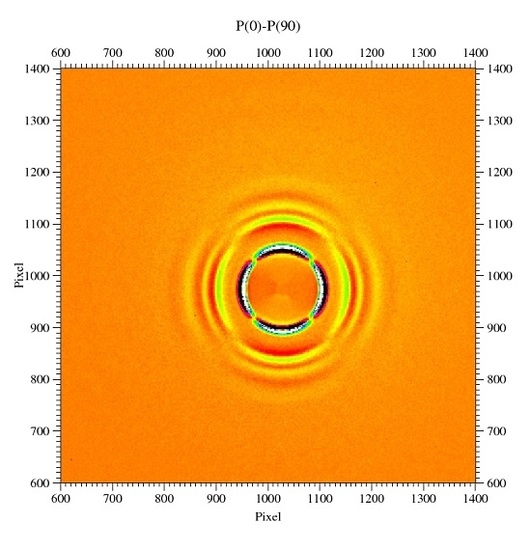
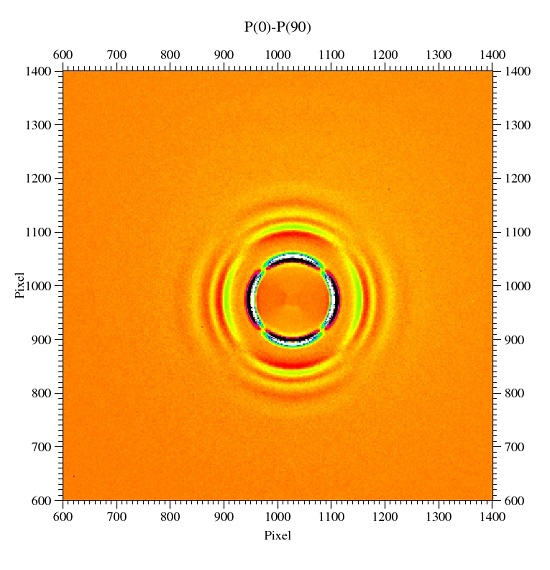
Turn on the X-ray and take data for a sufficiently long time, typically 5–15 min (Data Set #1). The data should be in the form of I(Q, θ), where θ is the azimuthal angle. The counting time and number of exposures depend on specifics of the detector and X-ray beam intensity. Ideally we want to have ~106 counts per inverse Å after integration over θ, at high Q.
9)
Turn the sample by 90° around the beam so that the stress axis is horizontal, and repeat the measurement (Data Set #2). This step is useful because the sensitivity and background of the 2D detector are usually not isotropic. It is helpful to have a sample holder that can rotate the sample by 90° without changing its distance to the detector.
10)
Rotate Data Set #2 by 90° and subtract it from Data Set #1, to remove the effect of the efficiency, and the flat field anisotropy of the 2D detector.
11)
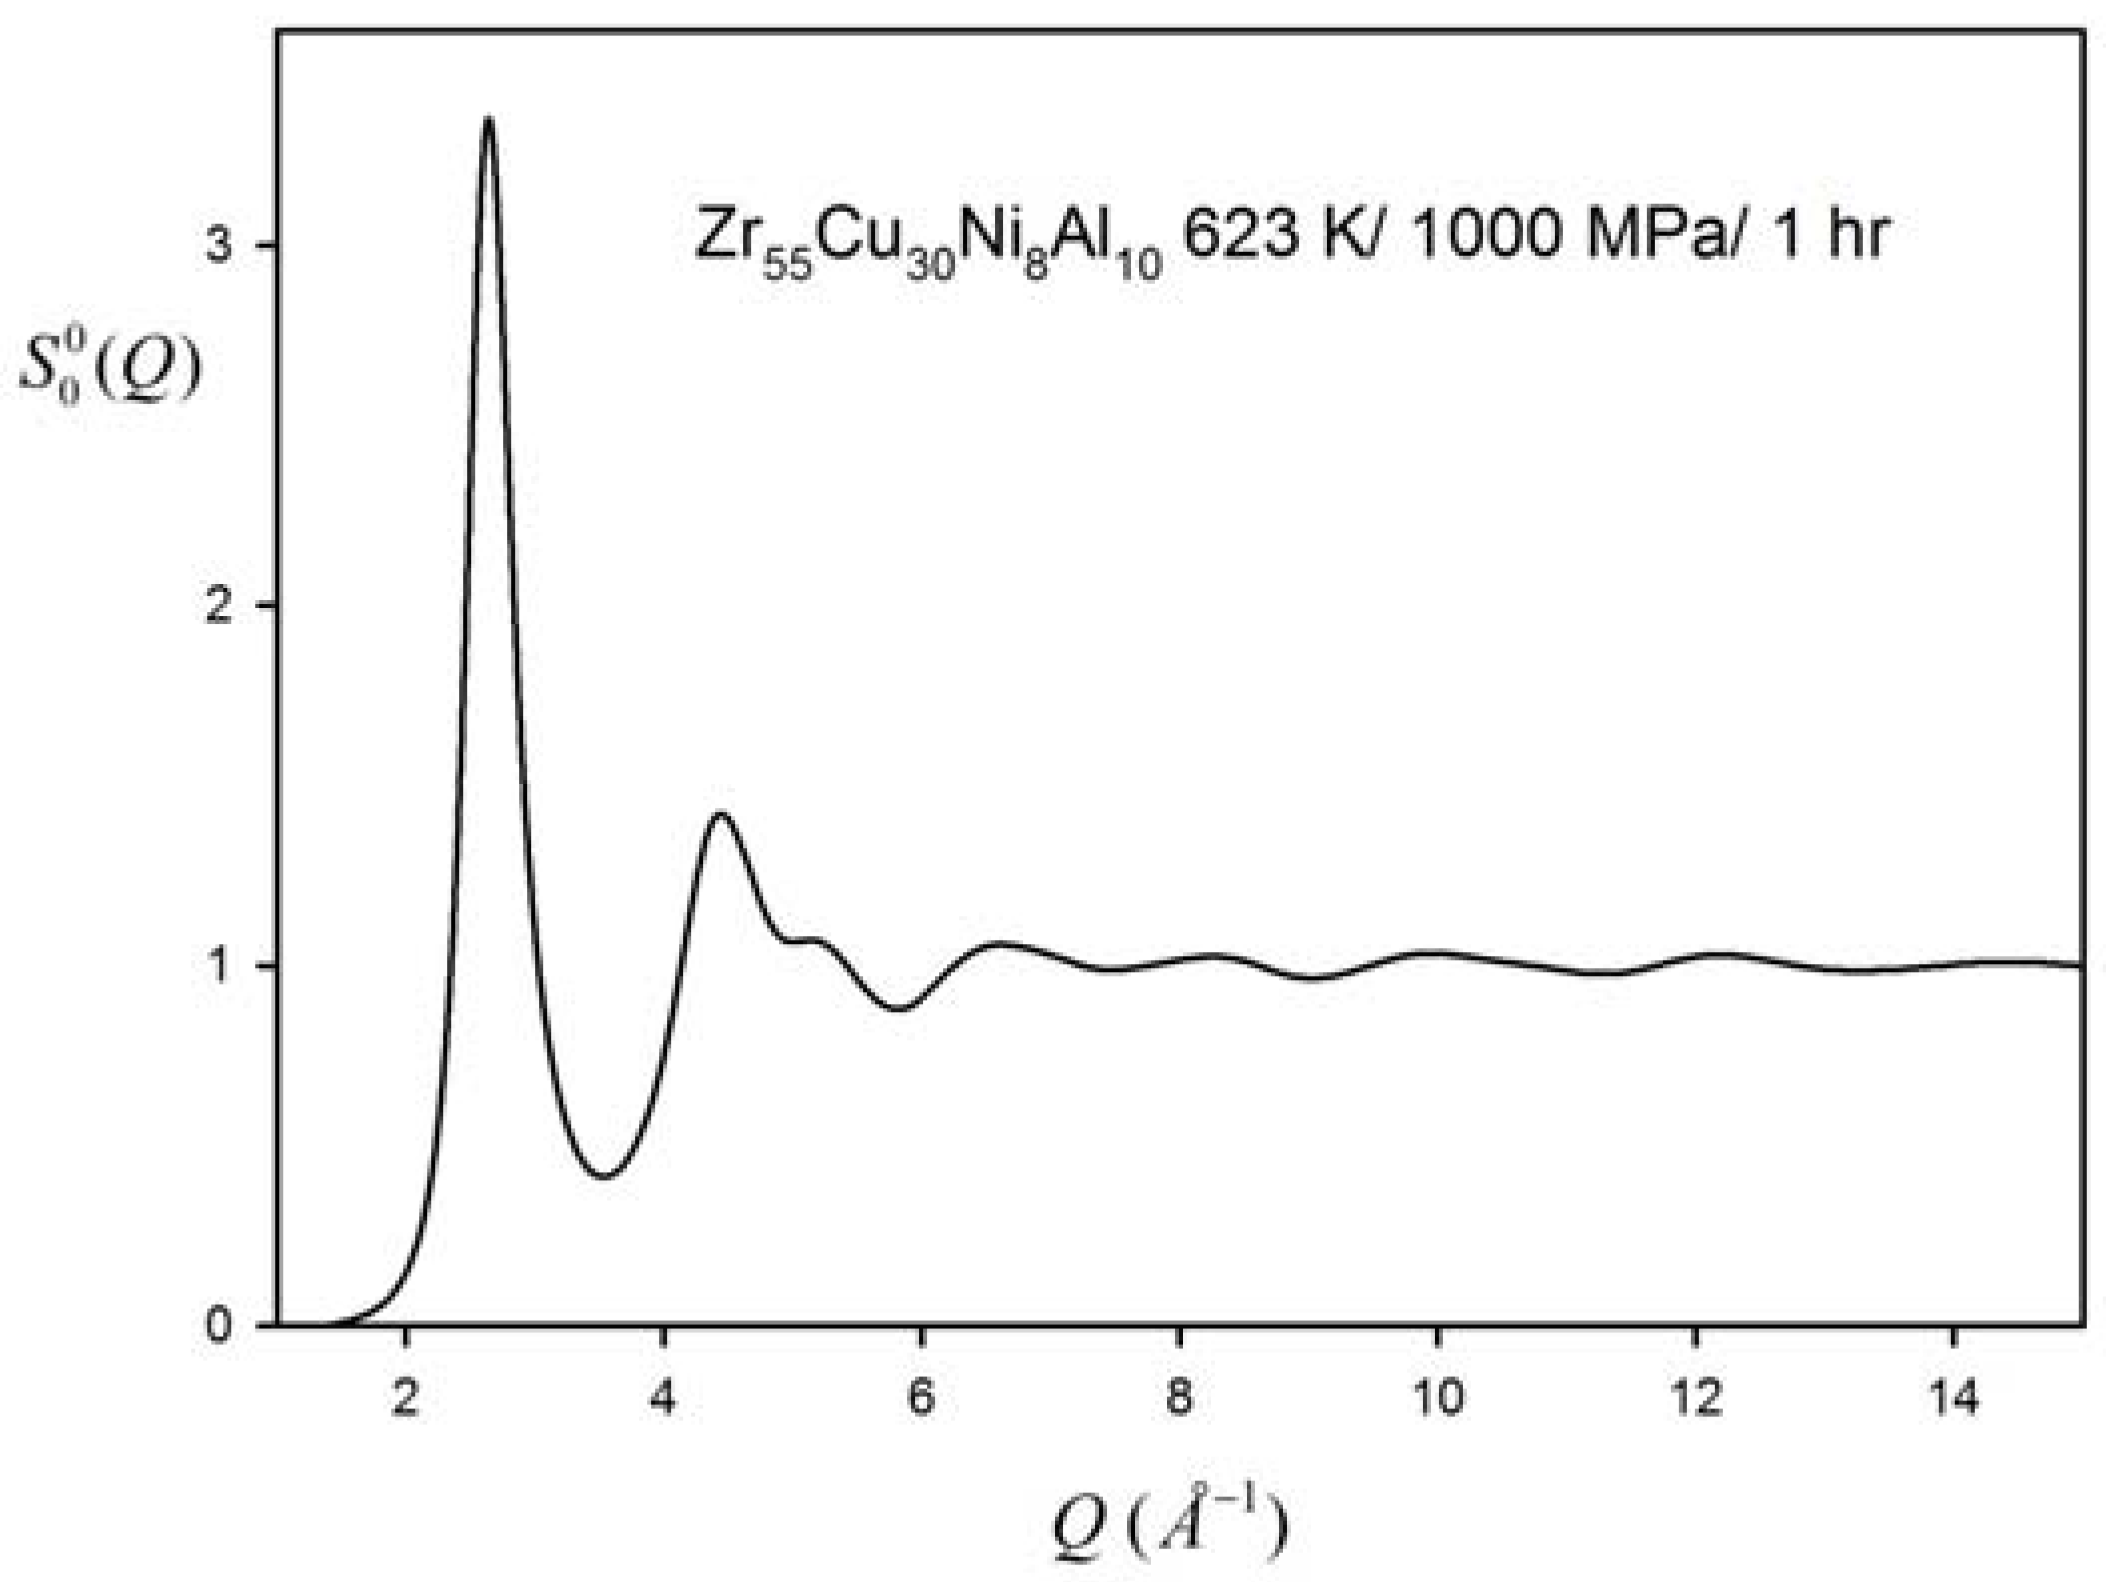
Determine S(Q, θ) from the raw data, I(Q, θ), by correcting for absorption, background, Compton intensity and the atomic scattering factor, <f(Q)>2, and normalizing to unity at Q → ∞.

2.2.3. Data Processing

12)
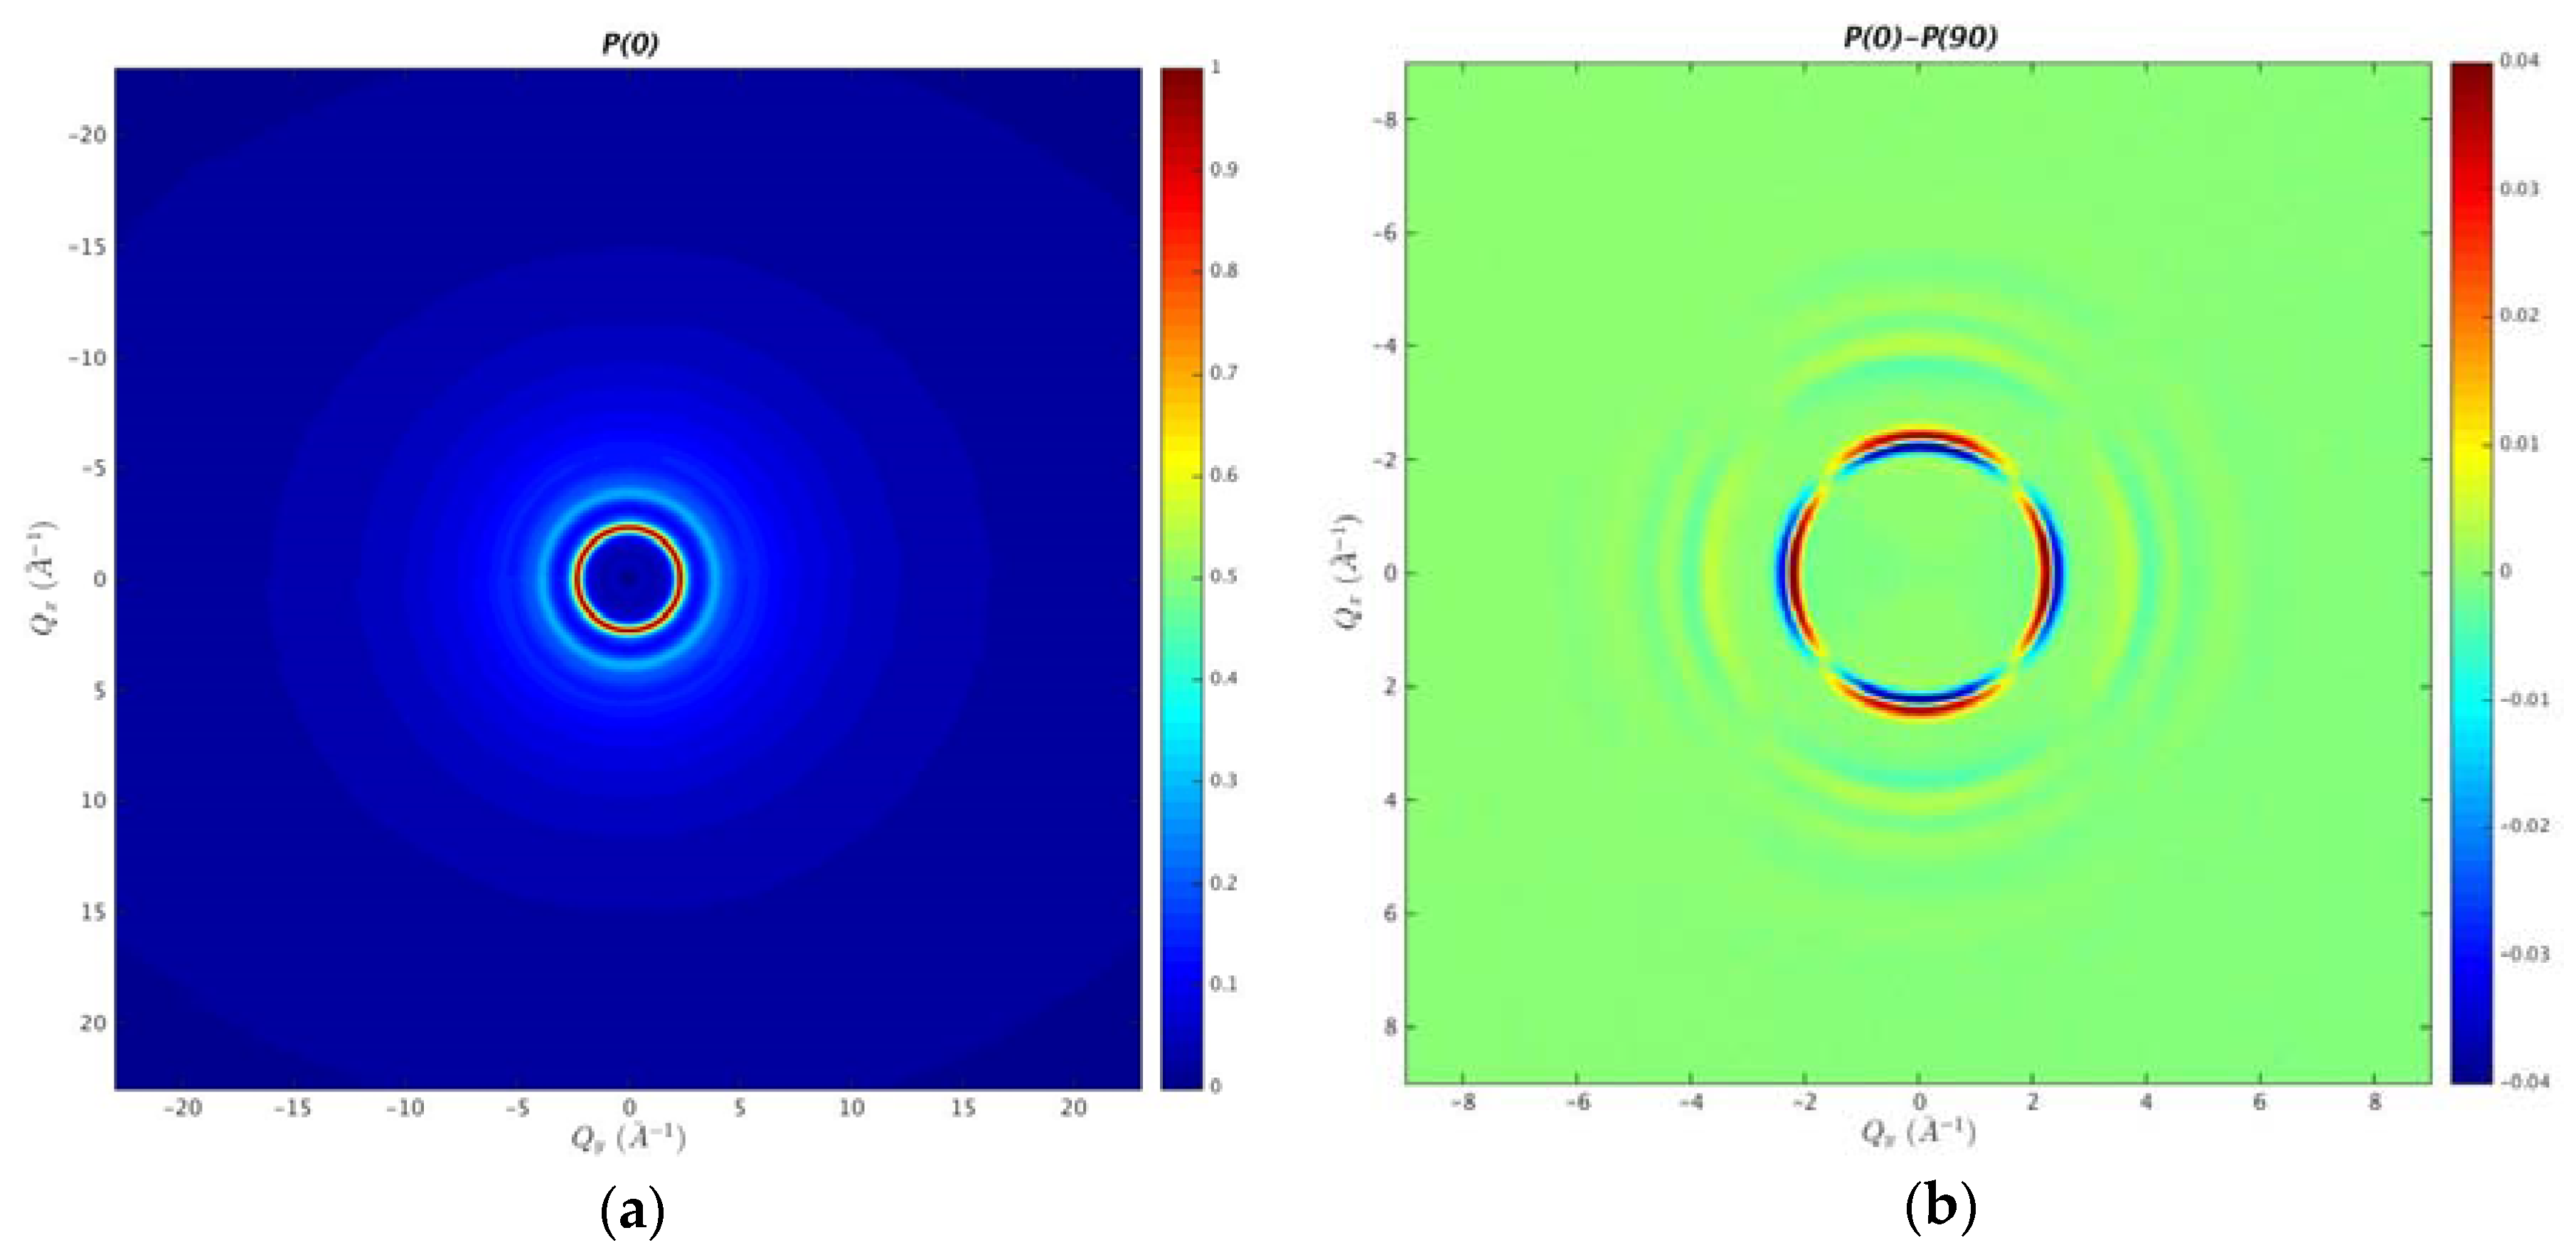
Ideally the isotropic and anisotropic S(Q) is obtained by:
S 0 0 ( Q ) = 1 2 0 π [ S ( Q , θ ) + S ( Q , θ ) ] sin θ d θ
S 2 0 ( Q ) = 1 4 0 π [ S ( Q , θ ) + S ( Q , θ ) ] [ 3 cos 2 θ 1 ] sin θ d θ
However, as we noted, we make measurements with two sample orientations to compensate for the anisotropy of detector efficiency, and obtain two sets of data, Data Sets #1 and #2. The method of obtaining S20(Q) from the two sets of data is as follows.
13)
The anisotropic part of Data Set #1 has the form:
S a n i s o 1 ( Q , θ ) = S 2 0 ( Q ) 2 ( 3 cos 2 θ 1 )
On the other hand, for Data Set #2, the stress is along the x-axis, so that:
S a n i s o 2 ( Q , θ ) = S 2 0 ( Q ) 2 ( 3 sin 2 θ 1 )
Thus, the difference is:
Δ S ( Q , θ ) = S a n i s o 1 ( Q , θ ) S a n i s o 2 ( Q , θ ) = 3 S 2 0 ( Q ) 2 ( cos 2 θ sin 2 θ ) = 2 S a n i s o 1 ( Q , θ ) S 2 0 ( Q ) 2
Therefore:
S a n i s o 1 ( Q , θ ) = Δ S ( Q , θ ) 2 + S 2 0 ( Q ) 4
Then:
S 2 0 ( Q ) = 1 8 0 π [ Δ S ( Q , θ ) + Δ S ( Q , θ ) ] [ 3 cos 2 θ 1 ] sin θ d θ
because the second term in Equation (17) integrates out to zero using this integration. Usually, S20(Q) is much smaller thanS00(Q), and thus requires a higher precision to determine. By taking the difference in Equation (16), the background and the Compton scattering intensity are automatically removed, making the result more accurate.
14)
Carry out the Bessel transformation to obtain the isotropic and anisotropic PDF:
ρ 0 g 0 0 ( r ) = 1 2 π 2 0 S 0 0 ( Q ) sin ( Q r ) Q r Q 2 d Q
ρ 0 g 2 0 ( r ) = 1 2 π 2 0 S 2 0 ( Q ) [ ( 3 Q 2 r 2 ) sin ( Q r ) Q 3 r 3 3 cos ( Q r ) Q 2 r 2 ] J ( Q r ) Q 2 d Q
Note that the range of Q is limited to Qmax = 4π/λ. Therefore, one has to be careful not to introduce termination errors [4,5].
15)
Calculate the anisotropic PDF for affine deformation using Equation (11).
16)
Sometimes it is not possible to rotate the sample by 90°, for instance when we carry out an in situ measurement using a heavy mechanical testing machine. In such a case, we use an isotropic sample, such as a metallic glass, well annealed and relaxed at a temperature close to Tg, to determine the S20(Q) of the detector using the step 12), and subtract the detector S20(Q) from the result.

3. Results

Here, we show typical results obtained for the sample treated with thermomechanical creep to demonstrate how the anisotropic PDF can be determined. Metallic glass Zr55Cu30Ni5Al10 (Tg = 707 K [8]) with the dimension of 2.5 × 2.5 × 5 (mm) was subjected to compressive stress of 1.0 GPa for 60 min at T = 623 K, which is substantially below the glass transition temperature. Using this process the sample undergoes thermomechanical creep deformation and becomes anelastically distorted. The structure is no longer isotropic, but retains the memory of anelastic deformation [7,9]. After cooling the sample to room temperature, a piece with the dimension of 2 × 0.5 × 2 (mm) was cut out of the sample. The X-ray diffraction measurement was carried out at the 6-ID and 1-ID beam lines of the Advanced Photon Source (APS), Argonne National Laboratory. The incident X-ray energy was set to 100 keV. The beam size was 300 × 300 (μm) and a Perkin-Elmer detector or a GE 2D detector with the pixel size 200 × 200 (μm) and 2048 × 2048 pixels was used. The distance between the sample and the detector was 35 cm, which allowed S(Q) to be determined up to Q = 22 Å−1.
Figure 1a shows the raw data from the 2D detector. In this figure the diffraction ring is actually distorted elliptically, but it is difficult to recognize it by eye. If one takes the difference between Data Set #1 and Data Set #2 the distortion is more clearly seen, as shown in Figure 1b. Both data sets were corrected for absorption, Compton scattering, and sample-independent background from the set-up to obtain S(Q, θ). Then the isotropic and anisotropic S(Q) were determined using Equations (17) and (18). The step size for integration was ∆Q = 0.023 Å−1, ∆θ = 0.052 radian.
Figure 1. (a) High-energy X-ray diffraction pattern from metallic glass Zr55Cu30Ni5Al10, colors indicating intensity; (b) Difference between Data Set #1 (the stress axis vertical) and Data Set #2 (stress axis horizontal).
Metals 06 00022 g001
S00(Q) and S20(Q) thus obtained are shown in Figure 2 and Figure 3. In Figure 3, S20(Q) is compared to S 2 , a f f i n e 0 ( Q ) . They are clearly different due to extensive non-affine deformation and atomic rearrangement as discussed below. The isotropic and anisotropic PDFs, obtained by Equations (19) and (20), are shown in Figure 4 and Figure 5. Again, the anisotropic PDF is compared to the affine anisotropic PDF in Figure 5.
Figure 2. Isotropic structure function S00(Q) for a sample creep deformed at 623 K under 1 GPa for 1 h.
Metals 06 00022 g002
Figure 3. Anisotropic structure function S20(Q). Line in pink shows S 2 , a f f i n e 0 ( Q ) .
Metals 06 00022 g003
Figure 4. Isotropic PDF, g00(r).
Metals 06 00022 g004
Figure 5. Anisotropic PDF g20(r) compared to the affine PDF (red curve).
Metals 06 00022 g005
It is constructive to compare the results with those obtained for a sample elastically deformed at room temperature with the applied stress well below the yield stress. In this case, in order to deform the sample, heavy mechanical testing equipment is involved, which makes it impossible to rotate the sample by 90°. Thus, we followed the procedure (16) to eliminate the effect of anisotropy in the detector. To test this procedure, we prepared two samples out of the metallic glass sample processed by creep treatment. One was a thin plate piece cut out of the sample with the plane parallel to the applied uniaxial stress direction, and the other was cut perpendicular to the stress. As shown in Figure 6, the one parallel to the stress shows a strong S20(Q) component, whereas the one perpendicular to the stress does not.
Figure 6. The S20(Q) determined for two cross-sections of the sample after the creep treatment: With the plane parallel to axial stress and plane perpendicular to the uniaxial stress.
Metals 06 00022 g006
During RT deformation , because the applied stress is below the yield stress, metallic glasses respond to stress elastically following Hook’s law. However, at the atomic level, the structure changes by breaking and forming of atomic bonds, even below the yield stress [10,11]. Compared to the case of creep deformation shown in Figure 5, the anisotropic PDF g20(r) under applied stress is much closer to the affine anisotropic PDF because the deformation is mostly elastic as shown in Figure 7. However, there are significant differences in the first peak area (2–4 Å) of g20(r), which reflect the intrinsically anelastic nature of a glass [11,12]. Figure 5 and Figure 7 cannot be directly compared, because the result in Figure 7 was obtained while the sample was still under stress, whereas that in Figure 5 was obtained after releasing the stress. To allow closer examination of the deviations from the affine PDF, the difference between the affine PDF and the data PDF, ∆g20(r), is shown in Figure 8 for the applied stress of 400 and 1000 MPa. The difference is not limited to the first peak area, but extends to 6 Å or beyond. A part of this relaxation reflects the non-affine elastic strain because of the disorder in the structure [13,14]. However, such an effect is rather small [12], and much of it originates from bond cutting and forming [7], which occurs even in the nominally elastic regime [10,11,12].
Figure 7. The anisotropic PDF, g20(r), determined during in situ experiment at 1000 MPa.
Metals 06 00022 g007
Figure 8. The difference PDF, ∆g20(r) = g20(affine) − g20(data), for the applied stress of 400 and 1000 MPa.
Metals 06 00022 g008

4. Discussion

As shown in Figure 3 and Figure 5, the actual anisotropic S(Q) and PDF are significantly deviated from the one for affine deformation. One way to interpret this deviation is to introduce local strain, which is dependent on r, by fitting the following equation to the data:
g 2 0 ( r ) = ε ( r ) ( 1 5 ) 1 / 2 2 ( 1 + ν ) 3 r d d r g 0 0 ( r )
Figure 9 shows the r-dependent local strain, ε(r), normalized by ε(∞) for creep deformation (blue) and elastic deformation (red). A similar analysis was made earlier using the S(Q) data with Q parallel (θ = 0) and perpendicular (θ = 90°) to the stress axis [15,16,17]. However, in [15,16,17] the strain was determined from the PDF obtained using Equation (19) rather than Equation (20), which introduced some errors. Note that Equation (19) is only valid for isotropic systems, and once the system becomes anisotropic, we have to use the spherical harmonics expansion shown above. The correct procedure with Equation (20) is now widely used [18,19,20].
For creep deformation (blue symbols in Figure 9), the local strain ε(r) is small at short distances and increases with r, saturating to a constant, ε(∞), which is equal to the macroscopic recoverable strain. The total creep strain includes both anelastic strain (recoverable) and plastic strain (unrecoverable). Plastic strain leaves no signature on the structure other than some rejuvenation, and ε(∞) corresponds only to anelastic strain. The difference, Δε(r) = ε(∞) − ε(r), represents screening, or the local strain modification, through atomic rearrangements. The sample that underwent creep was treated thermomechanically at a temperature (623 K), which is below Tg, but high enough to activate anelastic deformation. While the sample was held at this temperature under the stress, anelastic local atomic rearrangements occurred to relax the applied stress. When the sample was cooled down and the stress was removed, the regions in which local atomic rearrangements took place were strained in the opposite direction. The stress produced by these strained regions is balanced by the long-range stress, which corresponds to Gε(∞), where G is the shear elastic modulus. Consequently, the actual strain at the nearest neighbor is only 30% of the total strain at a long range ε(∞) as seen here. The strain is reduced compared to ε(∞) up to 10 Å, indicating that the region of atomic rearrangements extend as far as the fourth neighbor shell.
Figure 9. r-dependent local strain determined from Equation (21) for the sample creep deformed at 623 K under 1 GPa for 1 h (blue), and for the sample under load of 1 GPa at room temperature (red).
Metals 06 00022 g009
In comparison, for elastic deformation (red symbols in Figure 9) the strain is nearly 100%. This is mainly because, in this case, the diffraction measurement was made with the applied stress on, so that much of the strain is truly elastic. Nevertheless, ε(r)/ε(∞) is less than unity at the nearest neighbor distance, due to non-collinear atomic displacement [13] and anelasticity [10,11]. It is noteworthy that the local strain modification, Δε(r) = ε(∞) − ε(r), is much more short-range (only up to 4 Å or so, including only the nearest neighbor shell) for elastic deformation than for creep (up to 10 Å).
In crystals, the topology of atomic connectivity is well defined because of lattice periodicity. Lattice defects, such as dislocations and vacancies, are defined as local deviations from the periodic lattice. In glasses, on the other hand, the topology of atomic connectivity is open, in a sense that it is easily changed by thermal excitation or applied stress, through local bond breaking and forming. Much of the deviations from the affine deformation observed for the anisotropic PDF reflect such local bond rearrangements. The local stresses these rearrangements create are balanced by the long-range stress produced by the long-range strain ε(∞), to make the total stress zero.
These local atomic rearrangements are phenomenologically described in terms of the shear-transformation-zones (STZs), which facilitated the elucidation of mechanical properties [2,3]. Whereas the atomic level details of STZ still remain elusive, a variety of computer simulations, such as References [3] and [24], made the outline of STZs clearer. The reported size of STZ varies greatly, from 20 to few hundred atoms [21,22,23,24]. However, according to our recent work [25,26], the size of STZ is actually much smaller, involving only about five atoms at the saddle point of the potential energy landscape and about 17 atoms after relaxation from the saddle point to the nearest minimum. Atoms involved in STZ form a small cluster with the size extending only to 2–3 atomic distances.
Such a small size of STZ is more consistent with the spatial extension of the atomic rearrangement for the apparently elastic deformation seen in Figure 8 and Figure 9. Therefore, it appears that in the elastic regime the applied stress activates only individual STZs, so that atomic rearrangements induced by stress are limited to immediate locality, not much beyond the nearest neighbors. When the stress is removed, atomic rearrangements in the opposite direction take place. Thus, macroscopically the system appears elastic, and the original dimension is restored when the stress is removed. However, microscopically it is anelastic, in a sense that local atomic rearrangements take place and the local topology of atomic connectivity is altered during deformation. A proof of such an anelastic nature of deformation below the yield stress is the fact that the system can be rejuvenated even during apparently elastic deformation [27].
On the other hand, it was shown that activation of STZ can induce a cascade or avalanche of other STZ actions [26]. The large extension of the zone of atomic rearrangement during creep, as shown in Figure 5 and Figure 9, indicates such avalanche of STZ activity is taking place during thermomechanical creep. Whereas, at room temperature, STZ avalanche occurs only for rapidly quenched unstable samples [26]. Figure 9 suggests that at elevated temperatures it may happen even in well-annealed stable sample. The sample is then cooled down to room temperature for diffraction measurement. When the stress is removed, the original sample dimension is not recovered because some local deformations are anelastically frozen-in. Much of the frozen-in strain is recovered when the sample is relaxed without stress, but a part of deformation becomes plastic by percolation and is never recovered.

5. Conclusions

By their nature, diffraction measurements provide only the information regarding two-atom positional correlation. However, most physical properties depend on more collective atomic correlations, which diffraction measurements cannot directly assess. This problem is exacerbated in liquids and glasses because of strong disorder. Nevertheless, by perturbing the system and looking at the response, it is possible to learn more about the nature of the system. As an example, we discussed the structural response of metallic glasses to applied stress. Applied stress breaks the symmetry of the system, so it becomes possible to carry out measurements with high accuracy by focusing on the emergent symmetry component induced by stress.
Our analysis indicates that anelastic atomic rearrangements at room temperature induced by applied stress below the yield stress are limited to immediate neighborhood of atoms, most likely representing activation of a single STZ. However, when the stress is applied at a temperature close to Tg atomic rearrangements are extensive and spatially more extended, and the sample shows creep deformation. Such deformation must be a consequence of a cascade or avalanche of multiple STZ actions, resulting in macroscopically anelastic behavior. As illustrated in the results above, the study of the structural change due to applied stress using synchrotron X-ray diffraction leads to revelation of atomistic details of the deformation mechanism in metallic glasses when the result are analyzed using the anisotropic PDF method.

Acknowledgments

This work was supported by the US Department of Energy, Office of Science, Basic Energy Sciences, Materials Science and Engineering Division.

Author Contributions

This paper was written by T.E. with the aid by T.Y. and W.D. who provided data and information on experimental details.

Conflicts of Interest

The authors declare no conflict of interest.

References

  1. Greer, A.L. Metallic glasses. Science 1995, 267, 1947–1953. [Google Scholar] [CrossRef] [PubMed]
  2. Argon, A.S. Mechanisms of inelastic deformation in metallic glasses. J. Phys. Chem. Solids 1982, 43, 945–961. [Google Scholar] [CrossRef]
  3. Falk, M.L.; Langer, J.S. Dynamics of viscoplastic deformation in amorphous solids. Phys. Rev. E 1998, 57, 7192–7205. [Google Scholar] [CrossRef]
  4. Warren, B.E. X-ray Diffraction; Dover Publications: New York, NY, USA, 1969. [Google Scholar]
  5. Egami, T.; Billinge, S.J.L. Underneath the Bragg Peaks: Structural Analysis of Complex Materials, 2nd ed.; Pergamon Materials Series, Elsevier: Amsterdam, The Netherland, 2012. [Google Scholar]
  6. Chupas, P.J.; Qiu, X.; Hanson, J.C.; Lee, P.L.; Grey, C.P.; Billinge, S.J.L. Rapid-acquisition pair distribution function (RA-PDF) analysis. J. Appl. Cryst. 2003, 36, 1342–1347. [Google Scholar] [CrossRef]
  7. Suzuki, Y.; Haimovich, J.; Egami, T. Bond‑orientational anisotropy in metallic glasses observed by X-ray diffraction. Phys. Rev. B 1987, 35, 2162–2168. [Google Scholar] [CrossRef]
  8. Yokoyama, Y.; Inoue, K.; Fukaura, K. Pseudo Float melting state in ladle arc-melt-type furnace for preparing crystalline inclusion-free bulk amorphous alloy. Mater. Trans. 2002, 43, 2316–2320. [Google Scholar] [CrossRef]
  9. Dmowski, W.; Egami, T. Observation of structural anisotropy in metallic glasses induced by mechanical deformation. J. Mater. Res. 2007, 22, 412–418. [Google Scholar] [CrossRef]
  10. Suzuki, Y.; Egami, T. Shear deformation of glassy metals: Breakdown of Cauchy relationship and anelasticity. J. Non-Cryst. Solids 1985, 75, 361–366. [Google Scholar] [CrossRef]
  11. Dmowski, W.; Iwashita, T.; Chuang, C.-P.; Almer, J.; Egami, T. Elastic heterogeneity in metallic glasses. Phys. Rev. Lett. 2010. [Google Scholar] [CrossRef] [PubMed]
  12. Egami, T.; Iwashita, T.; Dmowski, W. Mechanical properties of metallic glasses. Metals 2013, 3, 77–113. [Google Scholar] [CrossRef]
  13. Waire, D.; Ashby, M.F.; Logan, J.; Weis, J. On the use of pair potentials to calculate the properties of amorphous metals. Acta Metall. 1971, 19, 779–788. [Google Scholar] [CrossRef]
  14. Maloney, C.E.; Lemaître, A. Amorphous systems in athermal, quasistatic shear. Phys. Rev. E 2006. [Google Scholar] [CrossRef] [PubMed]
  15. Poulsen, H.F.; Wert, J.A.; Neuefeind, J.; Honkimäki, V.; Daymond, M. Measuring strain distributions in amorphous materials. Nat. Mater. 2005, 4, 33–36. [Google Scholar] [CrossRef]
  16. Hufnagel, T.C.; Ott, R.T.; Almer, J. Structural aspects of elastic deformation of a metallic glass. Phys. Rev. B 2006. [Google Scholar] [CrossRef]
  17. Wang, X.D.; Bednarcik, J.; Saksl, K.; Franz, H.; Cao, Q.P.; Jiang, J.Z. Tensile behavior of bulk metallic glasses by in situ X-ray diffraction. Appl. Phys. Lett. 2007. [Google Scholar] [CrossRef]
  18. Mattern, N.; Bednarcik, J.; Pauly, S.; Wang, G.; Das, J.; Eckert, J. Structural evolution of Cu-Zr metallic glasses under tension. Acta Mater. 2009, 57, 4133–4139. [Google Scholar] [CrossRef]
  19. Vempati, U.K.; Valavala, P.K.; Falk, M.L.; Almer, J.; Hufnagel, T.C. Length-scale dependence of elastic strain from scattering measurements in metallic glasses. Phys. Rev. B 2012. [Google Scholar] [CrossRef]
  20. Qu, D.D.; Liss, K.-D.; Sun, Y.J.; Reid, M.; Almer, J.D.; Yan, K.; Wang, Y.B.; Liao, X.Z.; Shen, J. Structural origins for the high plasticity of a Zr-Cu-Ni-Al bulk metallic glass. Acta Mater. 2013, 61, 321–330. [Google Scholar] [CrossRef]
  21. Schuh, C.A.; Lund, A.C.; Nieh, T.G. New regime of homogeneous flow in the deformation map of metallic glasses: Elevated temperature nanoindentation experiments and mechanistic modeling. Acta Mater. 2004, 52, 5879–5891. [Google Scholar] [CrossRef]
  22. Pan, D.; Inoue, A.; Sakurai, T.; Chen, M.W. Experimental characterization of shear transformation zones for plastic flow of bulk metallic glasses. Proc. Natl. Acad. Sci. USA 2008, 105, 14769–14772. [Google Scholar] [CrossRef] [PubMed]
  23. Ju, J.D.; Jang, D.; Nwankpa, A.; Atzmon, M. An atomically quantized hierarchy of shear transformation zones in a metallic glass. J. Appl. Phys. 2011. [Google Scholar] [CrossRef]
  24. Choi, I.-C.; Zhao, Y.; Yoo, B.-G.; Kim, Y.-J.; Suh, J.-Y.; Ramamurty, U.; Jiang, J. Estimation of the shear transformation zone size in a bulk metallic glass through statistical analysis of the first pop-in stresses during spherical nanoindentation. Scr. Mater. 2012, 66, 923–926. [Google Scholar] [CrossRef]
  25. Fan, Y.; Iwashita, T.; Egami, T. How thermally activated deformation starts in metallic glass. Nat. Commun. 2014. [Google Scholar] [CrossRef] [PubMed]
  26. Fan, Y.; Iwashita, T.; Egami, T. Crossover from Localized to Cascade Relaxations in Metallic Glasses. Phys. Rev. Lett. 2015. [Google Scholar] [CrossRef] [PubMed]
  27. Tong, Y.; Iwashita, T.; Dmowski, W.; Bei, H.; Yokoyama, Y.; Egami, T. Structural Rejuvenation in Bulk Metallic Glasses. Acta Mater. 2015, 86, 240–248. [Google Scholar] [CrossRef]

