Article

Probing Interfaces in Metals Using Neutron Reflectometry

by
Michael J. Demkowicz
1,2,* and
Jaroslaw Majewski
3,4,*
1
Department of Materials Science and Engineering, Massachusetts Institute of Technology, Cambridge, MA 02139, USA
2
Materials Science and Engineering, Texas A & M University, College Station, TX 77843, USA
3
MPA-CINT/Los Alamos Neutron Scattering Center, Los Alamos National Laboratory, Los Alamos, NM 87545, USA
4
Department of Chemical Engineering, University of California at Davis, Davis, CA 95616, USA
*
Authors to whom correspondence should be addressed.
Metals 2016, 6(1), 20; https://doi.org/10.3390/met6010020
Submission received: 25 November 2015 / Revised: 7 December 2015 / Accepted: 21 December 2015 / Published: 20 January 2016
(This article belongs to the Special Issue Metals Challenged by Neutron and Synchrotron Radiation)

Abstract

:
Solid-state interfaces play a major role in a variety of material properties. They are especially important in determining the behavior of nano-structured materials, such as metallic multilayers. However, interface structure and properties remain poorly understood, in part because the experimental toolbox for characterizing them is limited. Neutron reflectometry (NR) offers unique opportunities for studying interfaces in metals due to the high penetration depth of neutrons and the non-monotonic dependence of their scattering cross-sections on atomic numbers. We review the basic physics of NR and outline the advantages that this method offers for investigating interface behavior in metals, especially under extreme environments. We then present several example NR studies to illustrate these advantages and discuss avenues for expanding the use of NR within the metals community.

1. Interfaces in Metals

Metals form a wide variety of interfaces, including grain and phase boundaries [1], surface-liquid interfaces [2,3], solidification fronts [4], and mechanical contacts [5]. Although they typically occupy a small fraction of the total volume, interfaces play an outsized role in determining the properties of metals [6,7,8,9]. Understanding interfaces is therefore critical to predicting and controlling the behavior of metals.
Experimental investigation of interfaces presents significant challenges. Because they are often buried within the material, accessing them frequently requires destructive characterization or sample preparation methods, such as transmission electron microscopy (TEM) [10] or atom probe tomography (APT) [11]. Interfaces in metals typically have low thickness; indeed, some are atomically sharp [12]. Thus, characterizing them requires high—sometimes Å-level—spatial resolution. Moreover, certain interfaces only exist at high temperatures and pressures [13,14,15] or under contact with external media, such as gases or liquids [2,16]. Investigating such interfaces requires special in situ characterization methods.
An expanded experimental toolbox promises to accelerate progress in understanding metal interfaces, especially in extreme environments. This paper offers a primer on neutron reflectometry (NR): a characterization method with several advantages for studying metal interfaces [17,18,19,20,21]. NR is a mature experimental tool. The first NR experiments were conducted by Fermi and Zinn [22] and Fermi and Marshall [23]. The technique has experienced continuous improvement since then [17,24,25,26]. Nevertheless, use of this method within the metals community has been relatively limited. We illustrate the potential benefits of NR to investigations of interfaces in metals by explaining the physics of the NR experiment and by presenting several example studies.

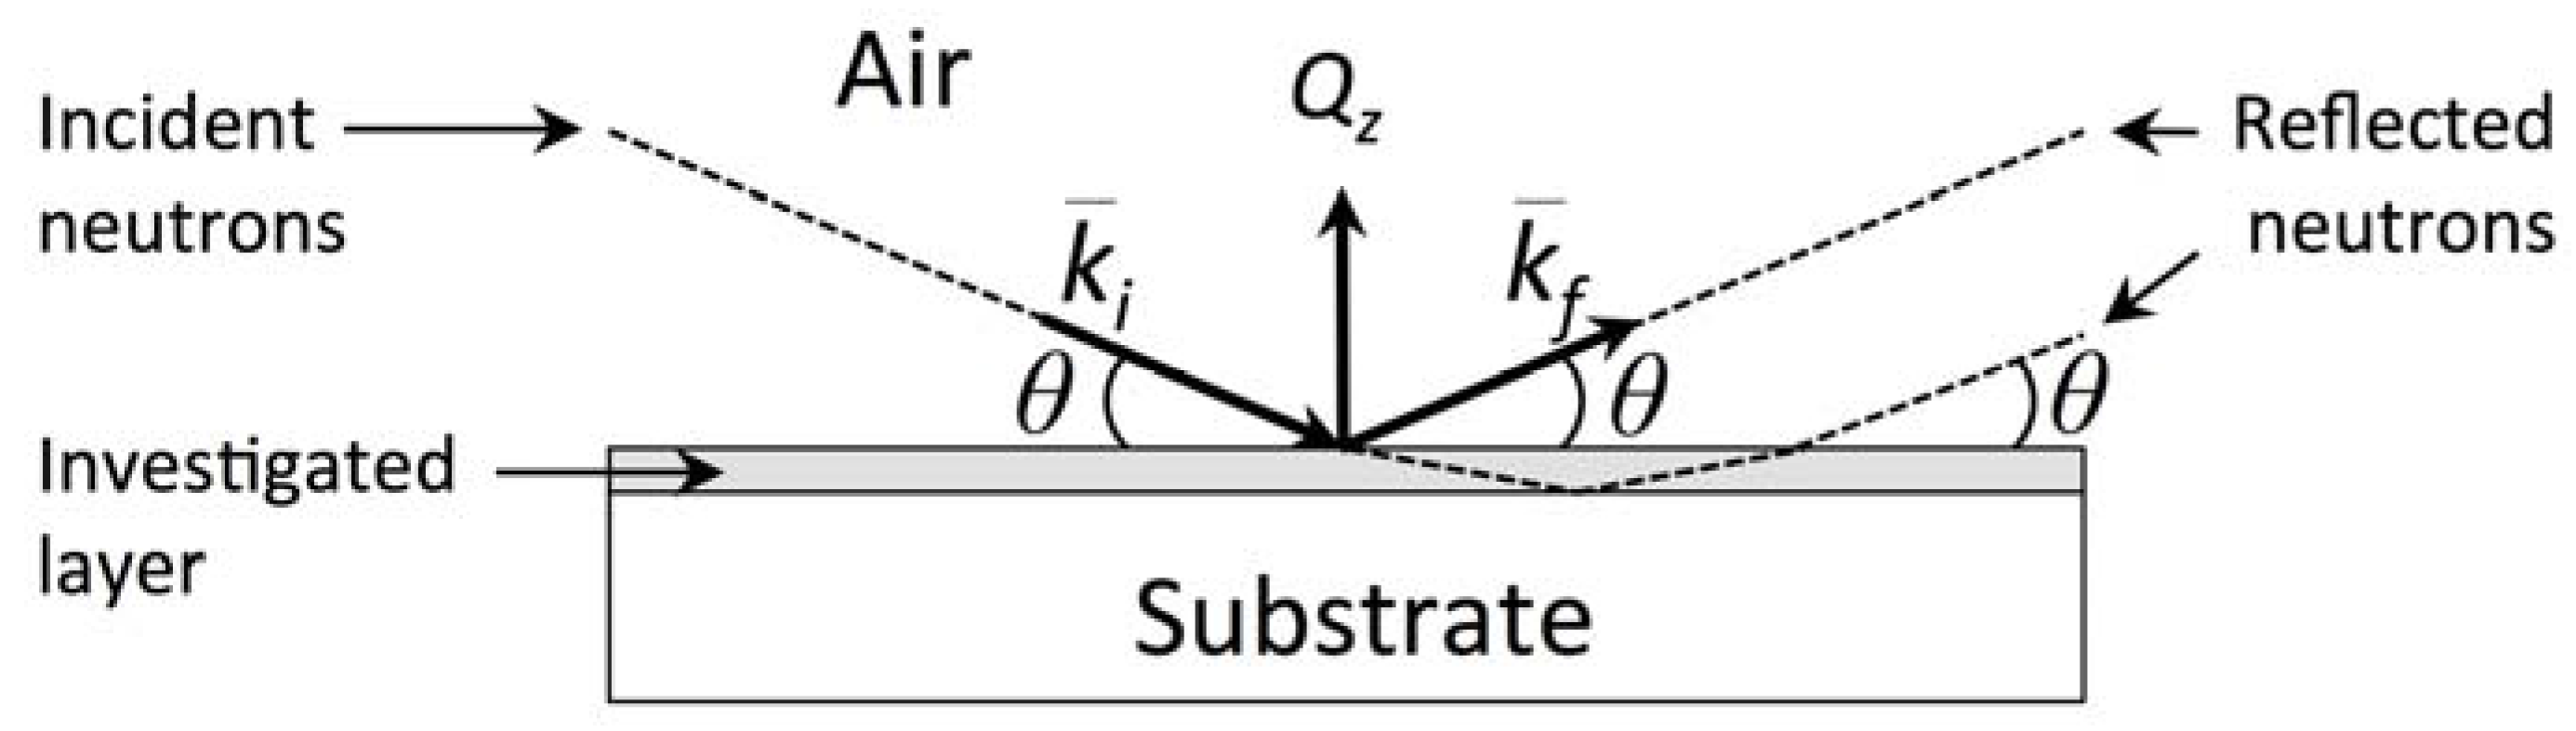
2. The Physics of Neutron Reflectometry (NR)

Figure 1 shows a schematic of a typical NR measurement. The sample is a thin, planar film on a substrate. The experiment is usually conducted in air or vacuum, but may also be carried it out in other media (e.g., see Section 6.4) [27]. The neutron source may be a fission nuclear reactor or a spallation source. In the nuclear reactor, the sustained nuclear fission of 235U- or 239Pu-rich fuels immersed in H2O, D2O, or solid graphite produces neutrons that may be used for scattering experiments. Spallation sources usually utilize pulsed high-energy (~GeV) protons to bombard targets made of heavy elements (such as W, Hg, U) to extract neutrons [28,29].
Figure 1. Schematic of a neutron reflectometry measurement.
Metals 06 00020 g001
In material property studies, the neutrons extracted from nuclear reactors or spallation sources are moderated to decrease their energies and therefore increase their wavelengths to Å ranges. Such moderation, depending on the final wavelength of neutrons required, is usually achieved by passing high-energy neutrons through H2O, liquid H2, or solid methane. Low energy neutrons are typically detected indirectly through absorption reactions with materials of high cross-sections for such reactions. Typically, 3He, 6Li, or 10B is used to emit high-energy particles, whose ionization signatures may be detected by a number of means.
Upon interacting with the sample at a particular angle of incidence, θ (or a particular value of the neutron momentum transfer vector, Qz), the incoming neutron beam can undergo absorption, reflection, transmission, or refraction. Consequently, there is a difference between the intensity of the outgoing, specularly reflected neutron beam and that of the incident beam. This difference—measured as a function of Qz—encodes information about the distribution of the nuclear scattering length density along the direction normal to the sample surface. Moreover, the neutron is a ½-spin fermion and possesses a magnetic moment oppositely oriented to the spin. Therefore, its interaction with matter may depend on the sample’s spin or magnetic field. Neutrons interact both with nuclear spins and the magnetic moments of unpaired electrons via dipole-dipole processes. Interactions with unpaired electrons may be of similar magnitude as nuclear scattering. However, they are not inherently isotropic. Rather, they depend on the orientation of the sample’s magnetization vis-a-vis the direction of the neutron momentum wavevector transfer Qz: only the component of sample’s magnetization which is perpendicular to Qz affects the neutron scattering. Therefore, the intensity of specularly reflected neutrons measured as a function of Qz also encodes information about the distribution of the magnetization in the sample as a function of depth [30].
Depending on the specific NR technique, NR can take advantage of a range of different neutron-sample interactions [31]. However, this short review focuses on elastic specular NR, which is by far the most widely used NR technique. Elastic scattering conserves energy. Thus, we exclude any energy-dissipating neutron-matter interactions, except neutron absorption. In specular NR, the detector is positioned so as to measure outgoing neutrons at the same angle of incidence as the incoming neutrons, as illustrated in Figure 1. The experiment measures reflectivity, R, defined as the ratio of the number of reflected neutrons to the number of incoming neutrons.
The de Broglie expression, λ = h m n v , relates the neutron’s wavelength λ with its momentum, p = mnv (where h is Planck’s constant and mn = 1.6749 × 10⁻²⁷ kg is the neutron mass). Based on this formula, some simple relationships between the wavelength λ (Å), energy E (meV), and speed v (m/s) of the neutron can be developed: E = 81.89/λ2 and v = 3960/λ. Thus, for example, a neutron with de Broglie wavelength of 1.5 Å has an energy E = 36.4 meV and velocity v = 2640 m/s. NR utilizes neutrons with wavelengths from sub-Å to tens of Å. By contrast, the size of an atomic nucleus is on the order of ~10 fm (1 fm = 10−15 m = 10−5 Å). Thus, to an excellent approximation, the incoming neutrons may be thought of as waves interacting with a uniform medium whose properties are determined by the density and type of atoms it contains. Their behavior may be described using Schrödinger’s equation.
The assumption of elastic and specular conditions greatly simplifies the analysis the NR measurement. We further assume that the scattering properties of the sample vary only in one direction—namely, along the sample’s normal—and therefore the components of the neutron wavevector parallel to the sample surface are not affected. Under these conditions, the component of the neutron wavevector parallel to the sample surface is conserved and the magnitude of the outgoing wavevector, k f , equals that of the incoming wavevector, k i : | k i | = | k f | = 2 π λ . The difference between them, Q z = k f k i , is known as the “momentum wavevector transfer” and lies perpendicular to the sample surface. From the geometry of the measurement (Figure 1), we calculate | Q z | = Q z = 4 π sin ( θ ) λ .
Quantum mechanics describes the incoming and outgoing neutron beams as a wavefunction, ψ, consisting of a superposition of plane waves:
ψ ( x ) = e i k i x + r e i k f x
Here, r is the amplitude of the outgoing (reflected) wave, normalized by the amplitude of the incoming wave (taken as unity). Knowing r, we may calculate reflectivity as R = | r | 2 . To compute r, however, we must model the interaction of the incoming neutron beam with the sample and substrate.
Because the component of the wavevector parallel to the sample surface is conserved, we may rewrite ψ as solely a function of z—the distance perpendicular to the sample surface—and k i —the component of k i in the z-direction:
ψ ( z ) = e i k i z + r e i k i z
where we have used k f = k i . Indeed, the entire NR measurement may be analyzed as a one-dimensional problem in the z-direction [32]. We write down wavefunctions of the type shown in Equation (2) for every distinct layer of material in the experiment, including air (or any other external medium), every layer of material in the sample, and the substrate (though in the substrate there is no reflected wave).
In free space, the neutron has kinetic energy E k = 1 2 m n v 2 and zero potential energy (if gravity is neglected). By contrast, within a material, it has a potential energy given by the Fermi pseudopotential [33]:
V Fermi = h 2 β 2 π m n
where β is the nuclear scattering length density (SLD). β describes the mean neutron scattering effectiveness of the material, which depends on the number of nuclei of type i per unit volume, Ni, and the coherent neutron scattering length, bi:
β = i N i b i
bi may be complex with its imaginary component describing absorption. Its real part may be either positive or negative, depending on the isotope [34,35]. Since neutrons have spin, their interactions with magnetic materials require an extended description that tracks changes in spin polarization [30]. The interaction of a neutron’s spin with atomic magnetism (or other source of magnetic induction) can lead to magnetic scattering length density distributions that may be of the same order of magnitude as the nuclear scattering length densities. However, depending on the neutron’s spin orientation (spin-up or spin-down) vis-à-vis the magnetic field of reference, the magnetic component is either added or subtracted from the nuclear one.
Often, samples investigated by NR may be described as a stack of discrete layers: each with its own composition, density, and thickness. In such cases, the NR experiment may be described with a 1D, time-independent Schrödinger equation on a piece-wise linear potential [19,26,32]. By matching wave functions and their derivatives at the interfaces between successive layers (as well as in the surrounding medium and in the substrate), one may solve for the amplitudes of all the waves in the setup. In particular, r—the amplitude of the outgoing wave measured at the sample surface—may be found. This amplitude comes about by coherent interference of partial waves on all interfaces in the film. From it, we determine the quantity measured by the neutron detector in Figure 1: reflectivity, R.
Thus, the SLD and thickness of the sample and substrate determine R. Since SLD in turn depends on composition and density, R is an indirect measure of these characteristics as well as the thickness of the individual material layers in the sample and substrate [17,26]. The goal of the reflectivity experiment is to measure R(Qz) and then infer β(z) by fitting a model of the SLD distribution to the data. Qz may be varied by changing the angle of incidence, θ (if the neutron beam is monochromatic, i.e., λ = const.), or by changing the neutron wavelength, λ. The latter method of varying Qz is typical of NR measurements at facilities where different neutron wavelengths, λ, are distinguished by the time of flight method. Figure 2 shows calculated reflectivity curves corresponding to a 500 Å Ni film on a quartz substrate in air. To illustrate the sensitivity of NR to isotopic composition, the calculation is carried out for two different isotopes: 58Ni and 62Ni.
Figure 2 illustrates some of the common features of reflectivity curves. Whenever the energy of the neutron is at or below the potential of the substrate (i.e., whenever k i 2 4 π β substrate ), the neutrons are totally reflected from the surface. The onset of total reflection is called the critical edge and the value of Qz at that point is referred to as Qcritical. The fringes in Figure 2 arise from interference between waves reflected from the top surface and the buried interface between the substrate and the layer. For this simple case, the spacing of the fringes may be calculated analytically: d fringe = 2 π t layer , where tlayer is the thickness of the Ni layer. The amplitude of the fringes relates to the contrast between the layer and the substrate. The overall falloff of the curve obeys the Fresnel law: R Q z 4 . Most interfaces are not discontinuous, but rather graded due to chemical mixing or surface roughness. The surface roughness (which can be characterized by the root mean square displacement from the average interface, σ) may also be obtained from the reflectivity curve [36,37]. In general, the falloff of R(Qz) for rough or diffuse interfaces is even faster than that given by Fresnel’s law.
Figure 2. Calculated neutron reflectivity curves for 500 Å films of 58Ni (dashed line) and 62Ni (solid line) on a quartz substrate. The inset shows the SLD distributions for each isotope. The simulation was performed using MOTOFIT assuming RMS roughness parameters of 5 Å and the experimental resolution ΔQz/Qz = 3%.
Metals 06 00020 g002

3. Interpreting Reflectivity Curves

R(Qz) contains information about the SLD distribution perpendicular to the sample surface, β(z). Inferring β(z) from R(Qz), however, is not trivial [38]. Because the NR measurement only collects the intensity of the reflected beam and not its phase, there is no unique mathematical transformation from R(Qz) to β(z). Therefore, NR data is usually interpreted by iteratively adjusting a trial SLD distribution, β ¯ ( z ) , until the reflectivity it predicts, R ¯ ( Q z ) , matches the measured reflectivity, R(Qz), to within a specified tolerance.
The continuous function β(z) may often be approximated by a series of discrete layers—referred to as “boxes” or “slabs”—each with a constant SLD. Inter-layer roughness may be taken into account using an error function centered at each interface [36] or any other relevant functional form. A theoretical NR curve, R ¯ ( Q z ) , may be calculated from a trial SLD distribution, β ¯ ( z ) , using the Parratt recursion formula [39,40], which relates the amplitudes of the reflected and transmitted waves at each interface. A number of approaches have been developed for adjusting β ¯ ( z ) to minimize the difference between R ¯ ( Q z ) and R(Qz). One example is the Levenburg-Marquardt nonlinear least-squares method used in open-source reflectivity package, MOTOFIT, which runs in the IGOR Pro environment [41]. This method seeks the least-squares fit of reflectivities, corresponding to a minimum χ2 value. SLD models with the least number of boxes are usually preferred as they involve the smallest number of fitting parameters.
Once a best-fit set of model parameters is achieved, the uncertainties of these parameters may also be quantified by measuring the increase in χ2 that comes about from perturbing each individual fitting parameter. For example, Reference [42] defines χ ˜ 2 as the deviation of the reflectivity calculated using the perturbed parameter values from the best-fit reflectivity:
χ ˜ 2 = i = 1 N ( y i b f y i p y i b f )
Here, y i b f is the best-fit to the measured reflectivity, y i p is the reflectivity value obtained by perturbing one parameter of the structural model, and N is the number of data points. The uncertainties on the fitting parameters are then defined as bounds within which χ ˜ 2 is 5% or less.
Equation (4) shows that, at any given z, β(z) depends on the number and types of isotopes in the sample as well as their volume density. Thus, β(z) provides information concerning the composition and density at a depth z. Inferring these quantities from β(z) typically requires prior knowledge of some of the variables (e.g., nominal compositions or densities) or further input from other characterization methods. It should be re-emphasized that the SLD density profiles obtained from the fitting procedures described above are not unique. Due to the fact that only the intensities of scattered neutrons are measured in the NR experiment, but not their amplitudes and phases, there is no unique mathematical transformation leading from R(Qz) to SLD profile. Therefore, to resolve this problem, other data (e.g., from complementary characterization techniques) are often needed. In some cases, the phase of scattered neutrons may be resolved, as described by the work of Majkrzak and Berk [43,44,45] and others [46,47,48,49], enabling better inferences of SLD profiles.

4. Advantages of NR

Neutron reflectometry offers unique advantages for characterizing solid-state interfaces in metals, including in extreme environments. Some of these advantages are easily deduced by considering the dependence of coherent scattering length, bi, on atomic number, Z. Figure 3 shows that bi is rather weakly dependent on Z. Indeed, the scattering lengths of almost all elements (in their natural isotopic abundance) are of the same order of magnitude. Therefore, in general, no one element can dominate the scattering of a multi-component sample, drowning out the contributions of other elements. In particular, light elements—such as H/D or He—may be detected, even when embedded in a matrix of heavy elements, e.g., of actinides. Moreover, NR is often able to distinguish elements with small differences in atomic number.
Figure 3. Neutron coherent scattering length, bi, as a function of atomic number, Z. The X-ray scattering length is computed using Equation (6).
Metals 06 00020 g003
Figure 3 also shows that there are marked differences in bi between different isotopes of certain elements. Thus, NR is well suited to investigations that require tracking of isotopes, such as tracer diffusion studies. Isotopic substitution may also aid in the interpretation of β(z) profiles. For example, Ni has five different isotopes. The bi for 58Ni (abundance 68.3%) is 14.4 × 10⁻⁵ Å, whereas for 62Ni (abundance 3.6%) bi is negative and equals −8.7 × 10⁻⁵ Å. Substitution of 58Ni (bulk SLD = 13.3 × 10⁻⁶ Å−2) for 62Ni (SLD = −7.5 × 10⁻⁶ Å−2) significantly changes NR curves, as illustrated in Figure 2. Moreover, because neutron beams may be spin polarized, NR is especially well suited to investigations of magnetic properties of materials [50,51].
To appreciate the above-mentioned qualities, it is useful to compare NR with X-ray reflectometry (XRR) [52,53,54]. Although the mathematical description of XRR is similar to NR, the underlying physics of scattering is different: X-rays scatter from atoms’ electrons while neutrons scatter off of atoms’ nuclei. To interpret XRR experiments, we can replace the neutron coherent scattering lengths, bi, in Equation (4) with the X-ray scattering lengths:
b Z X-ray = Z ( 2.81 f m )
where Z is the atomic number and 2.81 fm is the classical radius of the electron. Because X-rays scatter primarily from electrons, b Z X-ray is directly proportional to the number of electrons per atom, i.e., to the atomic number, Z, in charge-neutral materials. Consequently, XRR cannot detect differences between isotopes. Moreover, because it is a linearly increasing function of Z, b Z X-ray provides very little contrast between elements with small Z differences. Finally, light elements—especially when embedded in high-Z matrices—are essentially undetectable with XRR, as the X-ray scattering length of the latter dominates reflectivity curves. However, it is often advantageous to use XRR and NR in tandem, as they may provide complementary information.
Equation (4) shows that scattering length density, β, is not only a function of bi, but also of Ni: the number density of isotope i. Thus, depth profiles obtained by NR (and XRR) are sensitive not only to composition, but also to density. By contrast, depth profiles obtained through Rutherford backscattering are not sensitive to density [55]. NR is therefore capable of characterizing the evolution of porosity and of detecting displacive phase transformations that involve changes in density.
NR is also remarkable for its depth resolution, which is much greater than for XRR, especially for high-Z materials. Usually, NR techniques enable investigations of structures with total thickness up to ~3000 Å. For such thickness, the spacing between the scattering fringes (Figure 2) is very small, requiring very high ΔQz/Qz resolution in the neutron detection. Typical ΔQz/Qz values for existing neutron reflectometers are in the range from 2% to 5%. An instrumental resolution of ΔQz/Qz = 2% will result in the ability to distinguish between two thickness values which differ by 2%. Therefore differences of the film thickness on the order of Å can be readily detected. Smaller ΔQz/Qz values may be achieved using detectors with higher spatial resolutions, better beam collimation, or better discrimination of the neutron wavelengths. However, increasing the resolution may result in smaller incident beam intensities, which can lead to longer measurements times and therefore higher scattering background. Thus, a proper balance between the two must be found. In general, it is advisable to adjust the resolution to match the expected thickness of the investigated films. Thick films, which give rise to dense oscillations of the interference fringes in R(Qz), require higher resolutions. By contrast, thin ones with broad interference oscillations in R(Qz) can be measured with lower resolution and therefore higher intensities, which can result in shorter measurement times and higher Qzmax values.
Another advantage of NR is due to the ability of neutrons to penetrate deeply into solid matter. Several mm thick aluminum, quartz, silicon, or stainless steel windows absorb only a small fraction of incident neutrons with wavelengths in the Å range. Thus, NR measurements may be carried out to investigate the structure of buried interfaces as well as samples immersed in liquids or shielded from their environments by neutron-transparent containers. This quality is especially useful for investigating materials exposed to volatile media or under high pressure. Finally, NR frequently requires straightforward sample preparation and is not destructive. Therefore, samples investigated with NR may be subsequently further analyzed using other characterization methods. However, certain materials may be activated through interactions with the neutron beam, requiring some time for the radioactivity to decay before further characterization may be performed. It is also important to note that, since NR data are normalized to the incident neutron intensity, the measured SLD values are absolute.

5. Practical Considerations

Because neutron sources are inherently week (fluxes of ~106–7 n/s/cm2), the samples used for NR must be large. Samples with an area as small as 1 cm2 may be measured, but at the expense of longer time of data acquisition and increased background noise. Neutron spallation sources usually provide some advantages enabling faster NR measurements. This is due to the polychromatic nature of the pulsed neutron beams they generate and the time of flight method used to discriminate between different neutron wavelengths, λ. NR spectra within a limited Qzmax range (<0.1 Å−1) can be obtained in 5–10 min. However, to obtain a full-spectrum NR data set (usually with Qzmax ≈ 0.3 Å−1 and R ≈ 10−6) requires from one to several hours of measurement time, regardless which neutron source is used.
Existing NR beamlines usually provide point-, line-, or 2-D neutron scattering detectors. Line- and 2-D detectors enable recording of scattering signals beyond the specular reflection: the so-called “off-specular” reflections. The “off-specular” data provides the neutron intensity distribution as function of the components of the neutron momentum transfer vector parallel to the sample’s surface. This information can provide additional insight to extend the interpretation of the specular reflectivity measurements regarding in-plane correlations of the samples studied [56]. For example, these data allow correlations between the roughness of different interfaces or the growth of in-plane islands to be addressed. Reflectivities at high Qz values are of great interest as they allow access to shorter length scales, which are important for characterizing the detailed structure of the investigated films. However, as already mentioned, the reflectivity R rapidly decays as Qz−4, making it difficult to acquire data at high Qz. This challenge may be mitigated to some extent through the preparation of high quality samples: by minimizing the roughness of the sample surface as well as the roughness of its internal interfaces, high quality NR data at high Qz and low R values may be collected. RMS roughness parameters up to 20 Å are usually tolerable, but detailed NR investigations typically require RMS roughness below 5 Å. Samples with such low roughness are most conveniently prepared using vapor deposition techniques. For such samples, R ≈ 10−6 and Qzmax ≈ 0.2–0.3 Å−1 can be routinely achieved for sample areas of several cm2.
At the time of writing, there are several world-class NR instruments available worldwide, e.g., at the Spallation Neutron Source at Oak Ridge National Laboratory, the Lujan Center at Los Alamos National Laboratory, NCNR at NIST, the Institute Laue-Langevin in France, J-PARC in Japan, ANSTO in Australia, FRM-II in Germany, and several others. Several neutron sources are currently under construction or discussion. For example, the European Spallation Source in Sweden and the Second Target Station at SNS/ORNL will provide excellent capabilities for NR.

6. Example Applications of NR to Metals

This section provides examples of NR measurements conducted on metals. The examples are chosen to illustrate the unique advantages of the NR, namely its ability to detect density changes (Section 6.1), its sensitivity to magnetic moments and complementarity to X-ray reflectometry (XRR, Section 6.2), its sensitivity to light elements (Section 6.3), and its ability to penetrate through container walls (Section 6.4).

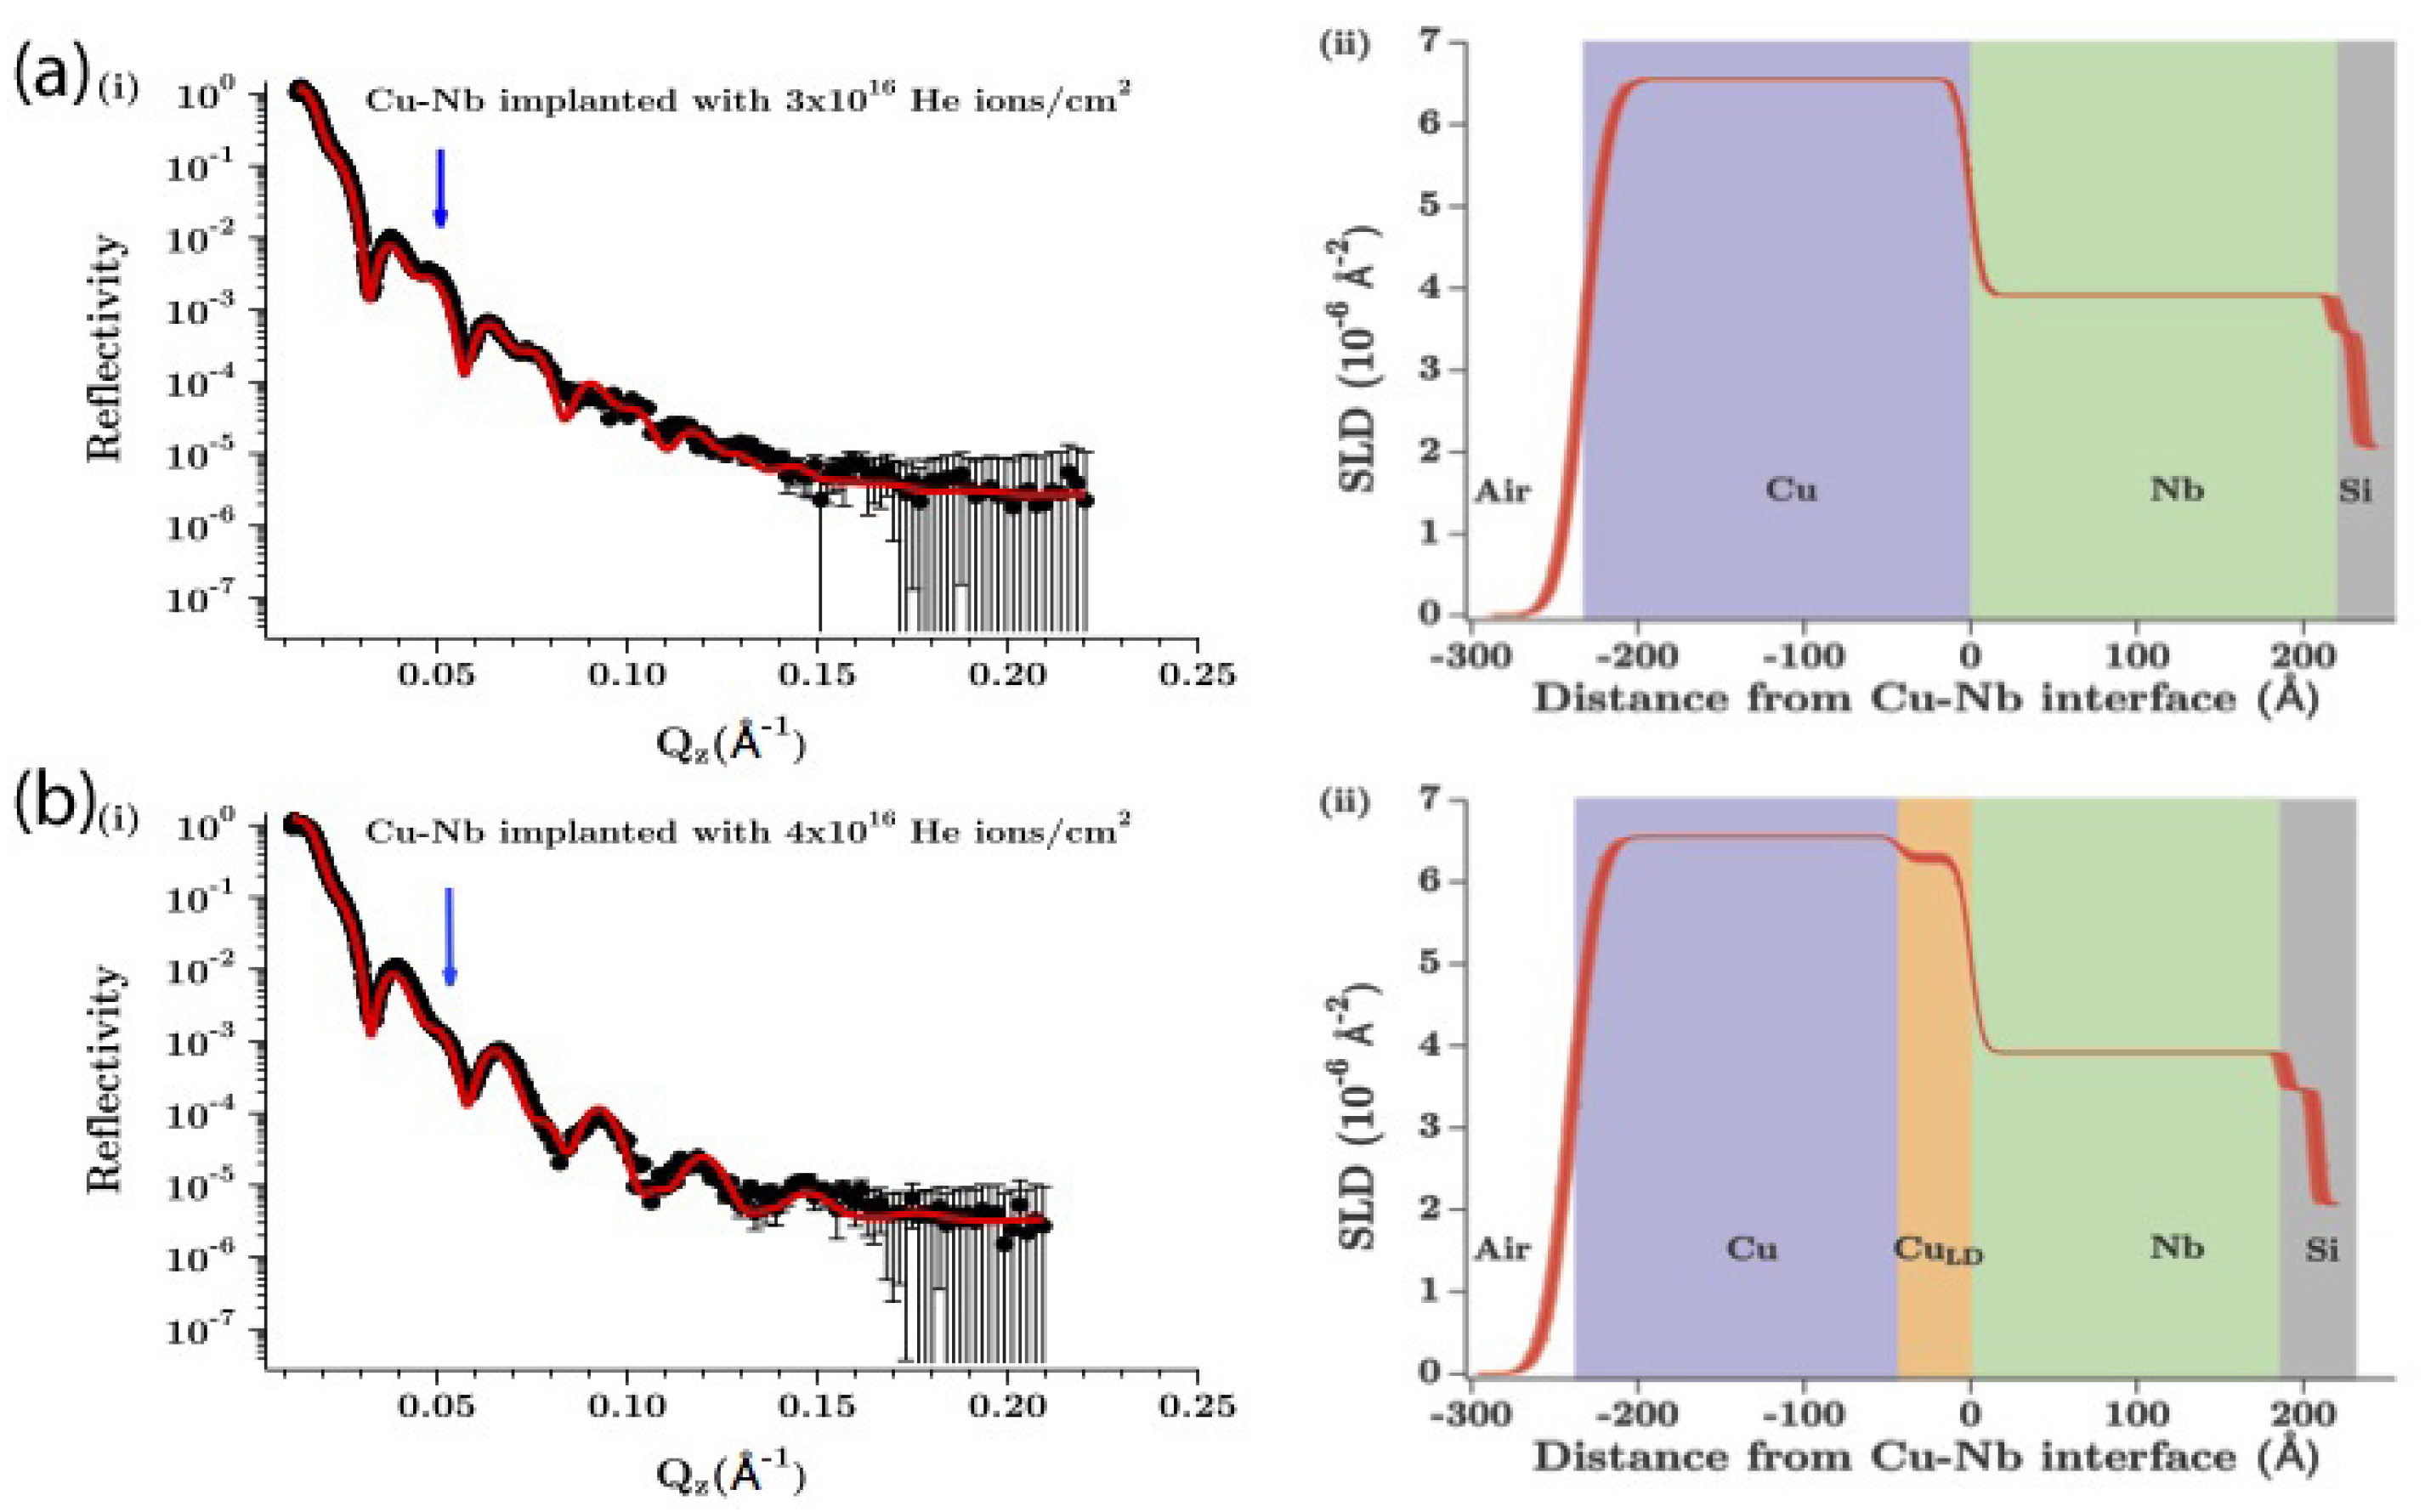
6.1. He in fcc/bcc Composites: Detecting Density Changes

Some nuclear transmutation reactions give rise to alpha particles, i.e., nuclei of 4He. When implanted into solids, these particles rapidly come to rest, pick up two electrons, and become regular He atoms. Since He is a noble gas and does not bond with surrounding atoms, it usually has negligible solubility within solids [57]. Thus, it precipitates out of solution into nanometer-scale bubbles [58]. These precipitates are usually deleterious to the properties of the solid, e.g., they lead to embrittlement in Ni-base alloys [59] and surface damage in plasma-facing materials [60]. Much effort has been invested into mitigating damage induced by implanted He, especially in materials for nuclear energy [61,62,63,64].
One way of controlling implanted He is to trap it at specially designed internal interfaces in composite materials [61]. However, investigations of this effect are limited by the difficulty of characterizing He precipitates at internal interfaces. NR (and XRR) provides a distinct advantage within this context: its sensitivity to local density changes enables detection of the onset of He precipitate formation [42,65,66].
Kashinath et al. investigated He precipitation at interfaces between copper (Cu) and one of three body-centered cubic (bcc) metals: niobium (Nb), vanadium (V), and molybdenum (Mo) [42]. They found that each of these interfaces has a distinct critical He dose at which precipitates begin to form. Figure 4 illustrates the findings of this study. Upper and lower bounds on best-fit SLD profiles were estimated by superimposing the upper and lower error bounds for each individual fitting parameter, as defined in Section 3. All SLD profiles with χ ˜ 2 less than or equal to 5% are contained within these bounds, but the converse is not true: not all SLD profiles within these bounds have χ ˜ 2 less than or equal to 5%. Therefore, these uncertainty estimates for best-fit SLD profiles are conservative.
The target is a Cu/Nb bilayer deposited on a Si substrate. Both the Cu and the Nb layer are approximately 20 nm thick. After implantation of 20 keV 4He+ ions to a dose of 3 × 10¹⁶/cm2, the reflectivity of the sample is consistent with an unaltered Cu/Nb bilayer structure, as shown in Figure 4a. However, upon implantation to a slightly higher He dose of 4 × 10¹⁶/cm2, there is a clear change in the reflectivity, indicated by arrows in Figure 4a,b. This change may be explained by the formation of a layer of reduced density on the Cu side of the Cu–Nb interface, as illustrated in Figure 4b.
Figure 4. Reflectivity curves (left column) and SLD profiles (right column) for (a) 3 × 10¹⁶/cm2 and (b) 3 × 10¹⁶/cm2 He ions implanted in a Cu/Nb bilayer on a Si substrate. Reprinted with permission from Reference [42]. Copyright (2013), AIP publishing LLC.
Metals 06 00020 g004
At the He doses used in this study, nearly all the implanted He is believed to either escape through the Cu free surface or become trapped at the Cu–Nb or Nb–Si interfaces [42]. Precipitation within the Cu or Nb layers themselves is thought to be minimal. Thus, the low-density layer adjacent to the Cu–Nb interface in Figure 4b is thought to arise from the formation of He precipitates there. The critical He dose of 4 × 10¹⁶/cm2 is consistent with preceding transmission electron microscopy (TEM) studies [61,67] as well as atomistic simulations [68]. However, whereas those previous investigations merely inferred interfacial precipitation, NR is able to observe it directly.

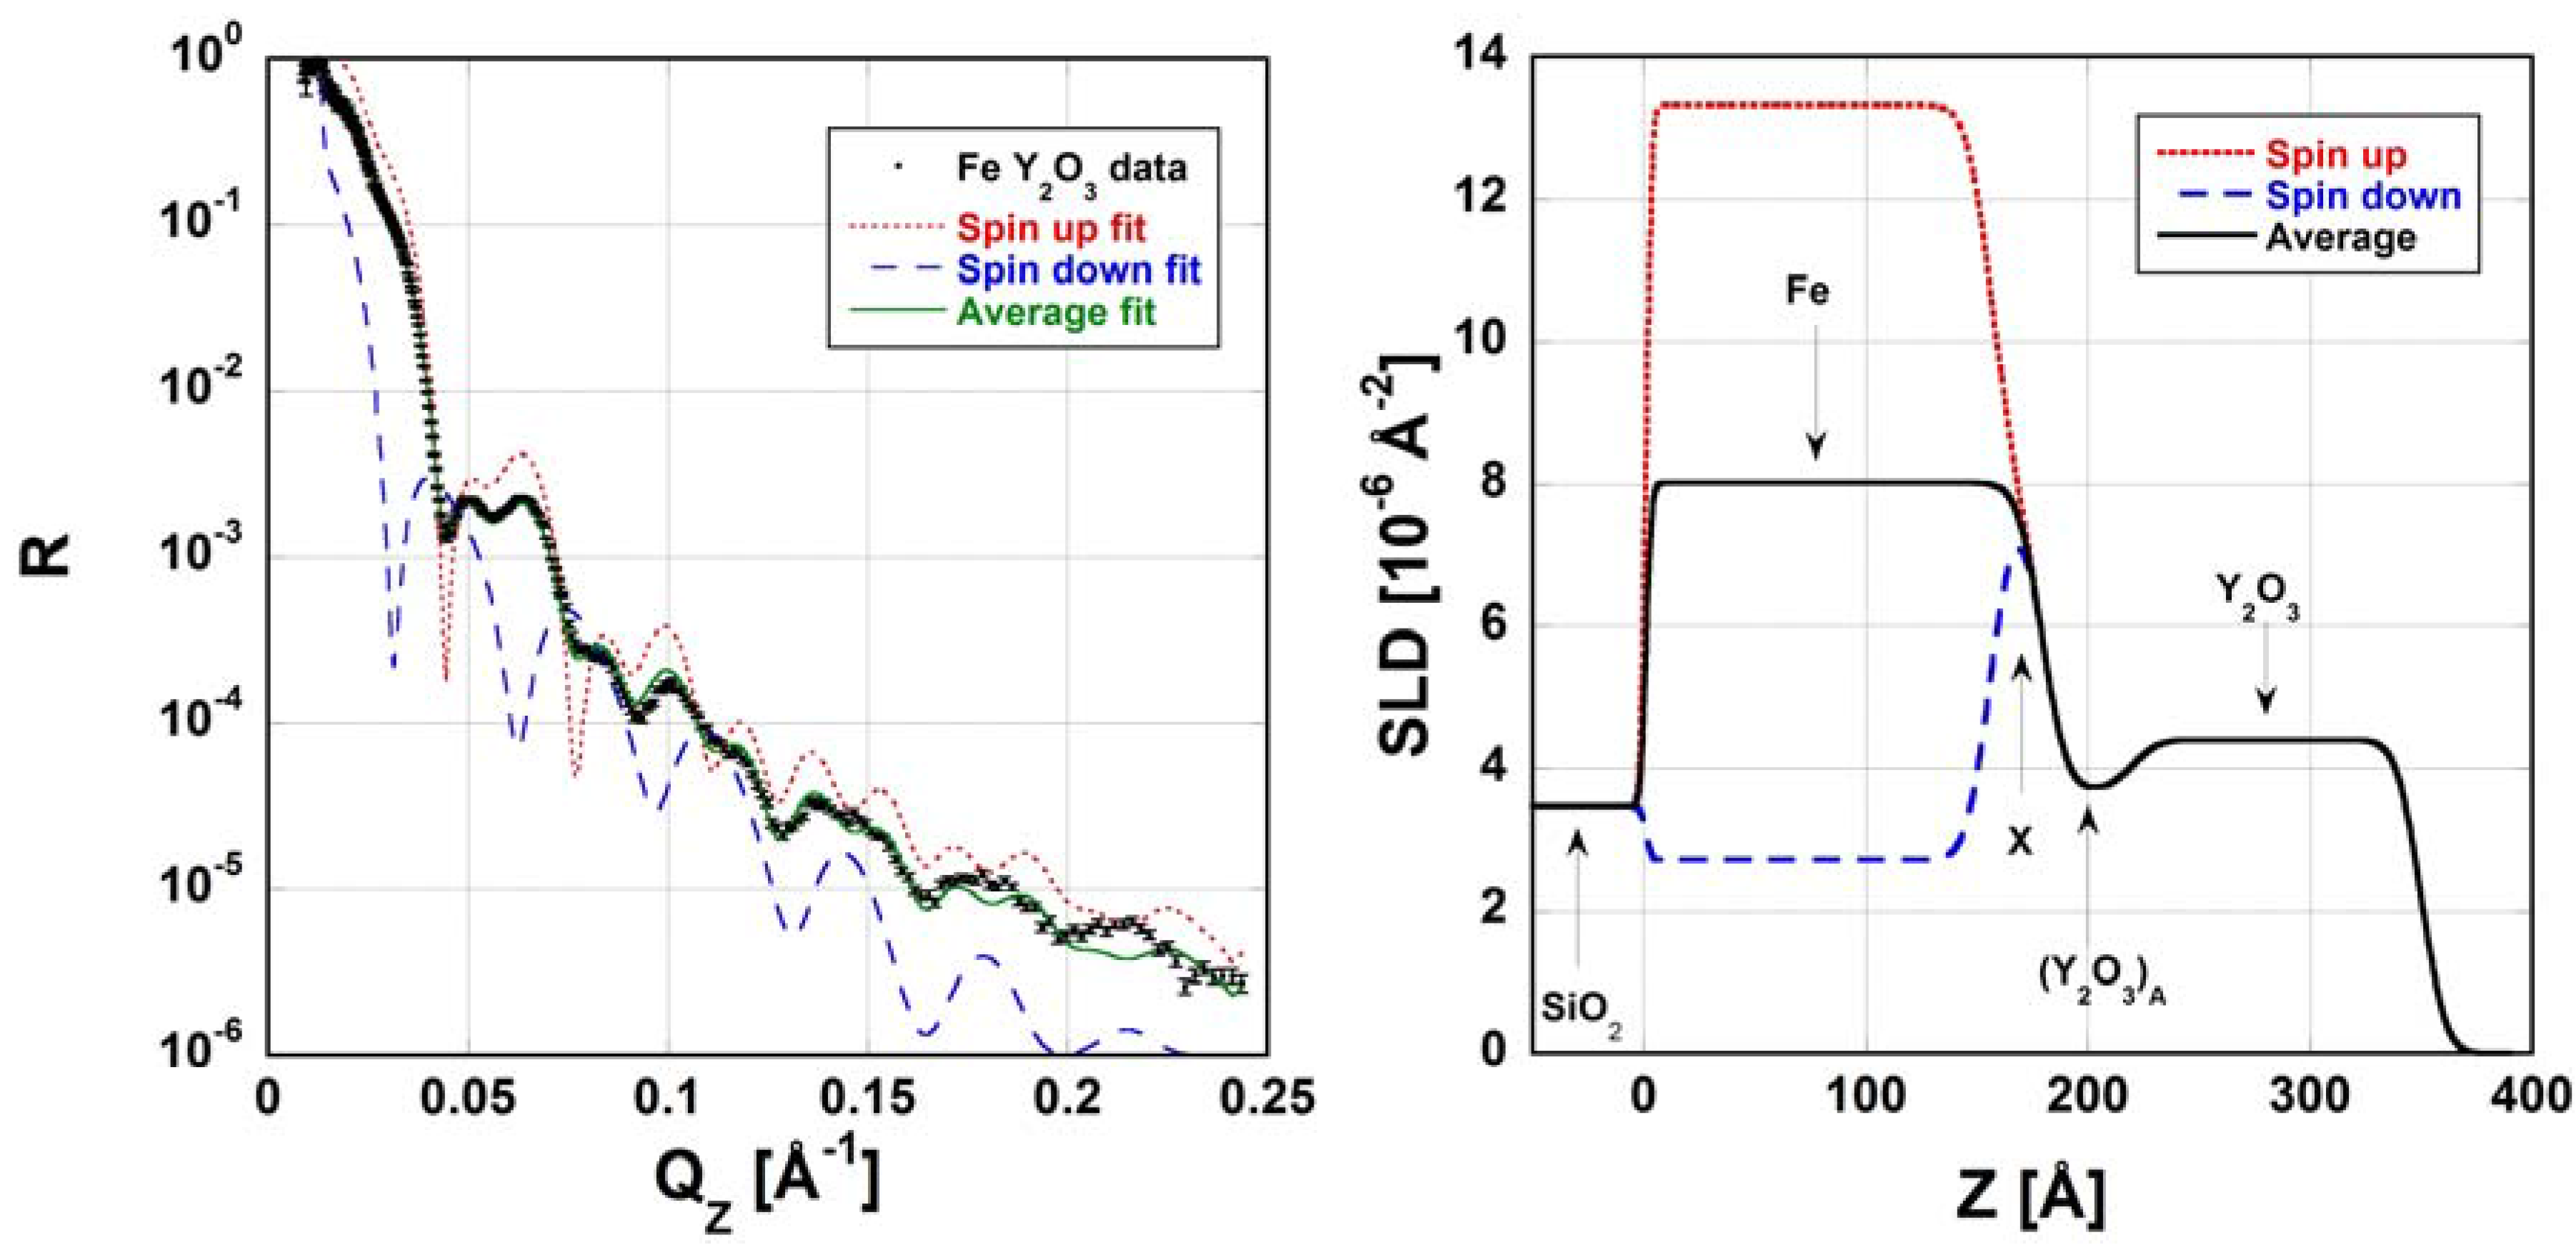
6.2. Fe/Y2O3 Interface: Sensitivity to Magnetization and Complementary to XRR

The structure of interfaces between low solubility metals—such as those discussed in the previous section—is easy to describe, as these interfaces are usually atomically sharp [12]. By contrast, the structure of oxide/oxide or metal/oxide interfaces is much more difficult to assess. Such interfaces are often several nanometers wide [69], exhibit transitions in structure reminiscent of phase changes [8], and contain intrinsic defects with distinct local compositions [70]. NR provides several advantages for investigating such interfaces, including high depth resolution and sensitivity to composition.
Watkins et al. used NR to study the structure of an interface between α-Fe and Y2O3 [71]. They found that this interface is a ~64 Å-thick transitional zone containing mixtures or compounds of Fe, Y, and O. By comparing their NR data to XRR and X-ray diffraction (XRD) measurements, they further determined that the interface was likely compositionally sharp upon synthesis and only later broadened as the neighboring crystals reacted. Finally, since α-Fe is ferromagnetic while Y2O3 is not, Watkins et al. were able to track changes in magnetization across this interface. Figure 5 shows that to model the reflectivity of this interface, contributions of spin-up and spin-down states of the neutron beam must be averaged. By using comparing the SLD profiles of these two states, the exact depth at which the ferromagnetic ordering is lost may be found (marked with an “x” in the right panel in Figure 5).
Figure 5. The neutron reflectivity (left) of the α-Fe and Y2O3 interface investigated by Watkins et al. is the average of SLD contributions from spin-up and spin-down states of the neutron beam (right). The depth at which ferromagnetic ordering is lost is marked with an “x” in the right panel. Also in the right panel, (Y2O3)A refers to a distinctive Y–O layer forming at this metal/oxide interface. Reprinted with permission from Reference [71]. Copyright (2014), AIP publishing LLC.
Metals 06 00020 g005

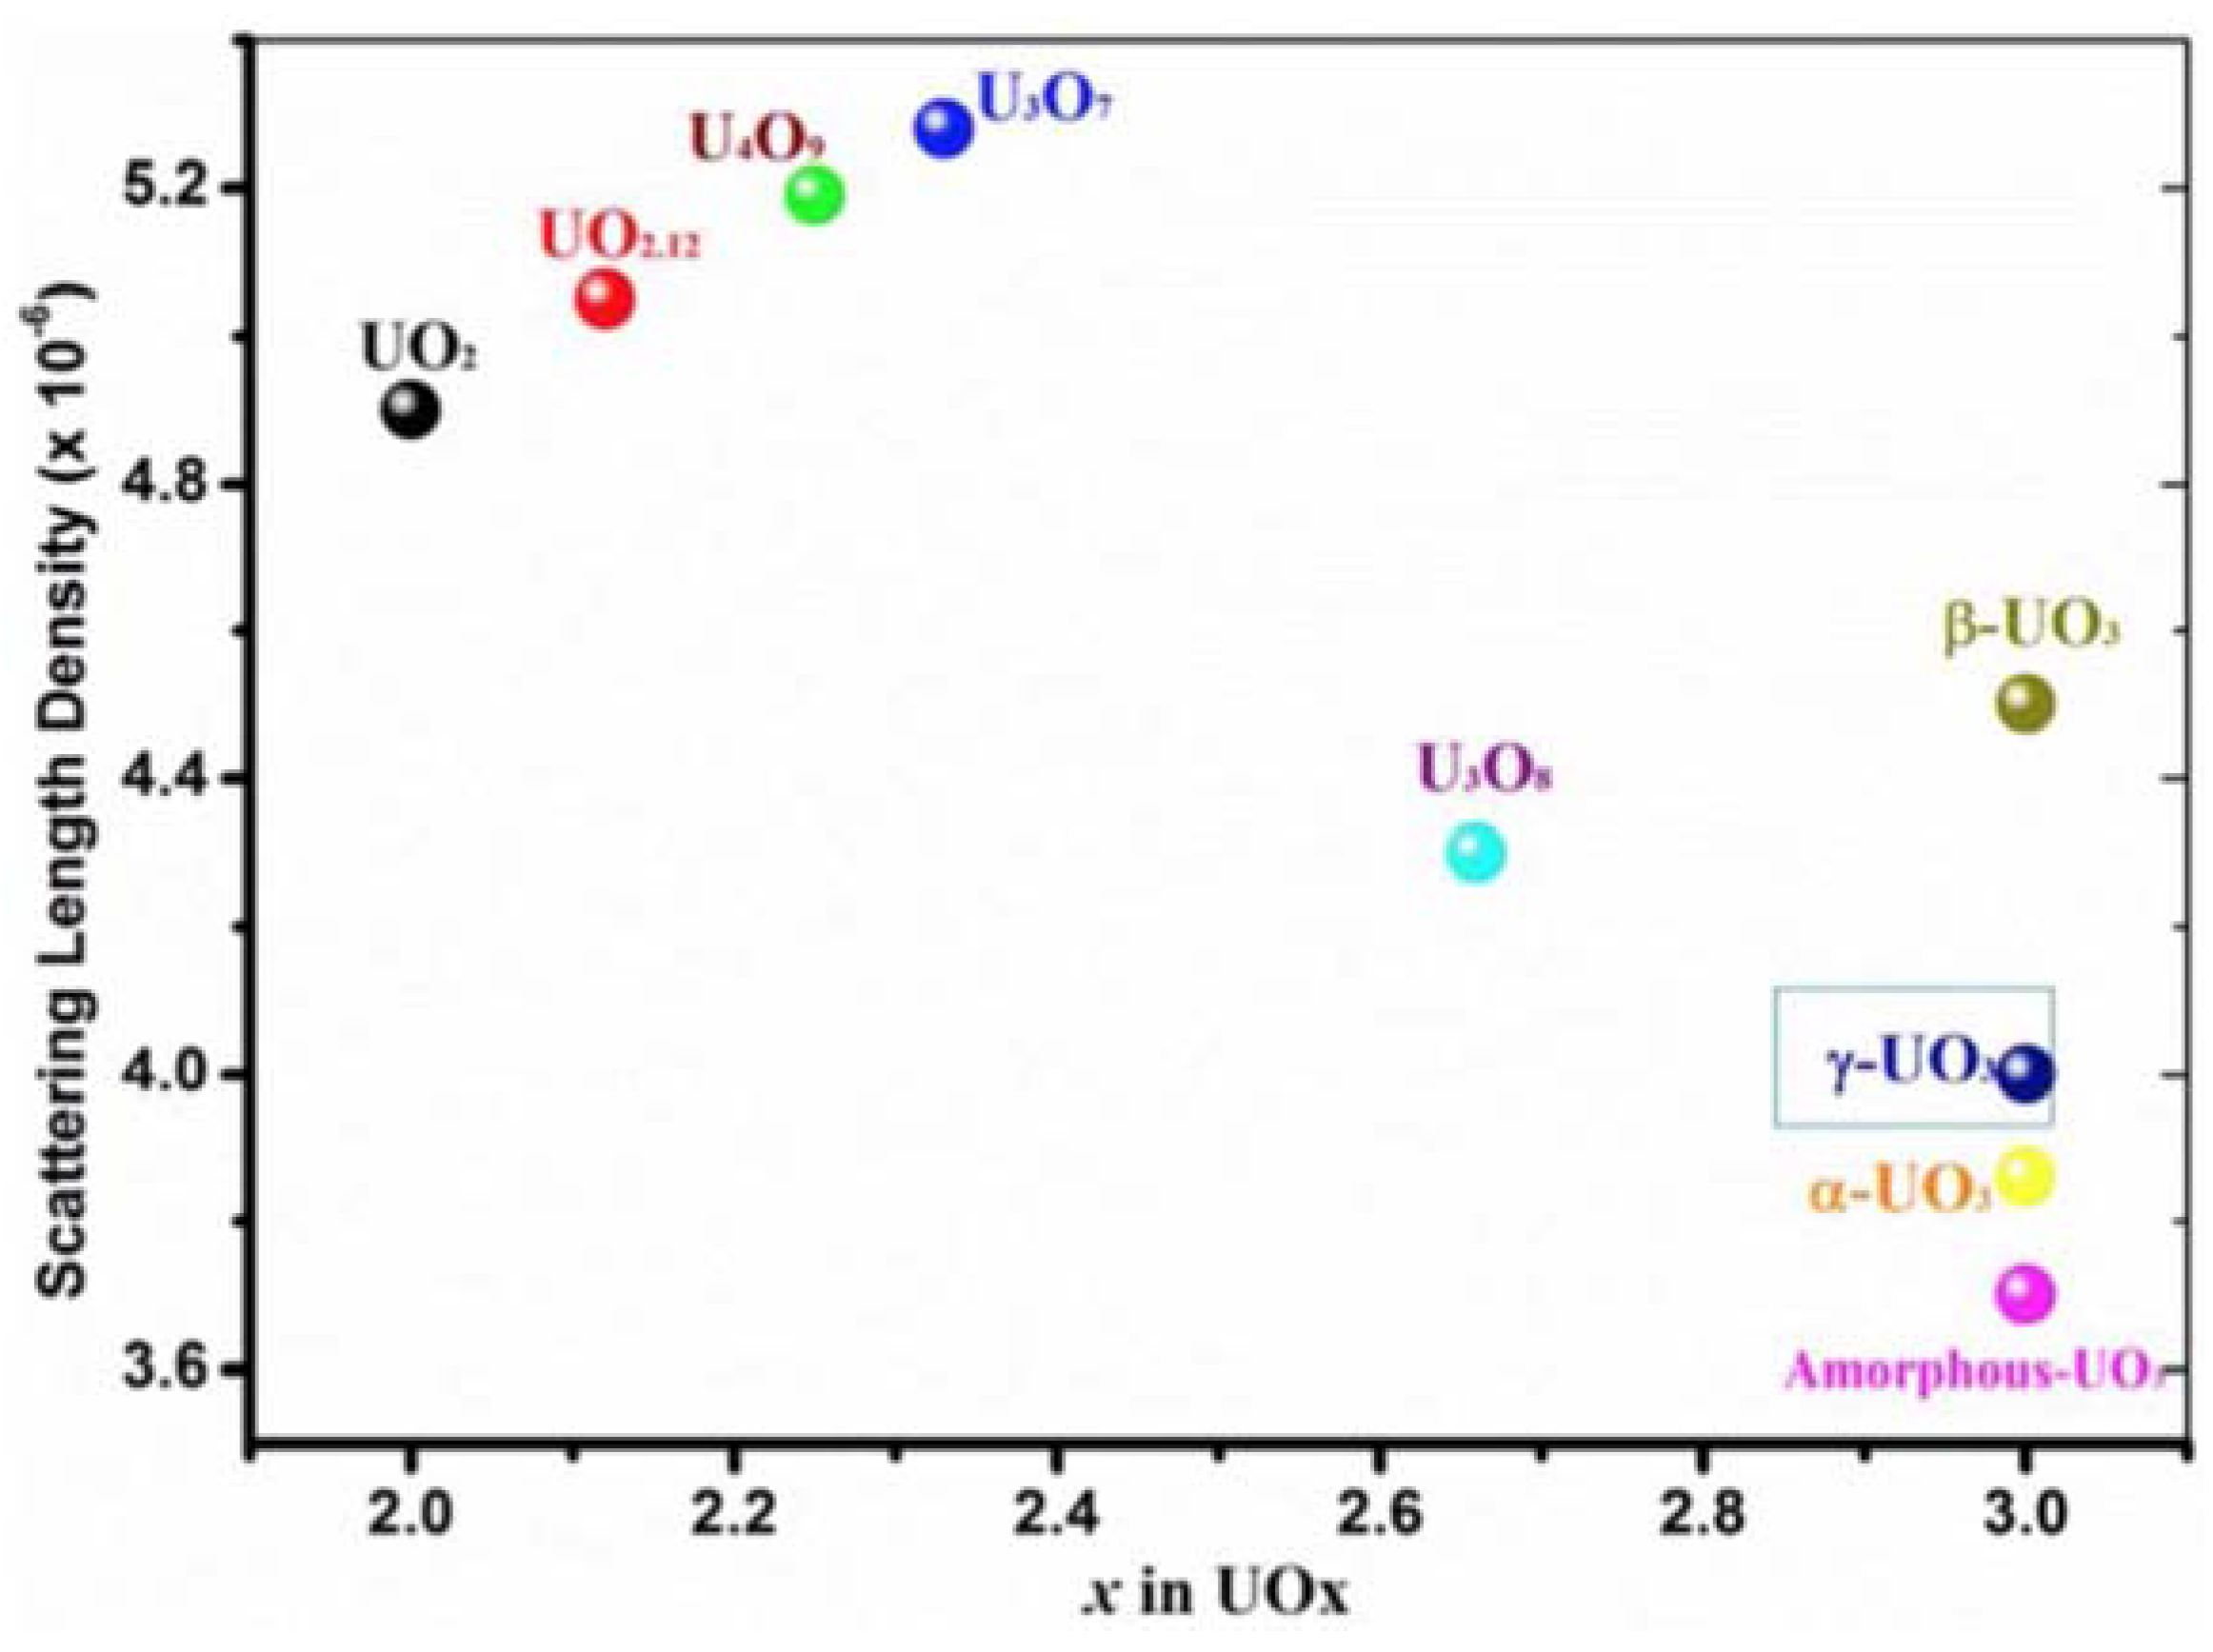
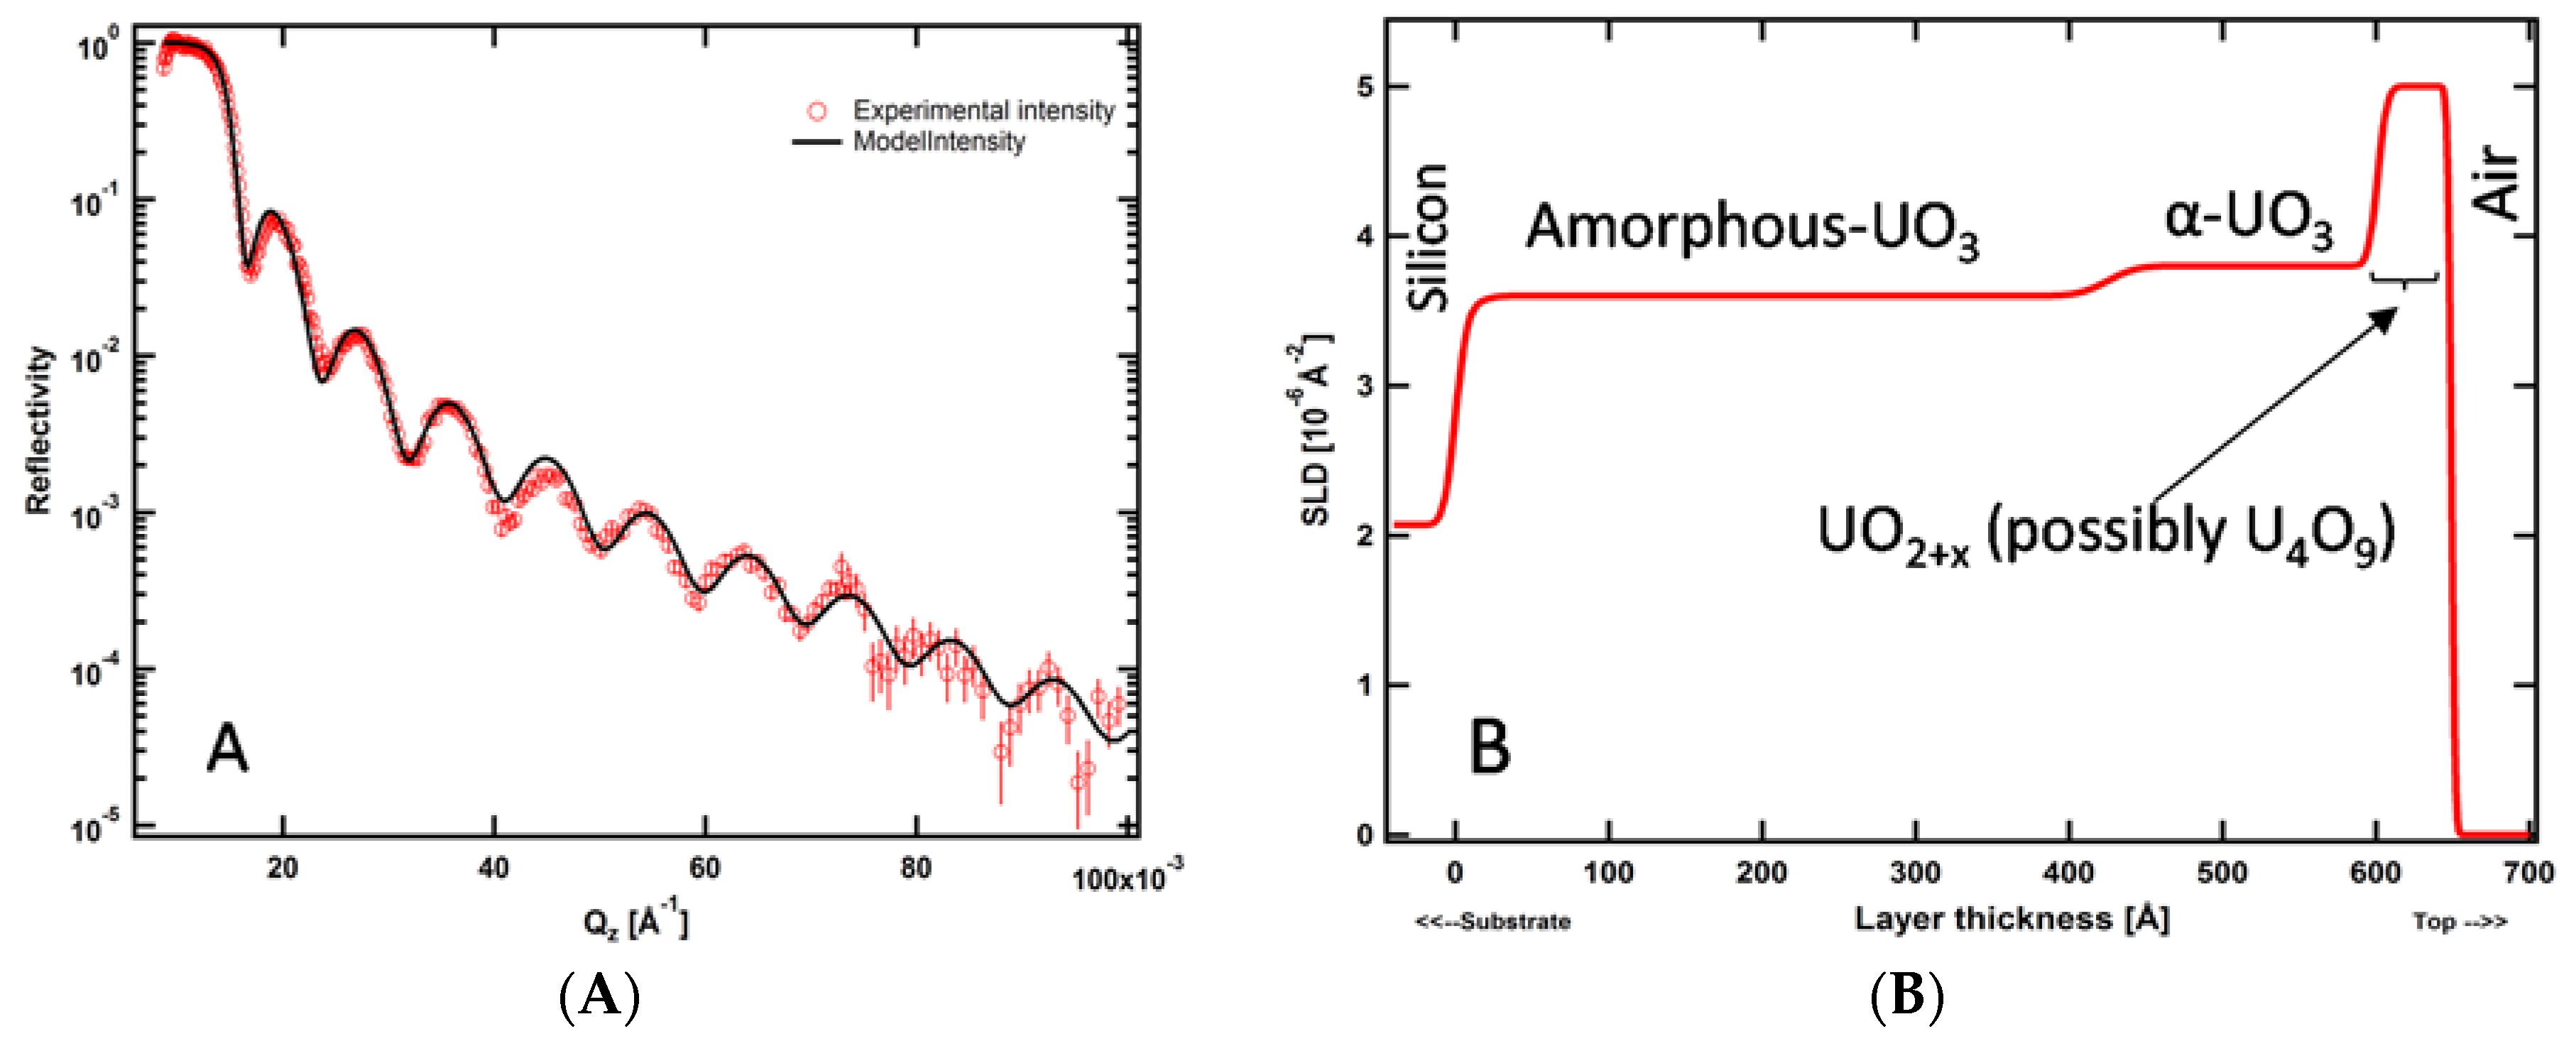
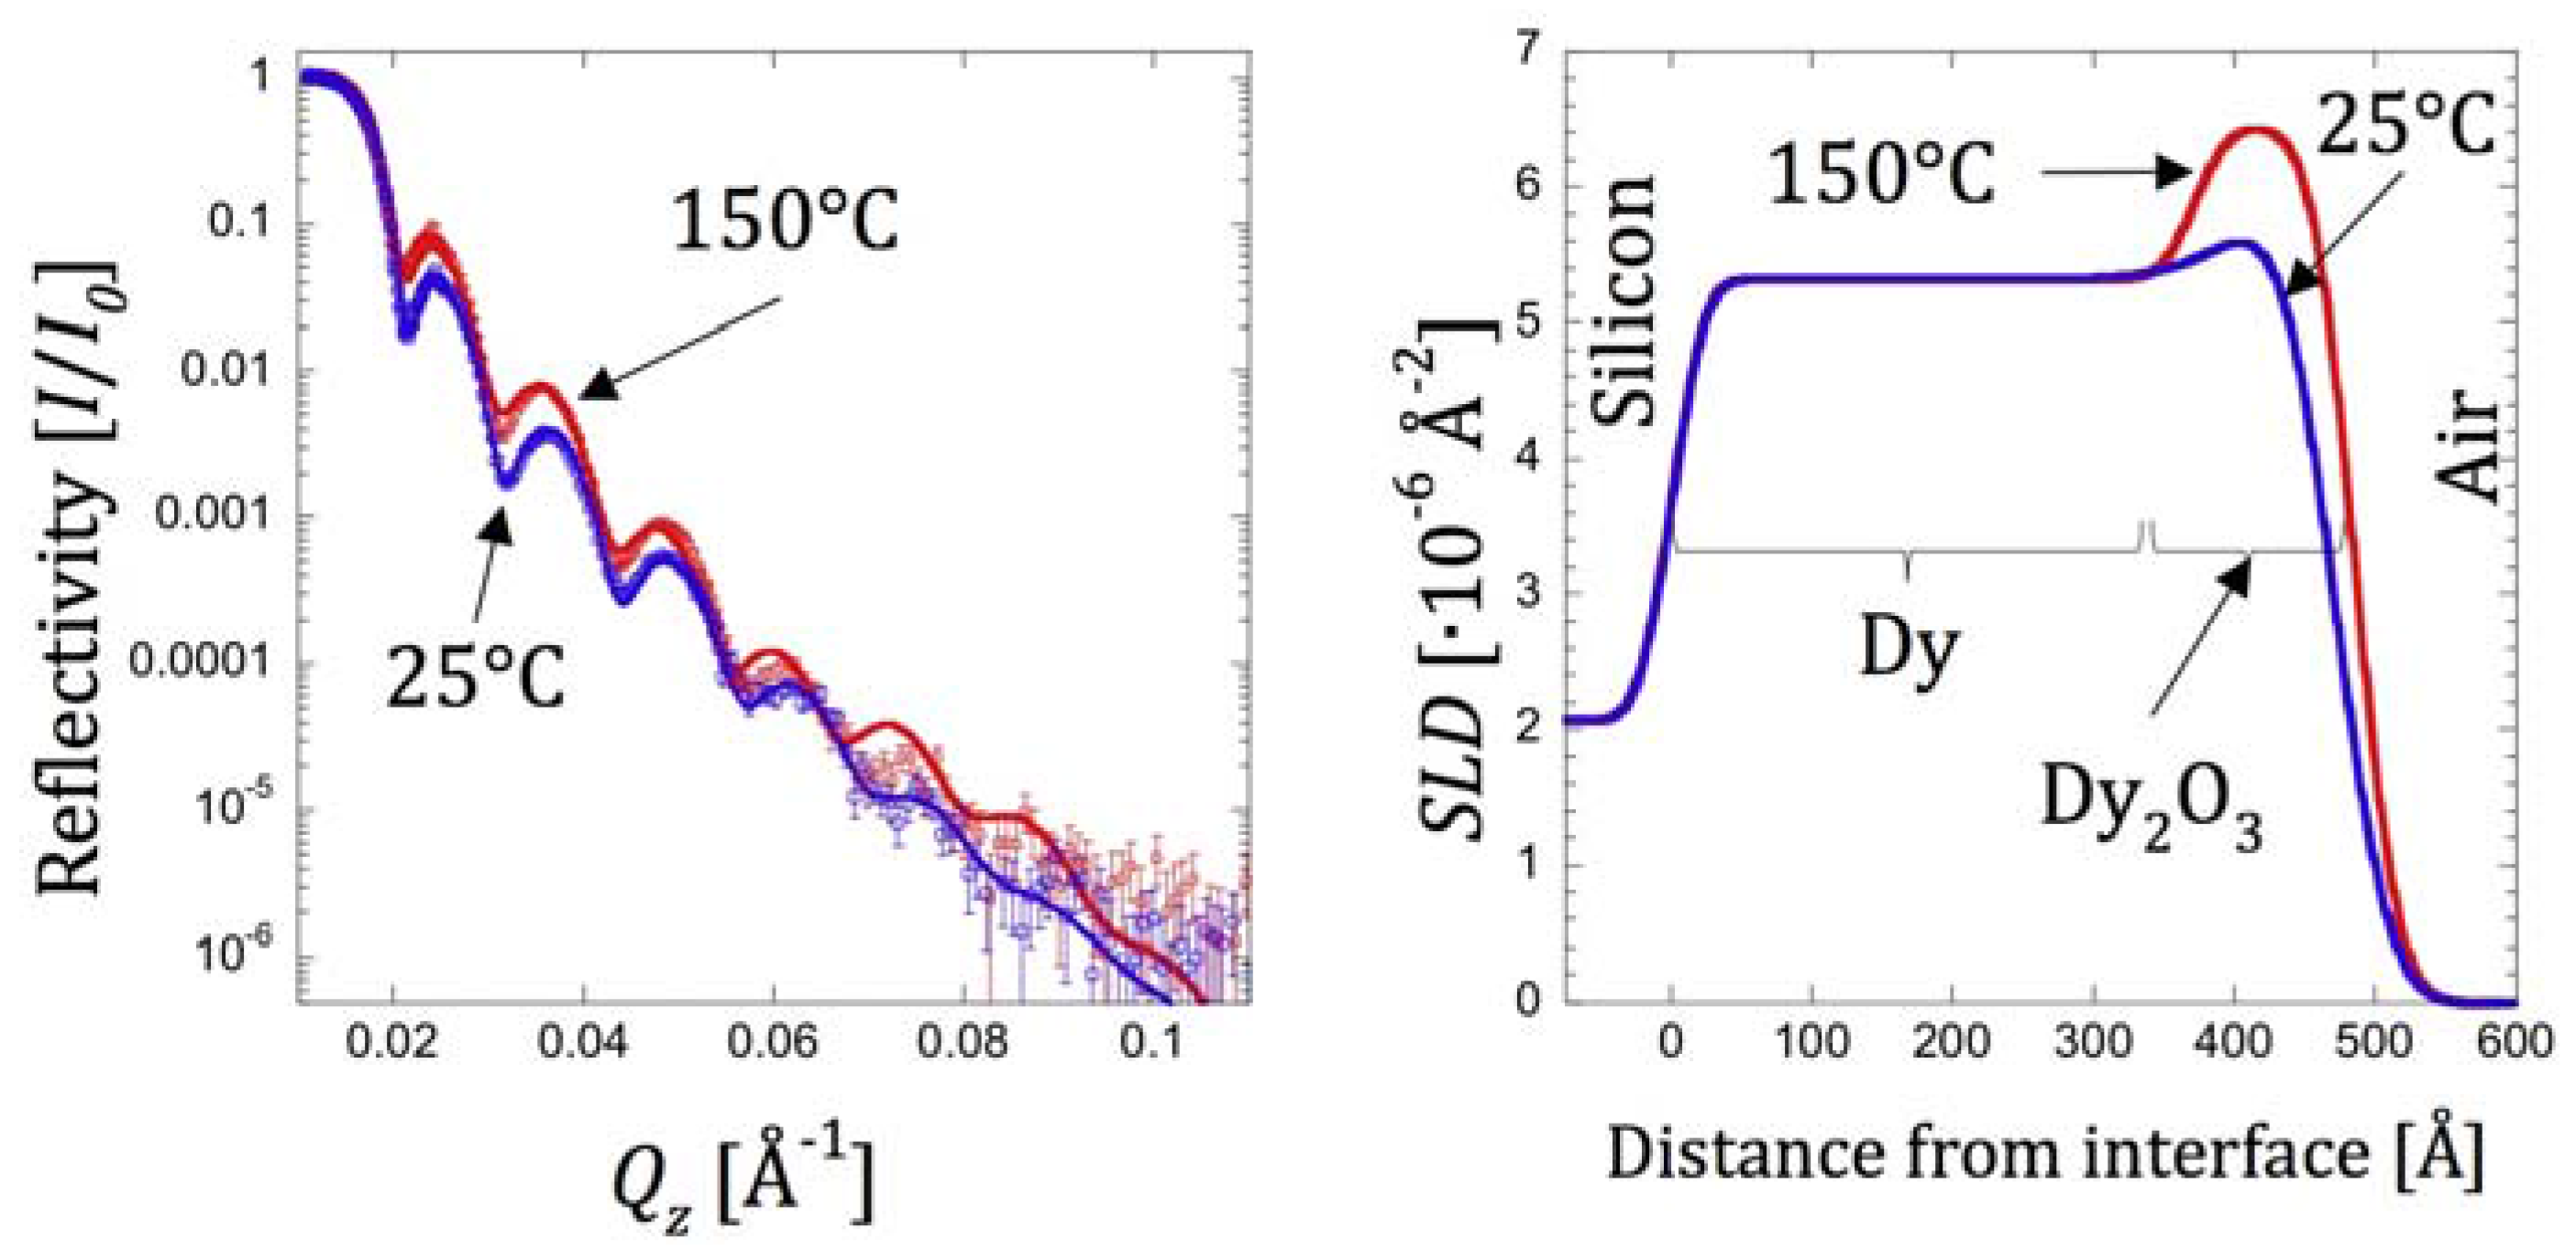
6.3. Actinides: Sensitivity to Light Elements

Actinides and their oxides exhibit some of the most intriguing and challenging chemistry known [72]. Frequently, the composition of these materials is not stoichiometrically precise. Moreover, their oxide structures can change dramatically under different environmental conditions. Neutrons provide a distinct advantage over X-rays in structural characterization of hydrides and oxides of heavy metals because they are better able to detect the lighter elements, such as H/D and O, within their actinide matrices. Figure 6 illustrates neutron scattering length densities for different uranium oxide phases, showing that NR is able to distinguish between them.
Figure 6. The calculated values of the nuclear scattering length density (SLD) for some common phases in uranium-oxide system. The calculations are based on specific densities published in literature [73,74].
Metals 06 00020 g006
The work of He et al. illustrates the utility of NR for investigating imperfect uranium oxide films [75]. They deposited uranium oxide on silicon substrates (with a thin native layer of oxide) using a combination of DC magnetron and reactive sputtering. In this technique, U atoms generated from a solid target by sputtering are readily oxidized by residual O2 present in the Ar/O2 mixture under moderate vacuum (approximately 1–3 × 10⁻⁴ torr) and then deposited on the substrate above the target. Several steps were taken to ensure high film quality: a multi-step sequential reactive deposition was used to minimize preferential film growth, the substrate was rotated to even out source distribution anomalies, and the partial pressures of Ar and O2 were adjusted to control the composition of the uranium oxide. Nevertheless, the resulting film has a non-uniform, depth-dependent stoichiometry and structure.
The NR data for these films along with the best-fit curve according to the real-space SLD profile are shown in Figure 7a. According to these results, the total thickness of the UOx film is about 630 Å. Figure 7b illustrates schematically the real-space structure represented by the best-fit SLD profile. The simplest model that fits the NR data has a three-layer structure. There is no heteroepitaxial growth of uranium oxide on the substrate/film interface due to the (~10 Å) native amorphous Si oxide layer on top of silicon wafer. The SLD of the layer at the film/air interface (~5.0 × 10⁻⁶ Å−2) suggests the presence of hyper-stoichiometric phases. Meanwhile, the SLD of middle layer of the film (~3.8 × 10⁻⁶ Å−2) together with the fact that no sharp X-ray diffraction peaks were observable (data not shown) indicates that this layer consists of amorphous α-UO3. Overall, NR demonstrates a remarkably rich variation in structure and stoichiometry in this nominally uniform sample.
Another example of the utility of NR for studies of heavy metal (lanthanide) oxides arises from recent work on Dysprosium (Dy) oxidation [76]. They deposited Dy films on silicon substrates using the same DC magnetron sputtering technique as discussed above and characterized their structures using NR after exposure to air at two different temperatures: 25 °C (ambient temperature) and 150 °C. Figure 8 shows that, under both conditions, the film may be described three-slab model. Under ambient temperature, it consists of 20 Å silicon oxide on top of the Si substrate, 418 Å Dy, and 43 Å Dy2O3. After exposure to air in 150 °C for ~0.5 h, the thickness of the Dy2O3 increased to 114 Å while simultaneously the thickness of the Dy layer decreased to 363 Å. The total thickness of Dy and Dy2O3 layers increased from 461 Å to 477 Å, indicating an overall swelling of the sample. The roughness parameters of the air-Dy2O3 and Dy2O3-Dy interfaces decreased, making the top surface facing the air and the interface between the metallic Dy and its oxide smoother. For the two cases of uranium oxide and dysprosium studies described above, the approximate errors for the thickness, SLD, and roughness parameters vales were ±5 Å, 0.1 Å−2, and 2 Å, respectively.
Figure 7. (A) NR data obtained from a UOx deposited on a silicon substrate (open circles). Error bars indicate one standard deviation. The solid line through the data points corresponds to the best-fit SLD profile shown in (B).
Metals 06 00020 g007
Figure 8. (Left) NR data (open circles) from a film of Dy covered with capping layer of Dy2O3 at ambient temperature (25 °C) and after expose to air at 150 °C for ~0.5 h. Error bars in the NR measurements correspond to one standard deviation. The solid line through the data points corresponds to the best-fit SLD profile shown on the (right).
Metals 06 00020 g008

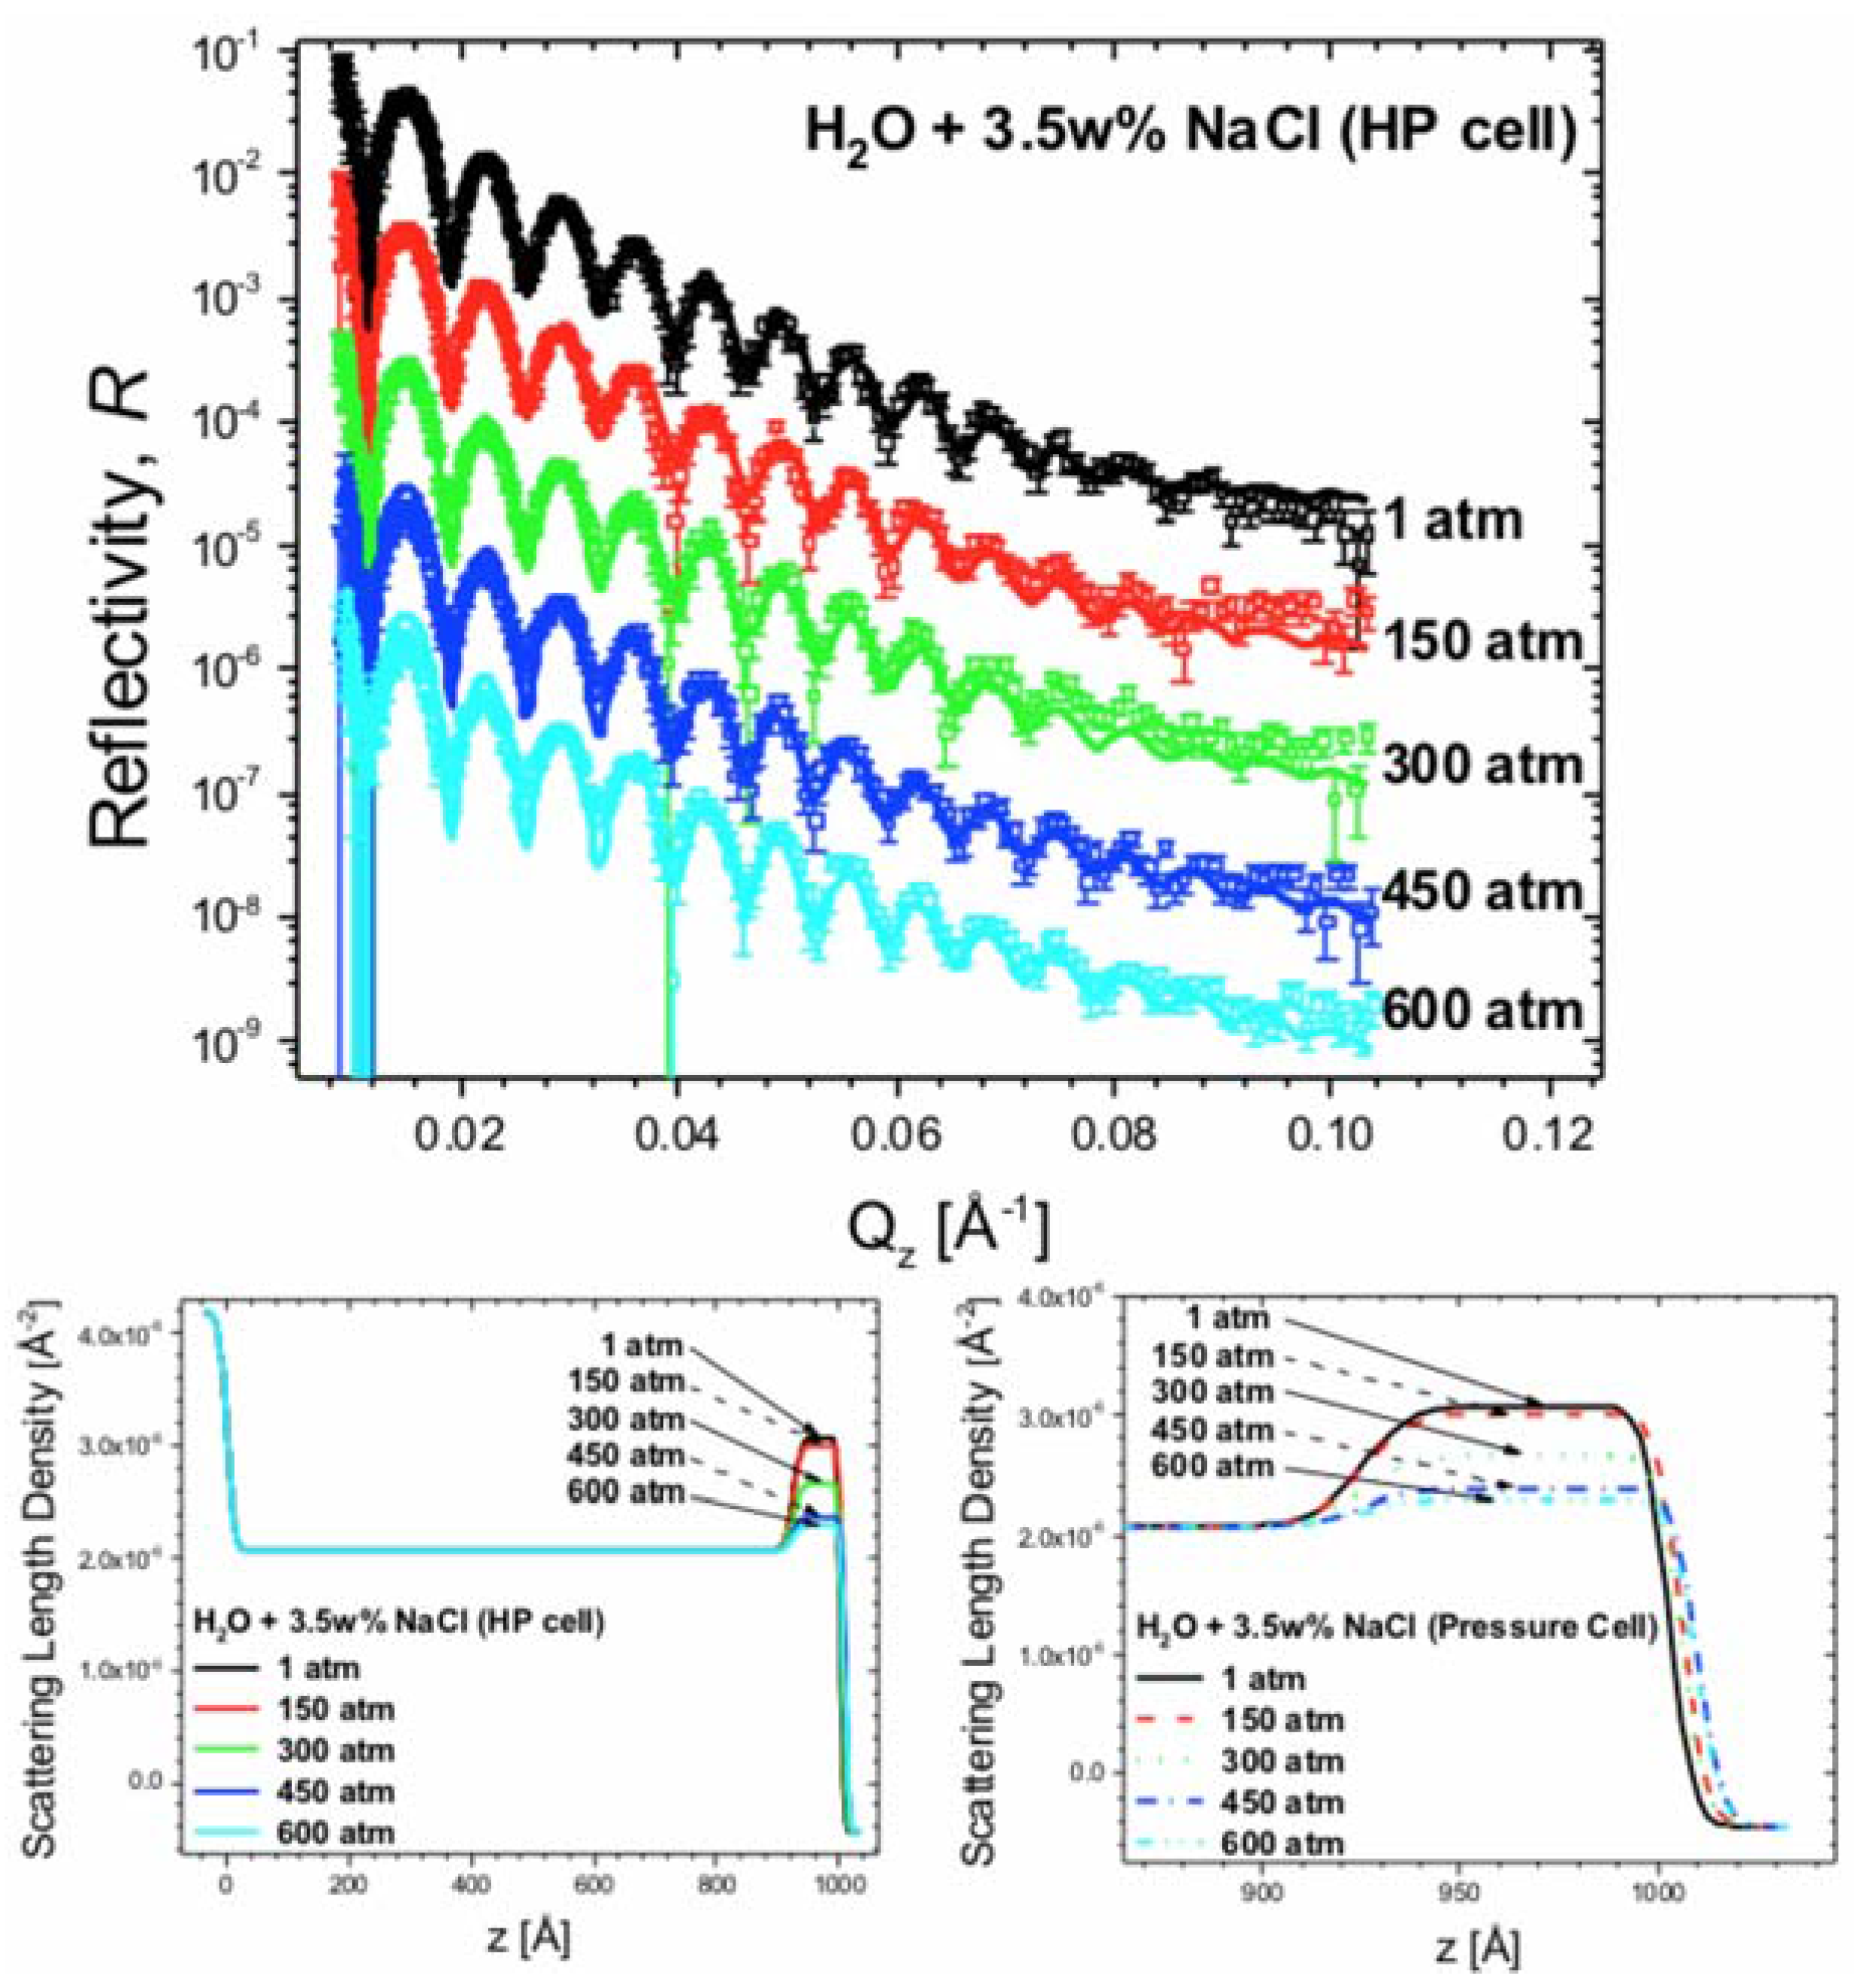
6.4. Surfaces in Pressurized Liquids: Penetration of Neutrons through Containers

Neutrons penetrate through thick sections of solid matter with low attenuation. Thus, they are able to “see through” the walls of a high-pressure cell, enabling examination of metal surfaces in pressurized media [77]. Junghans et al. used this capability to study the corrosion of oxidized aluminum (Al) surfaces in pressurized seawater [27]. The corrosion of structural materials in the deep sea depends on numerous chemical and physical factors, including pH, dissolved oxygen, chloride ion activity, salinity, ocean currents, temperature, and hydrostatic pressure [78,79,80,81,82]. Al and its alloys find widespread use in marine environments, including in civil and defense vessels, offshore rigs, drill pipes for deep wells, and diving suits. There are several reports on corrosion of Al and its alloys at shallow depths, but investigations at high pressures are limited [78,79,80,82,83,84].
When in contact with air, Al develops a thin passivation layer of Al2O3. The surface oxide has a higher SLD than pure Al, providing neutron scattering contrast between the two materials (Al: 2.08∙× 10−6 Å−2; crystalline Al2O3: 5.74∙× 10−6 Å−2). Junghans et al. deposited uniform, ~900 Å-thick Al films on monocrystalline quartz wafers using DC magnetron sputtering and collected a total of 14 NR spectra over the course of 50 h (~3 h per spectrum). The film was in contact with 3.5 wt. % NaCl solution at pressures ranging from 1 to 600 atm in a specially developed solid/liquid, high pressure/temperature cell [77]. This cell provides the capabilities of solid/fluid interface investigations up to 2000 atm (~30,000 psi) and 200 °C. The cell’s simple aluminum construction makes it easy to operate at high pressures and elevated temperatures, while the 13 mm thick neutron windows allow up to 74% neutron transmission. Figure 9 shows five representative NR measurements from this study [27].
Figure 9. (Top panel) Five NR measurements of Al film deposited on quartz substrate and investigated at 25 °C in contact with H2O + 3.5 wt. % of NaCl at different pressures. Solid curves are fits corresponding to the SLD profiles shown in the middle and right panels. Both the NR data and fits are offset by a decade along y-axis for clarity; (Bottom left panel) SLD distribution of the Al/Al2O3/liquid system and (Bottom right panel) magnified SLD distribution in the contact region. In both of the bottom panels, z = 0 at the quartz substrate/Al interface.
Metals 06 00020 g009
The NR results show virtually no corrosion of the Al layers. The observed decrease in the SLD of the starting Al2O3 passivation layer cannot be explained by the formation of new chemical compounds by the highly scattering Na, Cl, and O ions. However, this decrease is consistent with formation of stable Al–Cl–H2O (or Al–O–Cl–H2O) complexes or hydration of Al2O3 to Al(OH)3. These results suggest that for the time scale of 50 h the influence of hydrostatic pressure only slightly influences interactions of the Al oxide film with Cl ions and H2O. The corrosion rate is lower than reported by Beccaria et al. [78,79,80], suggesting slower kinetics for the reactions involved.

7. Conclusions

Neutron reflectometry (NR) is a mature experimental technique that has been used extensively in condensed-matter physics. However, its potential for investigating interfaces in metals has not yet been utilized widely. The present overview is intended to raise awareness of NR in the metals community with the hope of motivating wider use of this technique. NR provides several unique advantages for investigating interfaces in metals:
  • It is non-destructive. Thus, NR results may be combined with other, follow-on investigations, e.g., using XRR, TEM, or APT.
  • Å-level depth resolution enables detailed investigation of interface structure: thickness, SLD, and roughness of the layers.
  • Sensitivity to composition, isotopic distribution, density, and magnetic moment allow multiple physical characteristics to be measured simultaneously.
  • Ability to detect low-Z elements, such as H/D, He, and other light isotopes.
  • Suitability for in situ studies due to the high penetrability of neutrons through container walls and surrounding media. This capability enables investigations of a variety of buried interfaces, including solid-liquid ones, which are otherwise very difficult to access with X-rays.
  • The measured SLD values are absolute due to the fact that the reflected beam is normalized by the incident intensity of the neutron beam.
  • Ready access thanks to the availability of several suitable neutron sources (reactors and spallation facilities) worldwide.
Several example applications of NR to metal surfaces and buried interfaces have been discussed above. As the metals community continues to explore the structure and properties of interfaces in ever-greater detail [7,8,9], NR stands poised to contribute valuable new additions to this ever-growing list of examples.

Acknowledgments

J.M. thanks Heming He, Kirk Rector, Peng Wang, Ann Junghans, Erik Watkins (LANL), and David Allred (BYU). M.J.D. acknowledges Abishek Kashinath and support from the Center for Materials in Irradiation and Mechanical Extremes (CMIME), an Energy Frontier Research Center funded by the U.S. Department of Energy, Office of Science, Office of Basic Energy Sciences under Award No. 2008LANL1026. This work benefited from the use of the Lujan Neutron Scattering Center at LANSCE funded by the DOE Office of Basic Energy Sciences and Los Alamos National Laboratory under DOE Contract DE-AC52-06NA25396.

Author Contributions

Both authors contributed equally to the composition of this article.

Conflicts of Interest

The authors declare no conflict of interest.

References

  1. Sutton, A.P.; Balluffi, R.W. Interfaces in Crystalline Materials; Oxford University Press: Oxford, UK, 1995. [Google Scholar]
  2. Furukawa, S.; de Feyter, S. Two-dimensional crystal engineering at the liquid-solid interface. In Templates in Chemistry III; Broekmann, P., Dotz, K.H., Schalley, C.A., Eds.; Springer-Verlag Berlin: Berlin, Germany, 2009; Volume 287, pp. 87–133. [Google Scholar]
  3. Kaplan, W.D.; Kauffmann, Y. Structural order in liquids induced by interfaces with crystals. Ann. Rev. Mater. Res. 2006, 36, 1–48. [Google Scholar] [CrossRef]
  4. Boettinger, W.J.; Warren, J.A.; Beckermann, C.; Karma, A. Phase-field simulation of solidification. Ann. Rev. Mater. Res. 2002, 32, 163–194. [Google Scholar] [CrossRef]
  5. Stachowiak, G.W.; Batchelor, A.W. Engineering Tribology; Butterworth-Heinemann: Boston, MA, USA, 2000. [Google Scholar]
  6. Hirth, J.P.; Pond, R.C.; Hoagland, R.G.; Liu, X.Y.; Wang, J. Interface defects, reference spaces and the frank-bilby equation. Prog. Mater. Sci. 2013, 58, 749–823. [Google Scholar] [CrossRef]
  7. Beyerlein, I.J.; Demkowicz, M.J.; Misra, A.; Uberuaga, B.P. Defect-interface interactions. Prog. Mater. Sci. 2015, 74, 125–210. [Google Scholar] [CrossRef]
  8. Cantwell, P.R.; Tang, M.; Dillon, S.J.; Luo, J.; Rohrer, G.S.; Harmer, M.P. Grain boundary complexions. Acta Mater. 2014, 62, 1–48. [Google Scholar] [CrossRef]
  9. Mishin, Y.; Asta, M.; Li, J. Atomistic modeling of interfaces and their impact on microstructure and properties. Acta Mater. 2010, 58, 1117–1151. [Google Scholar] [CrossRef]
  10. Colliex, C.; Bocher, L.; de la Pena, F.; Gloter, A.; March, K.; Walls, M. Atomic-scale stem-eels mapping across functional interfaces. JOM 2010, 62, 53–57. [Google Scholar] [CrossRef]
  11. Schmitz, G.; Ene, C.; Galinski, H.; Schlesiger, R.; Stender, P. Nanoanalysis of interfacial chemistry. JOM 2010, 62, 58–63. [Google Scholar] [CrossRef]
  12. Mitchell, T.E.; Lu, Y.C.; Griffin, A.J.; Nastasi, M.; Kung, H. Structure and mechanical properties of copper/niobium multilayers. J. Am. Ceram. Soc. 1997, 80, 1673–1676. [Google Scholar] [CrossRef]
  13. Shaha, K.P.; Pei, Y.T.; Chen, C.Q.; Turkin, A.A.; Vainshtein, D.I.; de Hosson, J.T.M. On the dynamic roughening transition in nanocomposite film growth. Appl. Phys. Lett. 2009. [Google Scholar] [CrossRef]
  14. Olmsted, D.L.; Foiles, S.M.; Holm, E.A. Grain boundary interface roughening transition and its effect on grain boundary mobility for non-faceting boundaries. Scr. Mater. 2007, 57, 1161–1164. [Google Scholar] [CrossRef]
  15. Bellon, P. Nonequilibrium roughening and faceting of interfaces in driven alloys. Phys. Rev. Lett. 1998, 81, 4176–4179. [Google Scholar] [CrossRef]
  16. Wiesler, D.G.; Majkrzak, C.F. Neutron reflectometry studies of surface oxidation. Phys. B 1994, 198, 181–186. [Google Scholar] [CrossRef]
  17. Russell, T.P. X-ray and neutron reflectivity for the investigation of polymers. Mater. Sci. Rep. 1990, 5, 171–271. [Google Scholar] [CrossRef]
  18. Dietrich, S.; Haase, A. Scattering of X-rays and neutrons at interfaces. Phys. Rep. Rev. Sec. Phys. Lett. 1995, 260, 1–138. [Google Scholar] [CrossRef]
  19. Zhou, X.L.; Chen, S.H. Theoretical foundation of X-ray and neutron reflectometry. Phys. Rep. Rev. Sec. Phys. Lett. 1995, 257, 223–348. [Google Scholar] [CrossRef]
  20. Penfold, J.; Thomas, R.K. The application of the specular reflection of neutrons to the study of surfaces and interfaces. J. Phys. Condes. Matter 1990, 2, 1369–1412. [Google Scholar] [CrossRef]
  21. Van der Lee, A. Grazing incidence specular reflectivity: Theory, experiment, and applications. Solid State Sci. 2000, 2, 257–278. [Google Scholar] [CrossRef]
  22. Fermi, E.; Zinn, W.H. Reflection of neutrons on mirrors. Phys. Rev. 1946, 70, 103. [Google Scholar]
  23. Fermi, E.; Marshall, L. Interference phenomena of slow neutrons. Phys. Rev. 1947, 71, 666–677. [Google Scholar] [CrossRef]
  24. Lekner, J. Theory of reflection of electromagnetic and particle waves. In Developments in Electromagnetic Theory and Applications 3; Springer Netherlands: Dordrecht, The Netherlands, 1987. [Google Scholar]
  25. Russell, T.P. The characterization of polymer interfaces. Annu. Rev. Mater. Sci. 1991, 21, 249–268. [Google Scholar] [CrossRef]
  26. Smith, G.S.; Majkrzak, C.F. Neutron reflectometry. In International Tables for Crystallography, 1st ed.; International Union of Crystallography, Ed.; Springer: Chester, UK; New York, NY, USA, 2006. [Google Scholar]
  27. Junghans, A.; Chellappa, R.; Wang, P.; Majewski, J.; Luciano, G.; Marcelli, R.; Proietti, E. Neutron reflectometry studies of aluminum-saline water interface under hydrostatic pressure. Corros. Sci. 2015, 90, 101–106. [Google Scholar] [CrossRef]
  28. Carpenter, J.M. Pulsed spallation neutron sources for slow-neutron scattering. Nucl. Instrum. Methods 1977, 145, 91–113. [Google Scholar] [CrossRef]
  29. Bauer, G.S. Physics and technology of spallation neutron sources. Nucl. Instrum. Methods Phys. Res. Sect. A Accel. Spectrom. Dect. Assoc. Equip. 2001, 463, 505–543. [Google Scholar] [CrossRef]
  30. Hughes, D.J.; Burgy, M.T. Reflection of neutrons from magnetized mirrors. Phys. Rev. 1951, 81, 498–506. [Google Scholar] [CrossRef]
  31. Lauter, V.; Ambaye, H.; Goyette, R.; Lee, W.T.H.; Parizzi, A. Highlights from the magnetism reflectometer at the SNS. Phys. B 2009, 404, 2543–2546. [Google Scholar] [CrossRef]
  32. Merzbacher, E. Quantum Mechanics; Wiley: New York, NY, USA, 1961; p. 544. [Google Scholar]
  33. Sears, V.F. Neutron scattering lengths and cross sections. Neutron News 1992, 3, 29–37. [Google Scholar] [CrossRef]
  34. Lovesey, S.W. Theory of Neutron Scattering from Condensed Matter; Clarendon Press: Oxfordshire, UK, 1984. [Google Scholar]
  35. Neutron SLDs. Available online: http://www.ncnr.nist.gov/resources/n-lengths/ (accessed on 23 December 2015).
  36. Nevot, L.; Croce, P. Characterization of surfaces by grazing X-ray reflection—Application to study of polishing of some silicate-glasses. Rev. Phys. Appl. 1980, 15, 761–779. [Google Scholar]
  37. Als-Nielsen, J.; McMorrow, D. Elements of Modern X-ray Physics, 2nd ed.; Hoboken, N.J., Ed.; Wiley: Hoboken, NJ, USA, 2011. [Google Scholar]
  38. Lovell, M.R.; Richardson, R.M. Analysis methods in neutron and X-ray reflectometry. Curr. Opin. Colloid Interface Sci. 1999, 4, 197–204. [Google Scholar] [CrossRef]
  39. Parratt, L.G. Surface studies of solids by total reflection of X-rays. Phys. Rev. 1954, 95, 359–369. [Google Scholar] [CrossRef]
  40. Yasaka, M. X-ray thin film measurement techniques. Rigaku J. 2010, 26, 1–9. [Google Scholar]
  41. Nelson, A. Co-refinement of multiple-contrast neutron/X-ray reflectivity data using motofit. J. Appl. Crystallogr. 2006, 39, 273–276. [Google Scholar] [CrossRef]
  42. Kashinath, A.; Wang, P.; Majewski, J.; Baldwin, J.K.; Wang, Y.Q.; Demkowicz, M.J. Detection of helium bubble formation at fcc-bcc interfaces using neutron reflectometry. J. Appl. Phys. 2013. [Google Scholar] [CrossRef]
  43. Majkrzak, C.F.; Berk, N.F. Exact determination of the phase in neutron reflectometry. Phys. Rev. B 1995, 52, 10827–10830. [Google Scholar] [CrossRef]
  44. Berk, N.F.; Majkrzak, C.F. Inverting specular neutron reflectivity from symmetric, compactly supported potentials. In Proceedings of the International Symposium on Advance in Neutron Optics and Related Research Facilities, Kumatori, Osaka, Japan, 19–21 March 1996; p. 107.
  45. Majkrzak, C.F.; Berk, N.F. Exact determination of the phase in neutron reflectometry by variation of the surrounding media. Phys. Rev. B 1998, 58, 15416–15418. [Google Scholar] [CrossRef]
  46. Dehaan, V.O.; Vanwell, A.A.; Adenwalla, S.; Felcher, G.P. Retrieval of phase information in neutron reflectometry. Phys. Rev. B 1995, 52, 10831–10833. [Google Scholar] [CrossRef]
  47. Kasper, J.; Leeb, H.; Lipperheide, R. Phase determination in spin-polarized neutron specular reflection. Phys. Rev. Lett. 1998, 80, 2614–2617. [Google Scholar] [CrossRef]
  48. Lipperheide, R.; Kasper, J.; Leeb, H. Surface profiles from polarization measurements in neutron reflectometry. Phys. B 1998, 248, 366–371. [Google Scholar] [CrossRef]
  49. Leeb, H.; Grotz, H.; Kasper, J.; Lipperheide, R. Complete determination of the reflection coefficient in neutron specular reflection by absorptive nonmagnetic media. Phys. Rev. B 2001. [Google Scholar] [CrossRef]
  50. Majkrzak, C.F. Neutron scattering studies of magnetic thin films and multilayers. Phys. B 1996, 221, 342–356. [Google Scholar] [CrossRef]
  51. Williams, W.G. Polarized Neutrons; Clarendon Press: Oxford, UK; New York, NY, USA; Oxford University Press: Oxford, UK; New York, NY, USA, 1988. [Google Scholar]
  52. Renaud, G.; Lazzari, R.; Leroy, F. Probing surface and interface morphology with grazing incidence small angle X-ray scattering. Surf. Sci. Rep. 2009, 64, 255–380. [Google Scholar] [CrossRef]
  53. Sinha, S.K. Reflectivity using neutrons or X-rays—A critical comparison. Phys. B 1991, 173, 25–34. [Google Scholar] [CrossRef]
  54. Stoev, K.N.; Sakurai, K. Review on grazing incidence X-ray spectrometry and reflectometry. Spectroc. Acta B Atom. Spectr. 1999, 54, 41–82. [Google Scholar] [CrossRef]
  55. Feldman, L.C.; Mayer, J.W. Fundamentals of Surface and Thin Film Analysis; North-Holland: New York, NY, USA, 1986. [Google Scholar]
  56. Jablin, M.S.; Zhernenkov, M.; Toperverg, B.P.; Dubey, M.; Smith, H.L.; Vidyasagar, A.; Toomey, R.; Hurd, A.J.; Majewski, J. In-plane correlations in a polymer-supported lipid membrane measured by off-specular neutron scattering. Phys. Rev. Lett. 2011. [Google Scholar] [CrossRef] [PubMed]
  57. Laakmann, J.; Jung, P.; Uelhoff, W. Solubility of helium in gold. Acta Metall. 1987, 35, 2063–2069. [Google Scholar] [CrossRef]
  58. Trinkaus, H.; Singh, B.N. Helium accumulation in metals during irradiation—Where do we stand? J. Nucl. Mater. 2003, 323, 229–242. [Google Scholar] [CrossRef]
  59. Judge, C.D.; Gauquelin, N.; Walters, L.; Wright, M.; Cole, J.I.; Madden, J.; Botton, G.A.; Griffiths, M. Intergranular fracture in irradiated inconel X-750 containing very high concentrations of helium and hydrogen. J. Nucl. Mater. 2015, 457, 165–172. [Google Scholar] [CrossRef]
  60. Baldwin, M.J.; Doerner, R.P. Helium induced nanoscopic morphology on tungsten under fusion relevant plasma conditions. Nucl. Fusion 2008. [Google Scholar] [CrossRef]
  61. Demkowicz, M.J.; Misra, A.; Caro, A. The role of interface structure in controlling high helium concentrations. Curr. Opin. Solid State Mat. Sci. 2012, 16, 101–108. [Google Scholar] [CrossRef]
  62. Misra, A.; Demkowicz, M.J.; Zhang, X.; Hoagland, R.G. The radiation damage tolerance of ultra-high strength nanolayered composites. JOM 2007, 59, 62–65. [Google Scholar] [CrossRef]
  63. Odette, G.R.; Miao, P.; Edwards, D.J.; Yamamoto, T.; Kurtz, R.J.; Tanigawa, H. Helium transport, fate and management in nanostructured ferritic alloys: In situ helium implanter studies. J. Nucl. Mater. 2011, 417, 1001–1004. [Google Scholar] [CrossRef]
  64. Odette, G.R.; Hoelzer, D.T. Irradiation-tolerant nanostructured ferritic alloys: Transforming helium from a liability to an asset. JOM 2010, 62, 84–92. [Google Scholar] [CrossRef]
  65. Zhernenkov, M.; Gill, S.; Stanic, V.; DiMasi, E.; Kisslinger, K.; Baldwin, J.K.; Misra, A.; Demkowicz, M.J.; Ecker, L. Design of radiation resistant metallic multilayers for advanced nuclear systems. Appl. Phys. Lett. 2014. [Google Scholar] [CrossRef]
  66. Zhernenkov, M.; Jablin, M.S.; Misra, A.; Nastasi, M.; Wang, Y.-Q.; Demkowicz, M.J.; Baldwin, J.K.; Majewski, J. Trapping of implanted he at Cu/Nb interfaces measured by neutron reflectometry. Appl. Phys. Lett. 2011. [Google Scholar] [CrossRef]
  67. Demkowicz, M.J.; Bhattacharyya, D.; Usov, I.; Wang, Y.Q.; Nastasi, M.; Misra, A. The effect of excess atomic volume on he bubble formation at fcc-bcc interfaces. Appl. Phys. Lett. 2010. [Google Scholar] [CrossRef] [Green Version]
  68. Kashinath, A.; Misra, A.; Demkowicz, M.J. Stable storage of helium in nanoscale platelets at semicoherent interfaces. Phys. Rev. Lett. 2013. [Google Scholar] [CrossRef] [PubMed]
  69. Kaplan, W.D.; Chatain, D.; Wynblatt, P.; Carter, W.C. A review of wetting versus adsorption, complexions, and related phenomena: The rosetta stone of wetting. J. Mater. Sci. 2013, 48, 5681–5717. [Google Scholar] [CrossRef]
  70. Dholabhai, P.P.; Pilania, G.; Aguiar, J.A.; Misra, A.; Uberuaga, B.P. Termination chemistry-driven dislocation structure at SrTiO3/MgO heterointerfaces. Nat. Commun. 2014. [Google Scholar] [CrossRef] [PubMed]
  71. Watkins, E.B.; Kashinath, A.; Wang, P.; Baldwin, J.K.; Majewski, J.; Demkowicz, M.J. Characterization of a Fe/Y2O3 metal/oxide interface using neutron and X-ray scattering. Appl. Phys. Lett. 2014. [Google Scholar] [CrossRef]
  72. Morss, L.R.; Edelstein, N.M.; Fuger, J.; Katz, J.J. The Chemistry of the Actinide and Transactinide Elements, 3rd ed.; Springer: Dordrecht, The Netherlands, 2006. [Google Scholar]
  73. Hoekstra, H.R.; Siegel, S. The uranium-oxygen system—U3O8–UO3. J. Inorg. Nucl. Chem. 1961, 18, 154–165. [Google Scholar] [CrossRef]
  74. Loopstra, B.O.; Cordfunk, E. On structure of α-UO3. Recl. Trav. Chim. PaysBas 1966, 85, 135–142. [Google Scholar] [CrossRef]
  75. He, H.M.; Wang, P.; Allred, D.D.; Majewski, J.; Wilkerson, M.P.; Rector, K.D. Characterization of chemical speciation in ultrathin uranium oxide layered films. Anal. Chem. 2012, 84, 10380–10387. [Google Scholar] [CrossRef] [PubMed]
  76. Watkins, E.B.; Scott, B.; Allred, D.D.; Majewski, J. Unpublished work. 2015.
  77. Wang, P.; Lerner, A.H.; Taylor, M.; Baldwin, J.K.; Grubbs, R.K.; Majewski, J.; Hickmott, D.D. High-pressure and high-temperature neutron reflectometry cell for solid-fluid interface studies. Eur. Phys. J. Plus 2012. [Google Scholar] [CrossRef]
  78. Beccaria, A.M.; Poggi, G. Influence of hydrostatic-pressure on pitting of aluminum in sea-water. Br. Corros. J. 1985, 20, 183–186. [Google Scholar] [CrossRef]
  79. Beccaria, A.M.; Poggi, G. Effect of some surface treatments on kinetics of aluminum corrosion in NaCl solutions at various hydrostatic pressures. Br. Corros. J. 1986, 21, 19–22. [Google Scholar] [CrossRef]
  80. Beccaria, A.M.; Fiordiponti, P.; Mattogno, G. The effect of hydrostatic-pressure on the corrosion of nickel in slightly alkaline-solutions containing C1 ions. Corros. Sci. 1989, 29, 403–413. [Google Scholar] [CrossRef]
  81. Heusler, K.E. Untersuchungen der korrosion von aluminium in wasser bei hohen temperaturen und drucken. Mater. Corros. 1967, 18, 11–15. [Google Scholar] [CrossRef]
  82. Dexter, S.C. Effect of variations in sea-water upon the corrosion of aluminum. Corrosion 1980, 36, 423–432. [Google Scholar] [CrossRef]
  83. Venkatesan, R.; Venkatasamy, M.A.; Bhaskaran, T.A.; Dwarakadasa, E.S.; Ravindran, M. Corrosion of ferrous alloys in deep sea environments. Br. Corros. J. 2002, 37, 257–266. [Google Scholar] [CrossRef]
  84. Sawant, S.S.; Wagh, A.B. Corrosion behaviour of metals and alloys the waters of the arabian sea. Corros. Prev. Control 1990, 37, 154–157. [Google Scholar]

