
Cyclic Oxidation of High Mo, Reduced Density Superalloys


Abstract
:
1. Introduction
2. Experimental Section

| Rank | Nominal, wt. % | Sample | ∆W/A, mg/cm2 | |||
|---|---|---|---|---|---|---|
| Cr | Co | Mo | Re | Alloy Code | 1100 °C, 200 h | |
| 1 | 5 | 0 | 7 | 0 | 63-1000 | 0.752 |
| 2 | 5 | 10 | 12 | 0 | 58-1110 | −0.269 |
| 3 | 5 | 10 | 7 | 0 | 57-1100 | −0.478 |
| 4 | 5 | 10 | 7 | 3 | 68-1101 | −1.195 |
| 5 | 5 | 0 | 12 | 3 | 94-1011 | −1.733 |
| 6 | 2.5 | 5 | 9.5 | 1.5 | 75-5555 | −4.495 |
| 7 | 2.5 | 0 | 9.5 | 3 | 67-5051 | −5.362 |
| 8 | 0 | 0 | 7 | 0 | 61-0000 | −9.719 |
| 9 | 0 | 10 | 7 | 3 | 62-0101 | −13.392 |
| 10 | 0 | 0 | 12 | 0 | 64-0010 | −20.114 |
| 11 | 0 | 10 | 12 | 0 | 66-0110 | −27.426 |
| 12 | 0 | 10 | 12 | 0 | 95-0111 | −41.441 |
3. Results
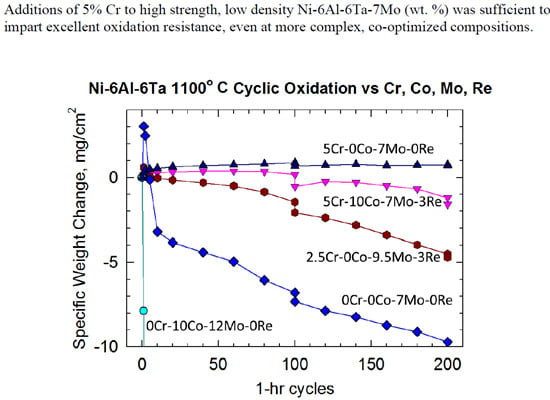
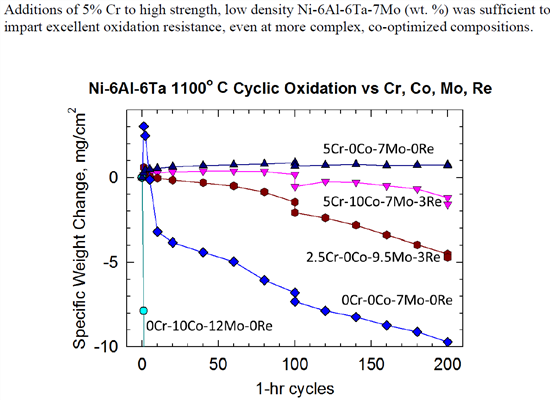
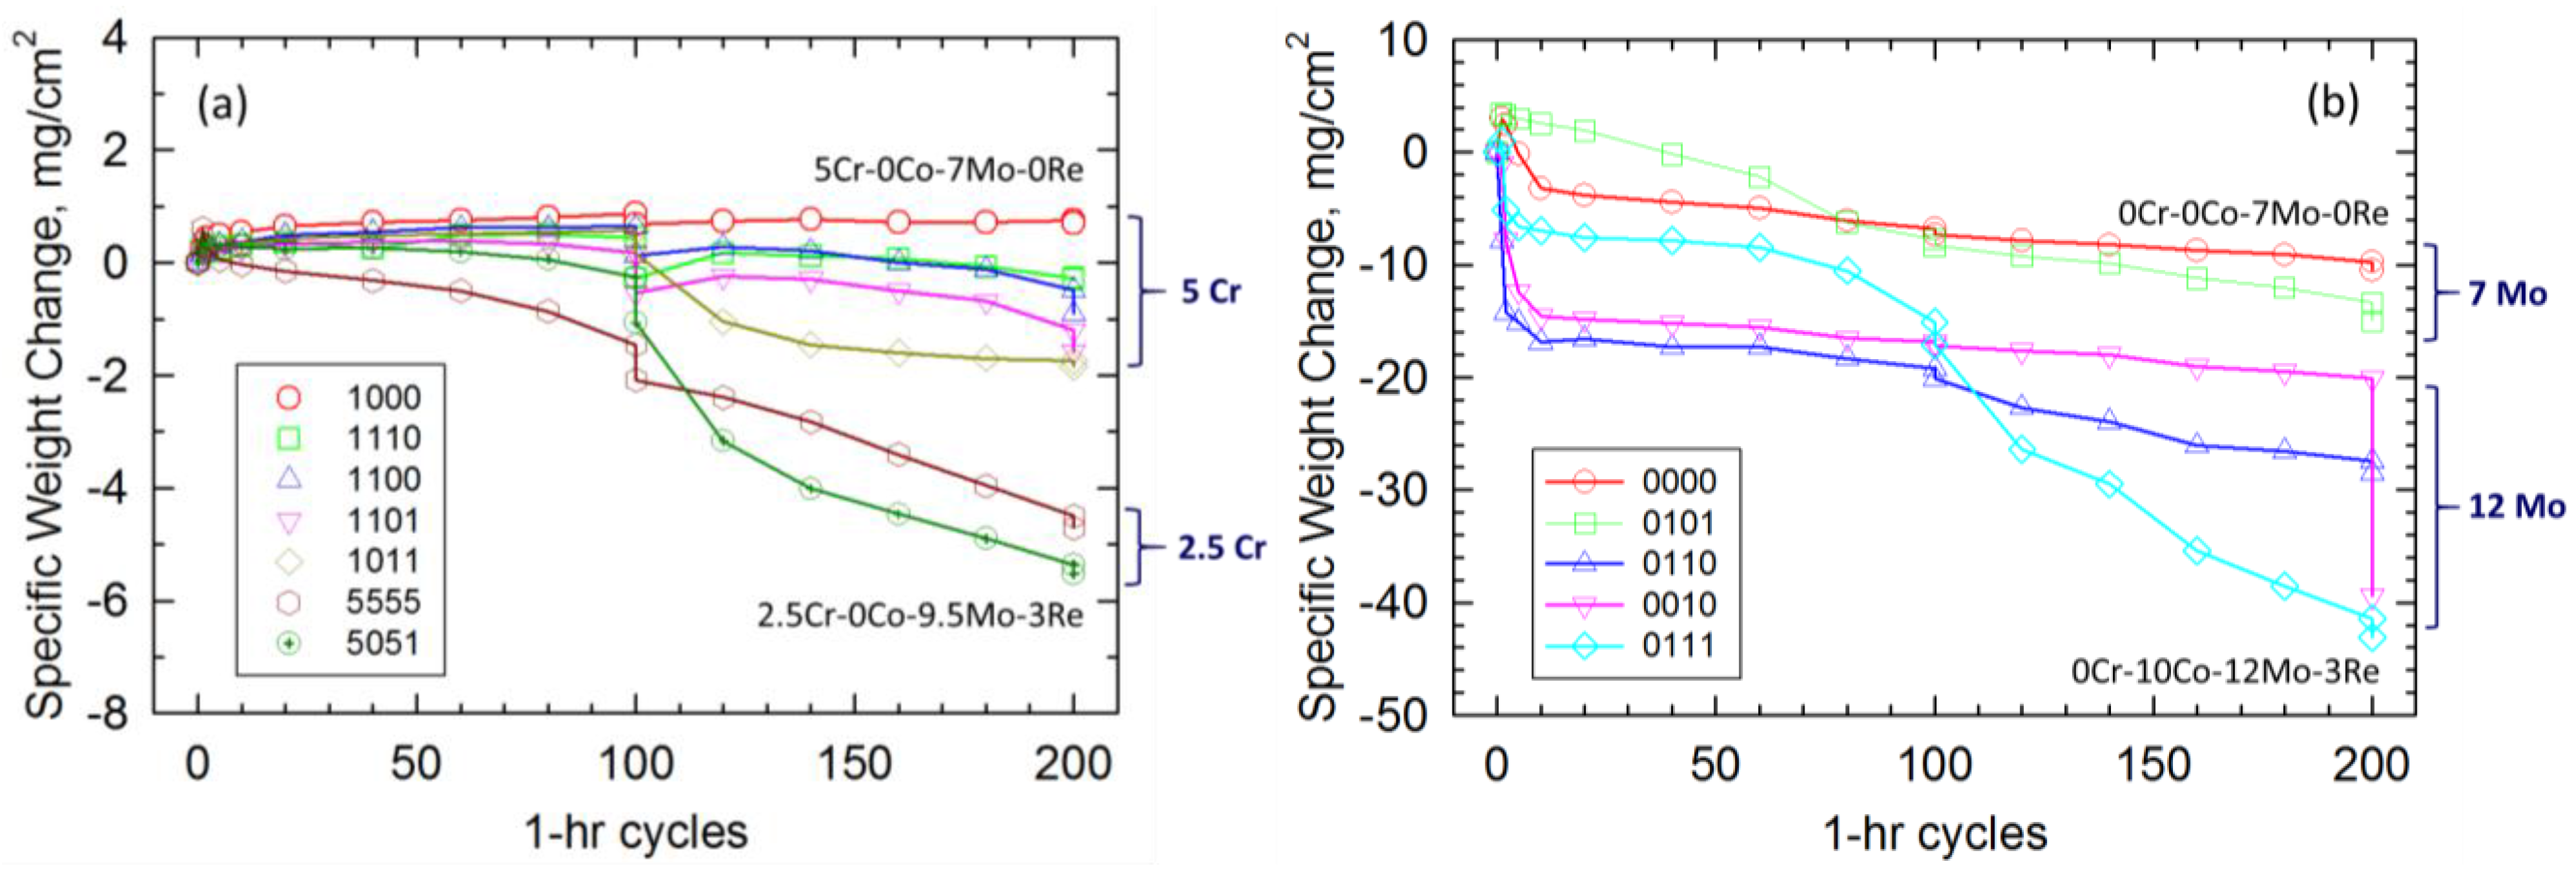
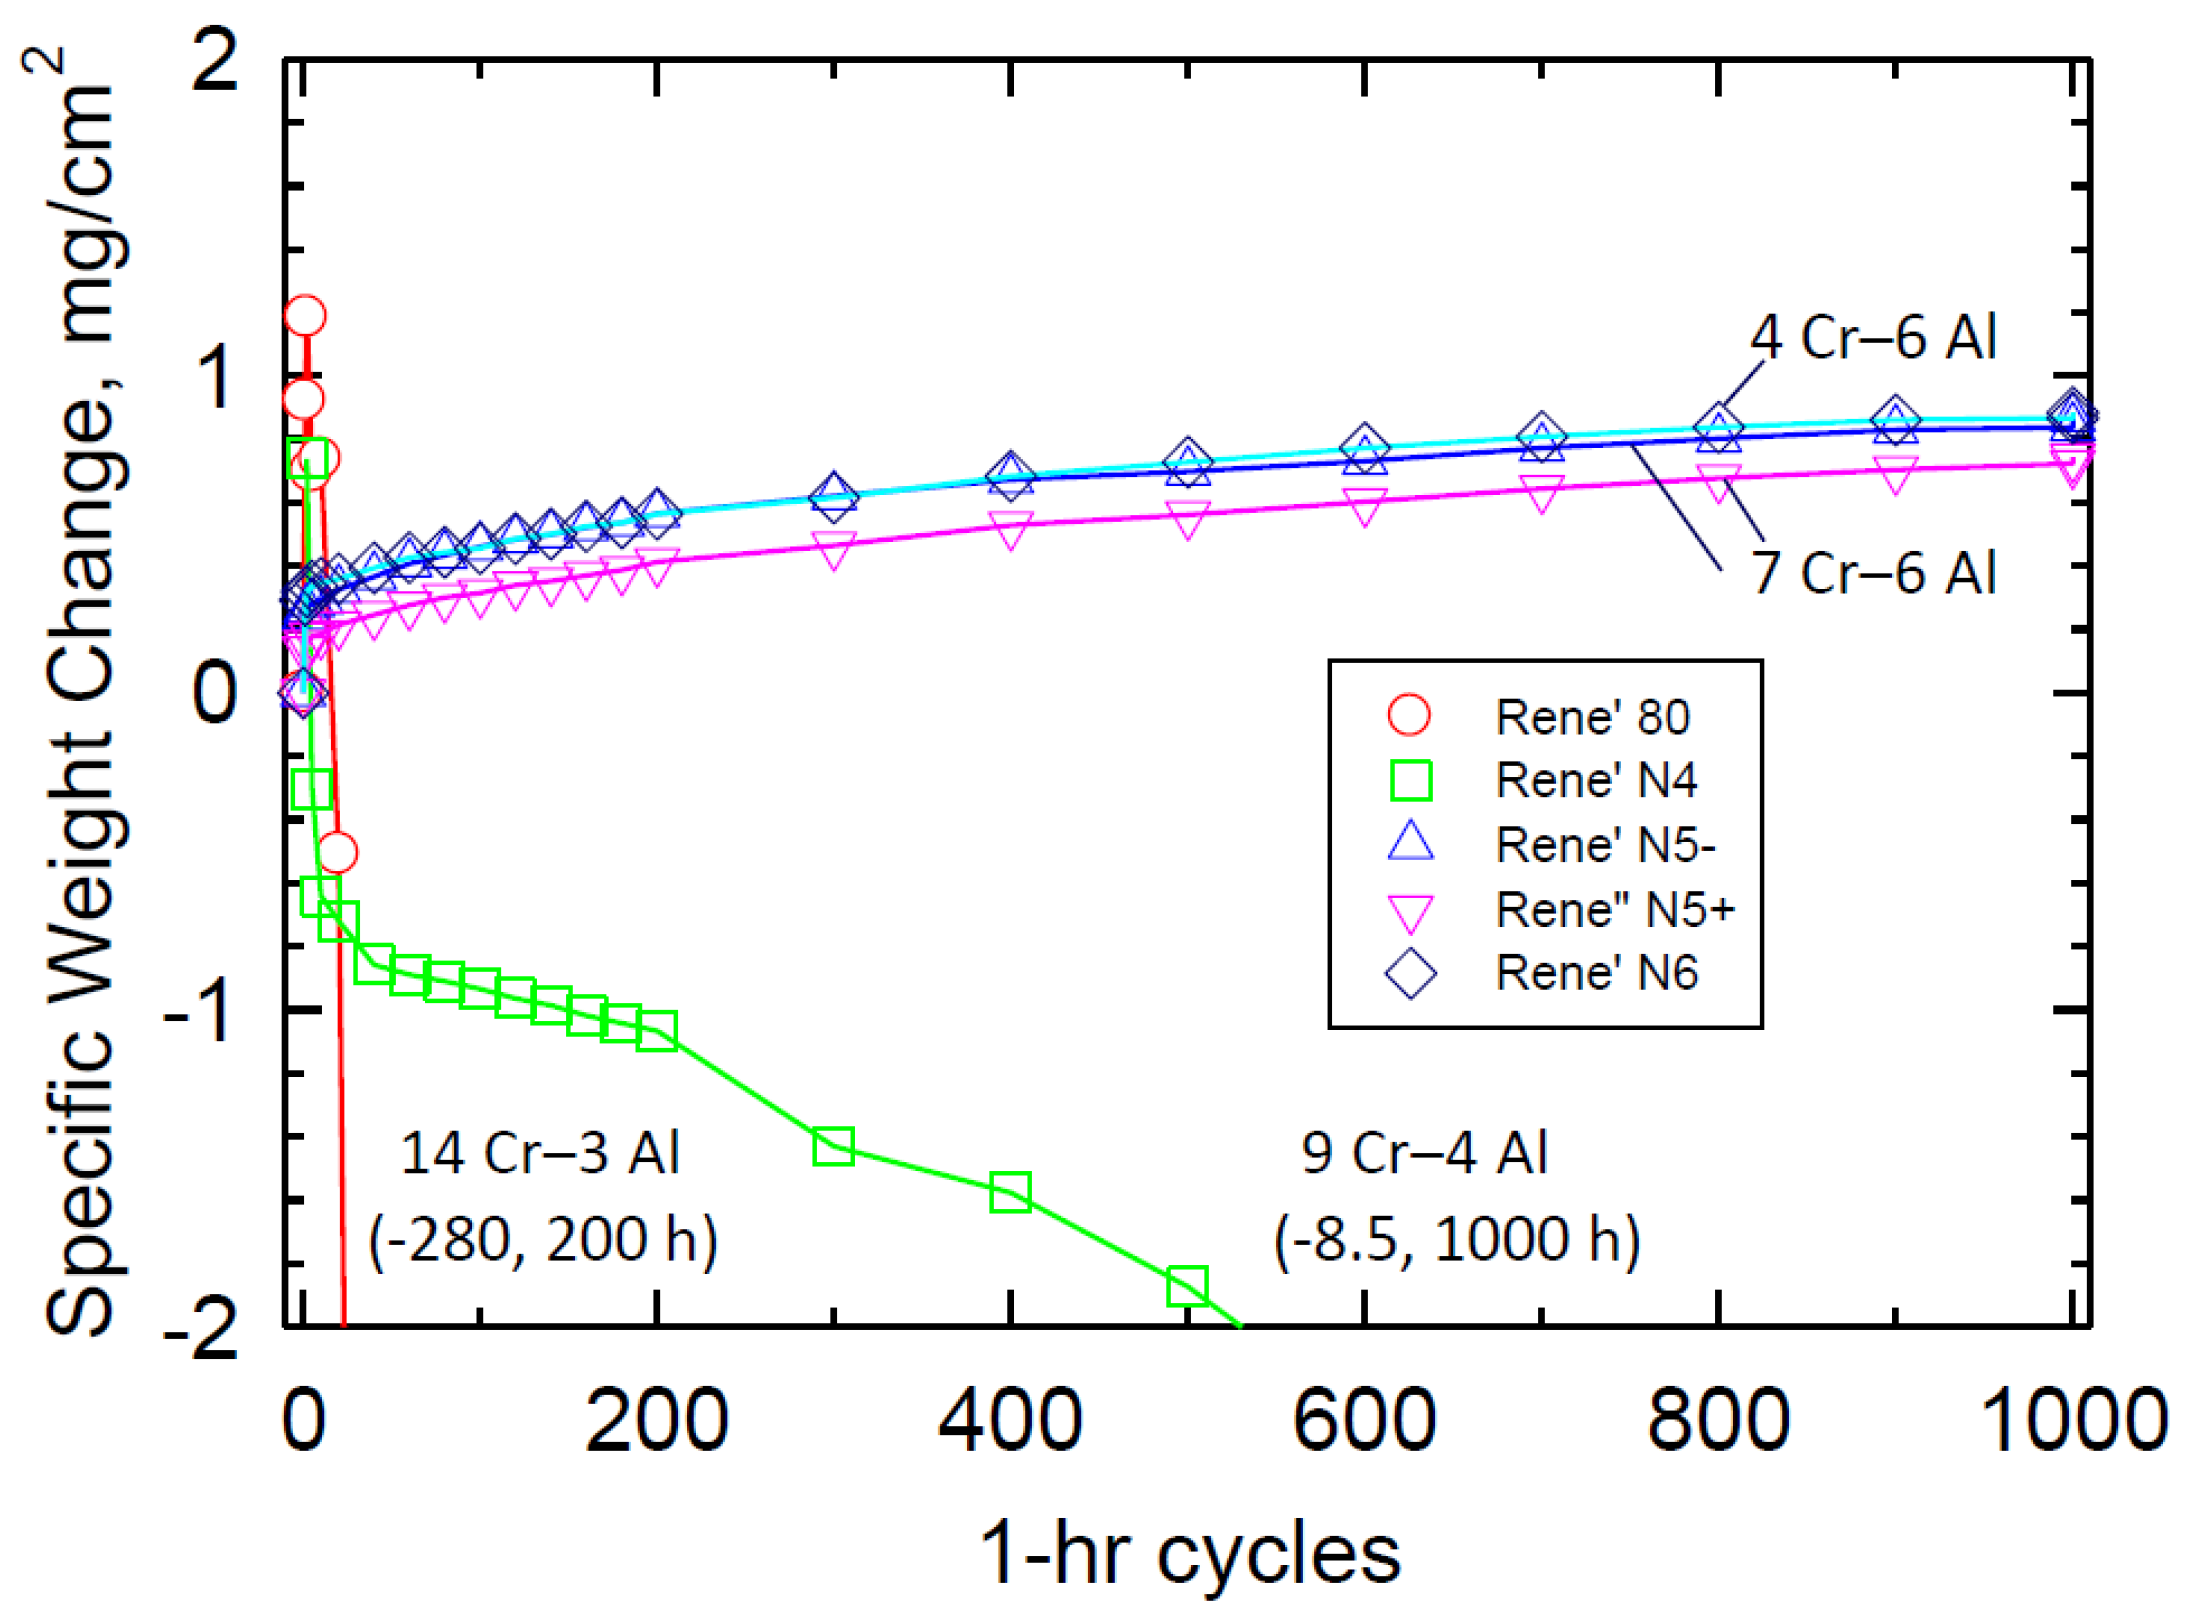
3.1. Mass Change

| (a) LDS Code | D.O.E. Composition (6.1Al, 6.2Ta) | ∆W/A, mg/cm2 | (c) Commercial Alloy Polycrystalline | ∆W/A, mg/cm2 |
|---|---|---|---|---|
| 63-1000 | 5Cr–7Mo | 0.75 | MarM 247 | −4.22 |
| 58-1110 | 5Cr–10Co–12Mo | −0.27 | IN 713 LC | −6.20 |
| 57-1100 | 5Cr–10Co–7Mo | −0.48 | Rene′ 125 | −21.22 |
| 68-1101 | 5Cr–10Co–7Mo–3Re | −1.19 | MarM 246 | −24.44 |
| 94-1011 | 5Cr–12Mo–3Re | −1.73 | Astroloy | −30.25 |
| 75-5555 | 2.5Cr–5Co–9.5Mo–1.5Re | −4.50 | Rene′ 120 | −38.57 |
| 67-5051 | 2.5Cr–9.5Mo–3Re | −5.36 | NX 188 | −48.76 |
| 61-0000 | 7Mo | −9.72 | MarM 200 | −53.59 |
| 62-0101 | 10Co–7Mo–3Re | −13.39 | U 700 | −55.21 |
| 64-0010 | 12Mo | −20.11 | MarM 421 | −74.11 |
| 66-0110 | 10Co–12Mo | −27.43 | Waspalloy | −79.29 |
| 143 FHTSX | 14–Mo | −30.51 | MarM 200 + Hf | −89.80 |
| 95-0111 | 10Co–12Mo–3Re | −41.44 | IN 792 | −166.26 |
| 143 VIM | 14Mo | −95.57 | U 520 | −172.80 |
| (b) Single Crystals | (5–6Al, 4–12Ta) | ΔW/A, mg/cm2 | IN 100 | −180.33 |
| H2 PWA 1480 | 10Cr–4W–1.5Ti(0.14S) | 0.61 | IN 939 | −227.60 |
| Rene′ N5− | 7Cr–5W | 0.57 | IN 738 | −232.45 |
| Rene′ N6 | 4Cr–6W | 0.56 | MarM 211 | −269.76 |
| deS PWA 1484 | 5Cr–6W(0.3S) | 0.49 | U 710 | −270.20 |
| H2 PWA 1480 | 10Cr–4W–1.5Ti(0.01S) | 0.45 | IN 718 | −284.60 |
| Rene′ N5+ | 7Cr–5W + Y | 0.41 | IN 625 | −293.20 |
| PWA 1484 | 5Cr–6W(1.2S) | 0.33 | U 720 | −313.50 |
| Rene′ N4 | 4Al–9Cr–6W–4Ti | −1.07 | Rene′ 80 | −330.35 |
| PWA 1480 | 10Cr–4W–1.5Ti(6.7S) | −7.44 |
3.2. X-ray Diffraction
| Alloy | Scale Phases | Alloy | Scale Phases | Alloy | Scale Phases |
|---|---|---|---|---|---|
| 63-1000 | NiO | 94-1011 | NiO | 62-0101 | NiO |
| Al2O3 | NiTa2O6 | NiTa2O6 | |||
| NiTa2O6 | spinel, 8.15 Å | spinel, 8.10 Å | |||
| spinel, 8.10 Å | Al2O3(m) | Al2O3(vm) | |||
| 58-1110 | NiO | 75-5555 | NiO | 66-0110 | NiO |
| spinel, 8.30 Å | NiTa2O6 | NiTa2O6 | |||
| NiTa2O6 | spinel, 8.10 Å | spinel, 8.10 Å | |||
| Al2O3(m) | Al2O3(vm) | Al2O3(vm) | |||
| 57-1100 | NiO | 67-5051 | NiTa2O6 | 64-0010 | NiO |
| Al2O3 | NiO | NiTa2O6 | |||
| spinel, 8.10 Å | spinel, 8.10 Å | spinel, 8.10 Å | |||
| NiTa2O6 | Al2O3(m) | Al2O3(vm) | |||
| 68-1101 | NiO | 61-0000 | NiO | 95-0111 | NiO |
| NiTa2O6 | NiTa2O6 | NiTa2O6 | |||
| spinel, 8.15 Å | spinel, 8.05 Å | spinel, 8.10 Å | |||
| - | Al2O3(m) | CoMoO4 |
| Alloy | Scale Phases (1100 °C, 1000 h) |
|---|---|
| Rene′ 80 (200 h) | NiO |
| spinel, 8.35 Å | |
| TiO2 | |
| Cr2O3 | |
| Ni(Mo,W)O4 | |
| Rene′ N4 (1000 h) | spinel, 8.10 Å |
| TiO2 | |
| Al2O3 | |
| Rene′ N5 (1000 h) | NiTa2O6 |
| spinel, 8.10 Å | |
| Al2O3 | |
| Rene′ N5 + Y (1000 h) | NiTa2O6 |
| spinel, 8.10 Å | |
| Al2O3 | |
| Rene′ N6 (1000 h) | spinel, 8.10 Å |
| NiO | |
| NiTa2O6 | |
| Al2O3 |
| Sample | LDS | %Cr | Weight, mg/cm2 | α-Al2O3 | Spinel Ni(Al,Cr)2O4 | a0, Å | Rutile (Ni,Cr)Ta2O6 | NiO | Ni |
|---|---|---|---|---|---|---|---|---|---|
| 2-49 surface | 1011 | 5Cr | −4.70 | W | 8.15 | W | S | VS | |
| 2-49 spall | 1011 | 5Cr | W | 8.10 | W | S | - | ||
| 2-51 surface | 1011 | 5Cr | −7.88 | M | 8.15 | M | S | VS | |
| 2-51 spall | 1011 | 5Cr | M | 8.07 | M | S | - | ||
| 2-50 surface | 5555 | 2.5Cr | −52.98 | W | 8.10 | M | S | VS | |
| 2-50 spall | 5555 | 2.5Cr | W | 8.10 | W | VS | - | ||
| 2-48 surface | 0010 | 0Cr | −109.23 | M | 8.05 | M | S | - | |
| 2-48 spall | 0010 | 0Cr | W | 8.03 | W | S | - | ||
| 143 VIM surface | 0010 | 0Cr | −95.57 | W | 8.05 | M | VS | S | |
| 143 VIM spall | 0010 | 0Cr | VVW | W | 8.05 | M | VS | - | |
| 143 SX surface | 0010 | 0Cr | −30.51 | W | 8.05 | W | VS | - | |
| 143 SX spall | 0010 | 0Cr | VVW | M | 8.05 | M | VS | - |
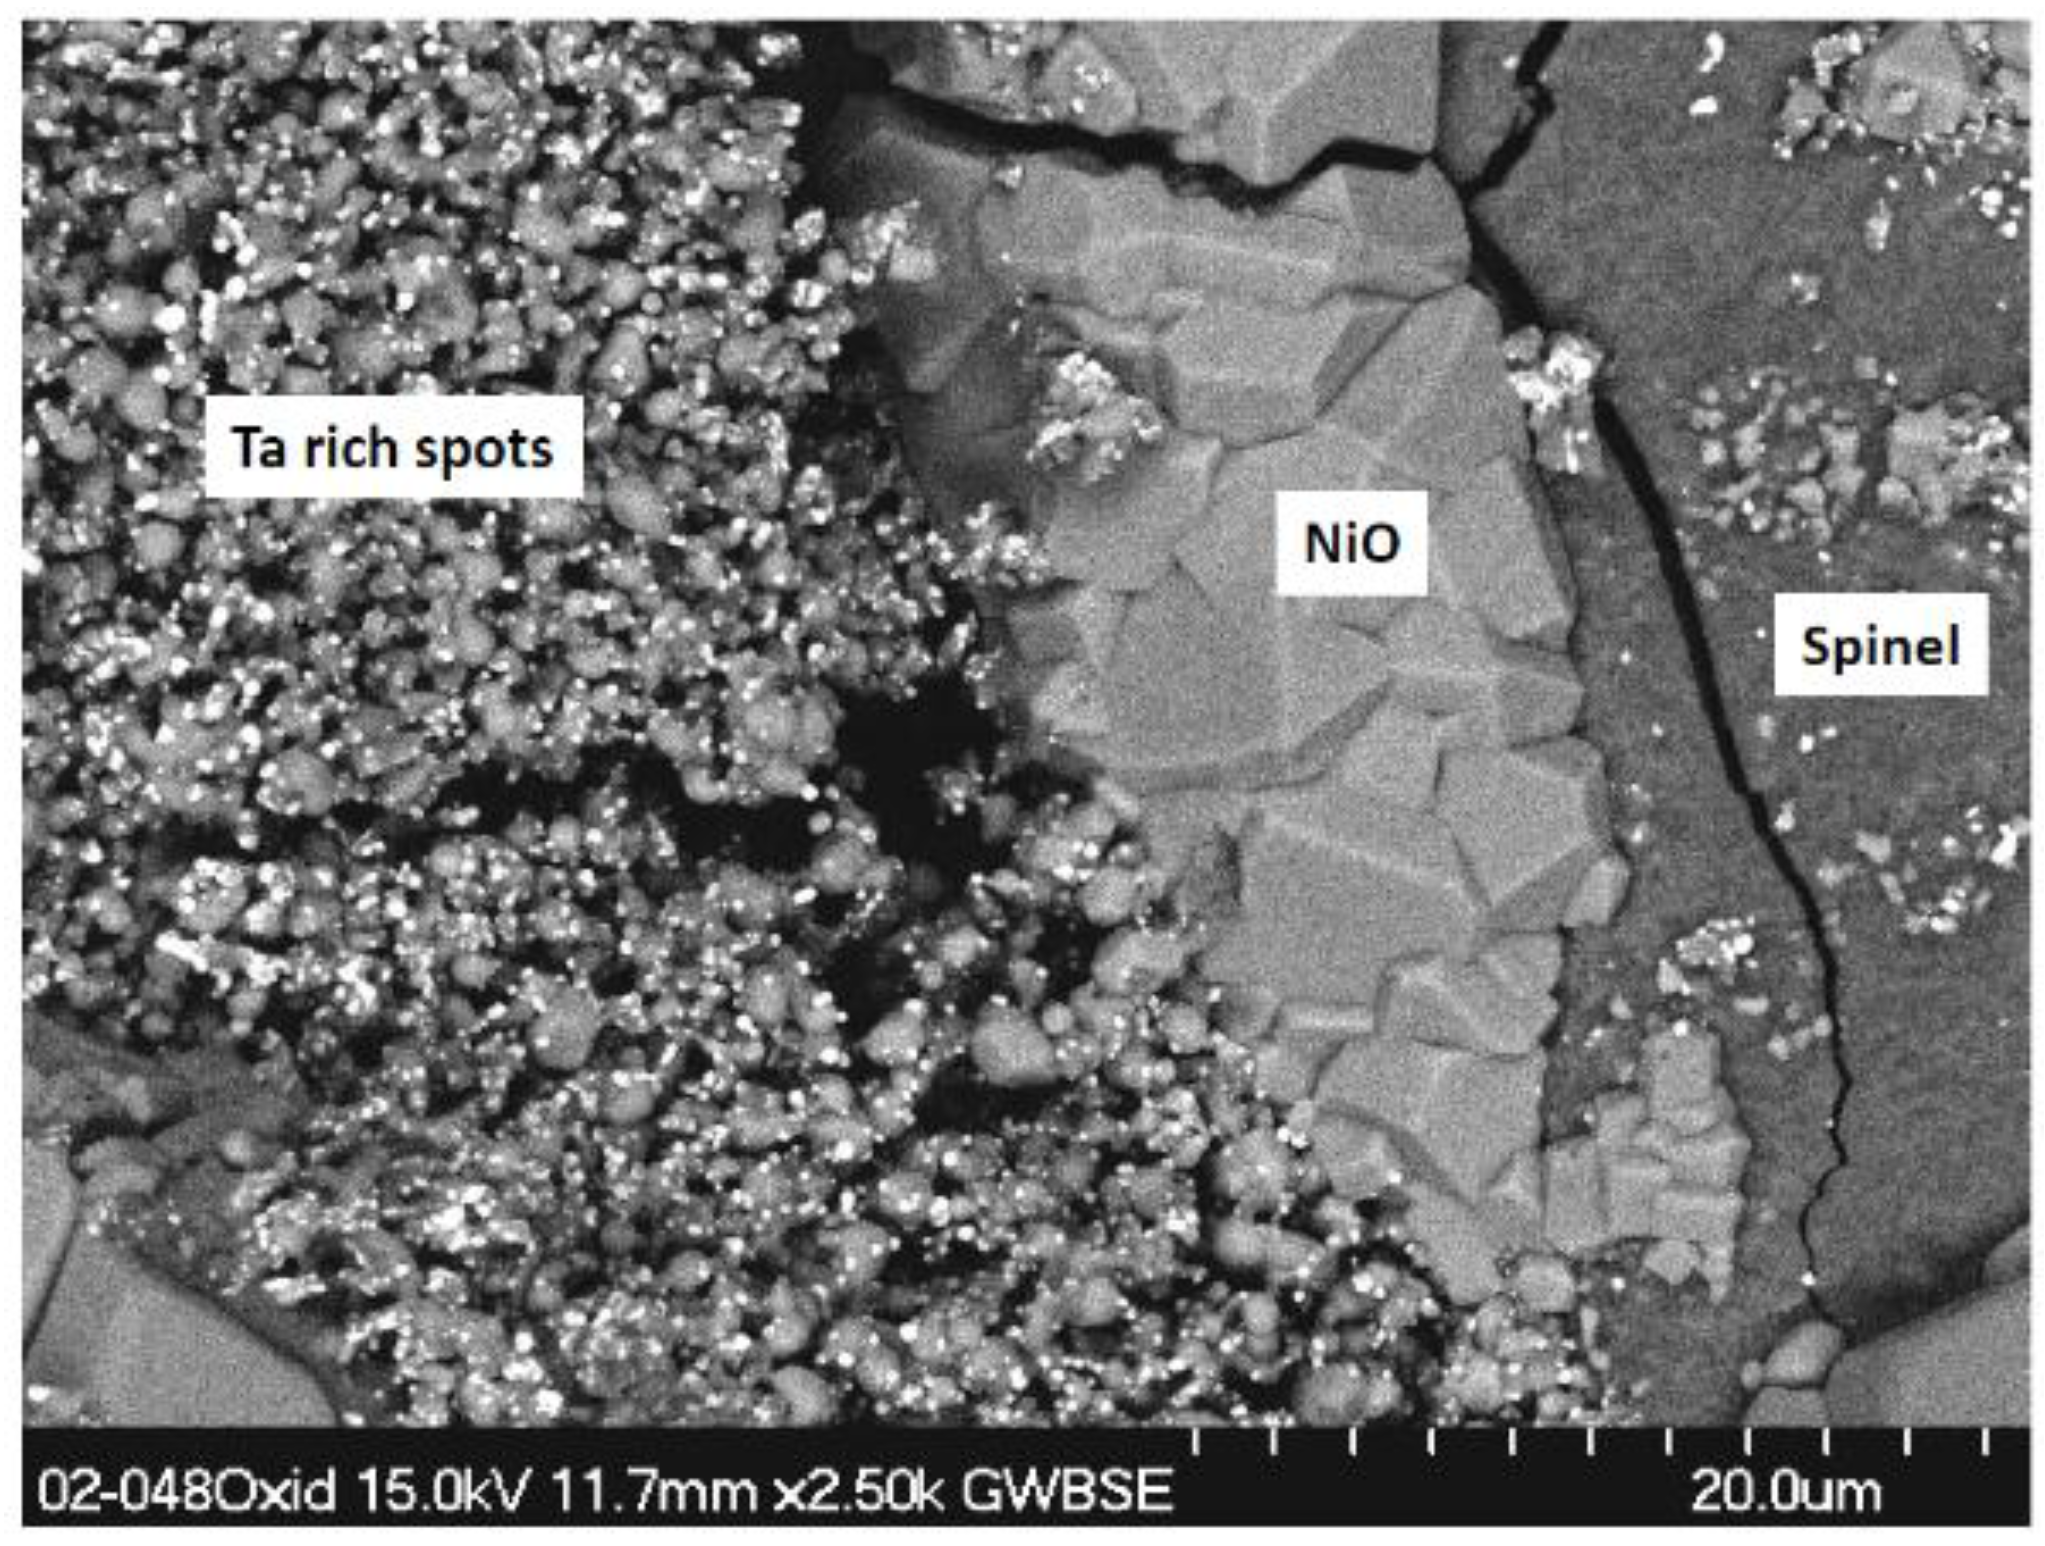
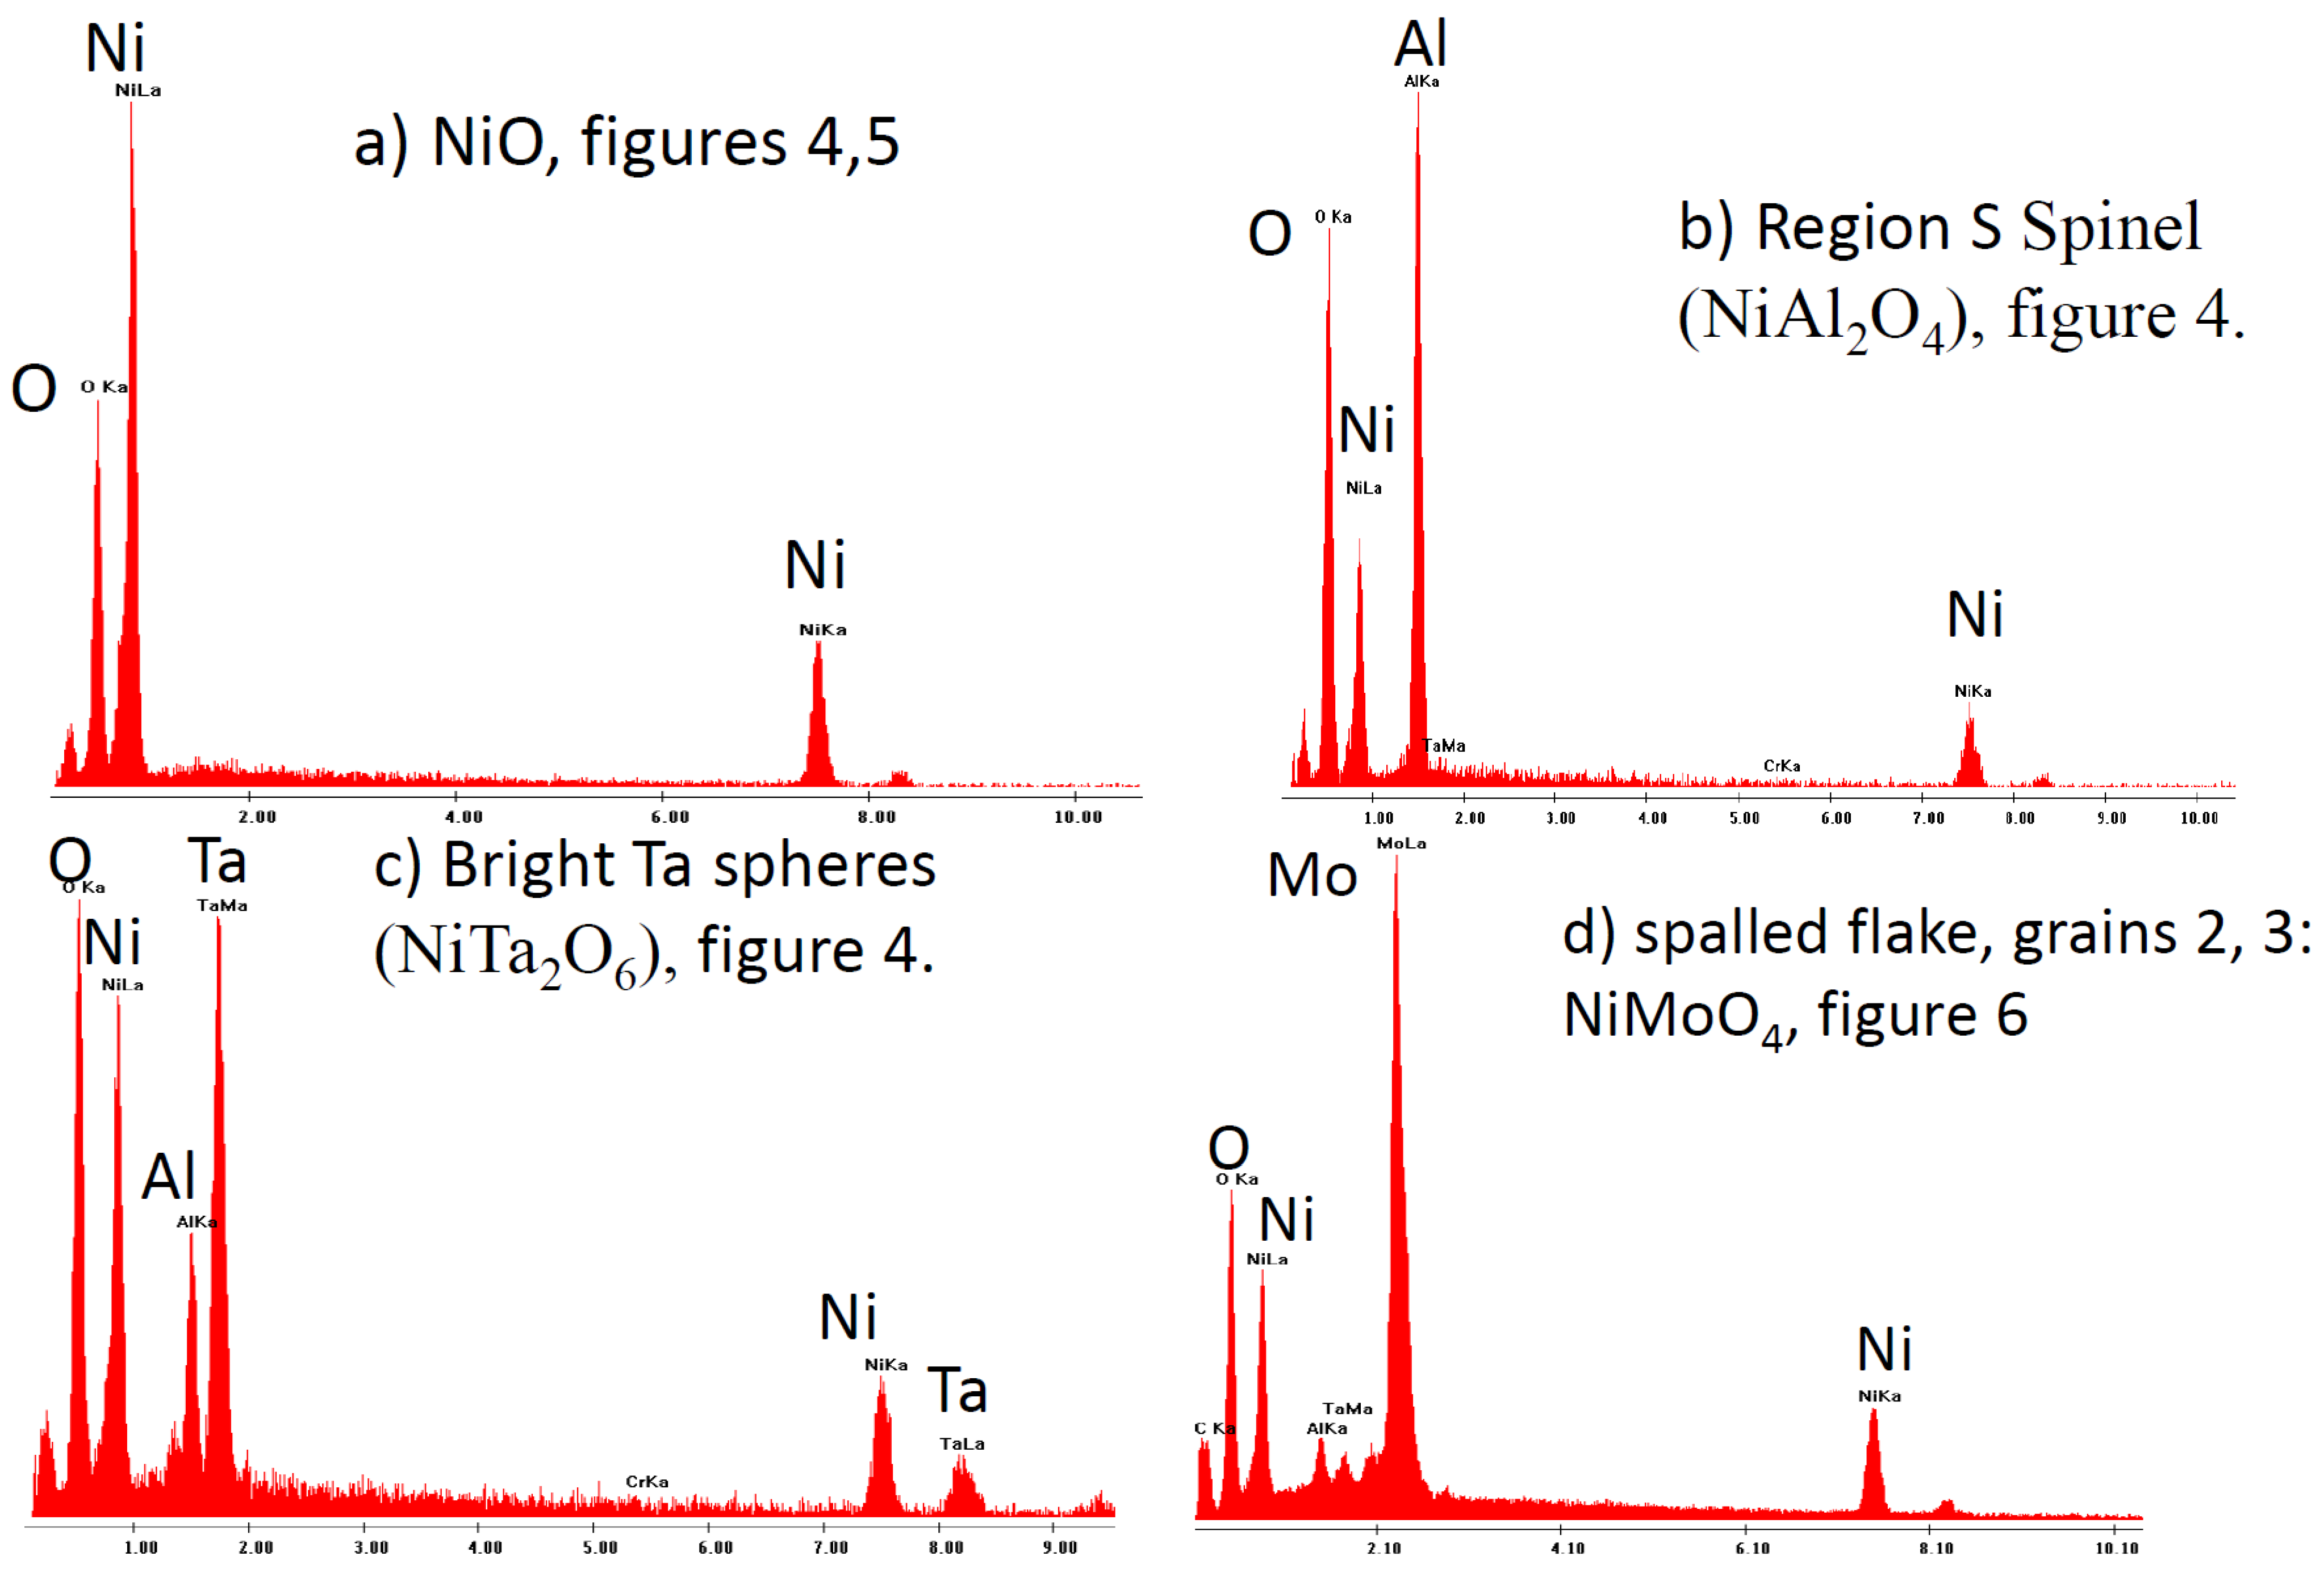
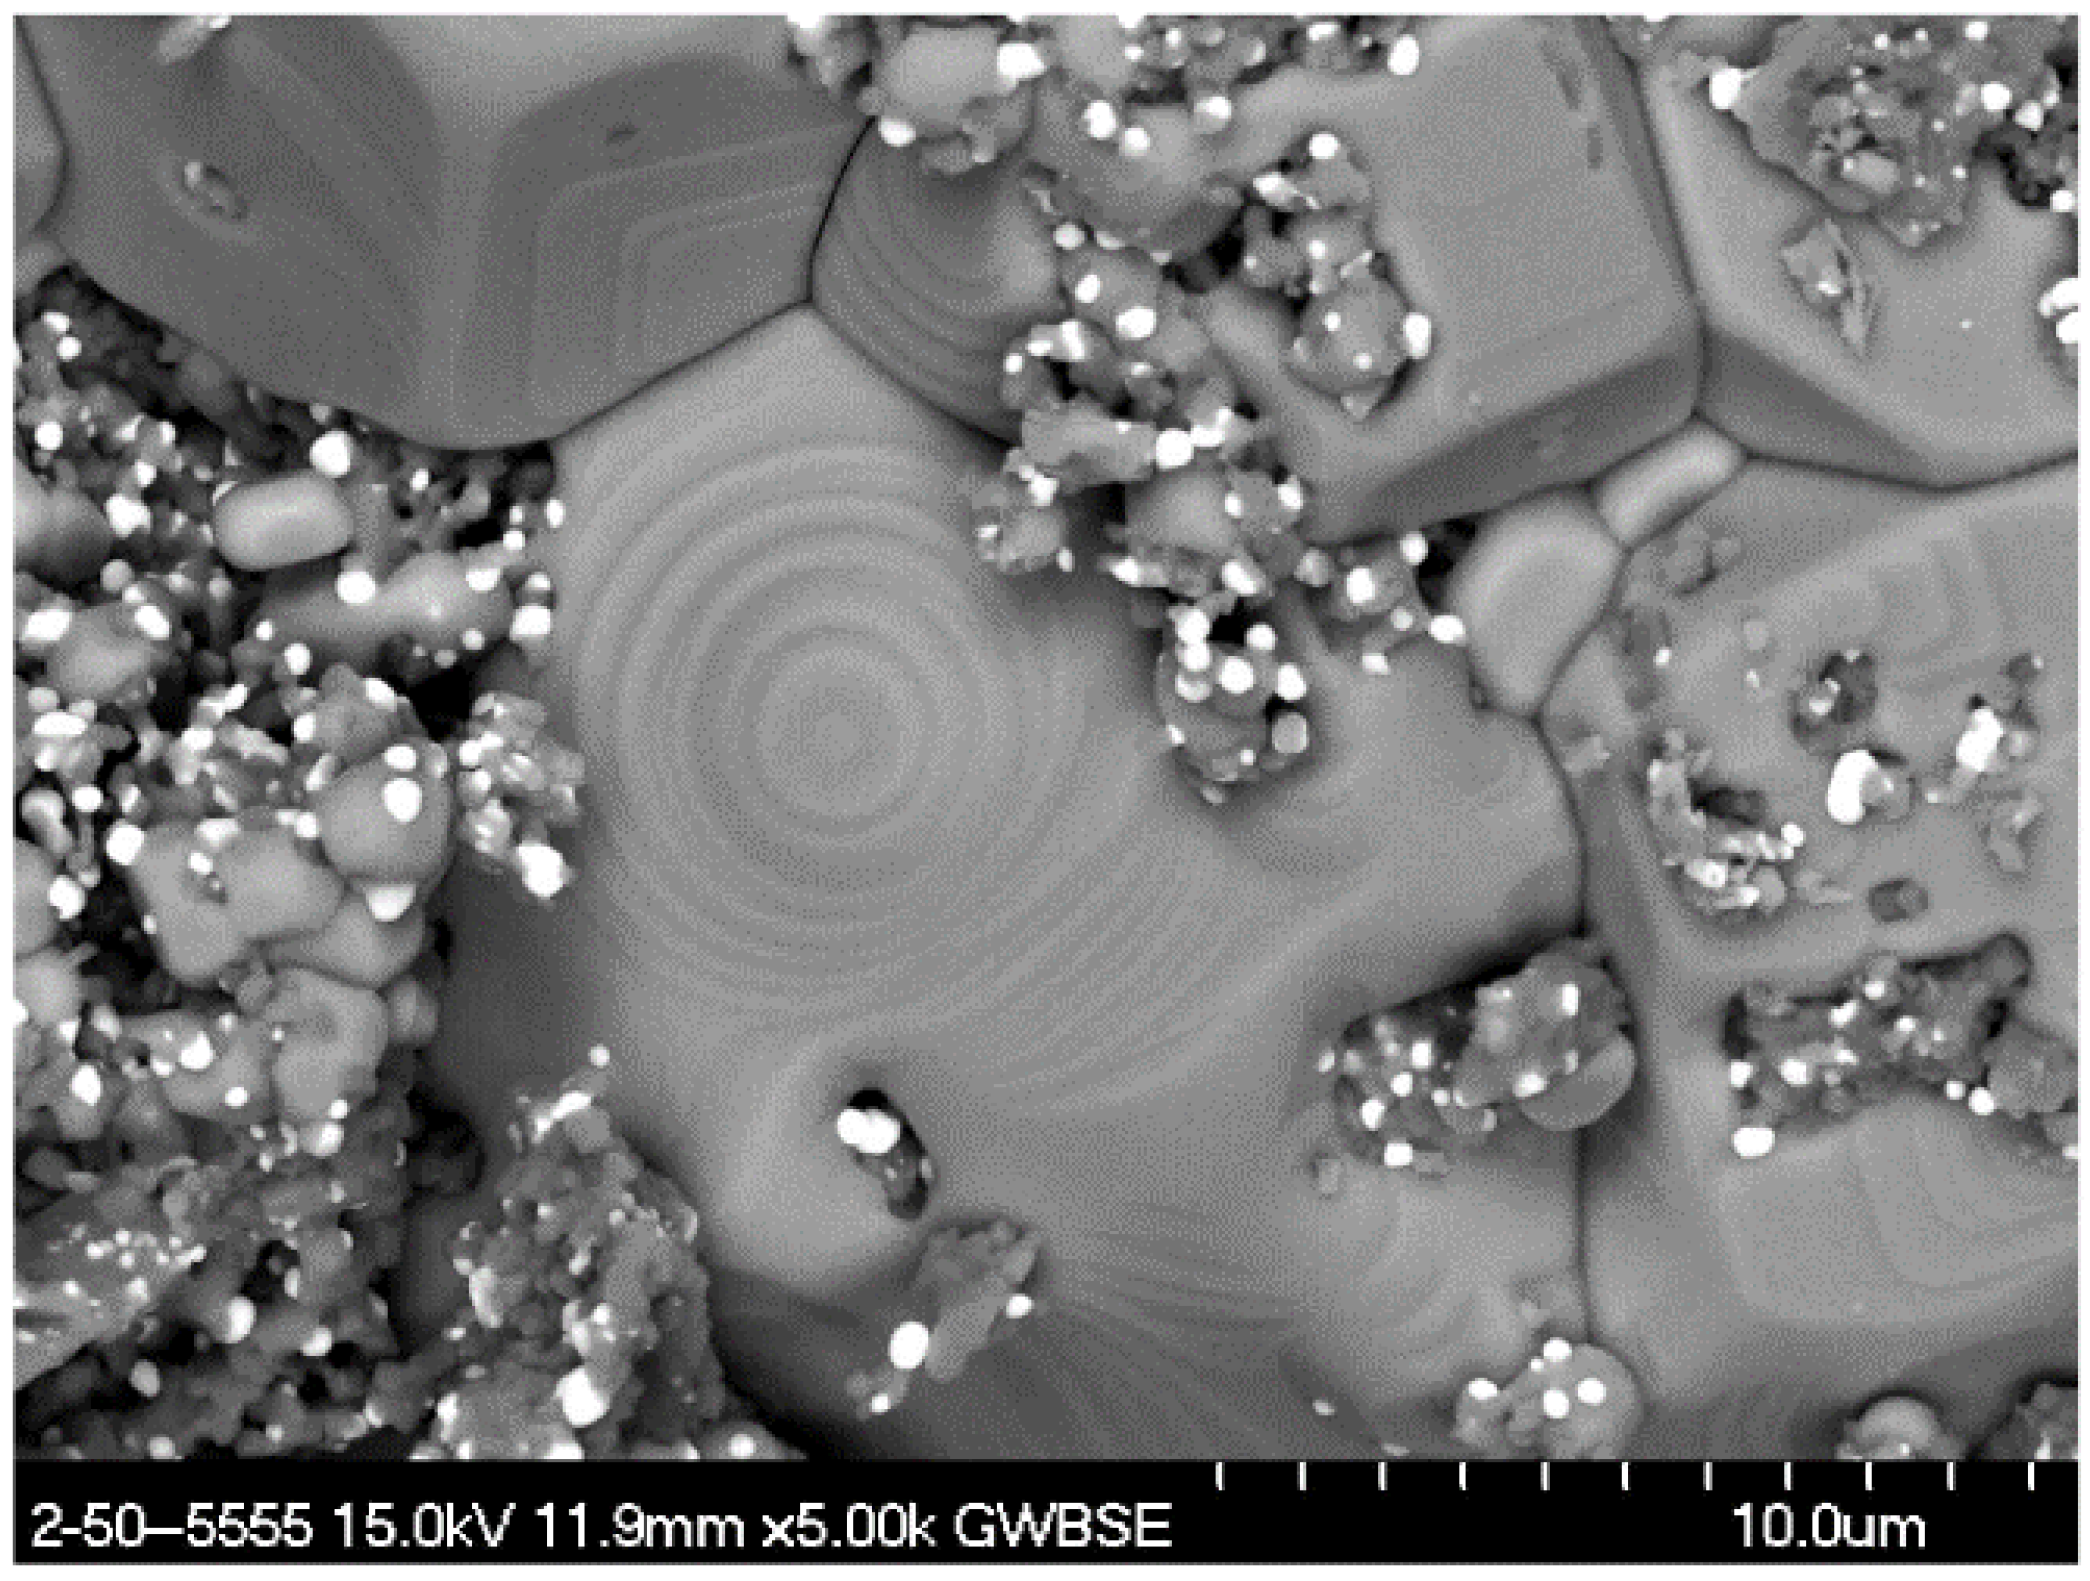
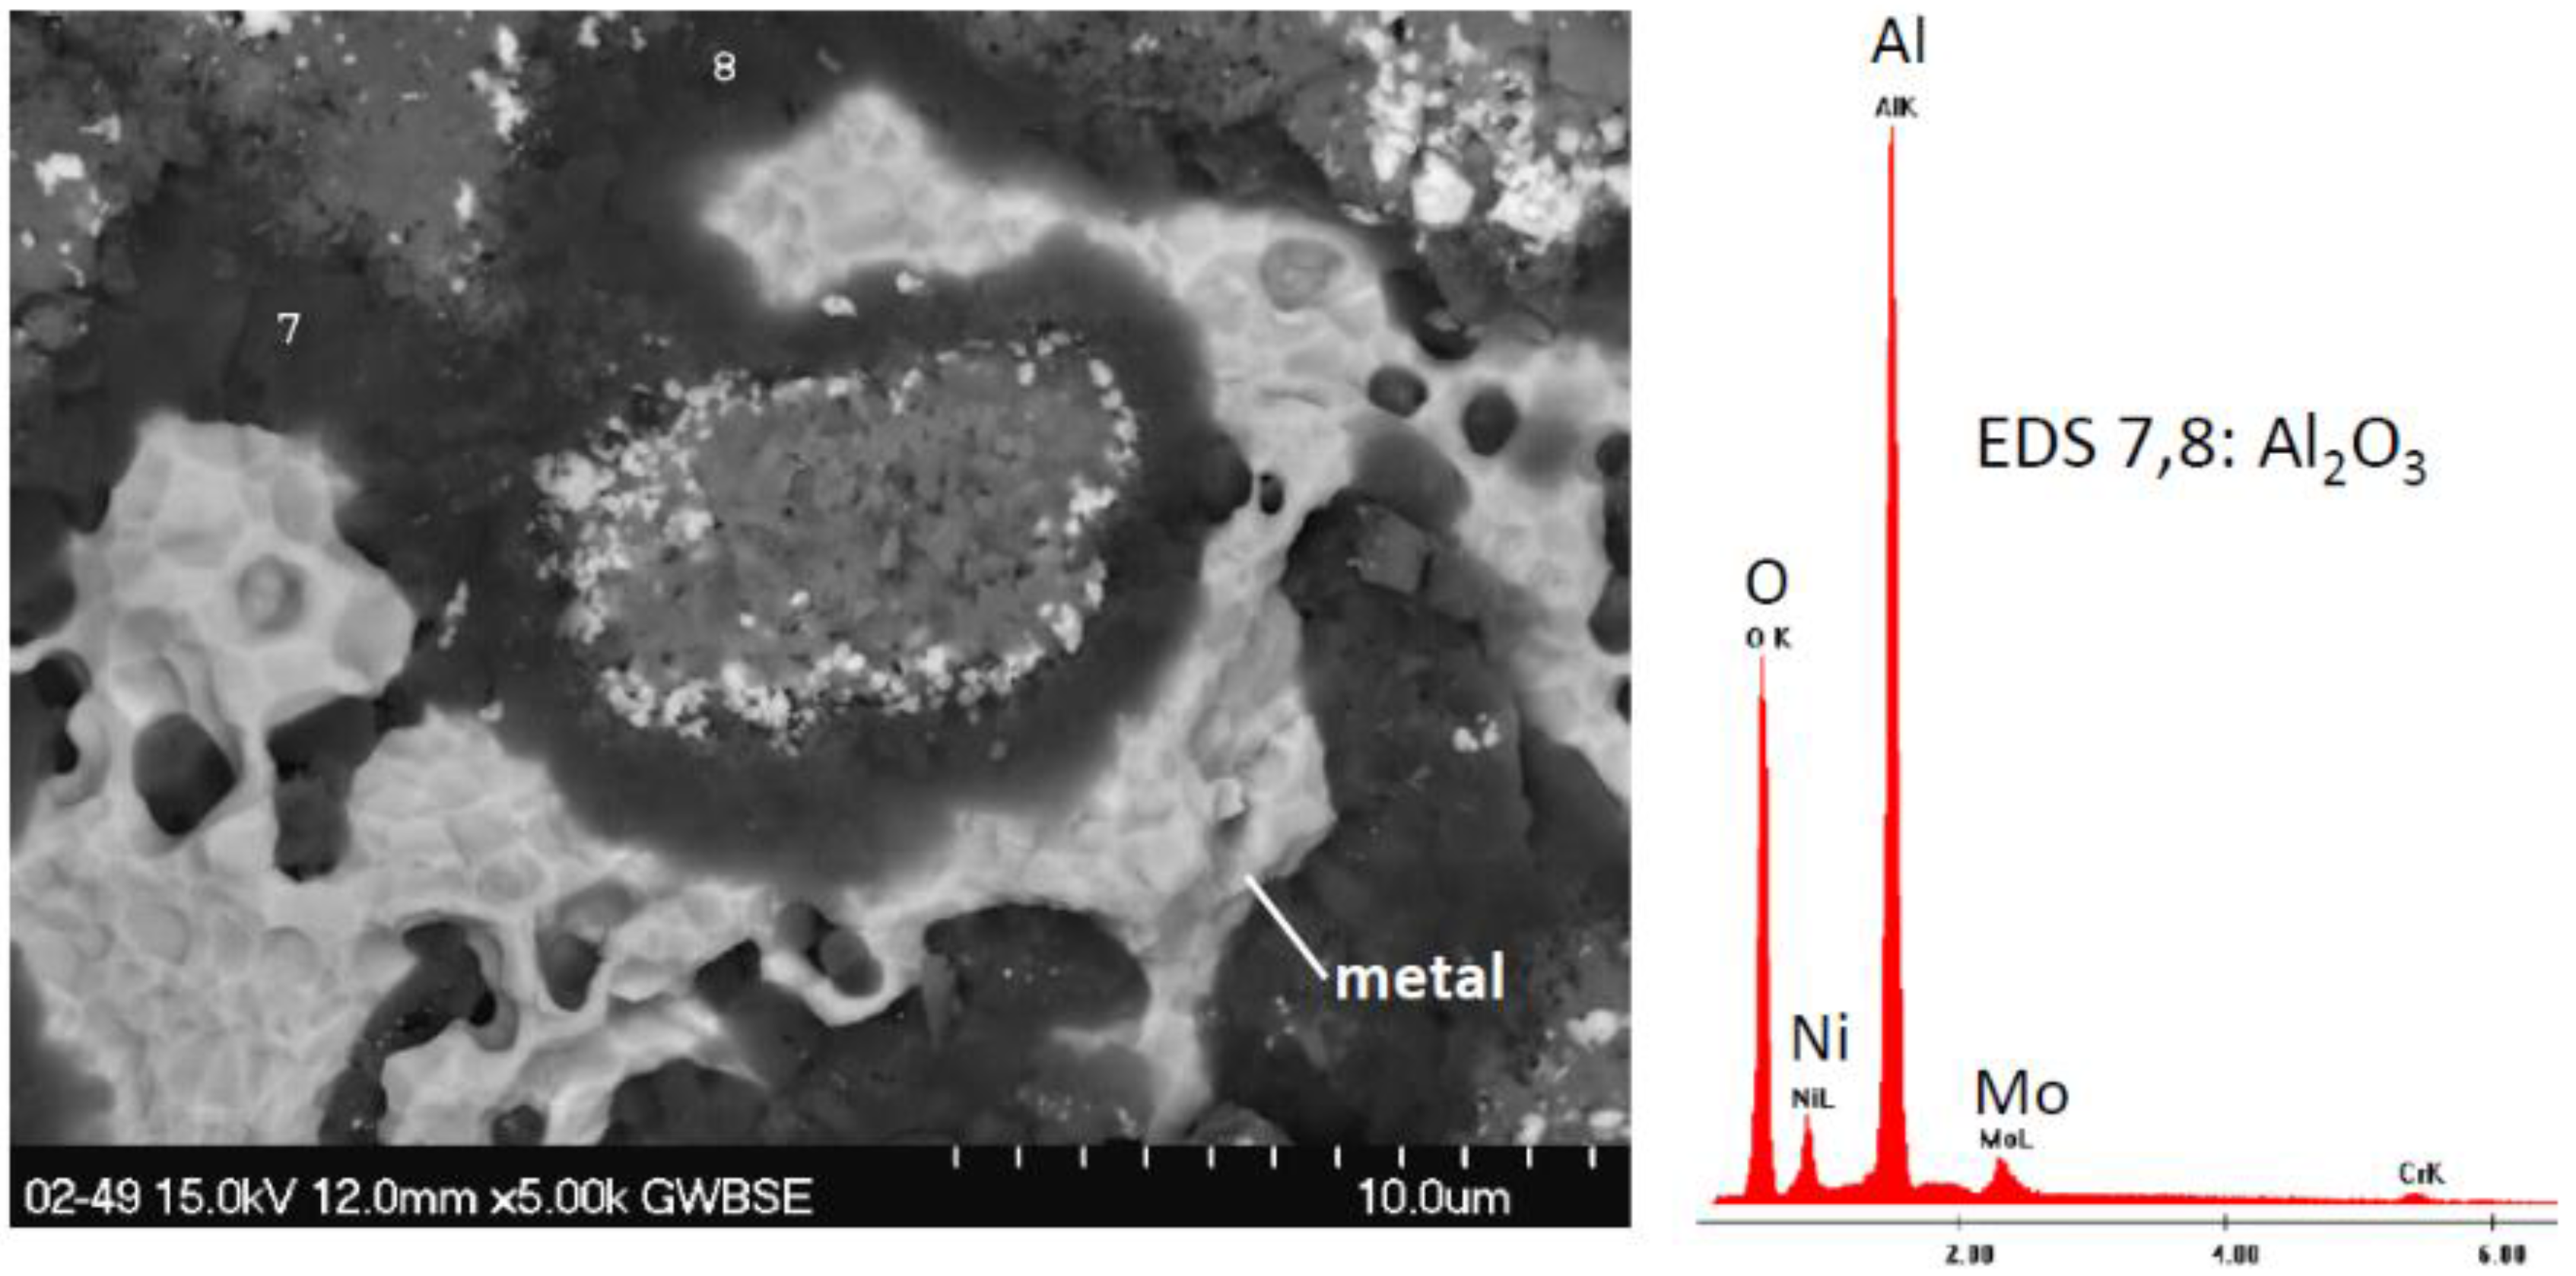
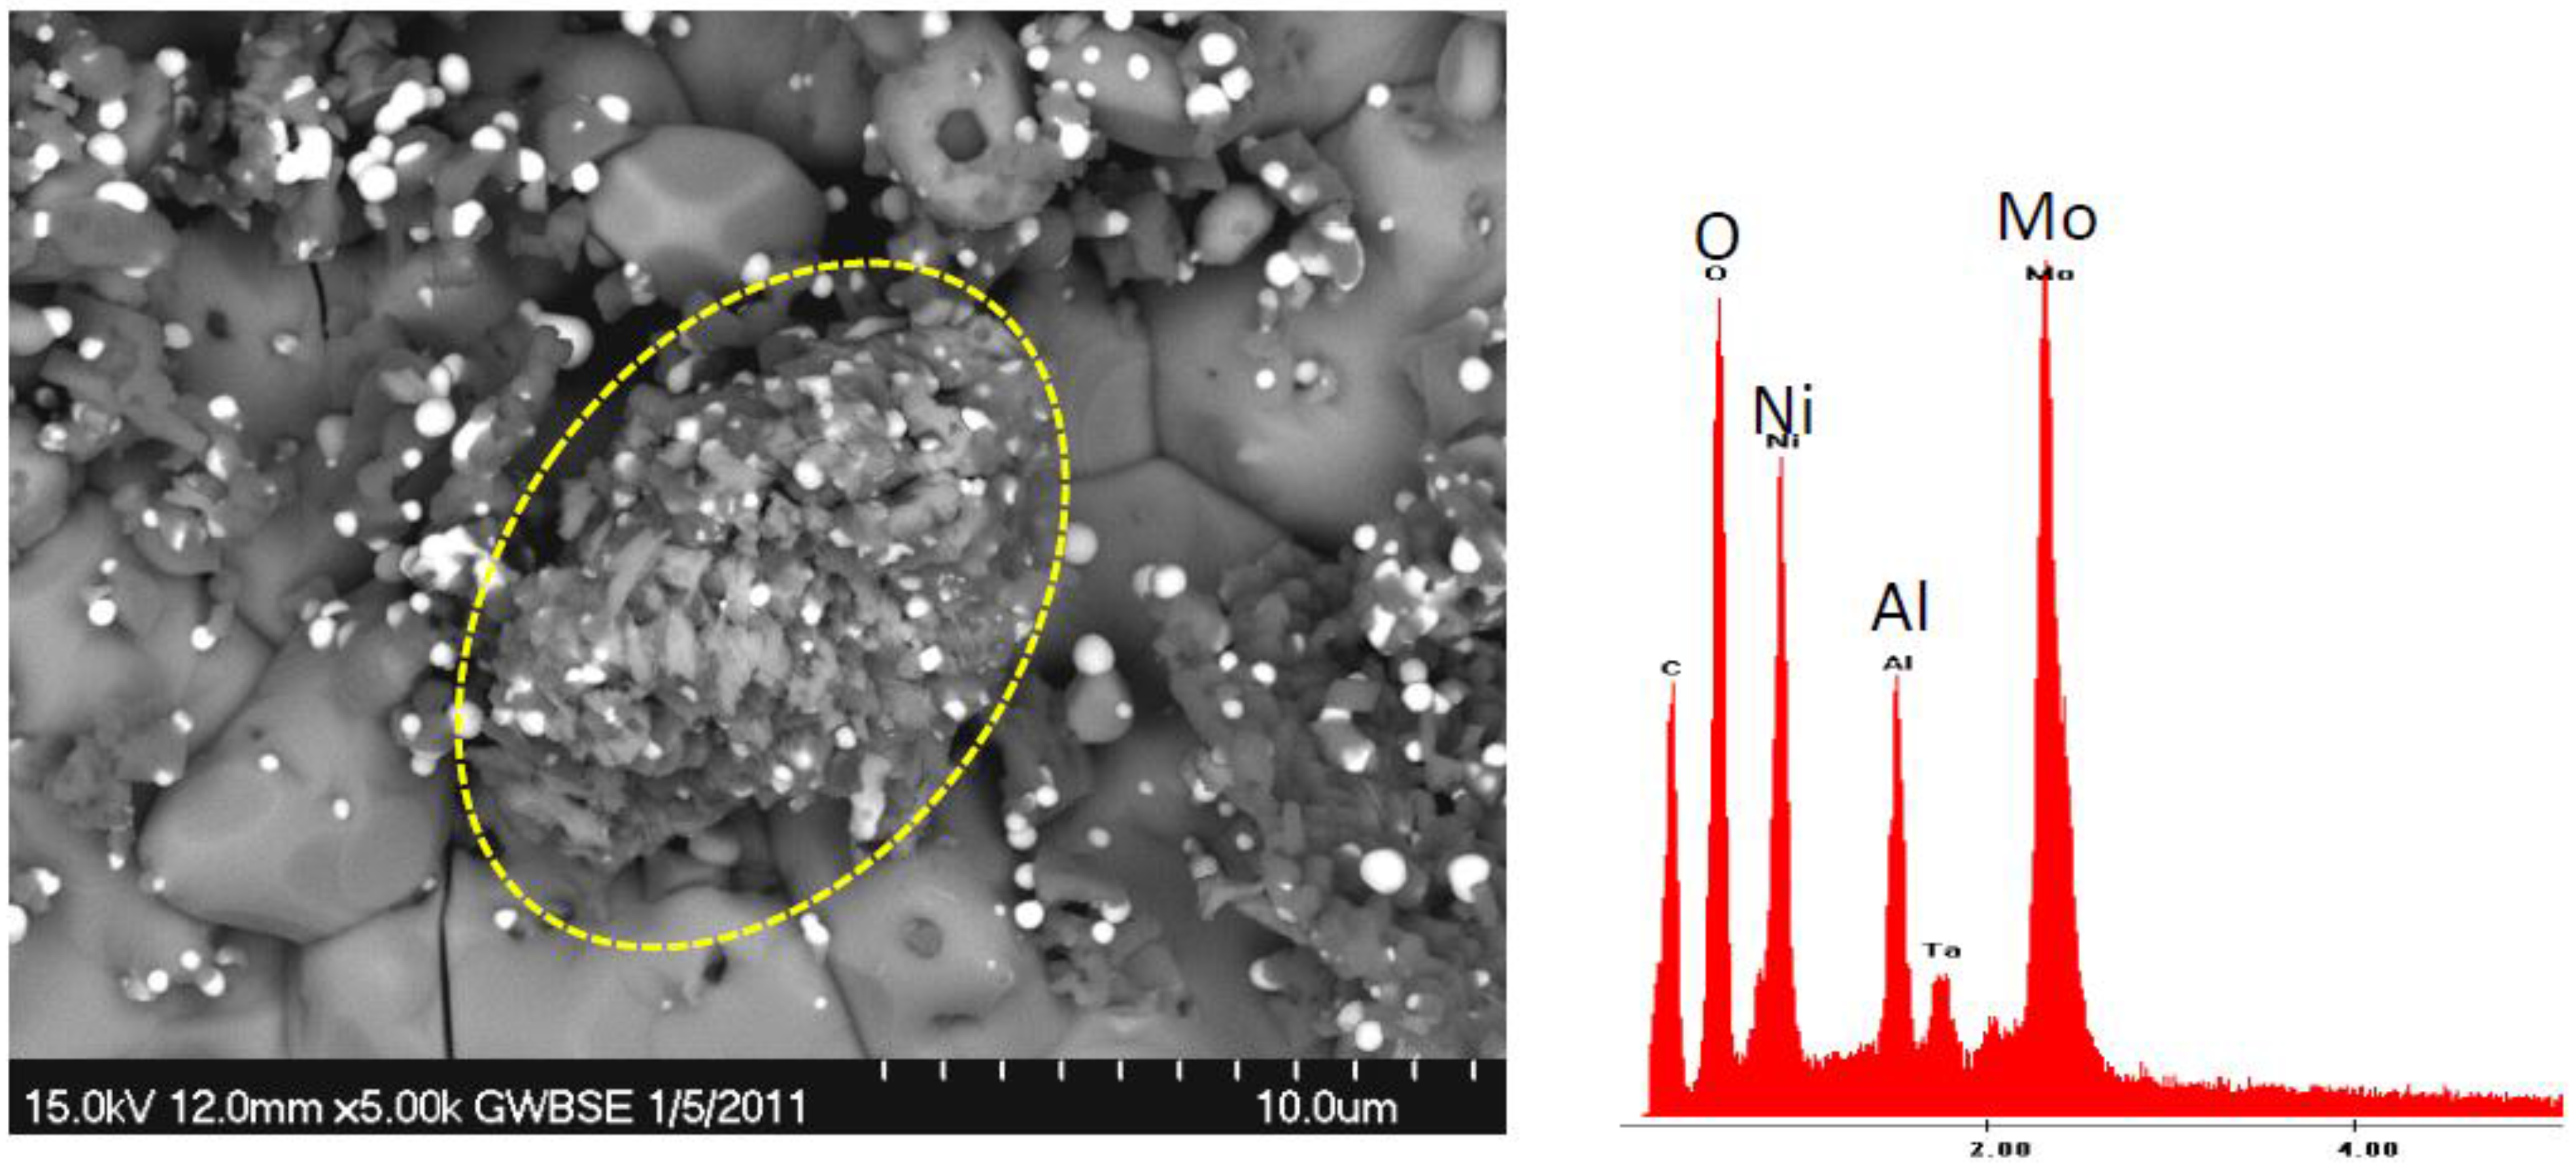
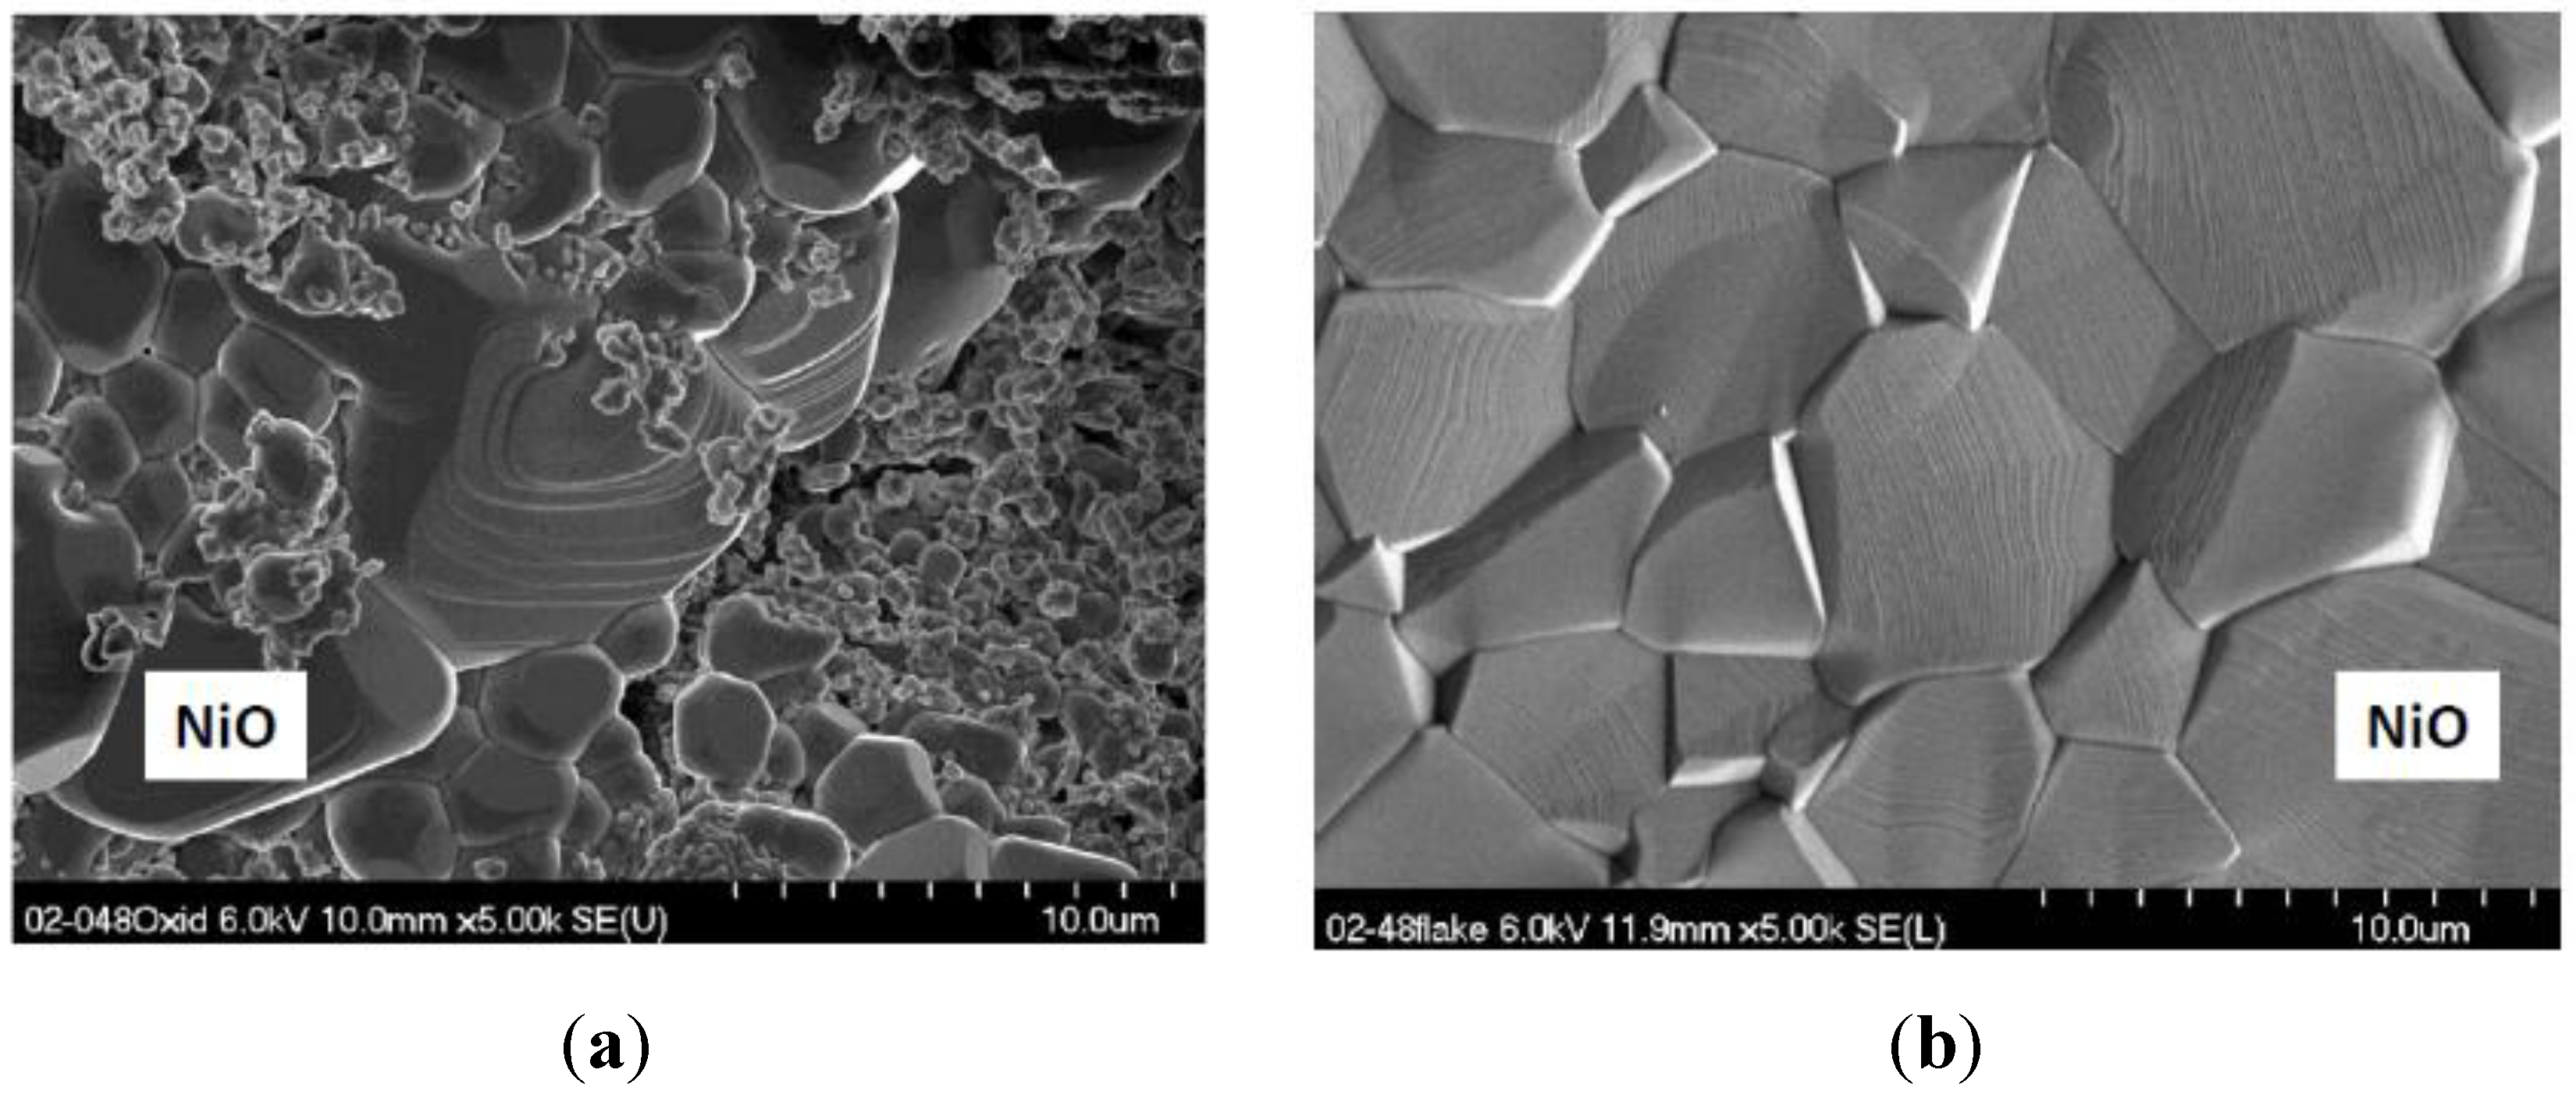
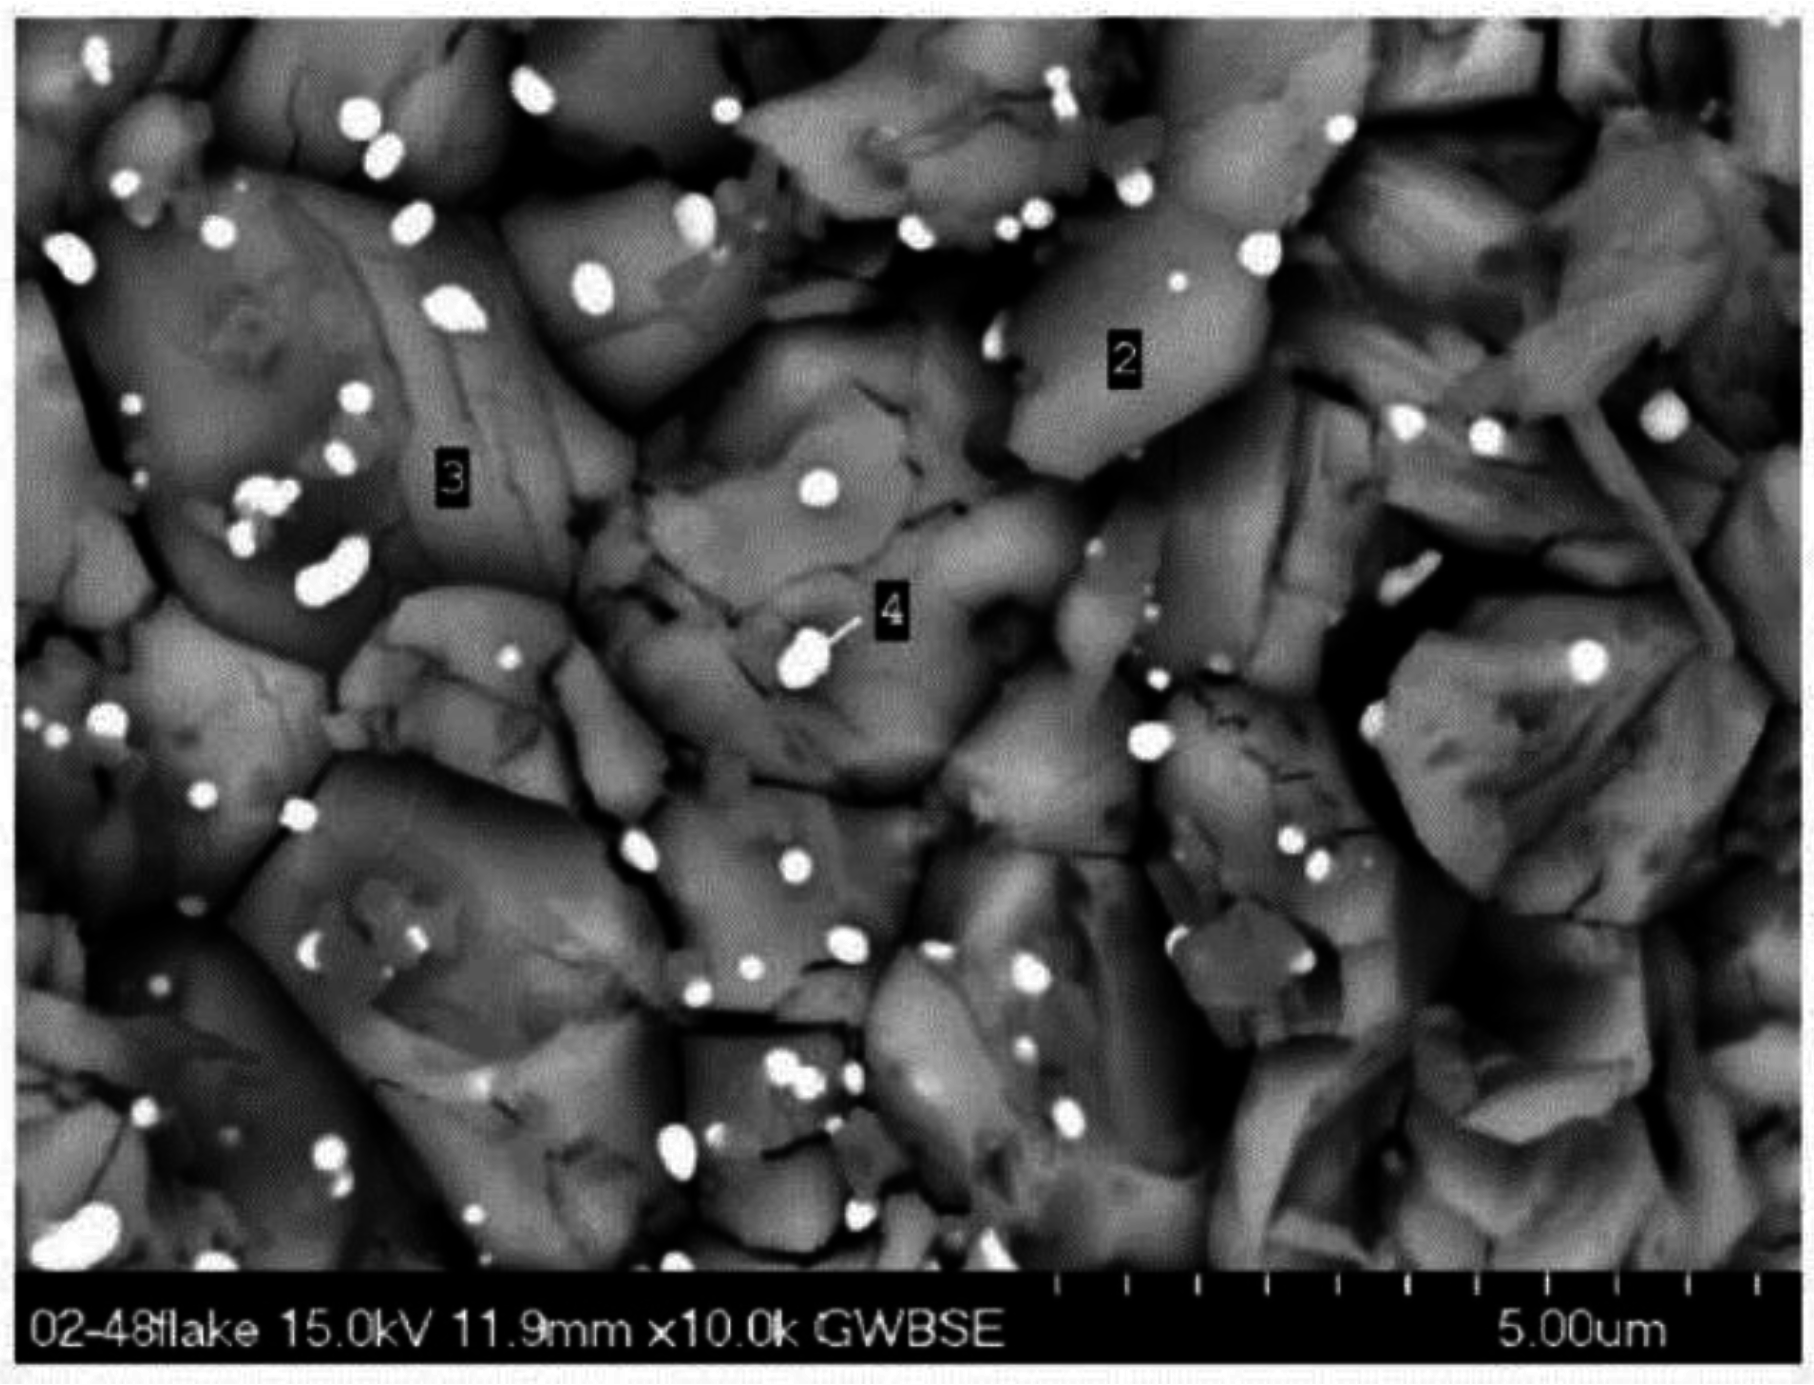
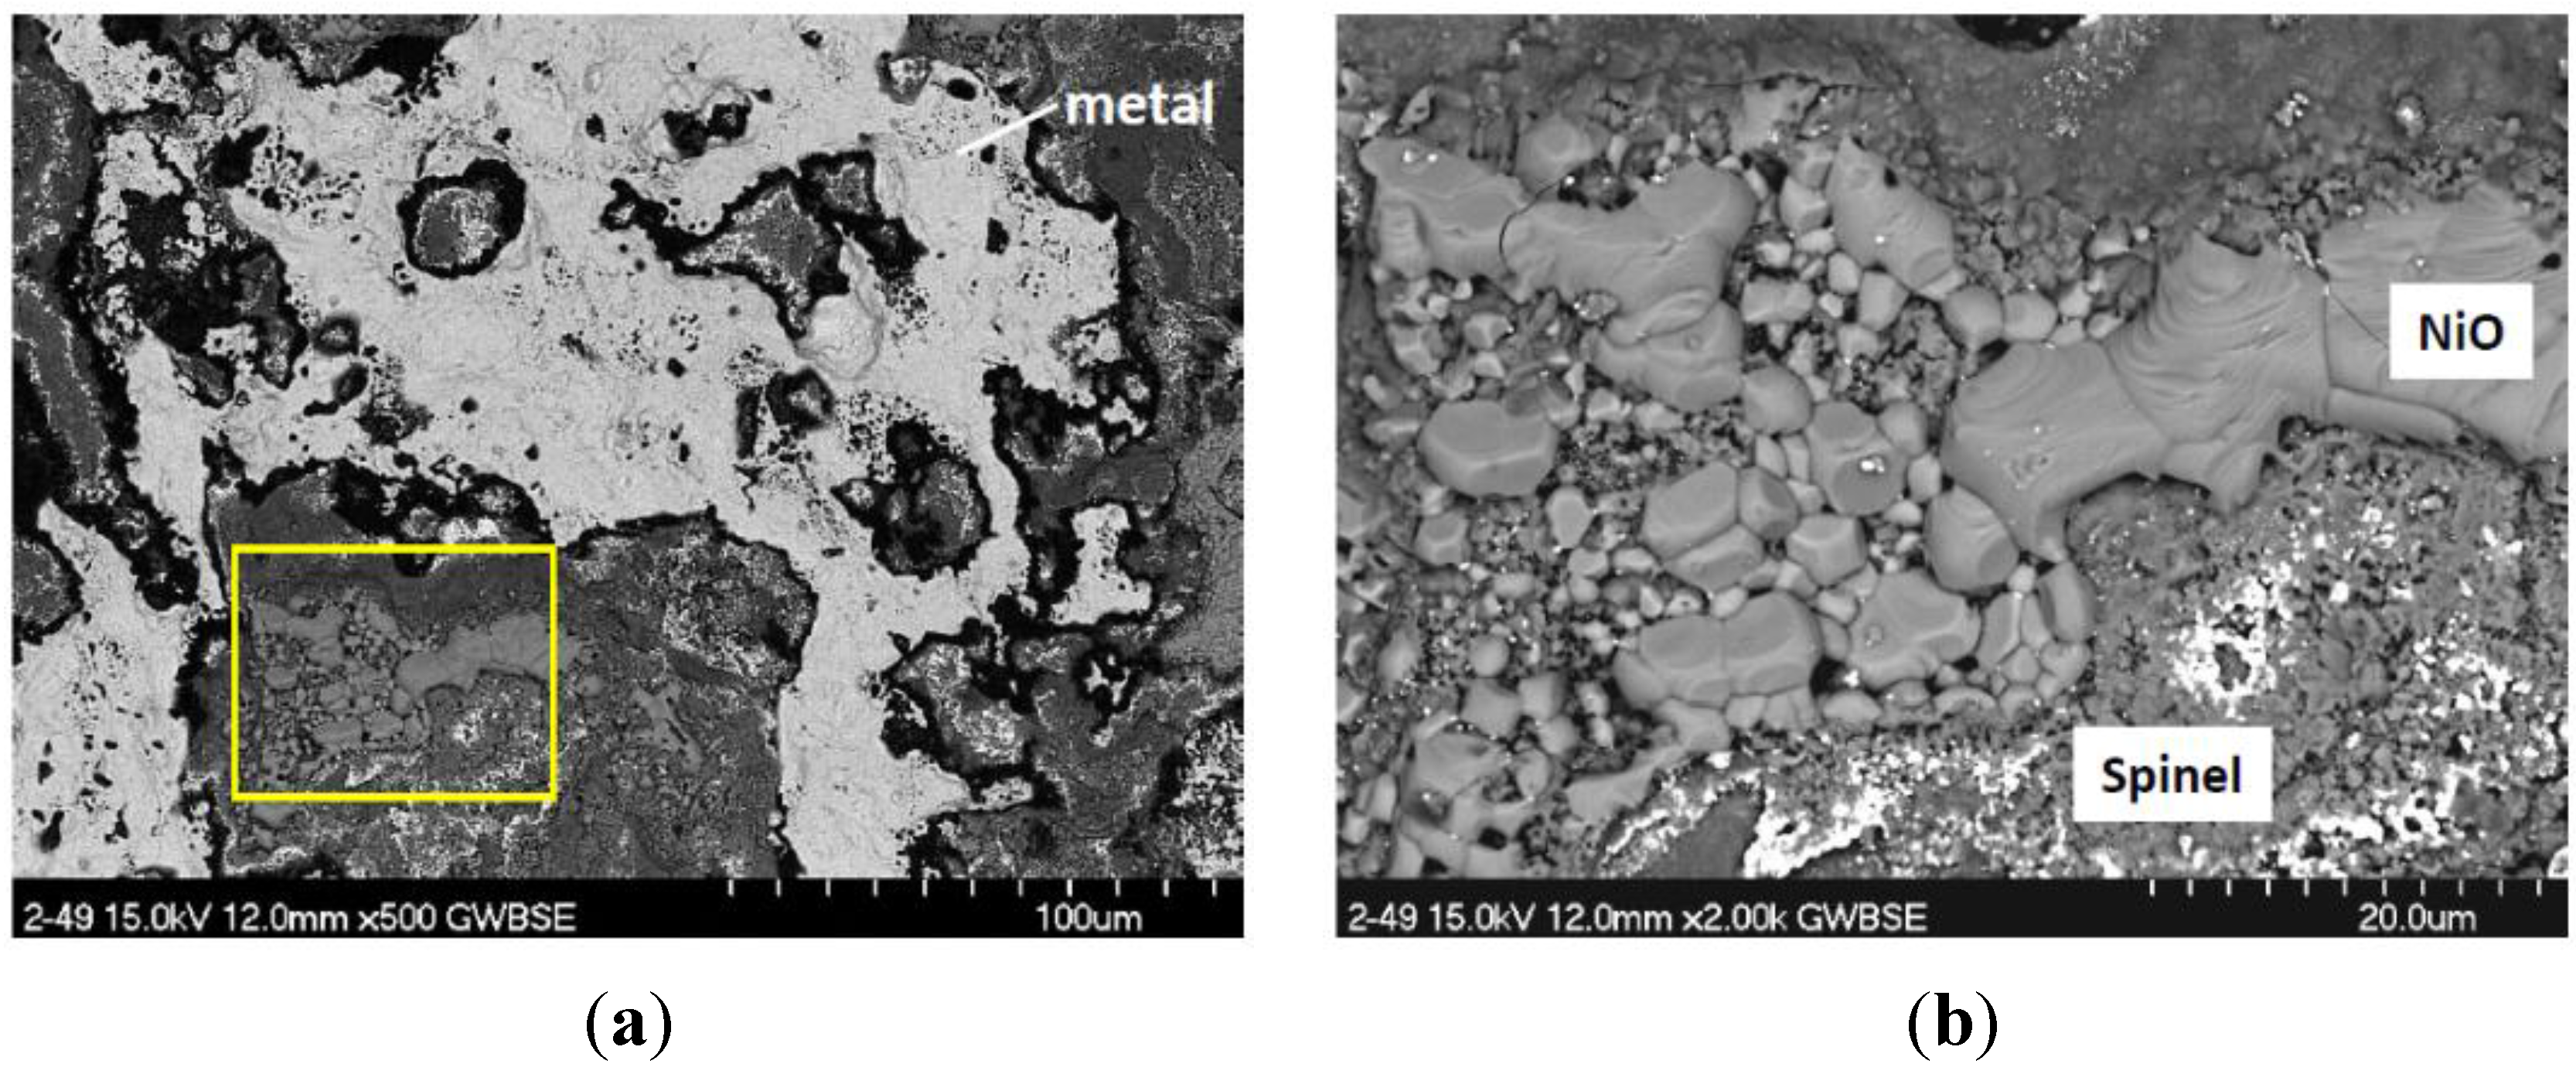
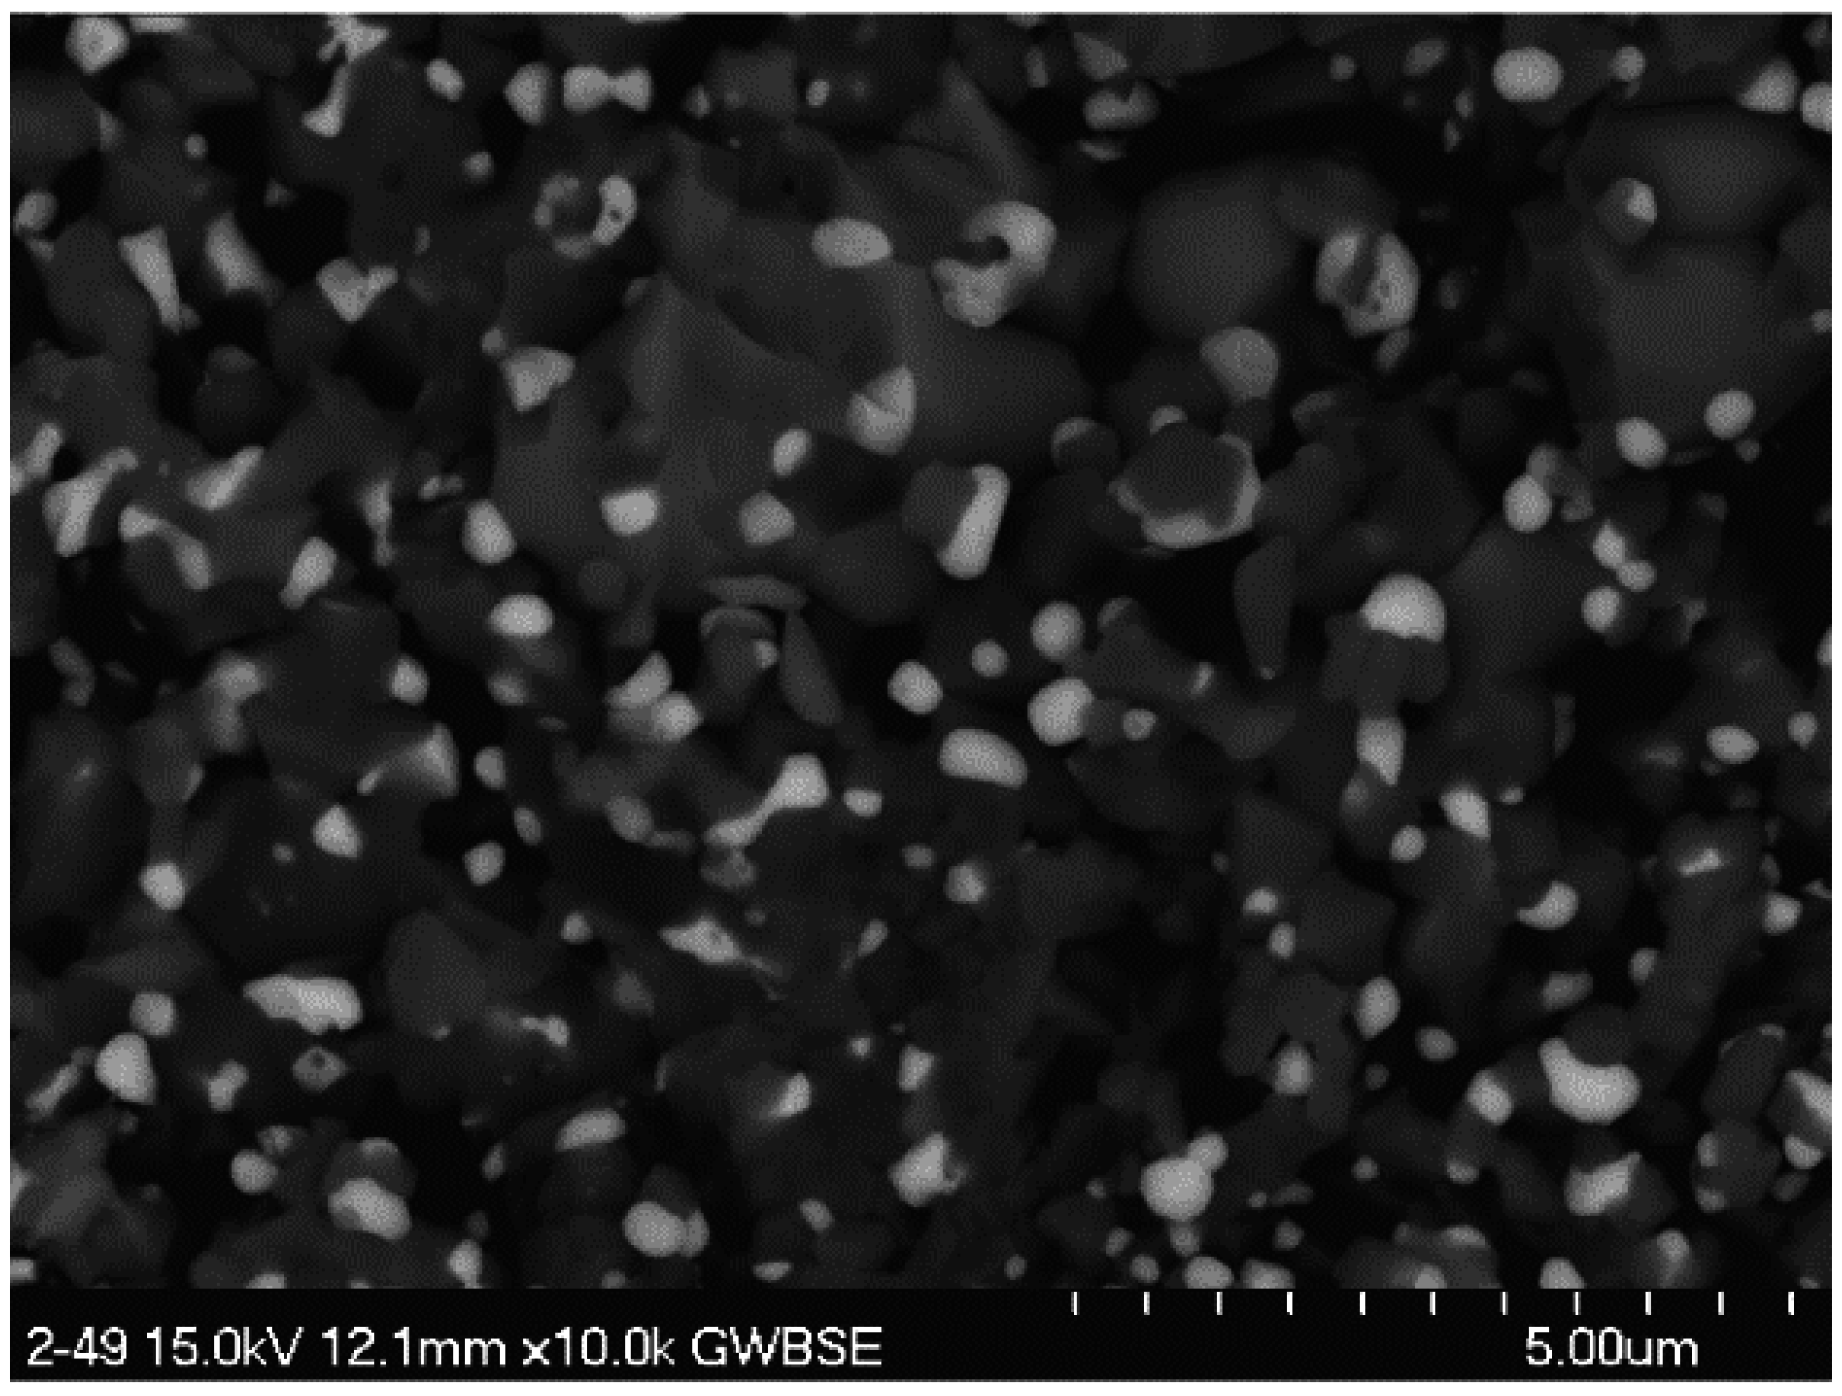
3.3. Scanning Electron Microscopy


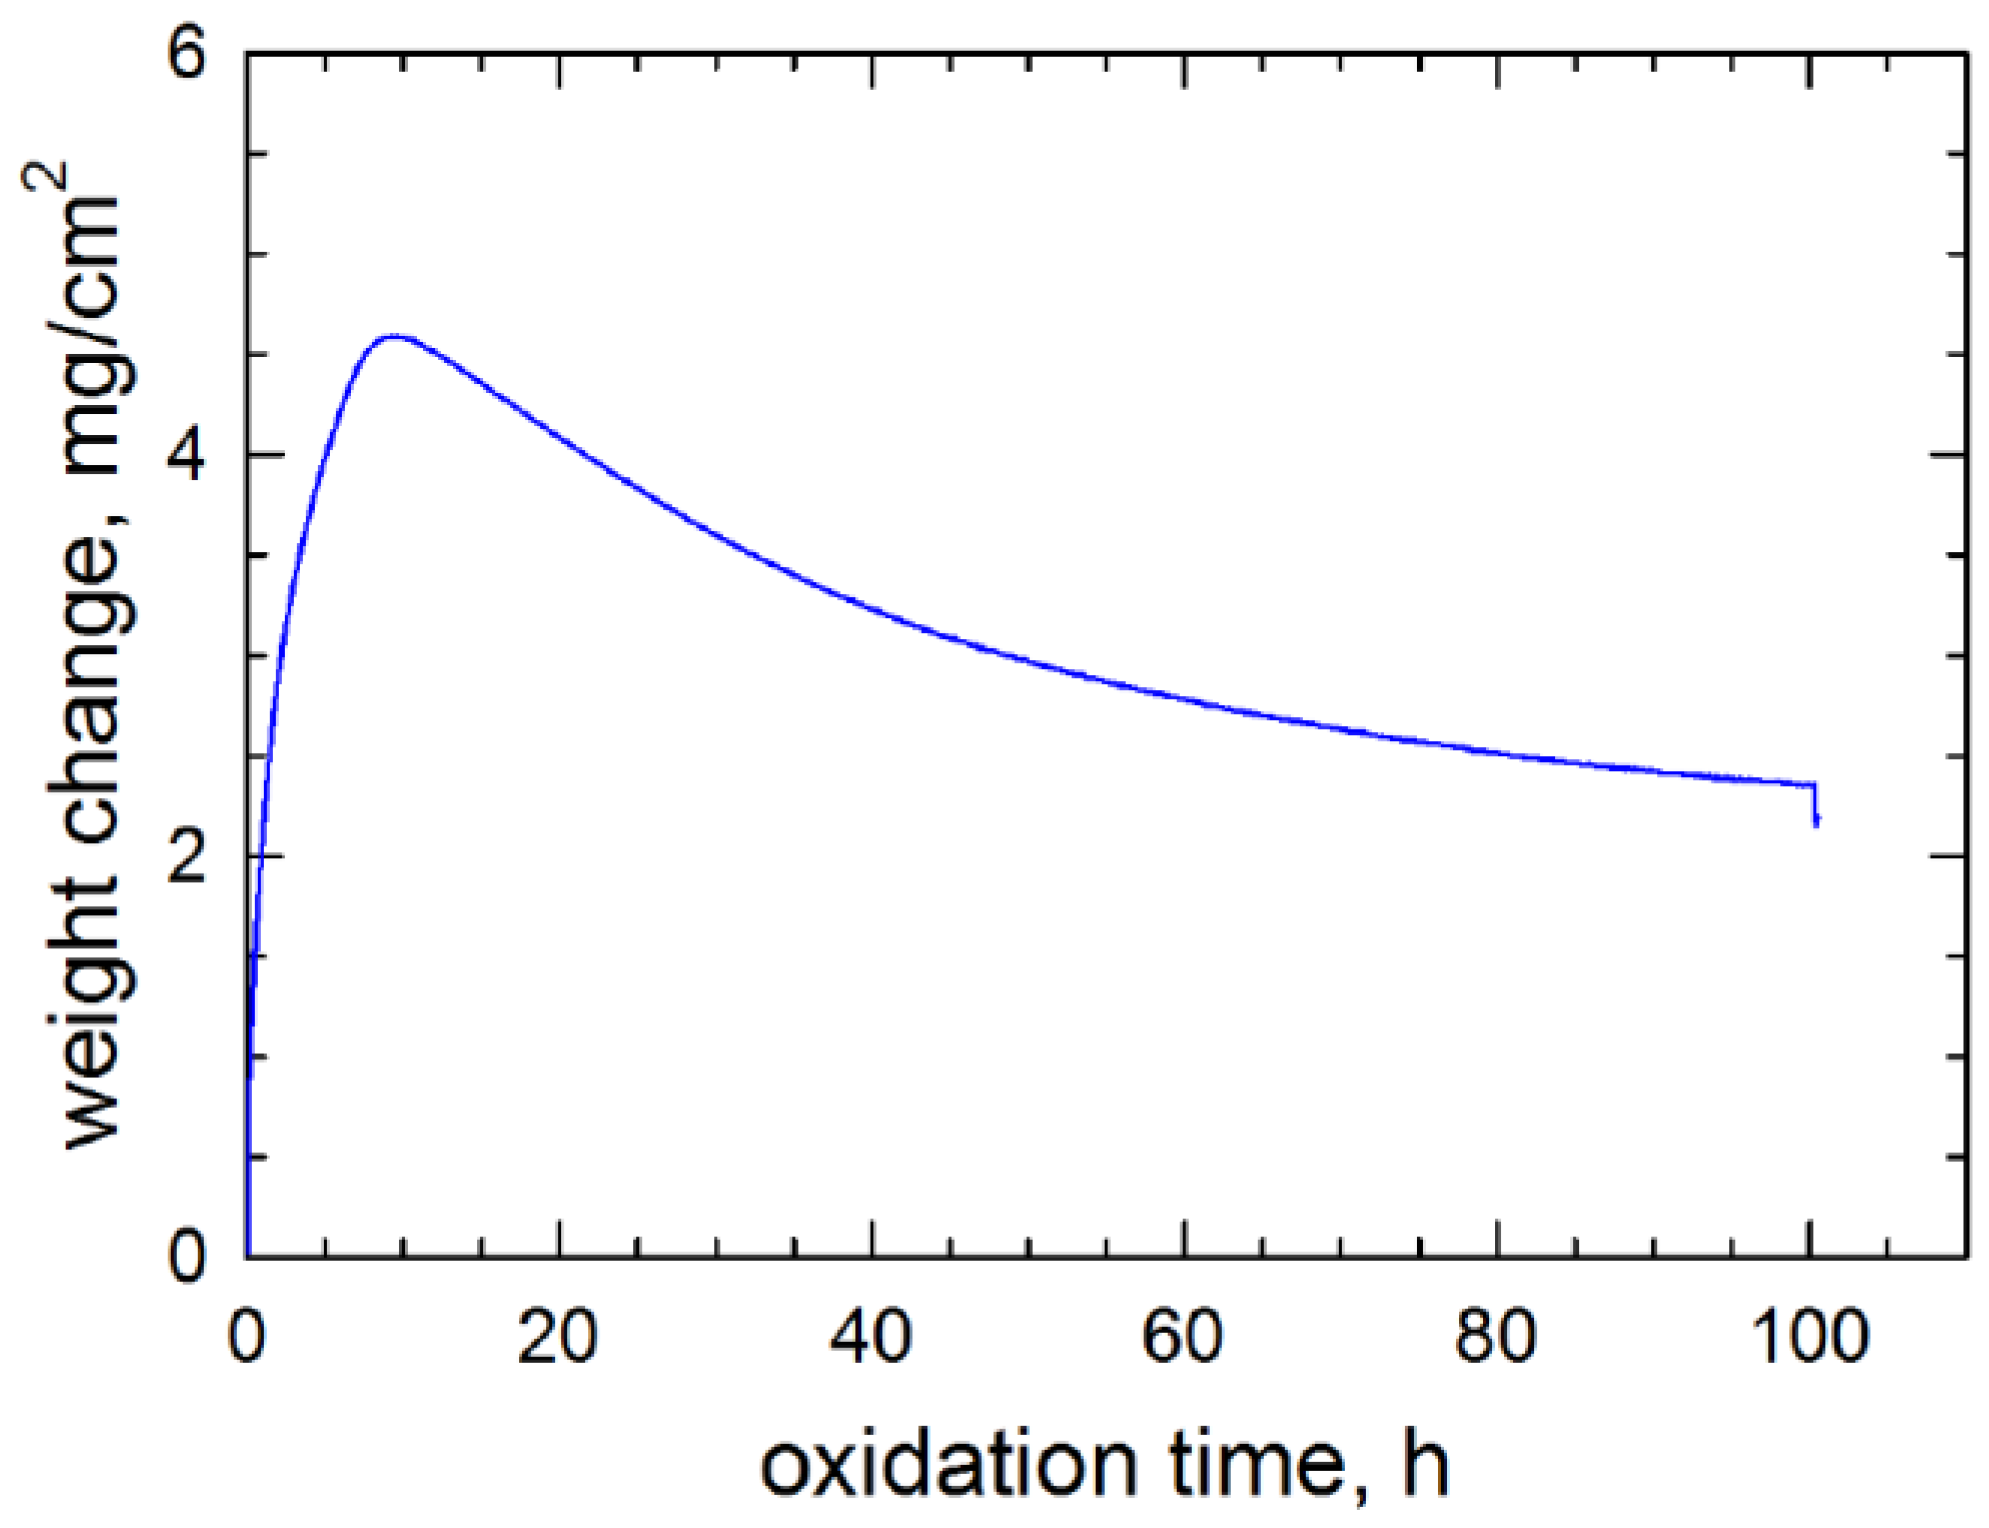
3.4. TGA Results


4. Discussion
4.1. Compositional Effects on Oxidative Mass Changes
4.2. Effects of High Mo Content on Oxidation
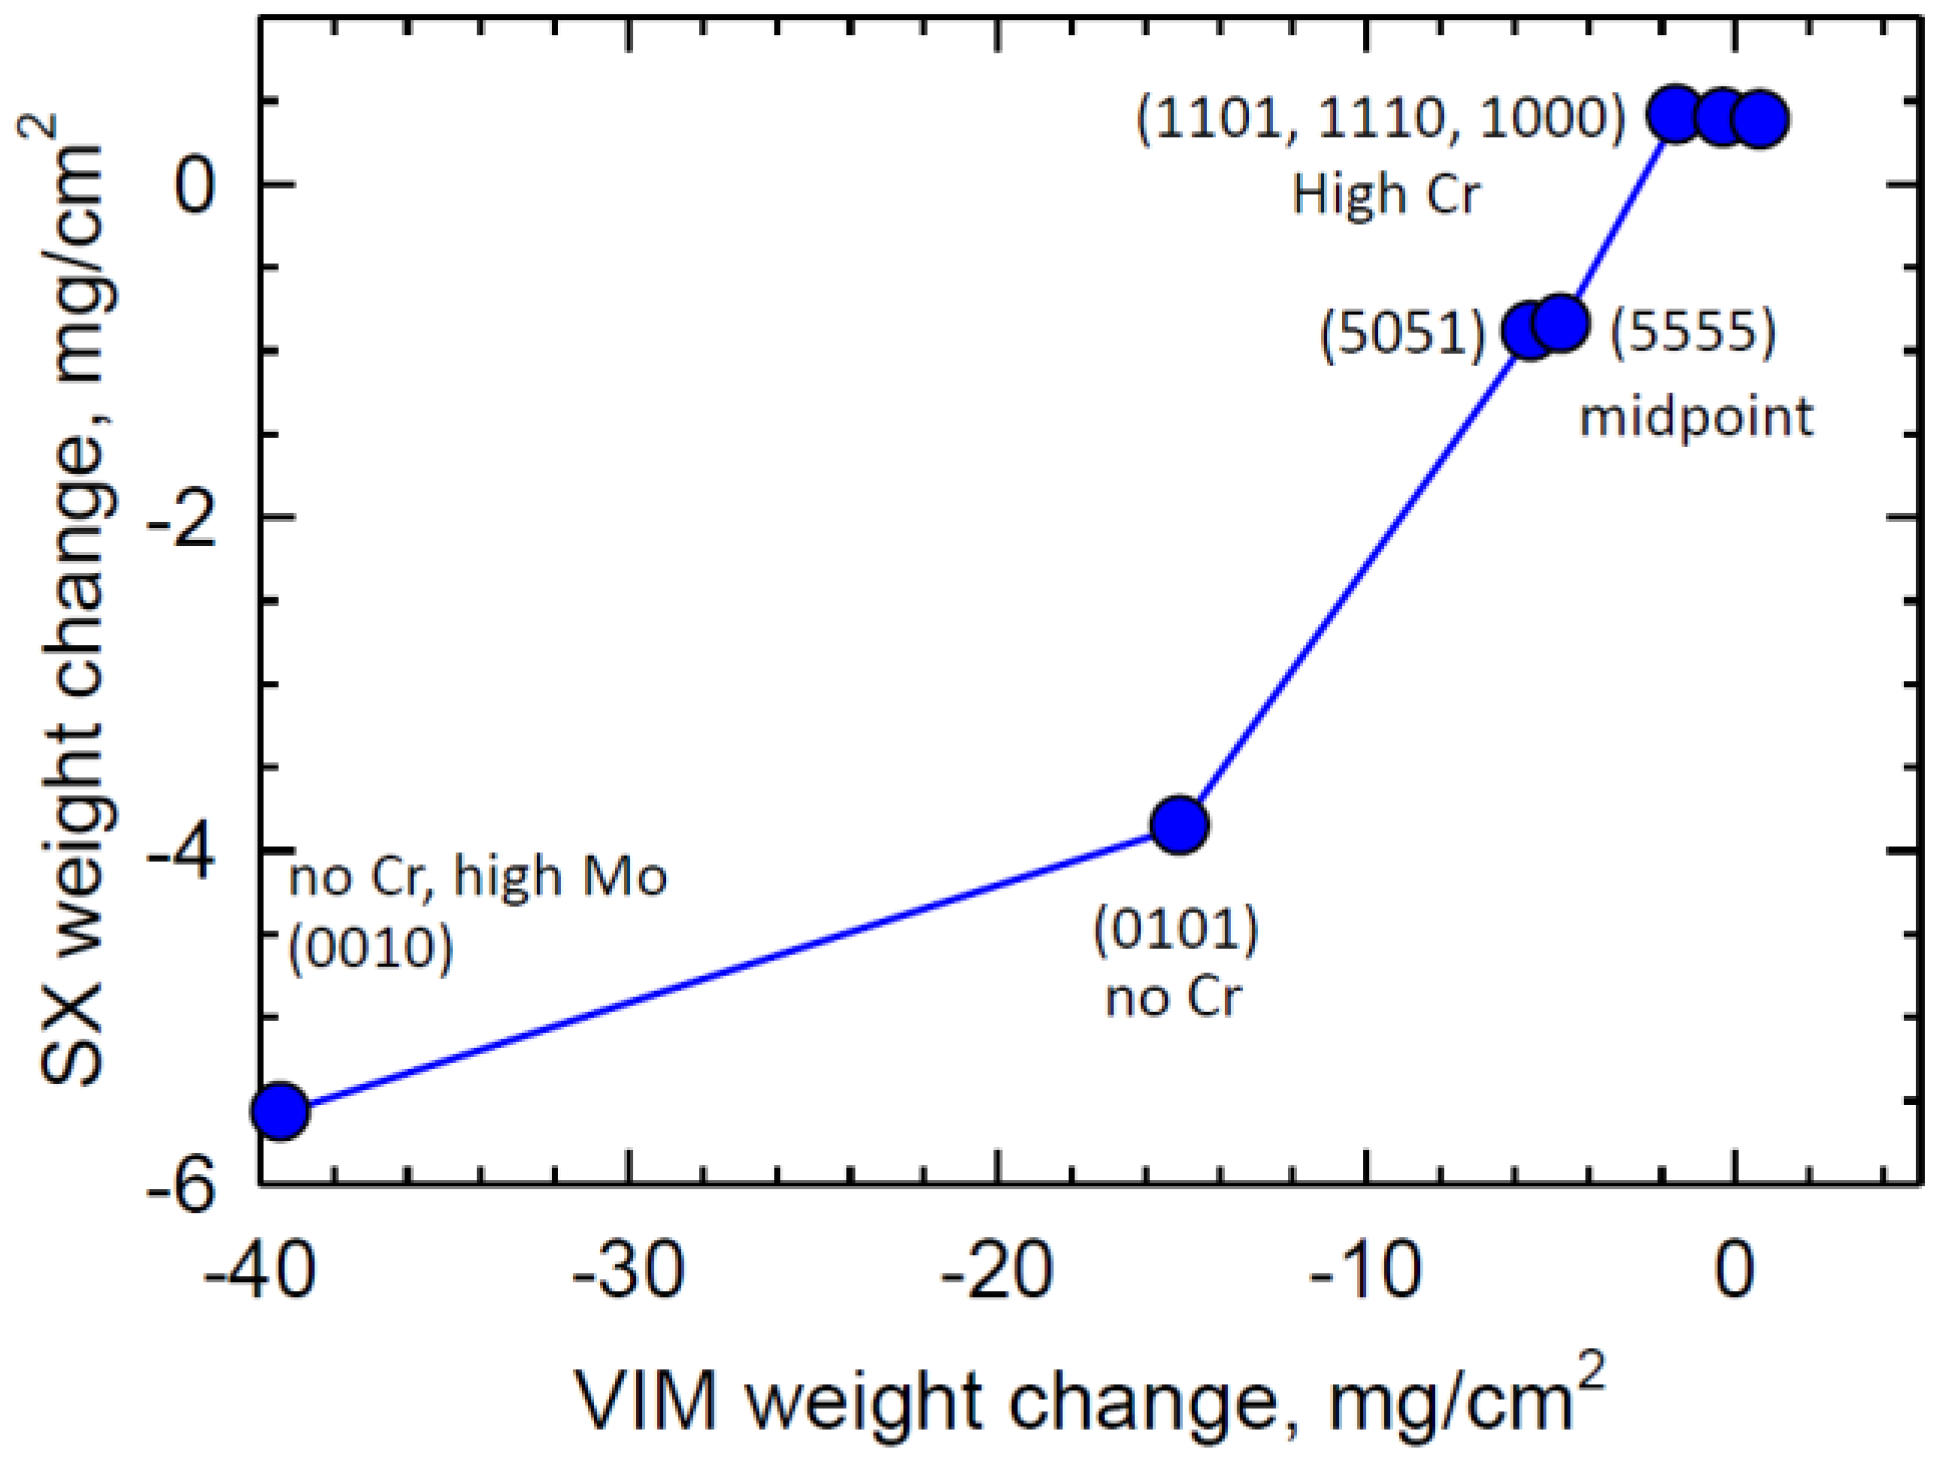
4.3. Comparison of VIM Alloys to Oxidation of Low Density Single Crystals

4.4. Broader Implications of Low Density Single Crystal Studies
5. Summary
Acknowledgments
Author Contributions
Conflicts of Interest
References
- Smialek, J.L.; Meier, G.H. High Temperature Oxidation. In Superalloys II; Sims, C.T., Stoloff, N.S., Hagel, W.C., Eds.; Wiley and Sons: New York, NY, USA, 1987; pp. 293–326. [Google Scholar]
- Smialek, J.L.; Barrett, C.S.; Schaeffer, J.C. Design for Oxidation. In ASM Handbook, Volume 20: Design for Properties; ASM International: Materials Park, OH, USA, 1997; pp. 589–602. [Google Scholar]
- Smialek, J.L.; Tubbs, B.K. Effect of sulfur removal on scale adhesion to PWA 1480. Metall. Mater. Trans. A 1995, 26, 427–435. [Google Scholar] [CrossRef]
- McVay, R.V.; Williams, P.; Meier, G.H.; Pettit, F.S.; Smialek, J.L. Oxidation of Low Sulfur Single Crystal Nickel-Base Superalloys. In Superalloys 1992; TMS: Warrendale, PA, USA, 1992; pp. 807–816. [Google Scholar]
- Göbel, M.; Rahmel, A.; Schütze, M. The cyclic-oxidation behavior of several nickel-base single-crystal superalloys without and with coatings. Oxid. Met. 1994, 41, 271–300. [Google Scholar] [CrossRef]
- Smialek, J.L.; Jayne, D.T.; Schaeffer, J.C.; Murphy, W.H. Effects of hydrogen annealing, sulfur segregation and diffusion on the cyclic oxidation resistance of superalloys: A review. Thin Solid Films 1994, 253, 285–292. [Google Scholar] [CrossRef]
- Smialek, J.L.; Pint, B.A. Optimizing Scale Adhesion on Single Crystal Superalloys. Mater. Sci. Forum 2001, 369–372, 459–466. [Google Scholar] [CrossRef]
- Harris, K.; Wahl, J. Improved Single Crystal Superalloys. In Superalloys 2004; TMS: Warrendale, PA, USA, 2004; pp. 45–52. [Google Scholar]
- Yuan, F.H.; Han, E.H.; Jo, C.Y.; Li, T.F.; Hu, Z.Q. The Effect of Crystallographic Orientation on the Oxidation Behavior of a Single-Crystal Nickel-base Superalloy. Oxid. Met. 2003, 60, 211–224. [Google Scholar] [CrossRef]
- Pieraggi, B.; Dabosi, F. High-temperature oxidation of a single crystal Ni-base superalloy. Mater. Corros. 1987, 38, 584–590. [Google Scholar] [CrossRef]
- Swadźba, R.; Swadźba, L.; Wiedermann, J.; Hetmańczyk, M.; Witala, B. Characterization of Alumina Scales Grown on a 2nd Generation Single Crystal Ni Superalloy During Isothermal Oxidation at 1050, 1100 and 1150 °C. Oxid. Met. 2014, 82, 195–208. [Google Scholar] [CrossRef]
- Glatzel, U.; Thomas, M.; Silke, W.; Wortman, J. Nickel-Base Alloy for Producing Components Which Have Solidified in Single Crystal Form. U.S. Patent 20050254991 A1, 4 March 2005. [Google Scholar]
- Wöllmer, S.; Mack, T.; Glatzel, U. Influence of tungsten and rhenium concentration on creep properties of a second generation superalloy. Mater. Sci. Eng. A 2001, 319–321, 792–795. [Google Scholar] [CrossRef]
- Reed, R.C.; Tao, T.; Warnken, N. Alloys-By-Design: Application to nickel-based single crystal superalloys. Acta Mater. 2009, 57, 5898–5913. [Google Scholar] [CrossRef]
- Sato, A.; Chiu, Y.L.; Reed, R.C. Oxidation of nickel-based single-crystal superalloys for industrial gas turbine applications. Acta Mater. 2011, 59, 225–240. [Google Scholar] [CrossRef]
- Reed, R.C.; Moverare, J.; Sato, A.; Karlsson, F.; Hasselqvist, M. A New Single Crystal Superalloy for Power Generation Applications. In Proceedings of the 12th International Symposium on Superalloys, Warrendale, PA, USA, 9–13 September 2012; pp. 197–204.
- Adharapurapu, R.; Liu, L.; Pollock, T.M.; University of Michigan, Ann Arbor, MI, USA. Unpublished research. 2012.
- George, E.P.B.; Draper, N.R. Empirical Model-Building and Response Surfaces; Wiley and Sons: Hoboken, NJ, USA, 1987. [Google Scholar]
- Sall, J.; Lehman, A.; Stephens, M.; Creighton, L. JMP® Start Statistics: A Guide to Statistics and Data Analysis Using JMP®, 5th ed.; SAS Institute, Inc.: Cary, NC, USA, 2012. [Google Scholar]
- MacKay, R.A.; Gabb, T.P.; Smialek, J.L.; Nathal, M.V. Alloy Design Challenge : Development of Low Density Superalloys for Turbine Blade Applications; NASA: Cleveland, OH, USA, 2009; pp. 1–39. [Google Scholar]
- MacKay, R.A.; Gabb, T.P.; Smialek, J.L.; Nathal, M.V. A New Approach of Designing Superalloys for Low Density. JOM 2010, 62, 48–54. [Google Scholar] [CrossRef]
- Sudbrack, C.K.; Beckett, D.L.; MacKay, R.A. Effect of Surface Preparation on the 815 °C Oxidation of Single-Crystal Nickel-Based Superalloys. JOM 2015, 67, 2589–2598. [Google Scholar] [CrossRef]
- MacKay, R.A.; Gabb, T.P.; Smialek, J.L.; Nathal, M.V. Low Density, High Creep Resistant Single Crystal Superalloy for Turbine Airfoils. U.S. Patent 7261783 B1, 28 August 2007. [Google Scholar]
- Barrett, C.A. A High Temperature Cyclic Oxidation Data Base for Selected Materials Tested at NASA Glenn Research Center; NASA: Cleveland, OH, USA, 2003. [Google Scholar]
- Giggins, C.S.; Pettit, F.S. Oxidation of Ni–Cr–Al Alloys between 1000 °C and 1200 °C. J. Electrochem. Soc. 1971, 118, 1782–1790. [Google Scholar] [CrossRef]
- Barrett, C.A.; Lowell, C.E. Resistance of Ni–Cr–Al Alloys to Cyclic Oxidation at 1100 and 1200 °C. Oxid. Met. 1977, 11, 199–223. [Google Scholar] [CrossRef]
- Ray, P.K.; Akinc, M.; Kramer, M.J. Formation of multilayered scale during the oxidation of NiAl–Mo alloy. Appl. Surf. Sci. 2014, 301, 107–111. [Google Scholar] [CrossRef]
- Brady, M.P.; Bei, H.; Meisner, R.A.; Lance, M.J.; Tortorelli, P.F. Effect of Mo dispersion size and water vapor on oxidation of two-phase directionally solidified NiAl–9Mo in situ composites. Scr. Mater. 2014, 80, 33–36. [Google Scholar] [CrossRef]
- Meschter, P.J.; Opila, E.J.; Jacobson, N.S. Water Vapor-Mediated Volatilization of High-Temperature Materials. Annu. Rev. Mater. Res. 2013, 43, 559–588. [Google Scholar] [CrossRef]
- Hashizume, R.; Yoshinari, A.; Kiyono, T.; Murata, Y.; Morinaga, M. Development of Ni-Based Single Crystal Superalloys for Power-Generation Gas Turbines. In Superalloys 2004; TMS: Warrendale, PA, USA, 2004; pp. 53–62. [Google Scholar]
© 2015 by the authors; licensee MDPI, Basel, Switzerland. This article is an open access article distributed under the terms and conditions of the Creative Commons Attribution license (http://creativecommons.org/licenses/by/4.0/).
Share and Cite
Smialek, J.L.; Garg, A.; Gabb, T.P.; MacKay, R.A. Cyclic Oxidation of High Mo, Reduced Density Superalloys. Metals 2015, 5, 2165-2185. https://doi.org/10.3390/met5042165
Smialek JL, Garg A, Gabb TP, MacKay RA. Cyclic Oxidation of High Mo, Reduced Density Superalloys. Metals. 2015; 5(4):2165-2185. https://doi.org/10.3390/met5042165
Chicago/Turabian StyleSmialek, James L., Anita Garg, Timothy P. Gabb, and Rebecca A. MacKay. 2015. "Cyclic Oxidation of High Mo, Reduced Density Superalloys" Metals 5, no. 4: 2165-2185. https://doi.org/10.3390/met5042165
APA StyleSmialek, J. L., Garg, A., Gabb, T. P., & MacKay, R. A. (2015). Cyclic Oxidation of High Mo, Reduced Density Superalloys. Metals, 5(4), 2165-2185. https://doi.org/10.3390/met5042165