
Chalcopyrite Dissolution at 650 mV and 750 mV in the Presence of Pyrite


Abstract
:
1. Introduction
2. Experimental Section
2.1. Mineral Characterisation

| Element (wt. %) | S | Cu | Fe | Si | Ca | Bi | Zn | Pb | As | Al | Co | K | Mg |
|---|---|---|---|---|---|---|---|---|---|---|---|---|---|
| Chalcopyrite | 34.1 | 32.5 | 29.3 | 0.9 | 0.8 | 0.3 | 0.5 | 0.3 | 0.06 | 0.04 | 0.1 | 0.02 | 0.02 |
| Pyrite | 51.5 | 0.01 | 42.8 | - | 0.01 | - | 0.01 | 0.004 | 0.003 | 0.01 | - | 0.006 | - |
2.2. Dissolution Conditions
2.3. Bulk and Surface Analyses
3. Results
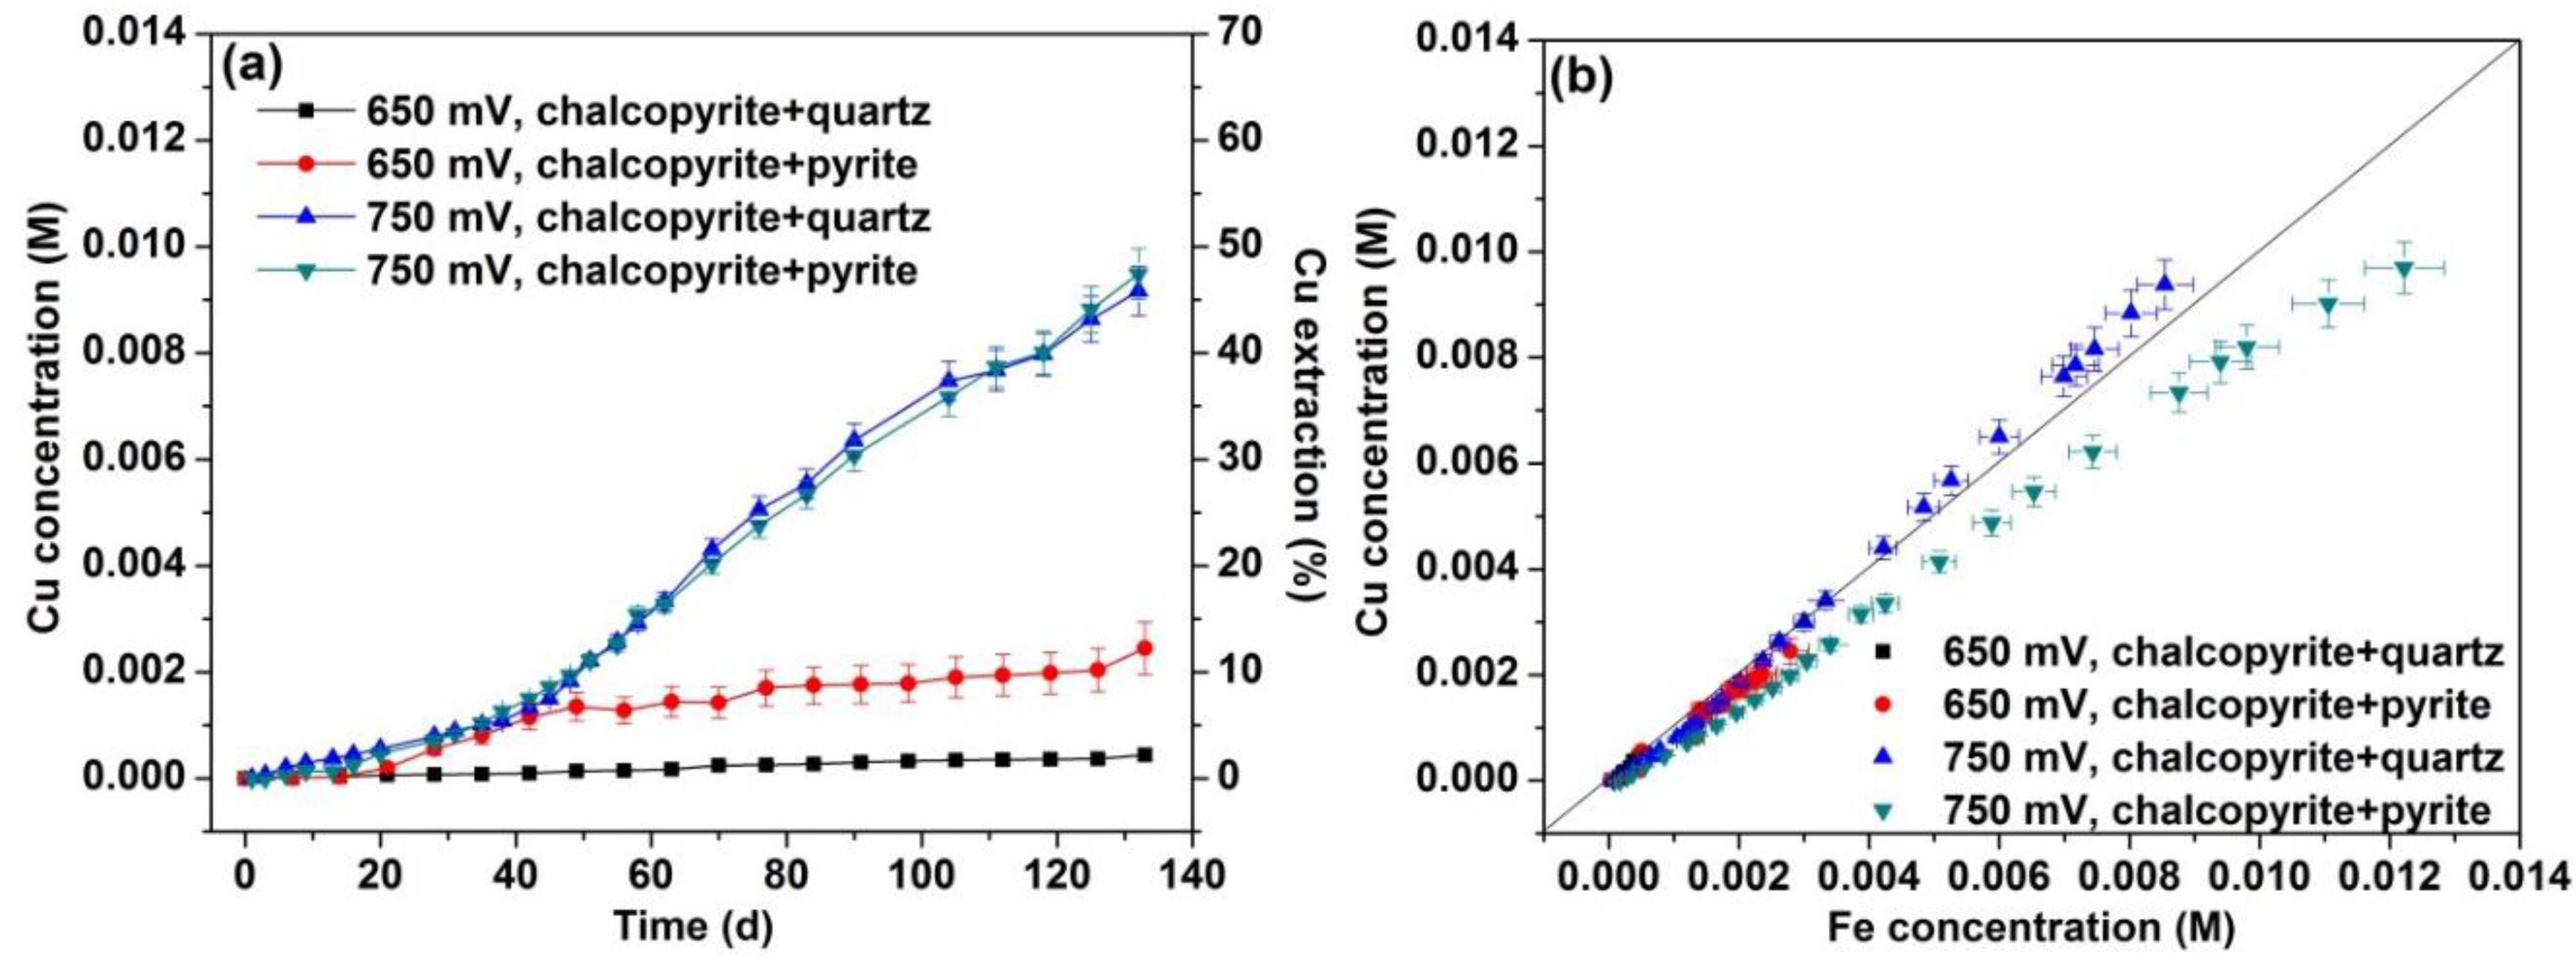
3.1. Dissolution
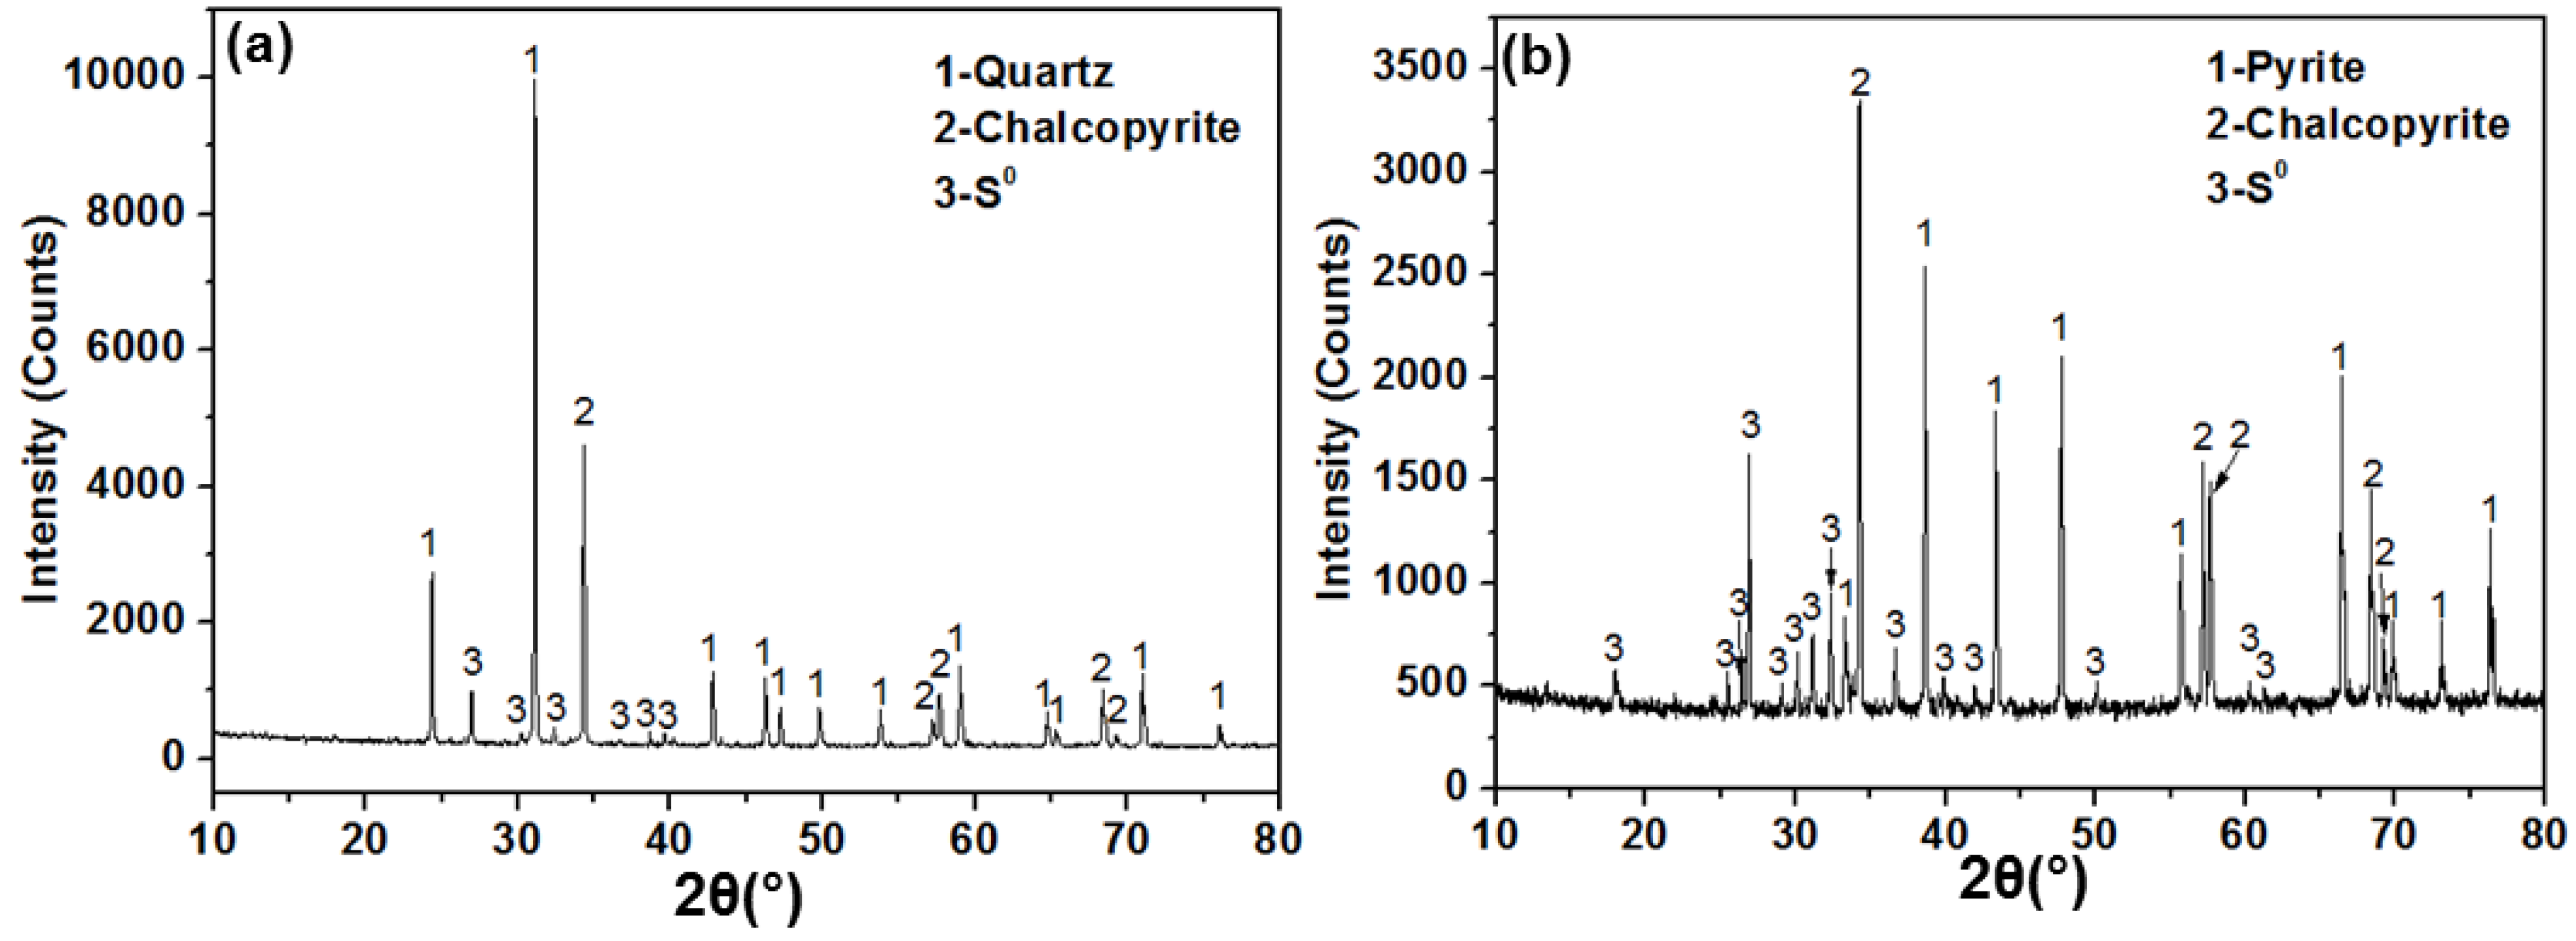
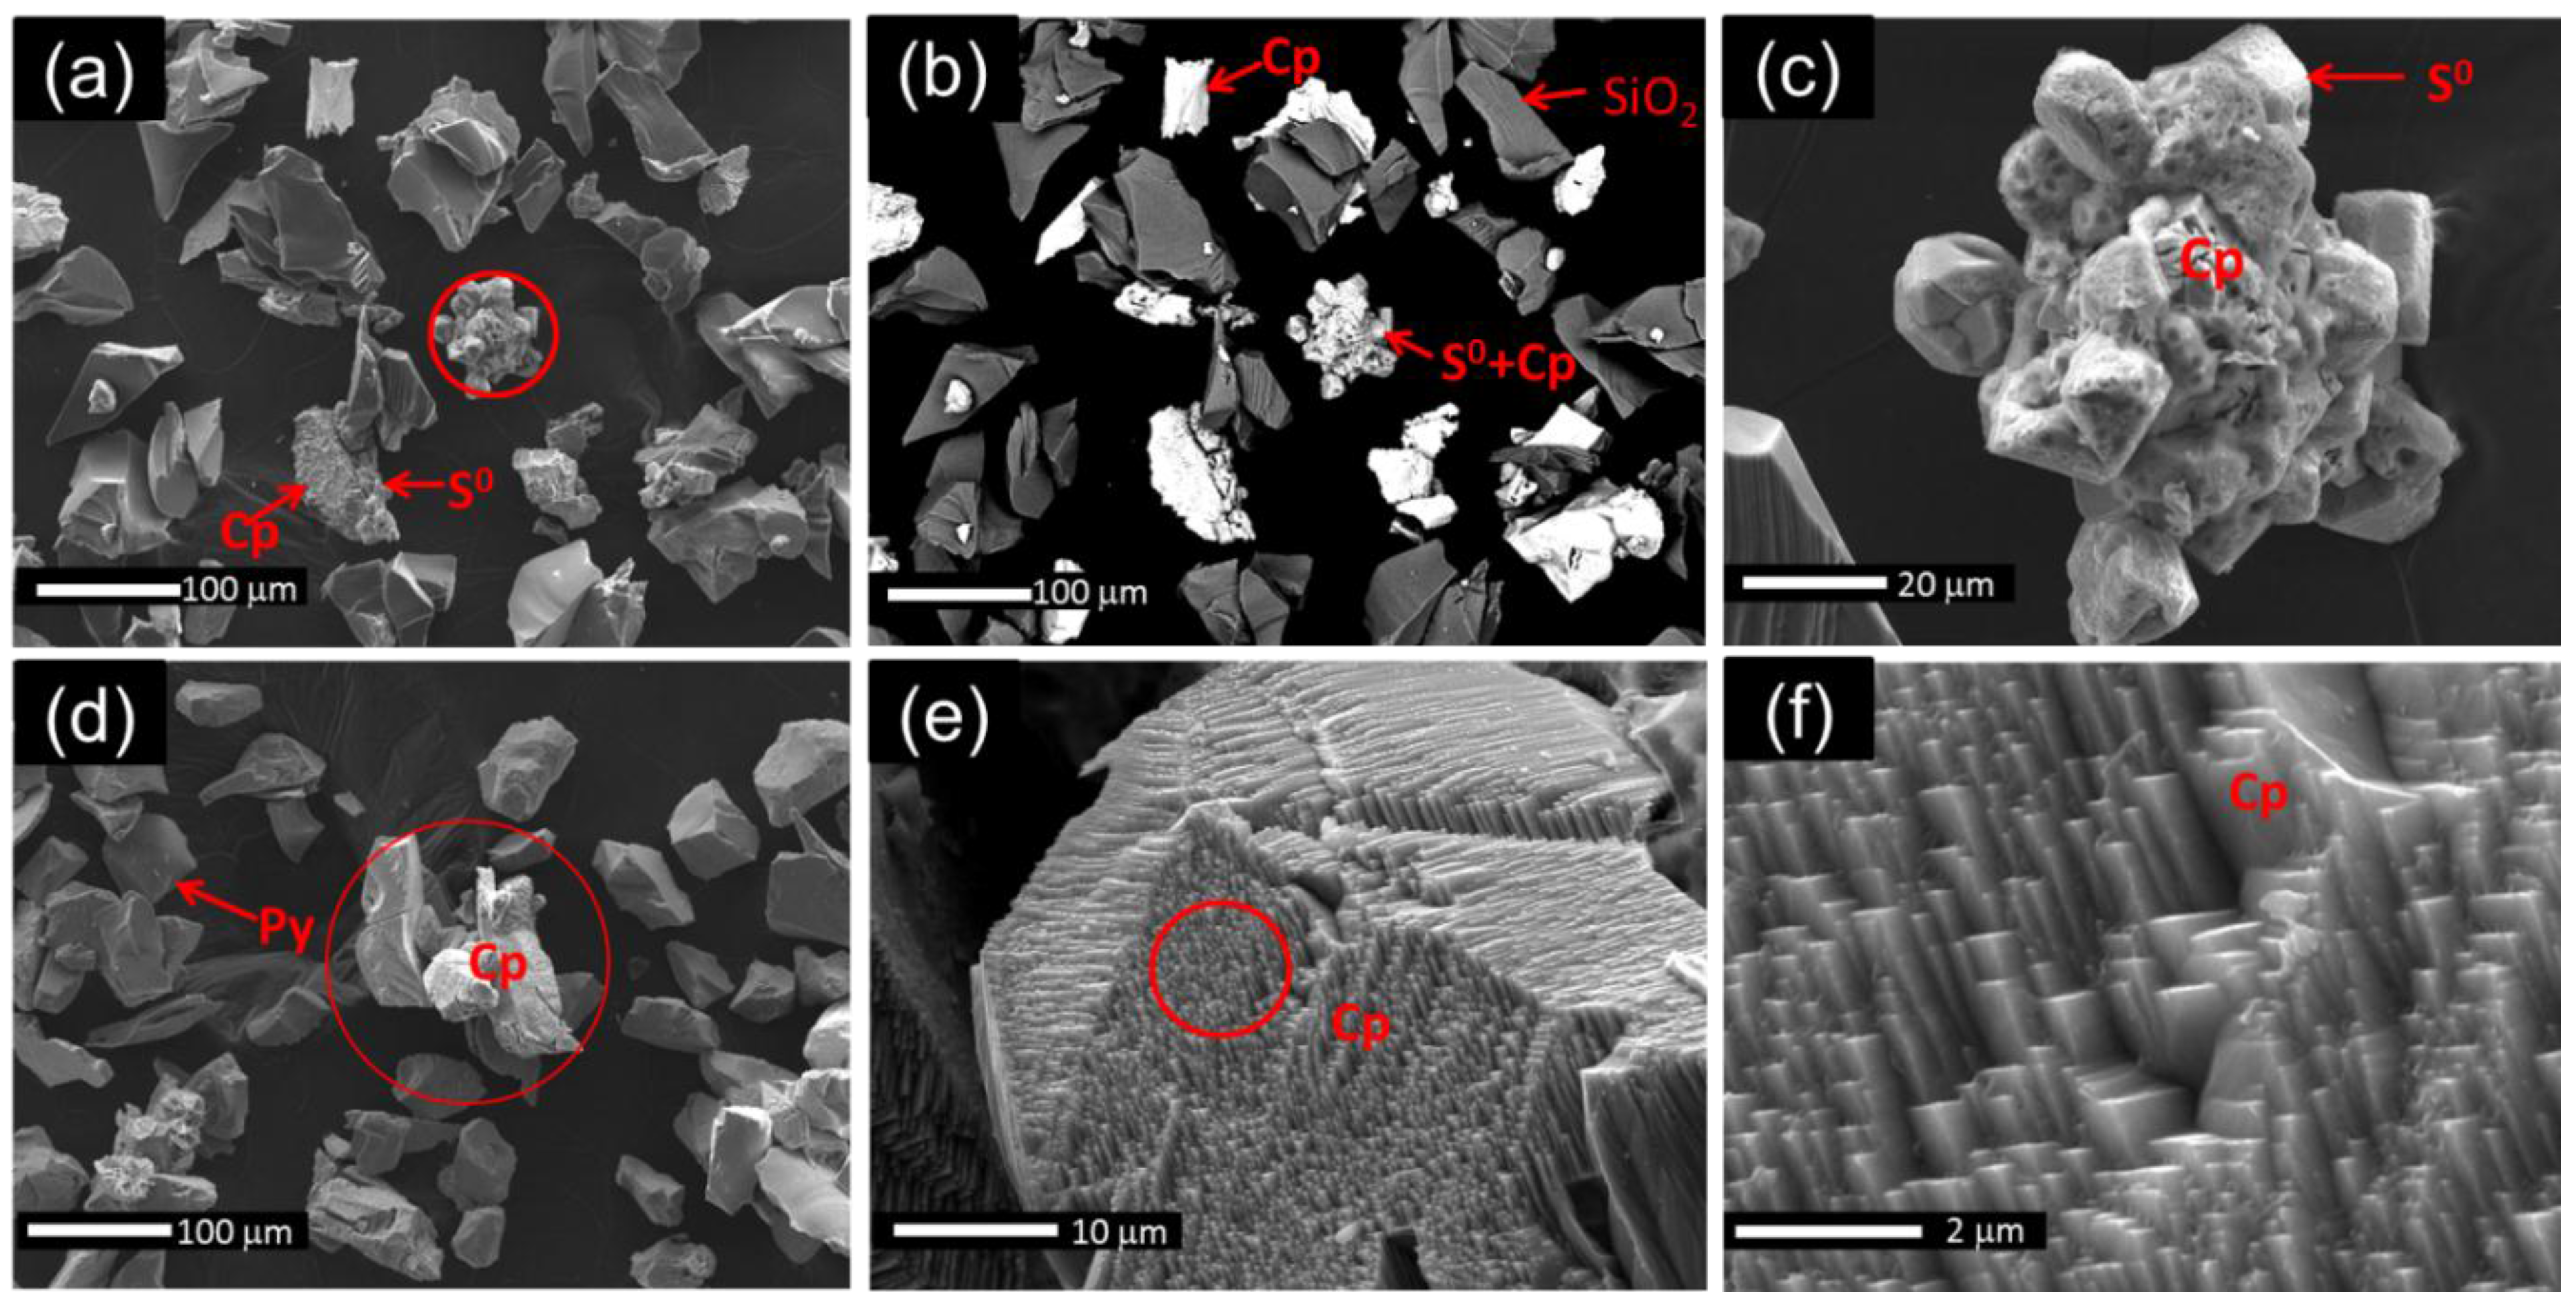
3.2. XRD and SEM Analyses

| Remaining (Dissolved) Quartz | Remaining (Dissolved) Chalcopyrite | Remaining (Dissolved) Pyrite | S0 Formed | |
|---|---|---|---|---|
| 4 g chalcopyrite + 6 g quartz | 6 (0) g | 1.607 (2.423) g | N.A. | 0.845 g |
| 4 g chalcopyrite + 6 g pyrite | N.A. | 1.607 (2.423) g | 3.021 (2.979) g | 1.800 g |
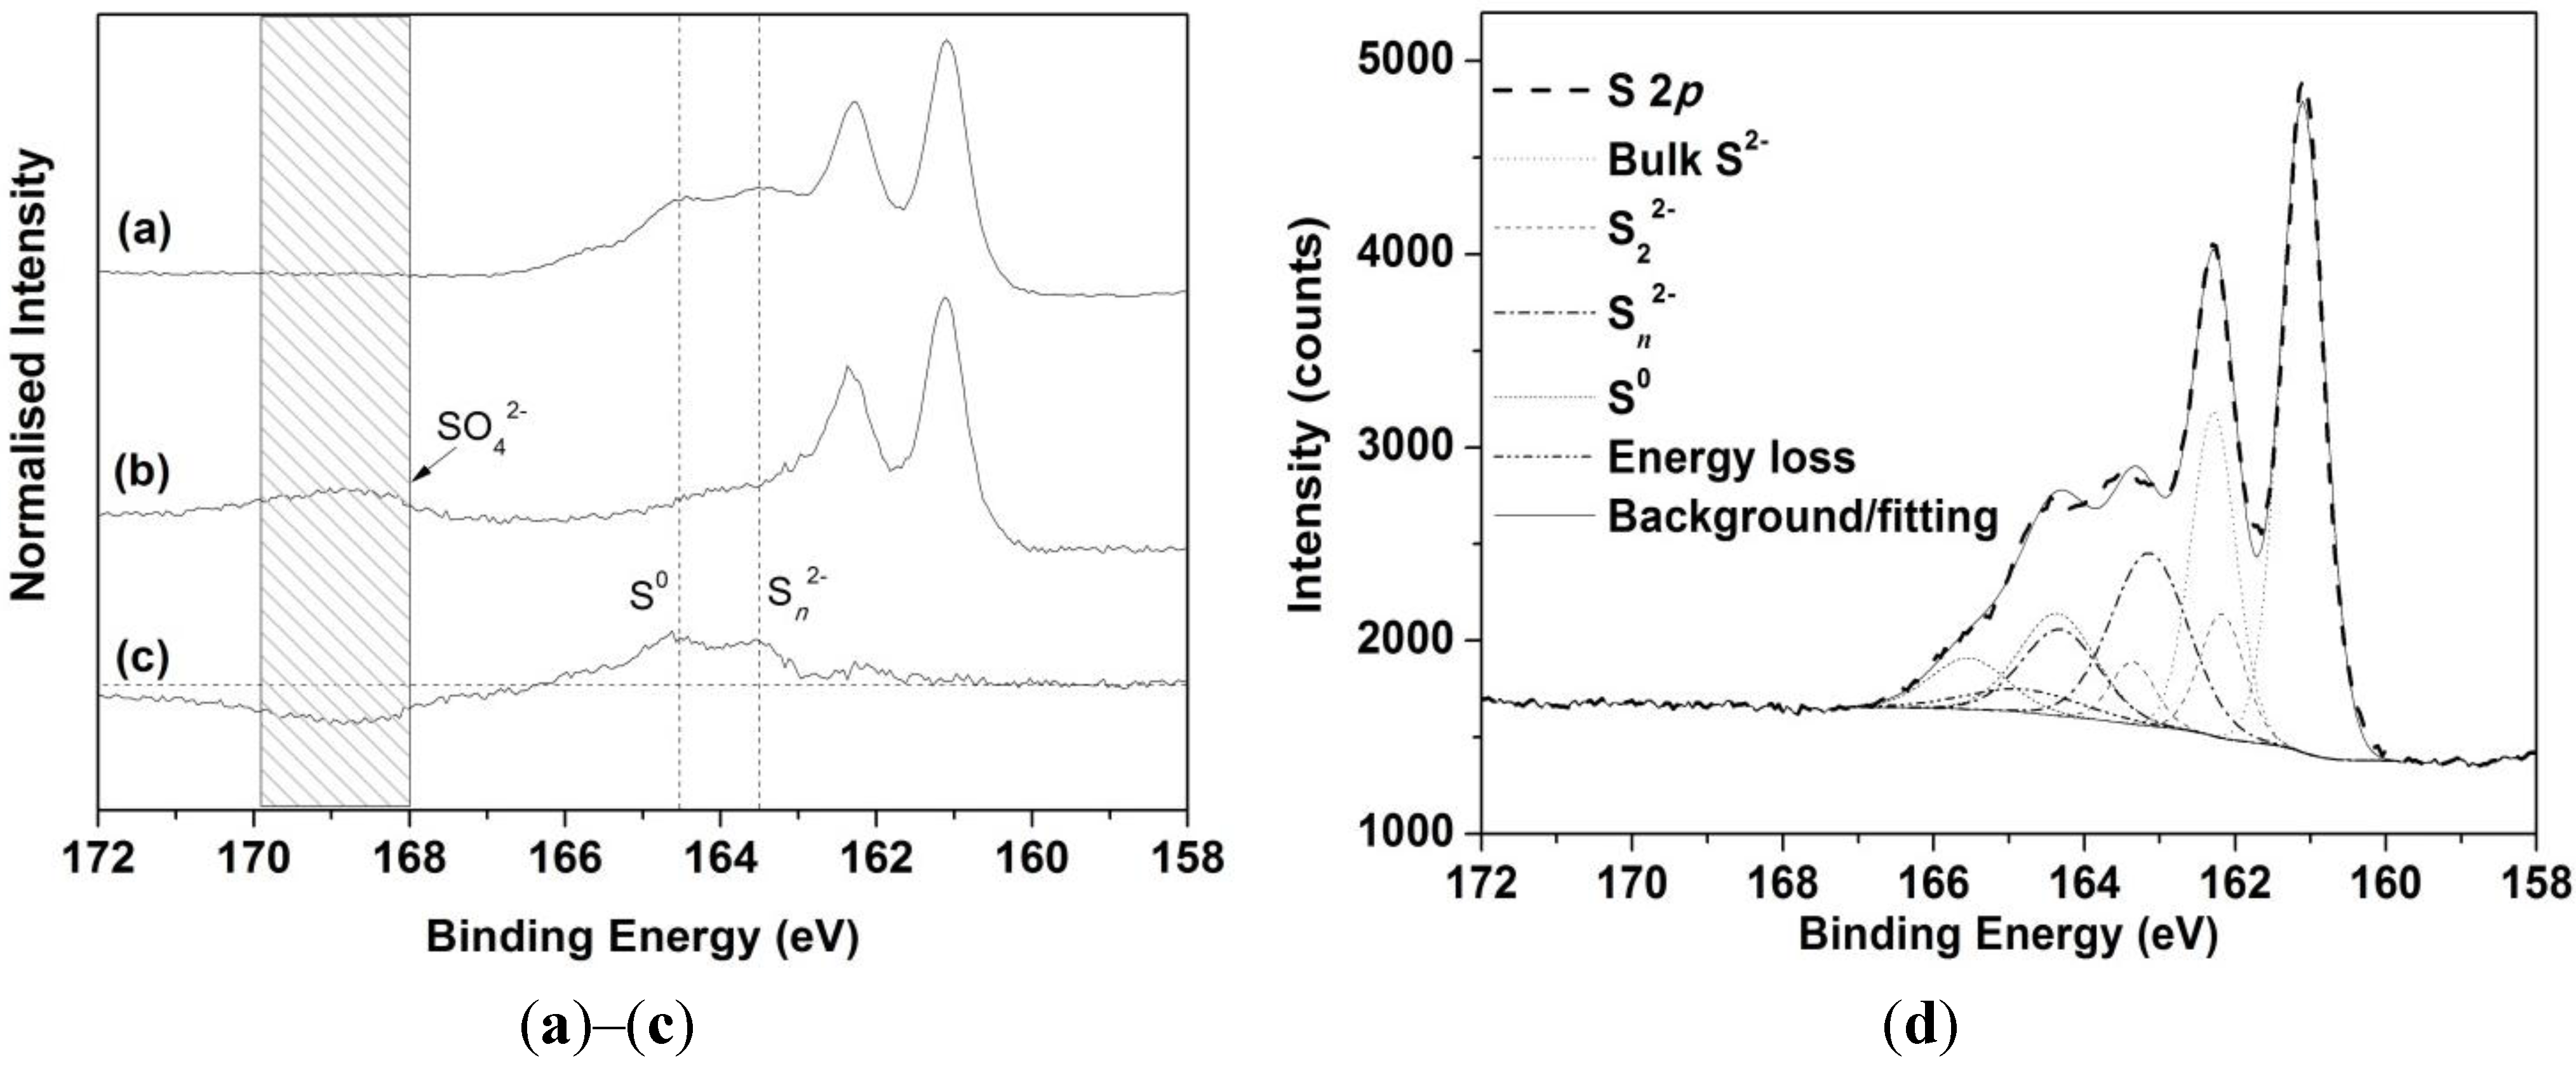
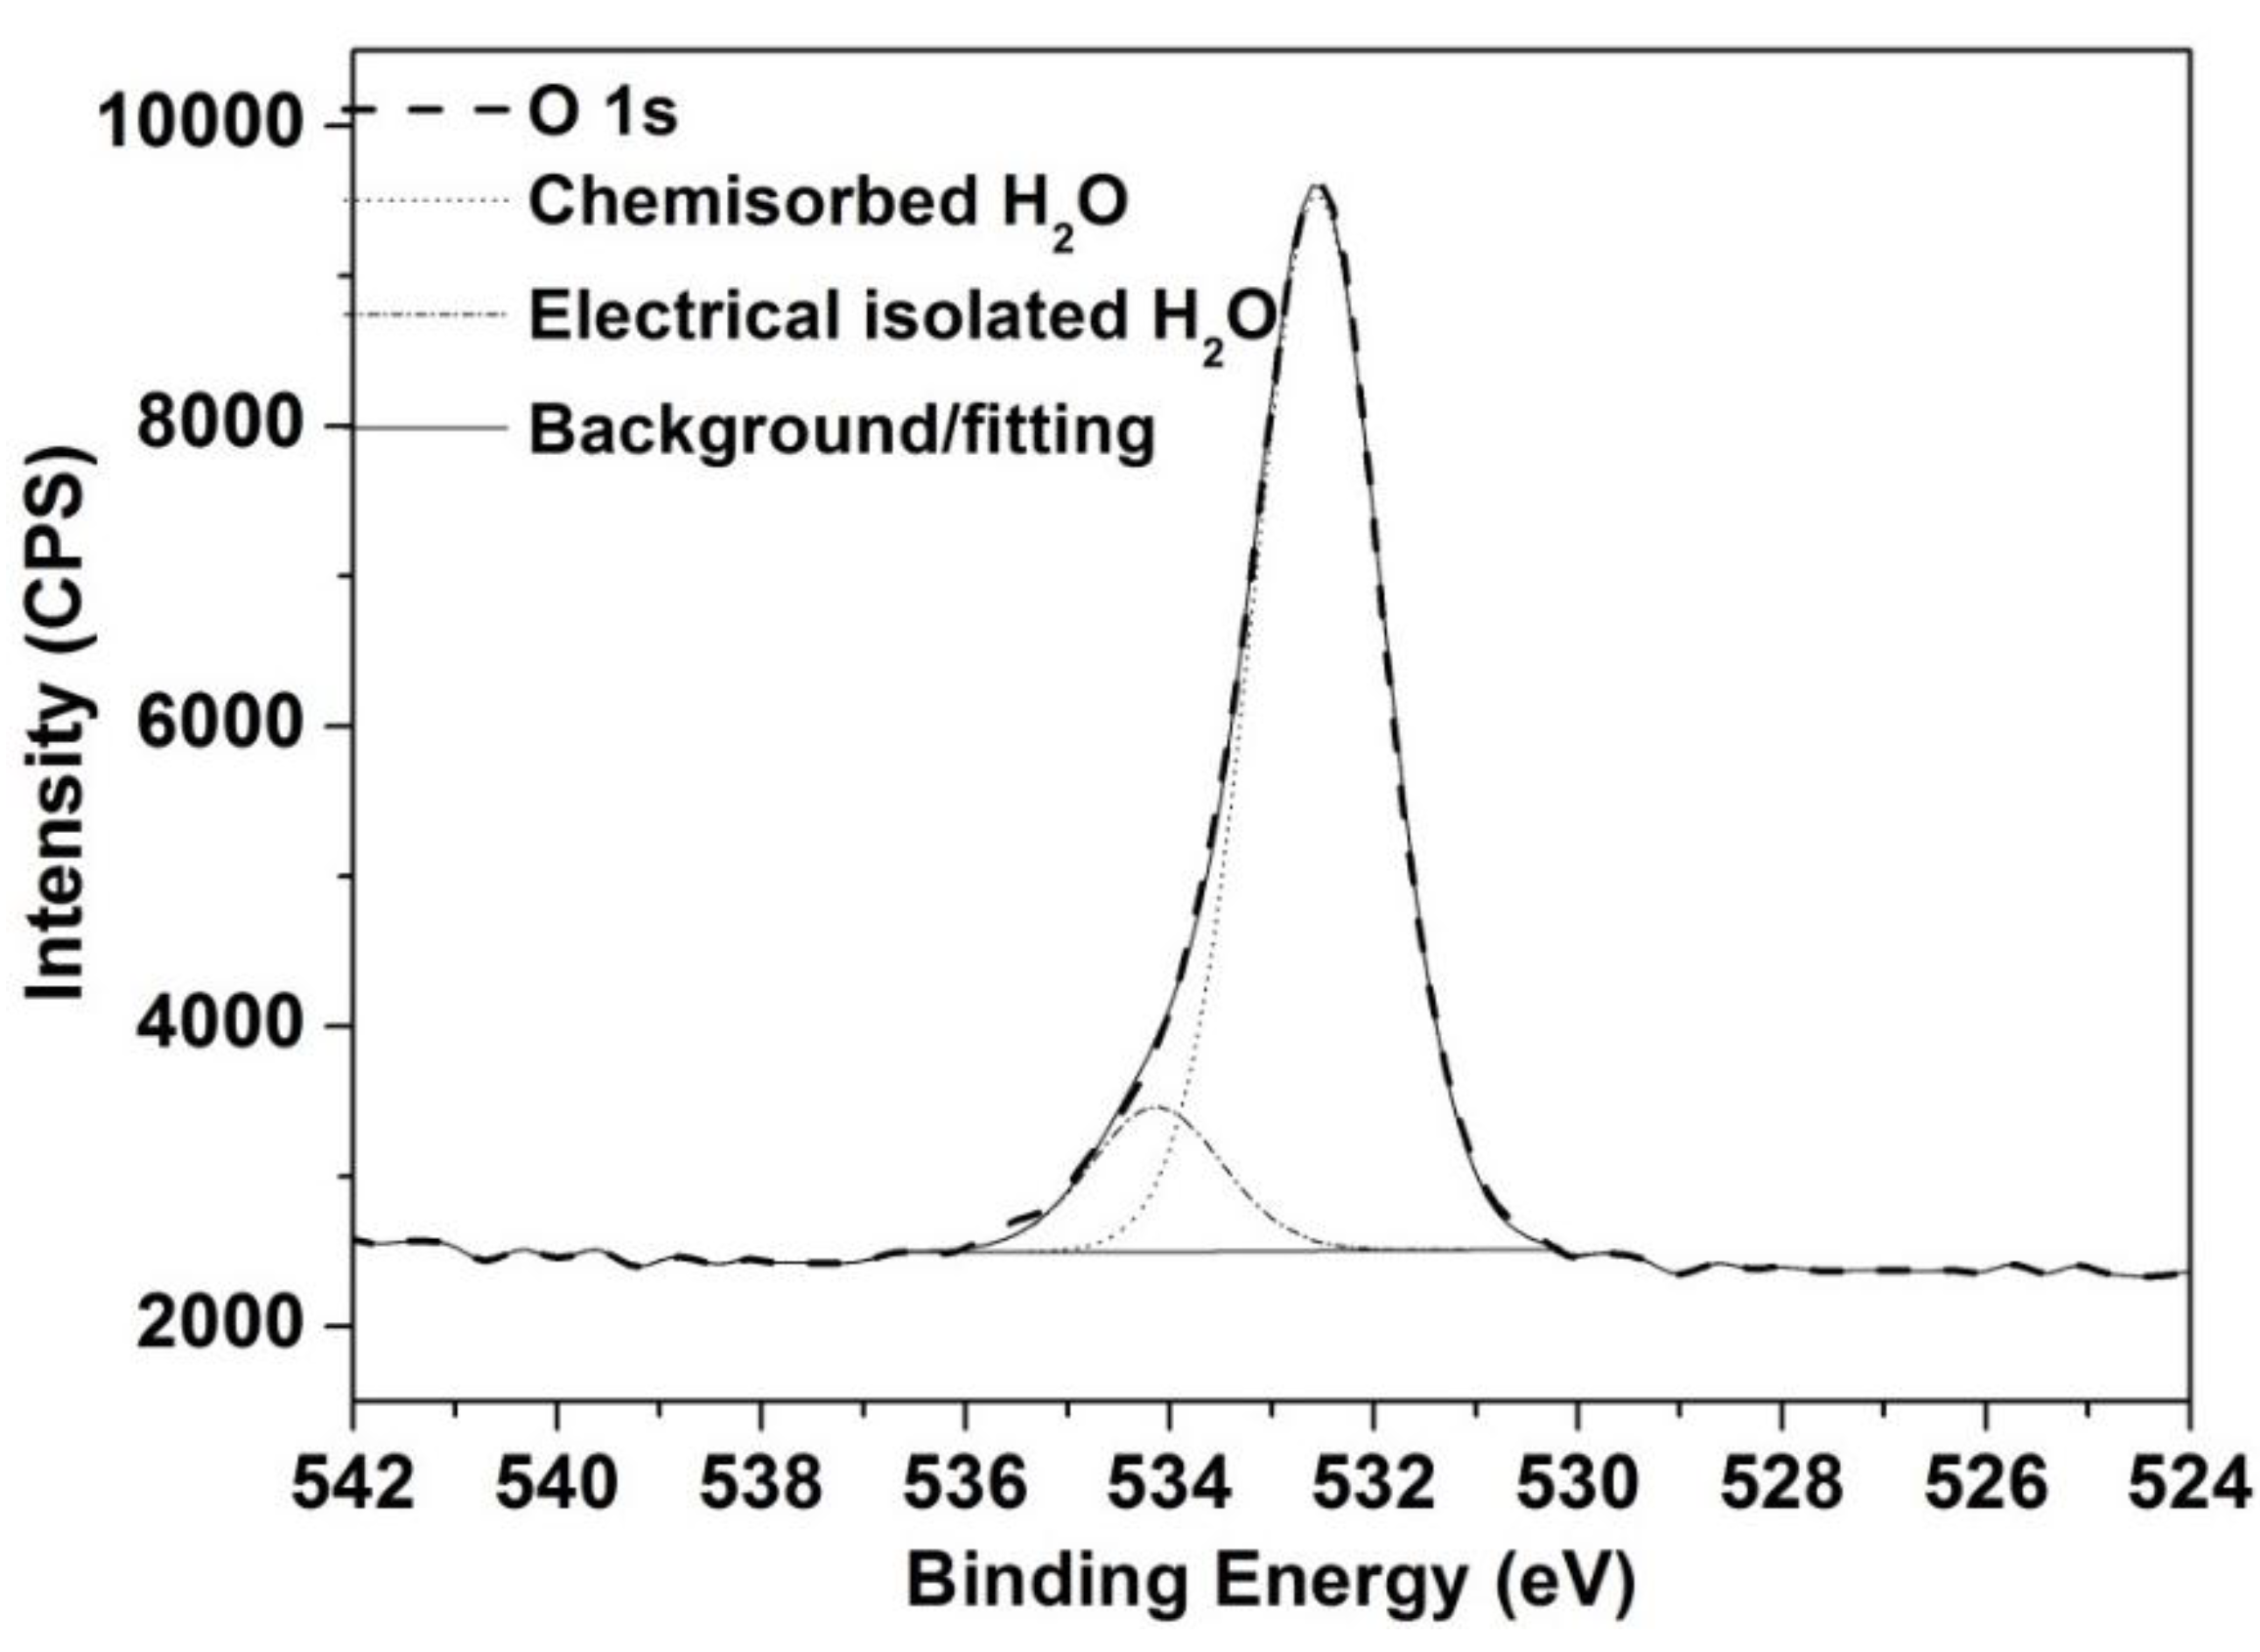
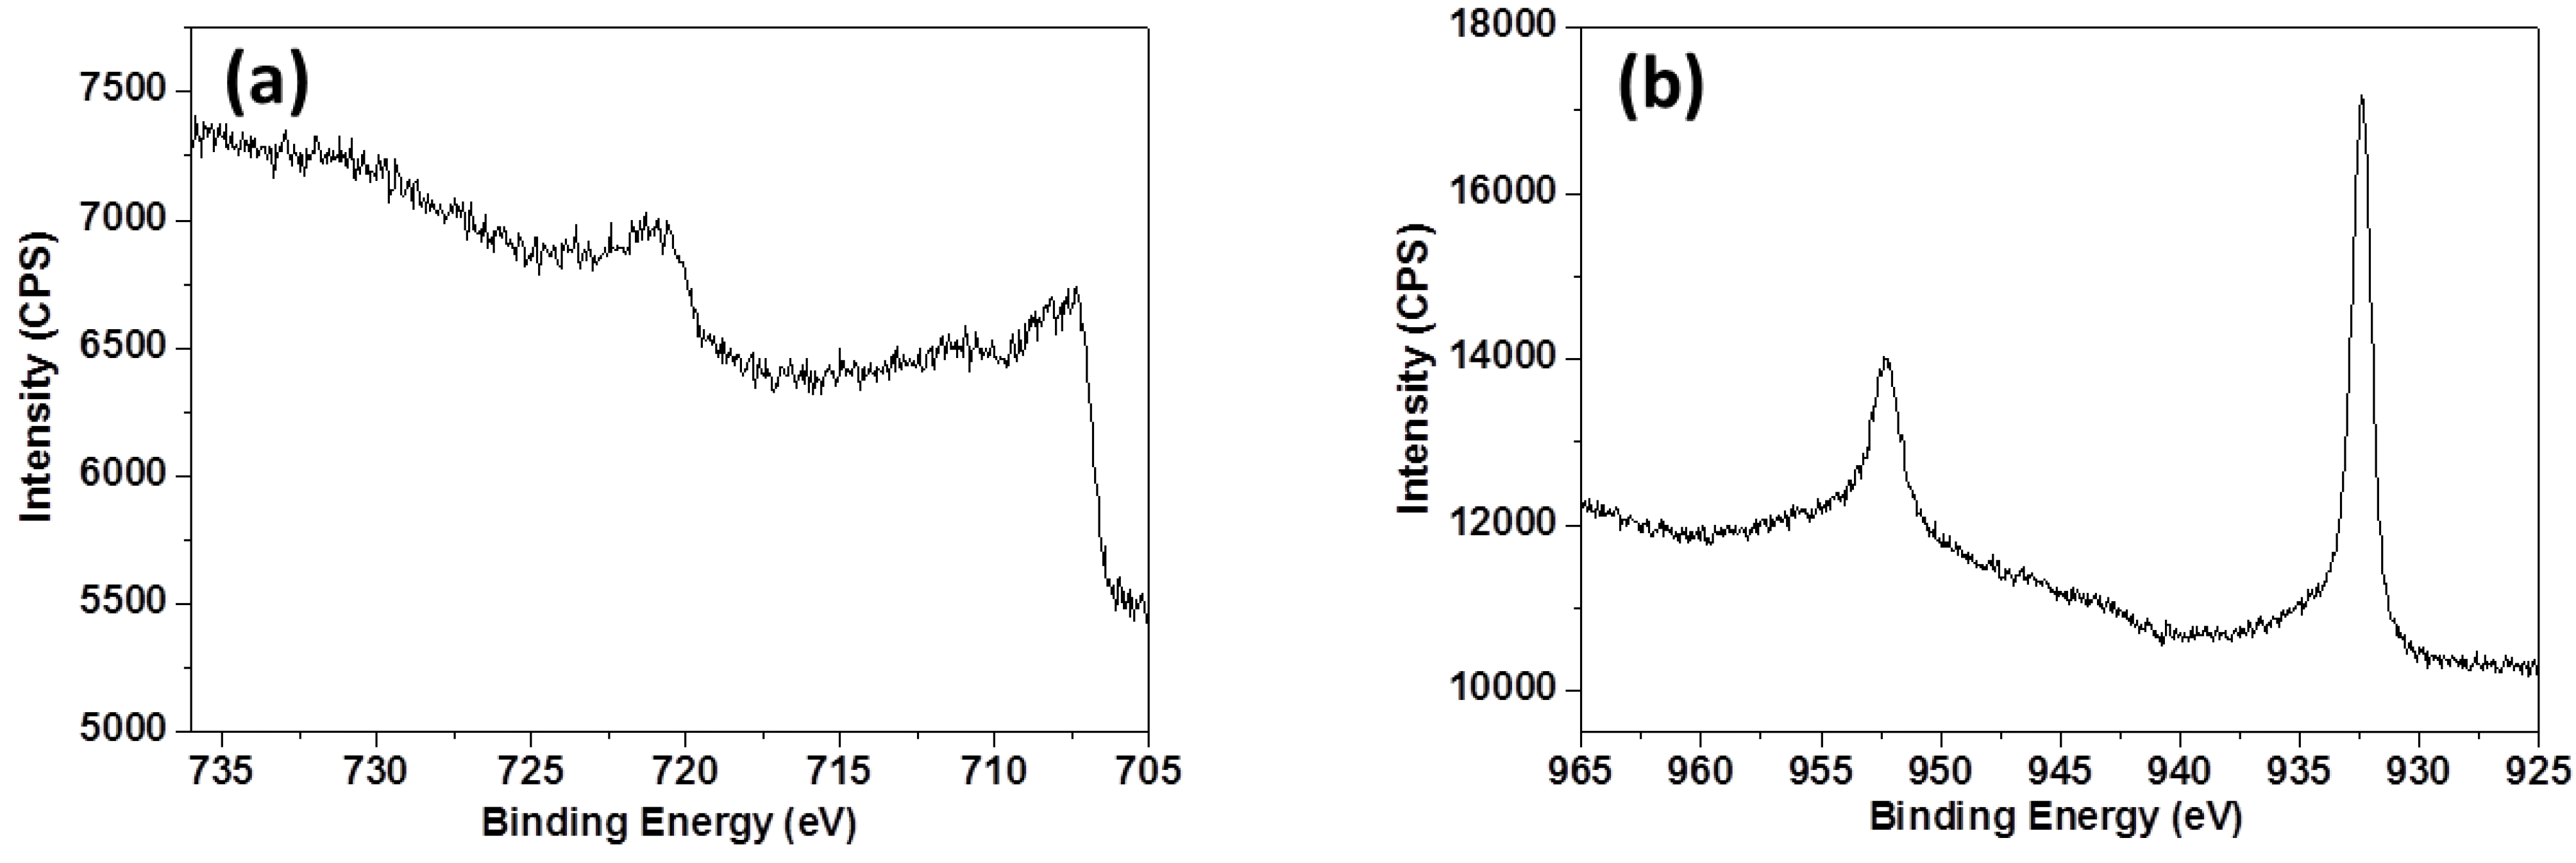
3.3. XPS Analyses

| S Species | Binding Energy (eV) | FWHM * (eV) | Chalcopyrite Only | Chalcopyrite (Galvanic Cell) |
|---|---|---|---|---|
| Surface S2− | 160.6–160.8 | 0.5–0.6 | 3 | 0 |
| Bulk S2− | 161.1 | 0.5–0.6 | 51 | 49 |
| S22− | 161.8–162.2 | 0.6–0.7 | 5 | 7 |
| Sn2− | 162.8–163.4 | 1.2–1.5 | 22 | 28 |
| S0 | 163.9–164.3 | 1.2–1.5 | 2 | 13 |
| SO42− | 168.7–169.1 | 1.2–1.5 | 14 | 0 |
| Energy loss | 164.8–165.2 | 1.8–2.0 | 3 | 3 |

4. Discussion
5. Conclusions
Acknowledgments
Author Contributions
Conflicts of Interest
References
- Córdoba, E.M.; Muñoz, J.A.; Blázquez, M.L.; González, F.; Ballester, A. Leaching of chalcopyrite with ferric ion. Part I: General aspects. Hydrometallurgy 2008, 93, 81–87. [Google Scholar] [CrossRef]
- Córdoba, E.M.; Muñoz, J.A.; Blázquez, M.L.; González, F.; Ballester, A. Leaching of chalcopyrite with ferric ion. Part III: Effect of redox potential on the silver-catalyzed process. Hydrometallurgy 2008, 93, 97–105. [Google Scholar] [CrossRef]
- Li, Y.; Kawashima, N.; Li, J.; Chandra, A.P.; Gerson, A.R. A review of the structure, and fundamental mechanisms and kinetics of the leaching of chalcopyrite. Adv. Colloid Interface Sci. 2013, 197–198, 1–32. [Google Scholar] [CrossRef] [PubMed]
- Watling, H.R. Chalcopyrite hydrometallurgy at atmospheric pressure: 1. Review of acidic sulfate, sulfate-chloride and sulfate-nitrate process options. Hydrometallurgy 2013, 140, 163–180. [Google Scholar] [CrossRef]
- Munoz-Castillo, B.P. Reaction Mechanisms in the Acid Ferric-Sulfate Leaching of Chalcopyrite. Ph.D. Thesis, University of Utah, Salt Lake City, UT, USA, 1977. [Google Scholar]
- Hirato, T.; Majima, H.; Awakura, Y. The leaching of chalcopyrite with ferric sulfate. Metall. Mater. Trans. B 1987, 18, 489–496. [Google Scholar] [CrossRef]
- Klauber, C. A critical review of the surface chemistry of acidic ferric sulphate dissolution of chalcopyrite with regards to hindered dissolution. Int. J. Miner. Process. 2008, 86, 1–17. [Google Scholar] [CrossRef]
- Watling, H.R. The bioleaching of sulphide minerals with emphasis on copper sulphides—A review. Hydrometallurgy 2006, 84, 81–108. [Google Scholar] [CrossRef]
- Hiroyoshi, N.; Miki, H.; Hirajima, T.; Tsunekawa, M. Enhancement of chalcopyrite leaching by ferrous ions in acidic ferric sulfate solutions. Hydrometallurgy 2001, 60, 185–197. [Google Scholar] [CrossRef]
- Dutrizac, J.E. Elemental sulphur formation during the ferric sulphate leaching of chalcopyrite. Can. Metall. Quart. 1989, 28, 337–344. [Google Scholar] [CrossRef]
- Dixon, D.G.; Mayne, D.D.; Baxter, K.G. Galvanox (TM)—A novel galvanically-assisted atmospheric leaching technology for copper concentrates. Can. Metall. Quart. 2008, 47, 327–336. [Google Scholar] [CrossRef]
- Liu, Q.; Li, H.; Zhou, L. Galvanic interactions between metal sulfide minerals in a flowing system: Implications for mines environmental restoration. Appl. Geochem. 2008, 23, 2316–2323. [Google Scholar] [CrossRef]
- Koleini, S.M.J.; Jafarian, M.; Abdollahy, M.; Aghazadeh, V. Galvanic leaching of chalcopyrite in atmospheric pressure and sulfate media: Kinetic and surface studies. Ind. Eng. Chem. Res. 2010, 49, 5997–6002. [Google Scholar] [CrossRef]
- Koleini, S.M.J.; Aghazadeh, V.; Sandström, A. Acidic sulphate leaching of chalcopyrite concentrates in presence of pyrite. Miner. Eng. 2011, 24, 381–386. [Google Scholar] [CrossRef]
- Misra, M.; Fuerstenau, M.C. Chalcopyrite leaching at moderate temperature and ambient pressure in the presence of nanosize silica. Miner. Eng. 2005, 18, 293–297. [Google Scholar] [CrossRef]
- Tshilombo, A.F.; Petersen, J.; Dixon, D.G. The influence of applied potentials and temperature on the electrochemical response of chalcopyrite during bacterial leaching. Miner. Eng. 2002, 15, 809–813. [Google Scholar] [CrossRef]
- Berry, V.K.; Murr, L.E.; Hiskey, J.B. Galvanic interaction between chalcopyrite and pyrite during bacterial leaching of low-grade waste. Hydrometallurgy 1978, 3, 309–326. [Google Scholar] [CrossRef]
- Mehta, A.P.; Murr, L.E. Kinetic study of sulfide leaching by galvanic interaction between chalcopyrite, pyrite, and sphalerite in the presence of T. ferrooxidans (30 °C) and a thermophilic microorganism (55 °C). Biotechnol. Bioeng. 1982, 24, 919–940. [Google Scholar] [CrossRef] [PubMed]
- Li, Y.; Qian, G.; Li, J.; Gerson, A. The rate controlling parameters in the hydrometallurgical leaching of chalcopyrite. In Proceedings of ALTA 2014 Nickel-Cobalt-Copper Sessions, Perth, Australia, 24–31 May 2014; pp. 399–410.
- Li, Y.; Qian, G.; Li, J.; Gerson, A.R. Kinetics and roles of solution and surface species of chalcopyrite dissolution at 650 mV. Geochim. Cosmochim. Acta 2015, 161, 188–202. [Google Scholar] [CrossRef]
- Li, J.; Kawashima, N.; Kaplun, K.; Absolon, V.J.; Gerson, A.R. Chalcopyrite leaching: The rate controlling factors. Geochim. Cosmochim. Acta 2010, 74, 2881–2893. [Google Scholar] [CrossRef]
- Kaplun, K.; Li, J.; Kawashima, N.; Gerson, A.R. Cu and Fe chalcopyrite leach activation energies and the effect of added Fe3+. Geochim. Cosmochim. Acta 2011, 75, 5865–5878. [Google Scholar] [CrossRef]
- Kimball, B.E.; Rimstidt, J.D.; Brantley, S.L. Chalcopyrite dissolution rate laws. Appl. Geochem. 2010, 25, 972–983. [Google Scholar] [CrossRef]
- Li, Y.; Chandra, A.P.; Gerson, A.R. Scanning photoelectron microscopy studies of freshly fractured chalcopyrite exposed to O2 and H2O. Geochim. Cosmochim. Acta 2014, 133, 372–386. [Google Scholar] [CrossRef]
- Qian, G.; Li, J.; Li, Y.; Gerson, A.R. Probing the effect of aqueous impurities on the leaching of chalcopyrite under controlled conditions. Hydrometallurgy 2014, 149, 195–209. [Google Scholar] [CrossRef]
- Acres, R.G.; Harmer, S.L.; Beattie, D.A. Synchrotron XPS, NEXAFS, and ToF-SIMS studies of solution exposed chalcopyrite and heterogeneous chalcopyrite with pyrite. Miner. Eng. 2010, 23, 928–936. [Google Scholar] [CrossRef]
- Buckley, A.N.; Woods, R. An X-ray photoelectron spectroscopic study of the oxidation of chalcopyrite. Aust. J. Chem. 1984, 37, 2403–2413. [Google Scholar] [CrossRef]
- Smart, R.S.C. Surface layers in base metal sulphide flotation. Miner. Eng. 1991, 4, 891–909. [Google Scholar] [CrossRef]
- Fairthorne, G.; Fornasiero, D.; Ralston, J. Effect of oxidation on the collectorless flotation of chalcopyrite. Int. J. Miner. Process. 1997, 49, 31–48. [Google Scholar] [CrossRef]
- Brion, D. Photoelectron spectroscopic study of the surface degradation of pyrite (FeS2), chalcopyrite (CuFeS2), sphalerite (ZnS), and galena (PbS) in air and water. Appl. Surf. Sci. 1980, 5, 133–152. [Google Scholar] [CrossRef]
- Acres, R.G.; Harmer, S.L.; Shui, H.W.; Chen, C.H.; Beattie, D.A. Synchrotron scanning photoemission microscopy of homogeneous and heterogeneous metal sulfide minerals. J. Synchrotron Radiat. 2011, 18, 649–657. [Google Scholar] [CrossRef] [PubMed]
- Yin, Q.; Kelsall, G.H.; Vaughan, D.J.; England, K.E.R. Atmospheric and electrochemical oxidation of the surface of chalcopyrite (CuFeS2). Geochim. Cosmochim. Acta 1995, 59, 1091–1100. [Google Scholar] [CrossRef]
- Harmer, S.L.; Pratt, A.R.; Nesbitt, H.W.; Fleet, M.E. Reconstruction of fracture surfaces on bornite. Can. Mineral. 2005, 43, 1619–1630. [Google Scholar] [CrossRef]
- Pearce, C.I.; Pattrick, R.A.D.; Vaughan, D.J.; Henderson, C.M.B.; van der Laan, G. Copper oxidation state in chalcopyrite: Mixed Cu d9 and d10 characteristics. Geochim. Cosmochim. Acta 2006, 70, 4635–4642. [Google Scholar] [CrossRef]
- Klauber, C.; Parker, A.; van Bronswijk, W.; Watling, H. Sulphur speciation of leached chalcopyrite surfaces as determined by X-ray photoelectron spectroscopy. Int. J. Miner. Process. 2001, 62, 65–94. [Google Scholar] [CrossRef]
- Garrels, R.M.; Christ, C.L. Solutions, Minerals, and Equilibria; Harper & Row: New York, NY, USA, 1965. [Google Scholar]
- Tshilombo, A.F. Mechanism and Kinetics of Chalcopyrite Passivation and Depassivation during Ferric and Microbial Leaching. Ph.D. Thesis, University of Brithish Columbia, Vancouver, BC, Canada, December 2004. [Google Scholar]
- Payant, R.; Rosenblum, F.; Nesset, J.E.; Finch, J.A. The self-heating of sulfides: Galvanic effects. Miner. Eng. 2012, 26, 57–63. [Google Scholar] [CrossRef]
- Costa, M.; Martins, M.; Jesus, C.; Duarte, J. Treatment of acid mine drainage by sulphate-reducing bacteria using low cost matrices. Water Air Soil Pollut. 2008, 189, 149–162. [Google Scholar] [CrossRef]
- Borkowski, A.; Parafiniuk, J.; Wolicka, D.; Kowalczyk, P. Geomicrobiology of acid mine drainage in the weathering zone of pyrite-bearing schists in the rudawy janowickie mountains (Poland). Geol. Q. 2013, 57, 601–612. [Google Scholar] [CrossRef]
- Azzali, E.; Marescotti, P.; Frau, F.; Dinelli, E.; Carbone, C.; Capitani, G.; Lucchetti, G. Mineralogical and chemical variations of ochreous precipitates from acid sulphate waters (asw) at the Roşia Montanǎ gold mine (Romania). Environ. Earth Sci. 2014, 72, 3567–3584. [Google Scholar] [CrossRef]
© 2015 by the authors; licensee MDPI, Basel, Switzerland. This article is an open access article distributed under the terms and conditions of the Creative Commons Attribution license (http://creativecommons.org/licenses/by/4.0/).
Share and Cite
Li, Y.; Qian, G.; Li, J.; Gerson, A.R. Chalcopyrite Dissolution at 650 mV and 750 mV in the Presence of Pyrite. Metals 2015, 5, 1566-1579. https://doi.org/10.3390/met5031566
Li Y, Qian G, Li J, Gerson AR. Chalcopyrite Dissolution at 650 mV and 750 mV in the Presence of Pyrite. Metals. 2015; 5(3):1566-1579. https://doi.org/10.3390/met5031566
Chicago/Turabian StyleLi, Yubiao, Gujie Qian, Jun Li, and Andrea R. Gerson. 2015. "Chalcopyrite Dissolution at 650 mV and 750 mV in the Presence of Pyrite" Metals 5, no. 3: 1566-1579. https://doi.org/10.3390/met5031566
APA StyleLi, Y., Qian, G., Li, J., & Gerson, A. R. (2015). Chalcopyrite Dissolution at 650 mV and 750 mV in the Presence of Pyrite. Metals, 5(3), 1566-1579. https://doi.org/10.3390/met5031566