3.1. Supernatant Chemistry
Decreases in pH, EC, and total alkalinity (TA) were observed over time in bauxite residue in the 200 °C and 235 °C treatments (
Figure 1), indicating a potential for “auto-attenuation” of alkalinity and salinity within the bauxite residue. This is in sharp contrast with the weathering trajectories of tailings derived from sulfidic ores, in which initially low pH and high salinity are exacerbated during weathering due to oxidation of residual iron sulfides [
2,
4]. Some increases in EC and TA were observed in 100 °C and 135 °C treatments whereas EC and TA initially increased and then sharply decreased in the 165 °C, 200 °C, and 235 °C treatments. This suggests that the lower temperature hydrothermal treatments progress along the same reaction trajectory as the higher temperature treatments, with slower reaction rates in the lower temperature treatments.
Figure 1.
pH, EC, and total alkalinity (TA) of supernatants from bauxite residue during pressure vessel treatments at various temperatures. Dashed lines indicate t = 0 values. Note that treatment time (X axis) is graphed on a logarithmic scale. Error bars indicate 95% confidence interval for the mean of the 100 °C treatment at 909 h.
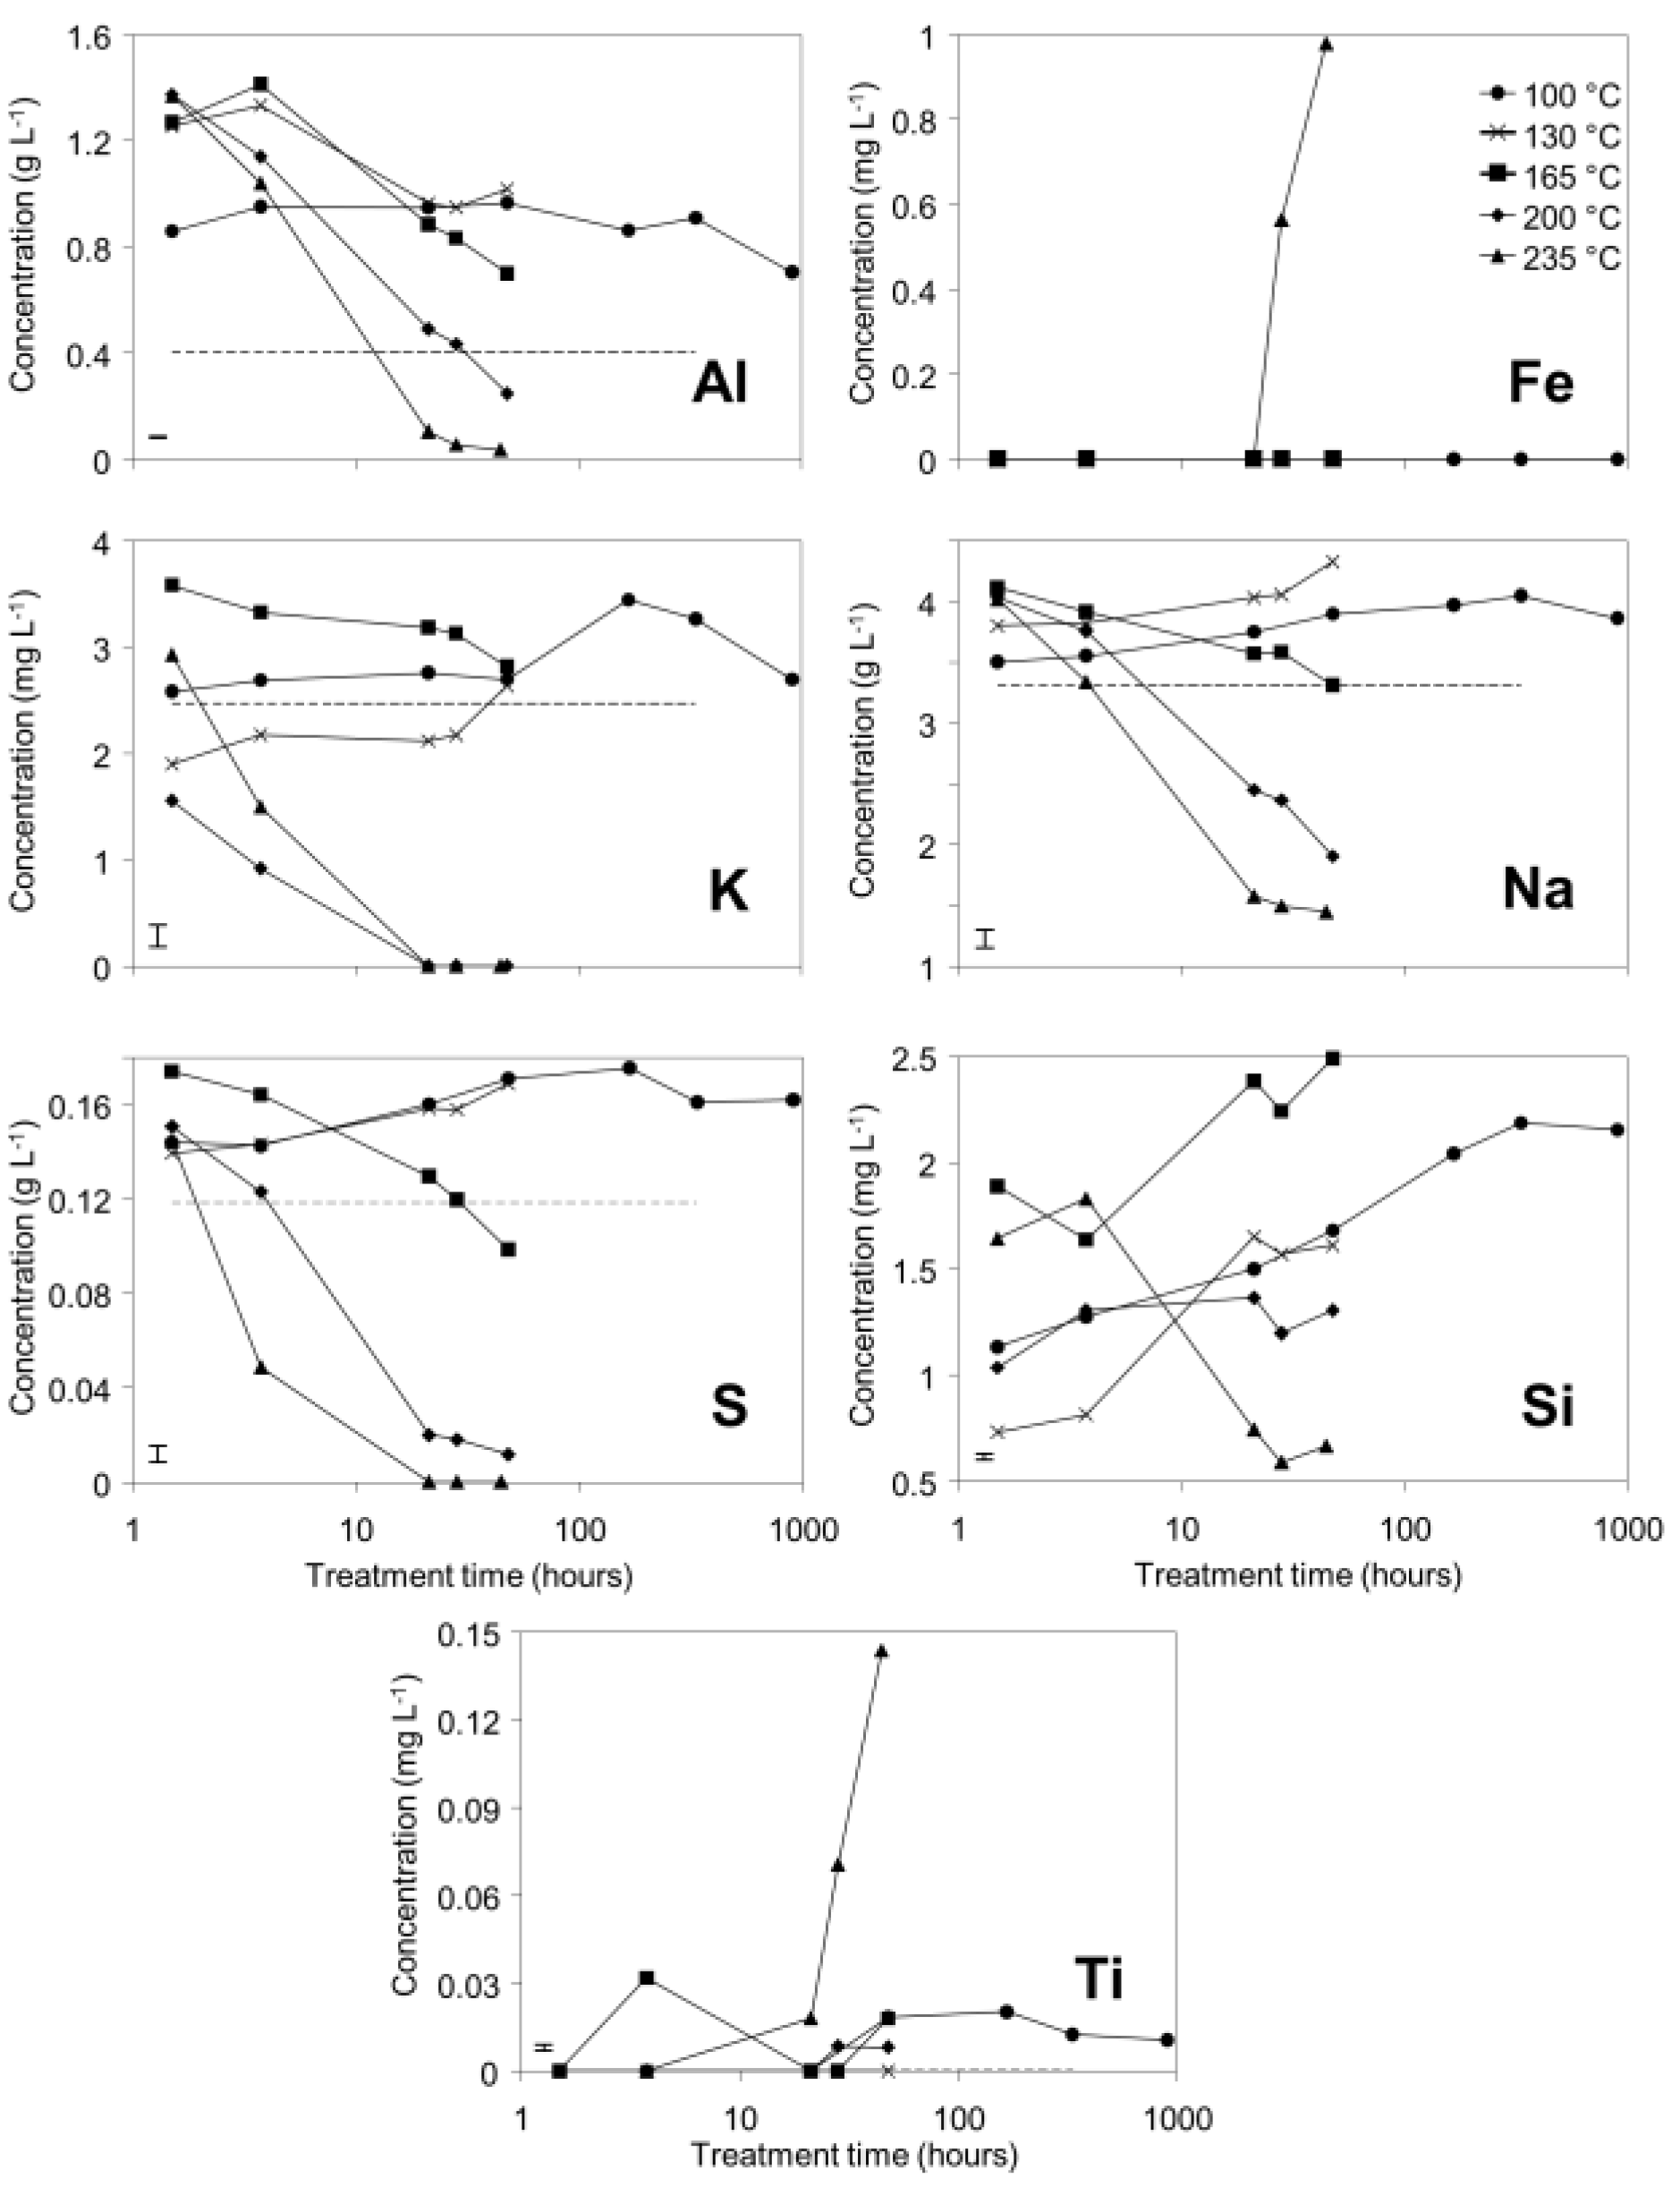
Supernatant concentrations of Al, K, Na, and S all decreased over time to below initial concentrations in the 200 and 235 °C treatments, suggesting removal from solution by mineral precipitation. Concentrations of Al, Na, and S increased and then decreased to concentrations slightly above or below initial concentrations in the 165 °C treatment. This suggests that similar reactions are responsible for observed changes in concentrations of Al, Na, and S at temperatures from 165 to 235 °C, and that reaction rates decrease with decreasing temperature. At 100 and 130 °C, Al, K, Na, and S concentrations increased and remained above initial concentrations during hydrothermal treatment; this suggests that precipitation reactions occur very slowly or do not occur at all at lower temperatures. Silicon concentrations in the supernatant increased over time in all but the 235 °C treatment. This could be a result of dissolution of reactive Si (from muscovite or finely divided quartz), with precipitation of sodalite or cancrinite only occurring to an appreciable extent at 235 °C. Iron concentrations in solution remained near or below the detection limit for all treatment temperatures except 235 °C (
Figure 2). The assumption of anatase insolubility was supported by ICP-OES data, which indicated that little Ti was released to solution, except at 235 °C. Titanium and iron concentrations increased simultaneously and were present in solution at an approximate Fe:Ti molar ratio of 8:1, which is inconsistent with ilmenite dissolution and rather may indicate dissolution of a minor titanium-substituted iron oxide phase, such as titanohematite. Ca concentrations were below detection limits (0.35 mg/L) in all samples and are therefore not shown in
Figure 2.
Figure 2.
Concentrations of selected elements (mg or g·L−1) in supernatant from bauxite residue after treatment in pressure vessels. Dashed lines indicate concentrations at t = 0. Where no dashed line is visible, concentrations at t = 0 were below detection limits. Note that treatment time (X axis) is graphed on a logarithmic scale. Error bars indicate 95% confidence interval for the mean of the 100 °C treatment at 909 h.
3.2. Solids Mineralogy
The rapid collection of XRD patterns from the bauxite residue slurry in fused silica capillary reaction vessels allowed construction of time sequence graphs which illustrate the temperature dependent transformation of gibbsite to boehmite over short timescales (
Figure 3,
Figure 4,
Figure 5 and
Figure 6). Gibbsite and boehmite dynamics reflect a dissolution-precipitation mechanism based on observed rates of transformation in
Figure 3,
Figure 4,
Figure 5 and
Figure 6, and previous studies of hydrothermal conversion [
46,
47]. This would aid in lowering pH, EC, and TA by diluting the supernatant (Equation (7)). No Al would be released to the supernatant, although some Al initially present in solution may also be precipitated as boehmite.
The gibbsite to boehmite reaction could only be observed by
in situ synchrotron XRD because the transformation time (<50 min at 165–170 °C) was faster than the required time for the stainless steel pressure vessels to heat to temperature. The gibbsite to boehmite transformation is known to occur above 100 °C [
22]. Transformation of gibbsite to boehmite was very slow at temperatures ≤150 °C in this study and increased markedly above this temperature. Elevated pressure slows the transformation, because the sum of the molar volumes of the products is greater than that of the reactants (Equation (7)). At lower temperatures, the inhibitory effect of elevated pressure is likely to have slowed the transformation; however, this effect appeared to have less influence on reaction rates at higher temperatures. A similar conclusion was drawn by Mehta and Kalsotra [
48], who observed conversion of gibbsite to boehmite under hydrothermal conditions only at temperatures ≥190 °C. Higher alumina to caustic ratios (A/C; Al
2O
3:Na
2O ratio (g/L) in the supernatant) also raise the minimum transformation temperature [
49,
50]; the alumina:caustic ratio was consistently below 0.5 in this experiment and was therefore unlikely to have inhibited transformation of gibbsite to boehmite.
Goethite precipitated to a minor extent at 170 °C (
Figure 6). Anatase concentrations appeared stable according to quantitative mineral analysis graphs (
Figure 3,
Figure 4,
Figure 5 and
Figure 6), which supports interpretations based on Ti concentrations in the supernatants (
Figure 2). Amorphous content was stable during the transformation of gibbsite to boehmite; given that calculated amorphous content includes contributions from water in the slurry, amorphous content was expected to increase as a result of the water released during this transformation. The water released during transformation of gibbsite (present in the bauxite residue slurry at approximately 2% wt) to boehmite may have been insufficient to increase the amorphous content detectable within the error of the Rietveld-based quantification approach. The quality of the diffractograms was compromised by the short collection time; this hindered accurate quantification of gibbsite concentrations below 0.5% wt, and quantification of tricalcium aluminate and ilmenite concentrations. Diffractogram quality may also have been too poor to detect small changes in amorphous content of the solid phase. Longer collection times (1–2 min) are required for complex mineral assemblages if quantification of minor phases, or small changes in concentration of major phases are of interest.
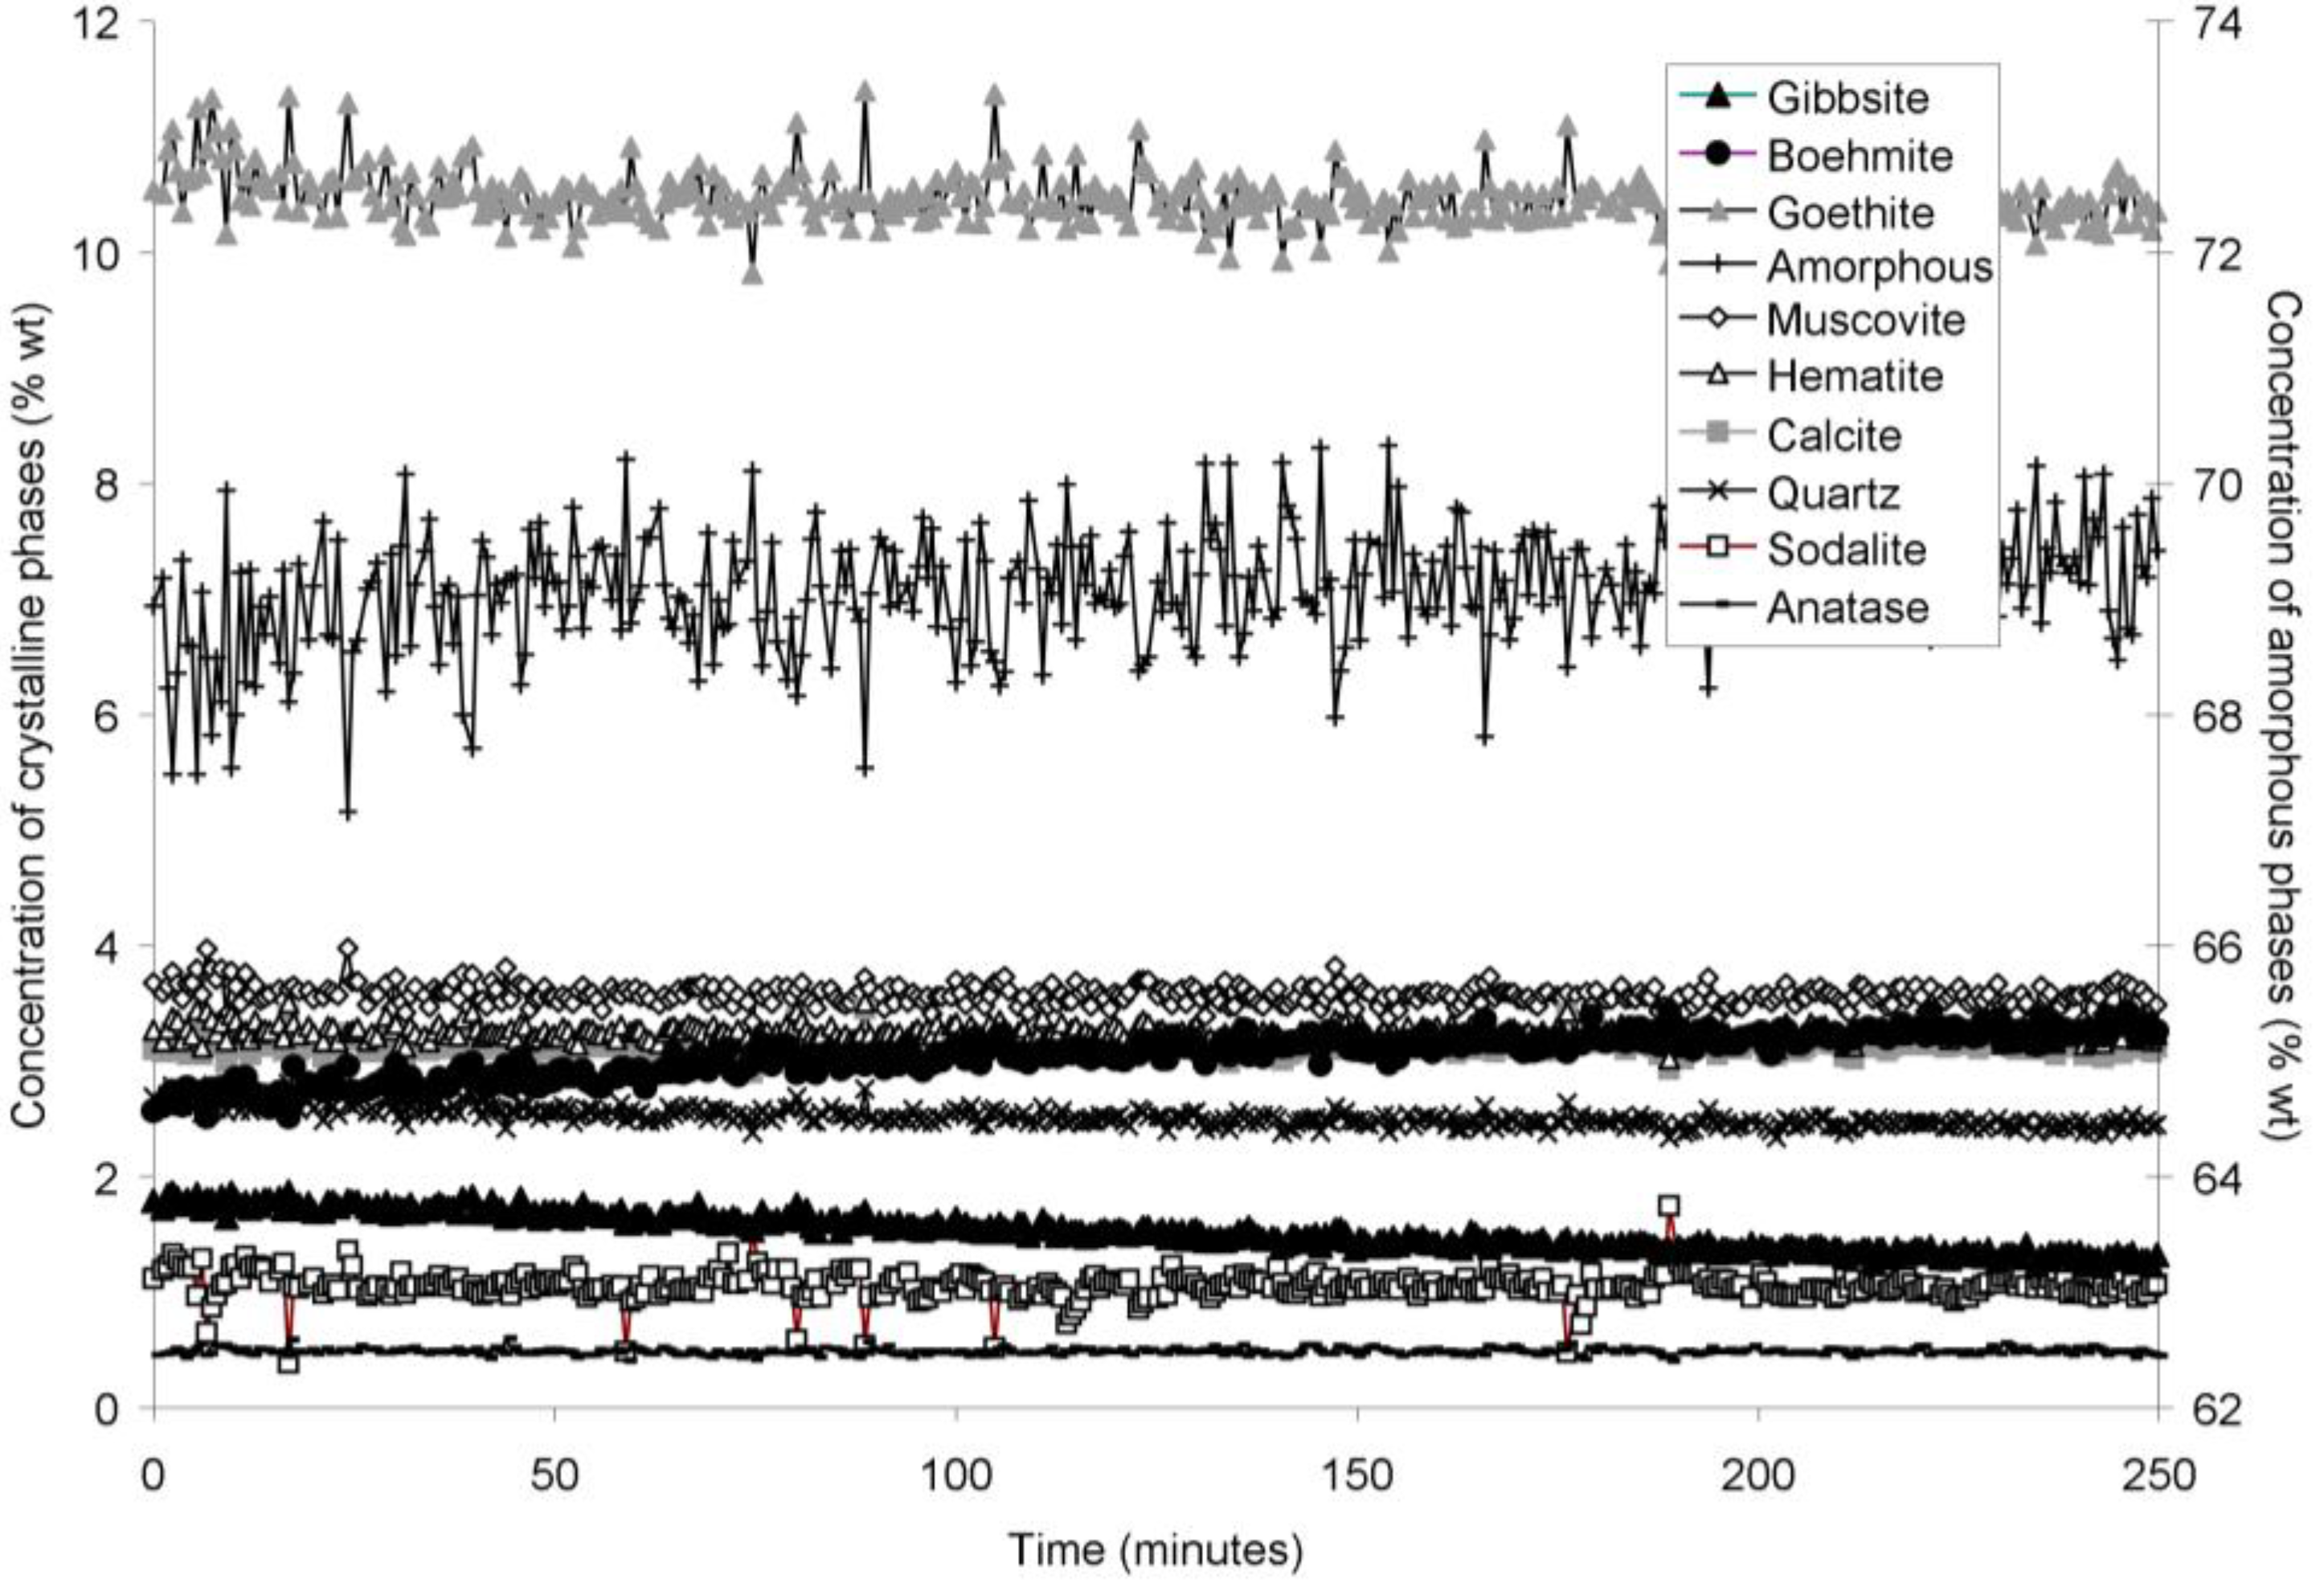
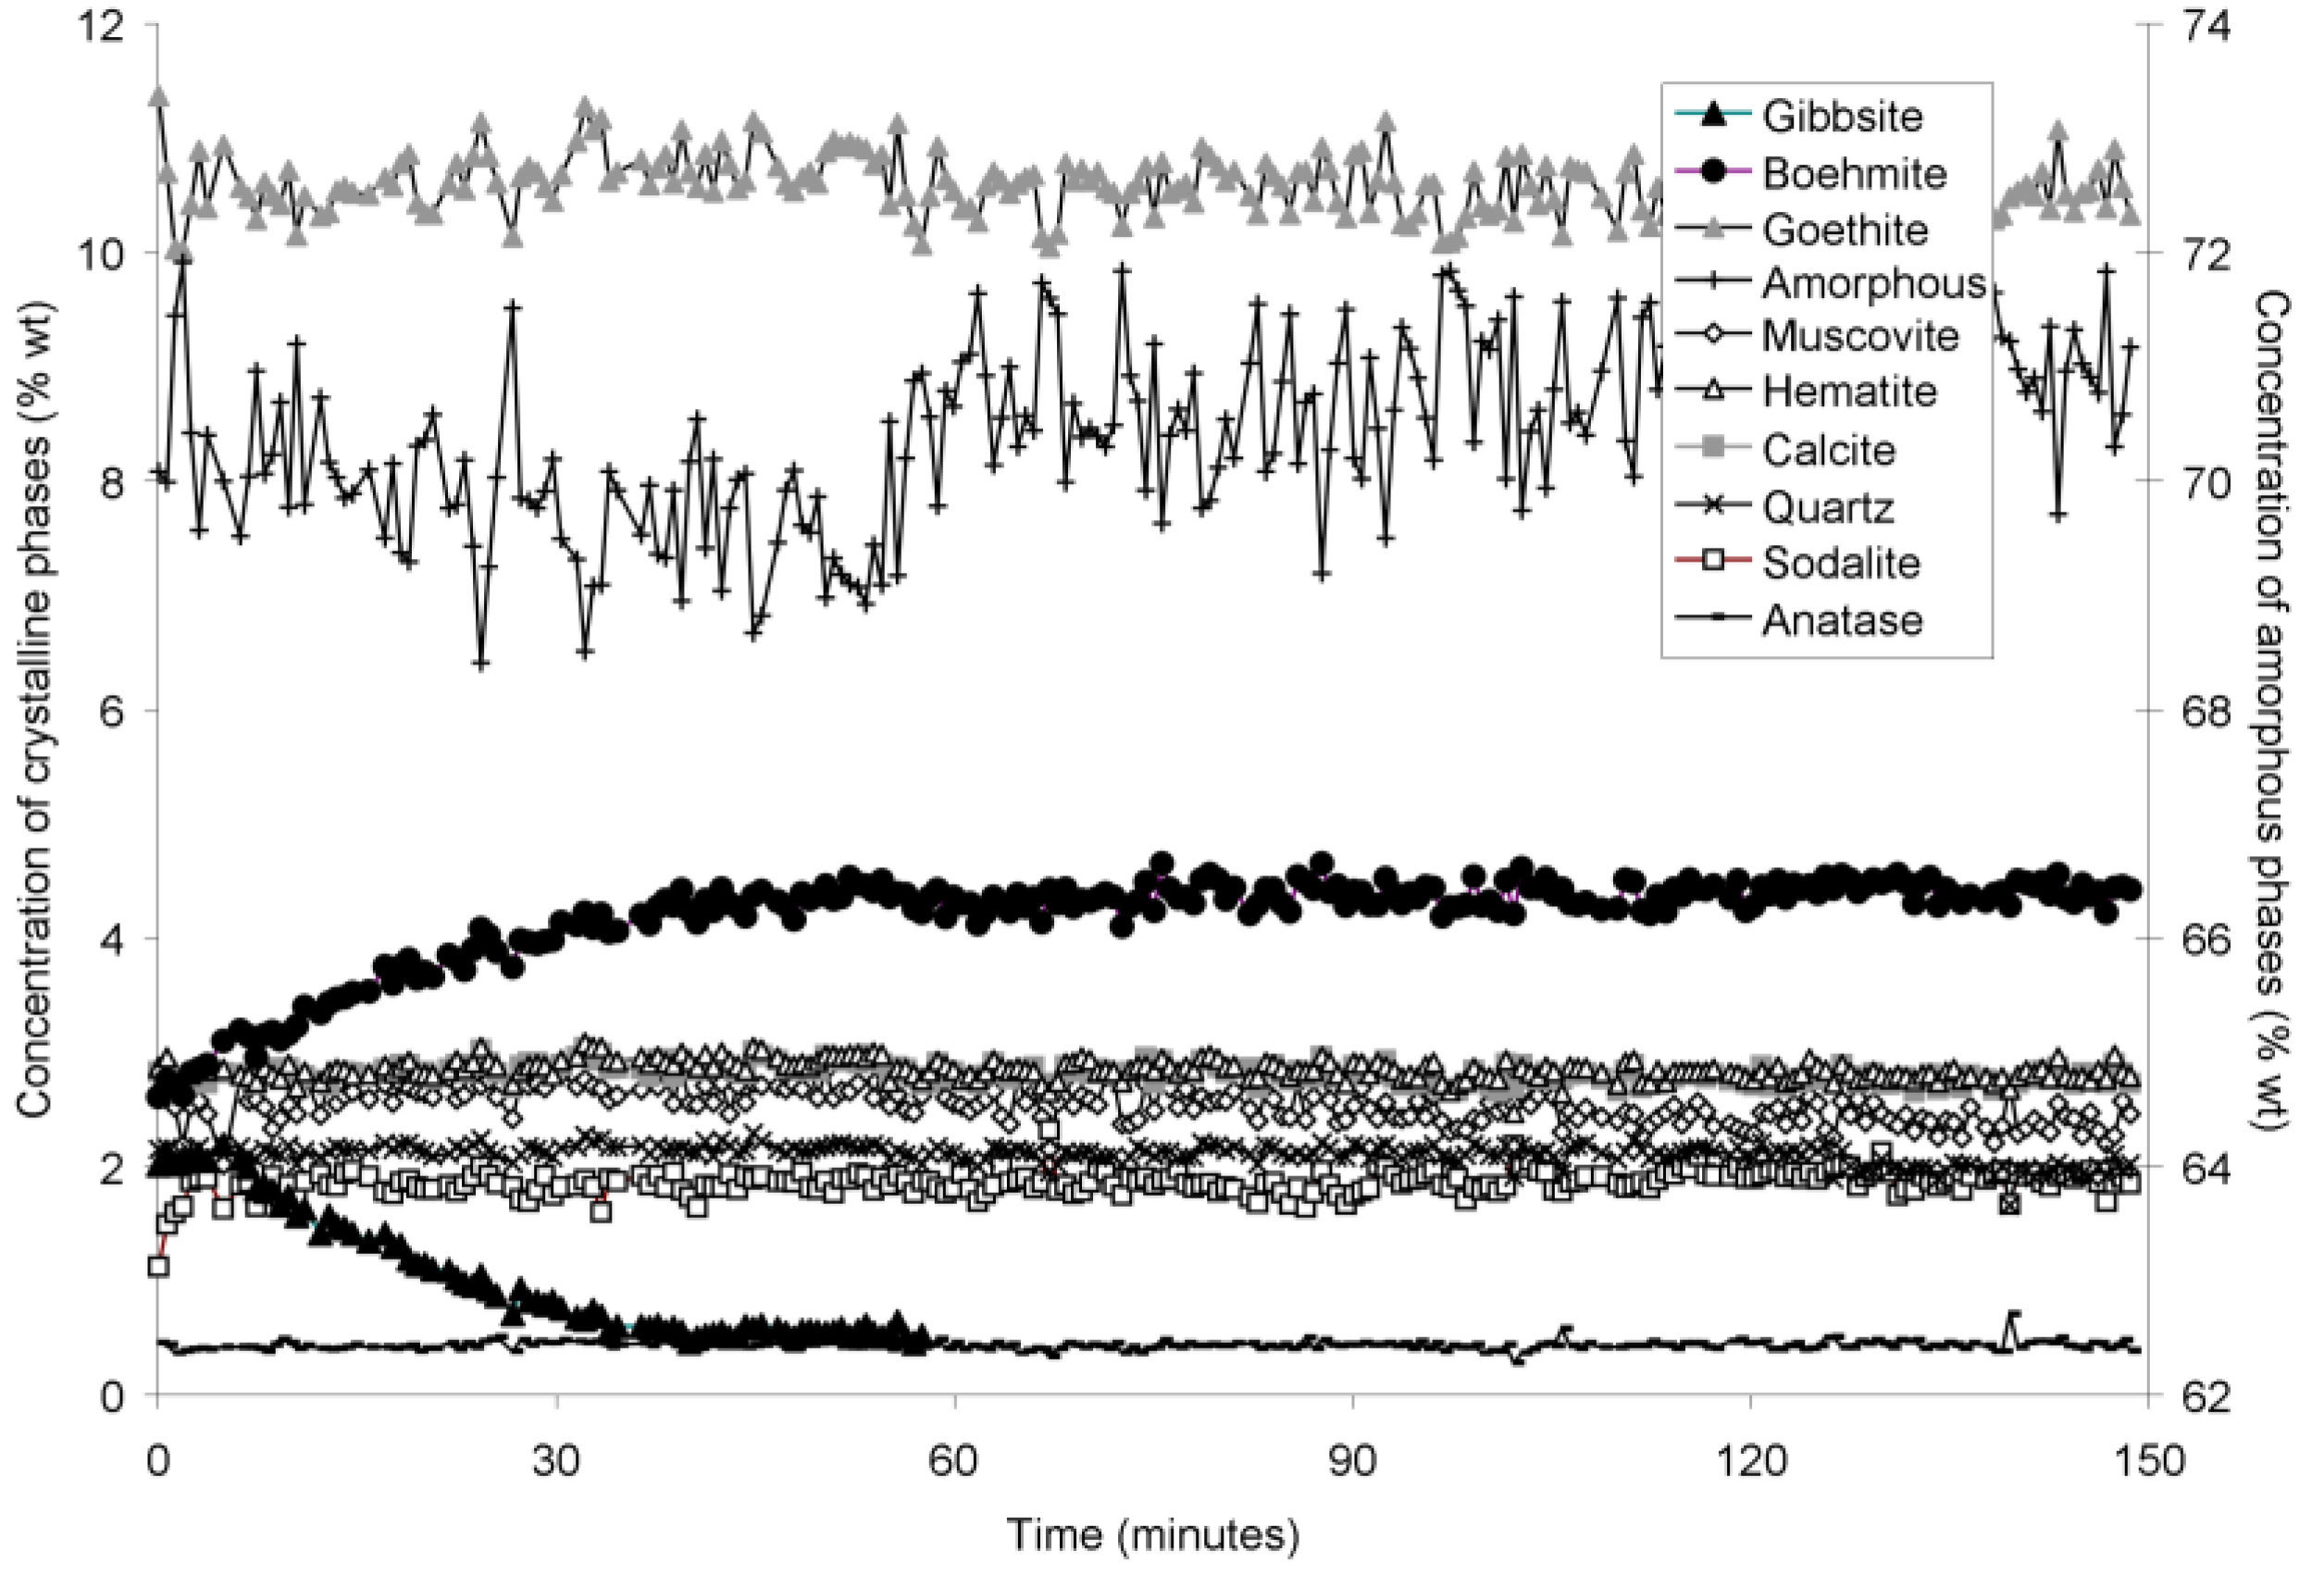
Figure 3.
Concentration of crystalline and amorphous phases in bauxite residue slurry in capillary reaction vessels as a function of treatment time at 140 °C, as determined by Rietveld-based quantitative mineral analysis of X-ray diffractograms. Note that amorphous content is plotted on the secondary Y axis and represents contributions from X-ray amorphous minerals in bauxite residue, water in the slurry, and the fused silica capillary.
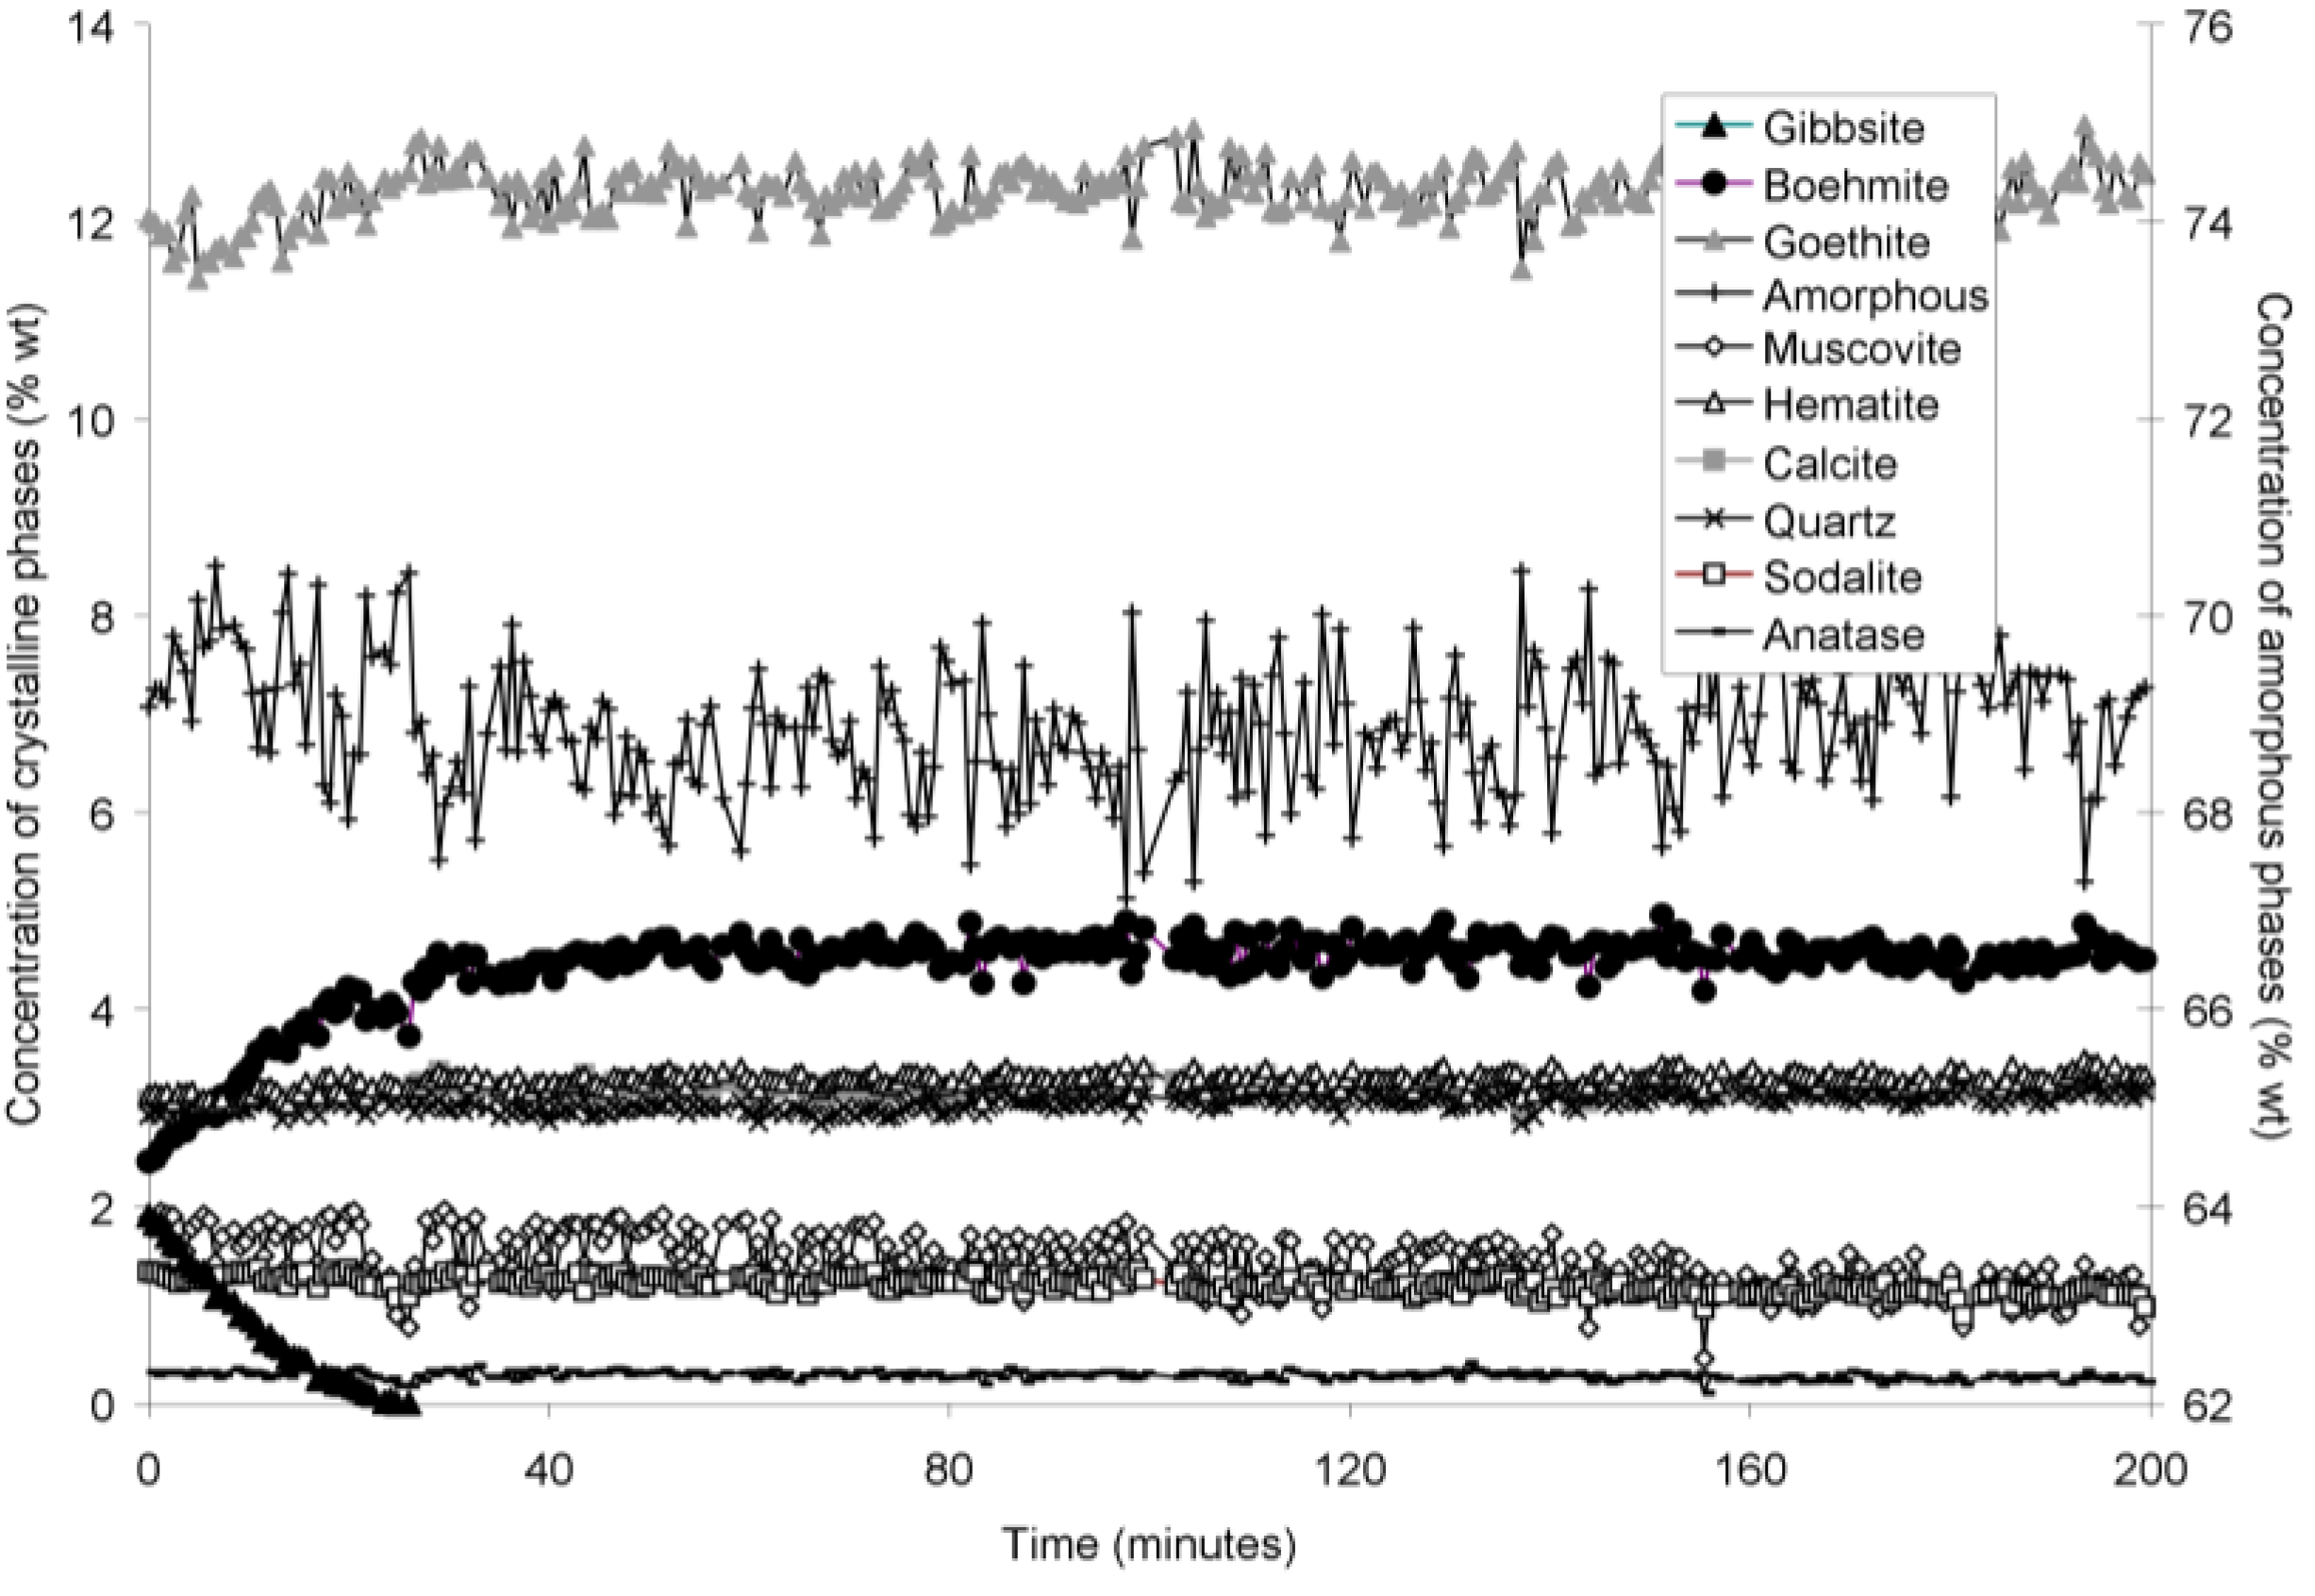
Figure 4.
Concentration of crystalline and amorphous phases in bauxite residue slurry in capillary reaction vessels as a function of treatment time at 150 °C, as determined by Rietveld-based quantitative mineral analysis of X-ray diffractograms. Note that amorphous content is plotted on the secondary Y axis and represents contributions from X-ray amorphous minerals in bauxite residue, water in the slurry, and the fused silica capillary. Gaps in data from 100–110, and 160–180 min were caused by beam loss at the synchrotron. Heating of the slurry continued during beam loss.
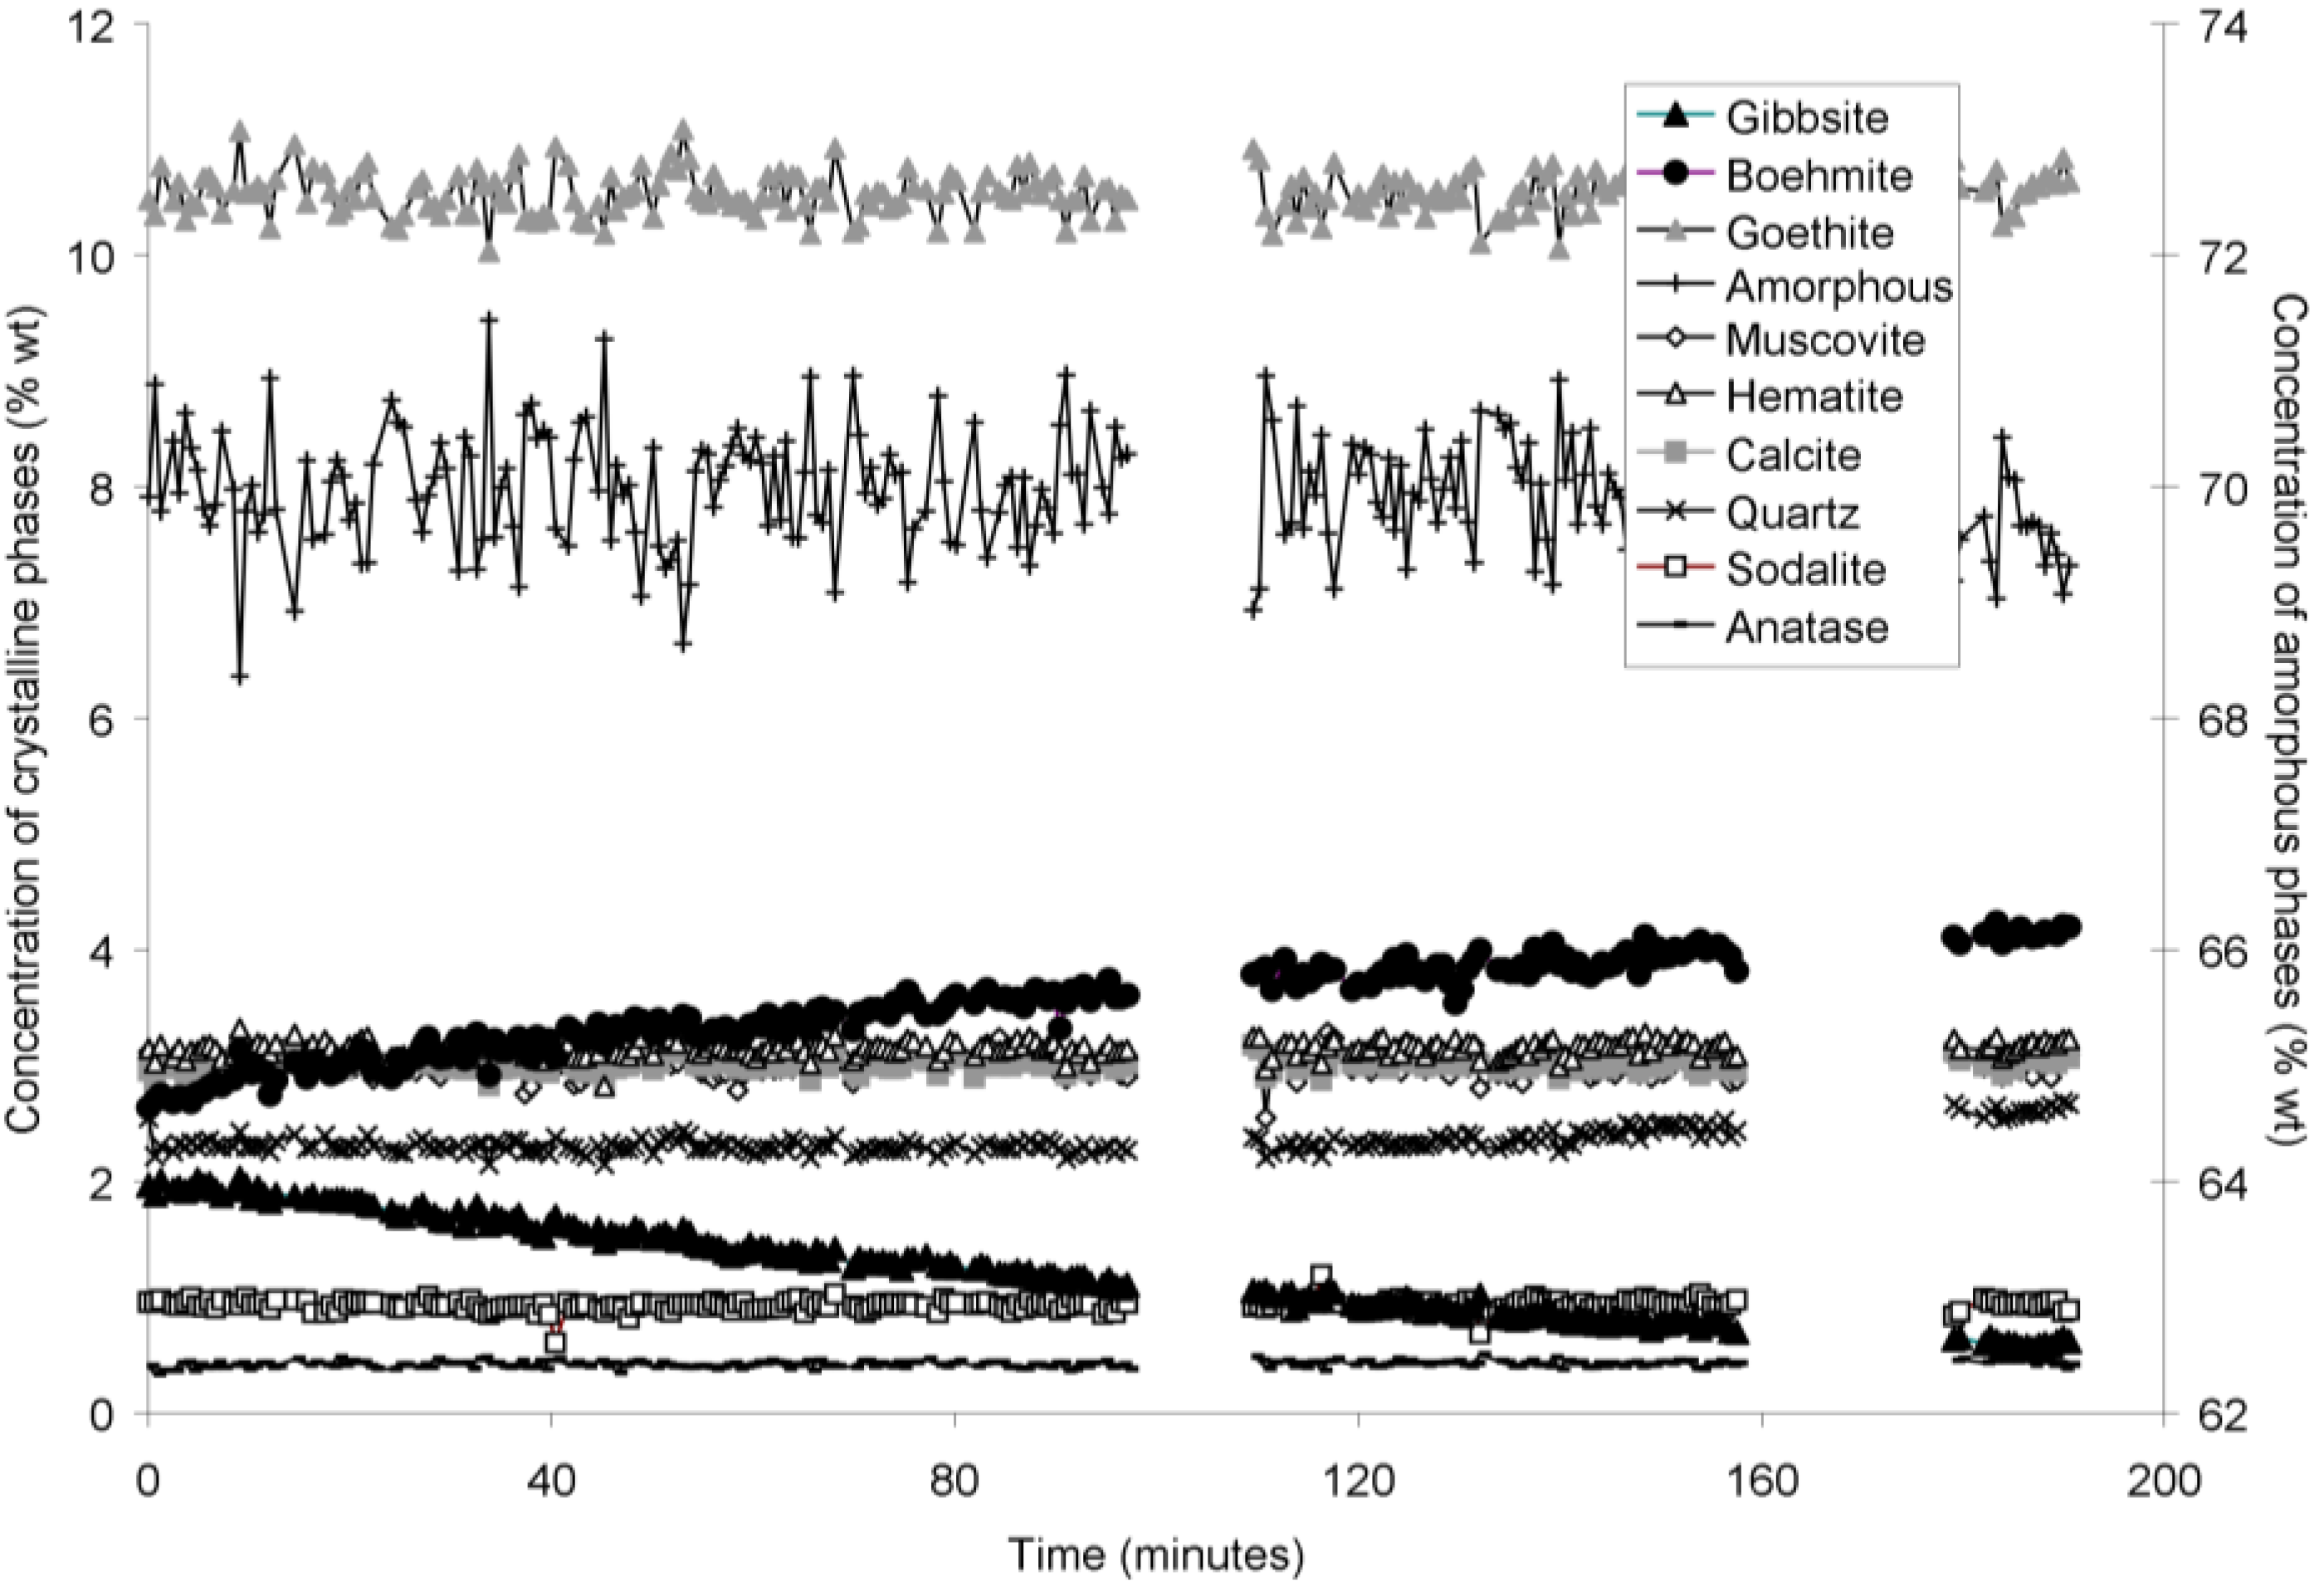
Figure 5.
Concentration of crystalline and amorphous phases in bauxite residue slurry in capillary reaction vessels as a function of treatment time at 165 °C, as determined by Rietveld-based quantitative mineral analysis of X-ray diffractograms. Note that amorphous content is plotted on the secondary Y axis and represents contributions from X-ray amorphous minerals in bauxite residue, water in the slurry, and the fused silica capillary.
Figure 6.
Concentration of crystalline and amorphous phases in bauxite residue slurry in capillary reaction vessels as a function of treatment time at 170 °C, as determined by Rietveld-based quantitative mineral analysis of X-ray diffractograms. Note that amorphous content is plotted on the secondary Y axis and represents contributions from X-ray amorphous minerals in bauxite residue, water in the slurry, and the fused silica capillary.
During extended hydrothermal treatment in stainless steel pressure vessels, boehmite, goethite, hematite, and calcite appeared to precipitate (
Figure 7;
Table 2), along with minor precipitation of sodalite; whereas gibbsite and tricalcium aluminate dissolved (
Figure 7). As discussed above, gibbsite is likely converted to boehmite during hydrothermal treatment. Although conversion of goethite to hematite has been observed under Bayer process conditions [
22], goethite dissolution was not observed during this experiment, perhaps due to the inhibitory effect of anatase [
22]. The precipitation of both goethite and hematite was likely limited by low dissolved Fe concentrations. Fe(OH)
4−(aq) is thermodynamically predicted to be the dominant form of dissolved iron at pH values observed in these experiments, and goethite and hematite precipitation would therefore have a minimal effect upon pH, EC, and TA (Equations (8) and (9)) even if precipitation occurred to a greater extent:
Tricalcium aluminate dissolved more slowly than gibbsite and the majority of Al and Ca supplied to solution from dissolution of both minerals is likely to have been precipitated as boehmite and calcite given that Al and Ca concentrations did not increase substantially during dissolution (Equation (10);
Figure 2). This conclusion is consistent with the conversion mechanisms described elsewhere [
23,
46,
47].
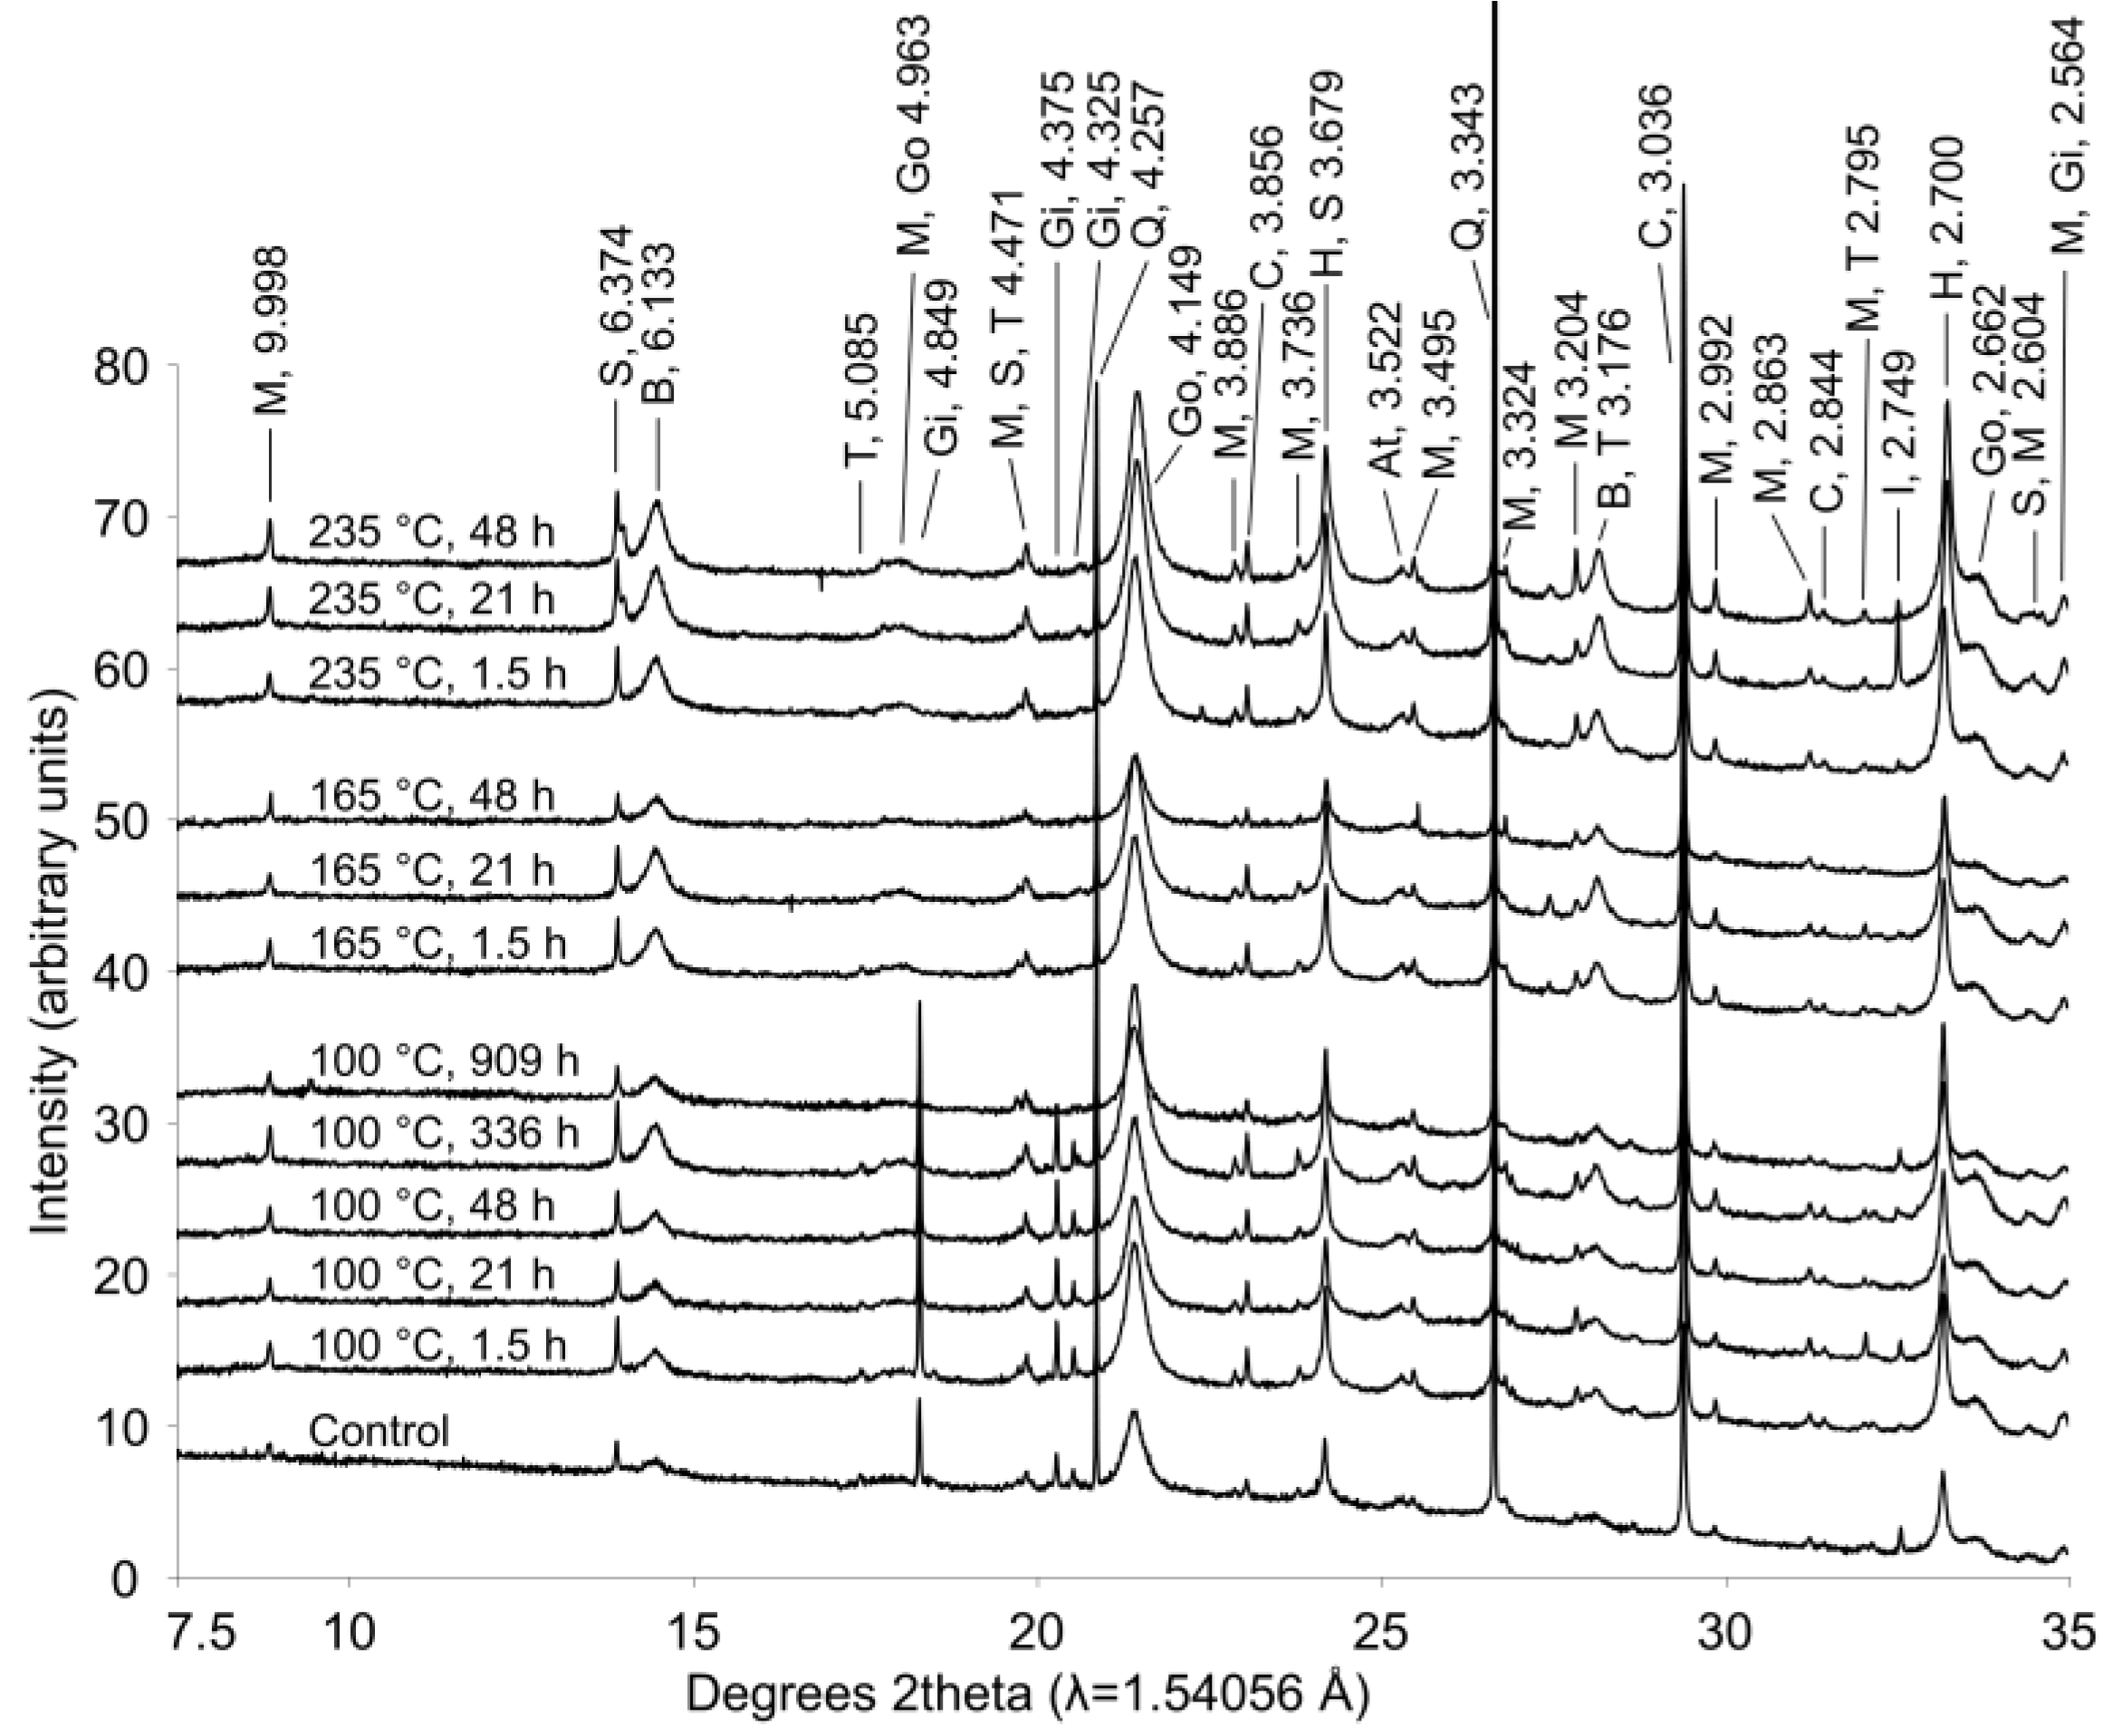
Figure 7.
X-ray diffraction patterns from bauxite residue before and after hydrothermal treatment. Treatment time and temperature are indicated for each pattern. Peaks between 7.5°–35° 2θ are labeled with d-spacings (Å) and abbreviations for minerals as follows: M—muscovite; S—sodalite; B—boehmite; T—tricalcium aluminate; Go—goethite; Gi—gibbsite; Q—quartz; C—calcite; H—hematite; At—natase; I—ilmenite.
Calcite and sodalite precipitation were not observed in the fused silica capillary experiments; changes in calcite:anatase ratio in
Table 2 indicate that this is a slower reaction and smaller in magnitude than the boehmite precipitation reaction. Precipitation of calcite may have only occurred to a minor extent during the fused silica capillary experiments, and therefore may not have been detected. A similar explanation may account for the observations of goethite and hematite precipitation in the longer term stainless steel pressure vessel experiment. Both minerals precipitated more slowly and to a lesser extent than boehmite (
Table 2), and precipitation may therefore not have been detectable over timescales of 150–250 min at temperatures of 140–165 °C.
Muscovite appeared to dissolve at 165–170 °C in the fused silica capillary experiments but was stable in the stainless steel pressure vessel experiments. As the only K-bearing mineral in bauxite residue, muscovite behaviour could be expected to mirror supernatant K concentrations (
Figure 2), dissolving at temperatures ≤165 °C and precipitating at temperatures ≥200 °C. This is not fully supported by the XRD data from the fused silica capillary or the stainless steel pressure vessel experiments. All XRD patterns were collected from powders or slurries that were rotated during collection of XRD patterns; preferred orientation is therefore unlikely to cause changes in peak areas between patterns. Muscovite has been observed to dissolve under alkaline conditions [
28,
31], although dissolution rates decrease as aqueous Al and Si concentrations increase [
32]. The minor dissolution observed in fused silica capillary experiments at 165–170 °C may be due to decreases in aqueous Al in supernatant solution at temperatures ≥165 °C (
Figure 2). It is unclear why muscovite dissolution was not observed by
ex situ XRD of hydrothermally treated solids.
Table 2.
Percentage change in mineral:anatase ratio during hydrothermal treatment of bauxite residue, relative to untreated bauxite residue. Ratio was calculated from primary peak areas of each mineral from synchrotron XRD scans. Mineral names are abbreviated as follows: Gi—gibbsite; T—tricalcium aluminate; B—boehmite; C—calcite; Go—goethite; H—hematite; S—sodalite. Mineral:anatase ratios of muscovite, anatase, and quartz did not indicate dissolution or precipitation in response to temperature or treatment time.
| Temperature (°C) | Treatment Time (h) | Mineral |
|---|
| Gi | T | B | C | Go | H | S |
|---|
| 100 | 1.5 | 54 | 41 | 82 | 30 | 47 | 15 | 47 |
| 100 | 21 | 47 | 24 | 102 | 43 | 48 | 29 | 62 |
| 100 | 48 | 46 | −2 | 153 | 44 | 52 | 30 | 64 |
| 100 | 336 | 43 | −2 | 313 | 88 | 107 | 89 | 106 |
| 165 | 1.5 | −100 | −14 | 300 | 53 | 71 | 55 | 68 |
| 165 | 21 | −100 | −100 | 468 | 95 | 119 | 109 | 118 |
| 165 | 48 | −100 | −100 | 584 | 106 | 138 | 117 | 190 |
| 235 | 1.5 | −100 | −35 | 348 | 85 | 99 | 90 | 123 |
| 235 | 3.75 | −100 | −100 | 526 | 88 | 114 | 119 | 150 |
| 235 | 21 | −100 | −100 | 587 | 94 | 141 | 177 | 294 |
| 235 | 48 | −100 | −100 | 643 | 111 | 156 | 198 | 389 |
3.3. Reaction Kinetics
Peak areas of minerals in XRD patterns of residues from the 100, 165, and 235 °C treatments in the stainless steel pressure vessel experiment (
Table 2) were used to calculate extents of reaction (α) and kinetic parameters (Equations (4)–(6)). The rapid dissolution of gibbsite and tricalcium aluminate precluded calculation of reaction kinetics for these phases from the stainless steel pressure vessel experiment data. Fused silica capillary reaction vessel data were used for the calculation of gibbsite reaction kinetics, at hydrothermal treatment temperatures of 140, 150, 165, and 170 °C, using absolute mineral concentration as calculated by Rietveld refinement of XRD patterns rather than peak area of minerals relative to the internal standard. The quality of the XRD patterns from the fused silica capillary experiment was insufficient to allow accurate quantification of tricalcium aluminate and reaction kinetics were therefore not calculated for this mineral.
Sharp-Hancock analysis of mineral transformations within these experiments indicated that the plots of ln(−ln(1 − α)) against ln(
t) were well described by linear functions because
r2 values were generally >0.80 (
Table 3), except for goethite at 100 °C. This indicates that a single reaction mechanism dominated over the course of the dissolution or precipitation reactions for most minerals. The
n values of 0.8–1.2 observed for gibbsite dissolution (
Table 4) are consistent with first-order reaction kinetics (
n = 1). Contracting area kinetics, with an
n value of 1.04, and contracting volume kinetics, with an
n value of 1.08, would also be feasible explanations for the observed
n values and are consistent with the transformation of gibbsite to boehmite as a dissolution-precipitation mechanism [
46,
47].
Table 3.
Coefficients of determination (r2) for Sharp-Hancock lines of best fit (ln(−ln(1 − α)) vs. ln(t)) to mineral transformations in bauxite residue. Mineral names are abbreviated as follows: Gi—gibbsite; B—boehmite; C—calcite; Go—goethite; H—hematite; S—sodalite.
| Temperature (°C) | Gi | Temperature (°C) | B | C | Go | H | S |
|---|
| 140 | 0.90 | 100 | 0.86 | 0.84 | 0.64 | 0.91 | 0.91 |
| 150 | 0.98 | 165 | 0.94 | 0.99 | 0.99 | 0.99 | 0.92 |
| 165 | 0.94 | 235 | 0.86 | 1.00 | 1.00 | 1.00 | 0.97 |
| 170 | 0.99 | | | | | | |
Table 4.
Reaction orders (n) derived from Sharp-Hancock lines of best fit (ln(−ln(1 − α)) vs. ln(t)) to mineral transformations in bauxite residue. Mineral names are abbreviated as follows: Gi—gibbsite; B—boehmite; C—calcite; Go—goethite; H—hematite; S—sodalite.
| Temperature (°C) | Gi | Temperature (°C) | B | C | Go | H | S |
|---|
| 140 | 0.804 | 100 | 0.289 | 0.281 | 0.200 | 0.363 | 0.162 |
| 150 | 1.072 | 165 | 0.357 | 0.441 | 0.361 | 0.301 | 0.331 |
| 165 | 0.991 | 235 | 0.403 | 0.096 | 0.314 | 0.499 | 0.508 |
| 170 | 1.185 | | | | | | |
The
Ea value calculated from this study (
Table 5) match well with values from Mehta and Kalsotra’sstudy [
48] of boehmite precipitation under hydrothermal, alkaline conditions for boehmite (
Ea 69.63–73.46 kJ·mol
−1). Under alkaline, heated (60–85 °C) conditions, at ambient pressure, the
Ea for gibbsite dissolution is 107 kJ·mol
−1 [
51]. This is lower than the value observed in this study (
Table 5), which suggests that pressure inhibited the gibbsite-boehmite transformation [
21] The
Ea value determined from this study for sodalite precipitation (
Table 5) was much higher than that determined in other studies for first-order reaction kinetics involving precipitation from solution (38.2–48.4 kJ·mol
−1; [
52,
53]). This suggests that sodalite is not directly precipitated from solution, but that precipitation is reliant upon the dissolution or transformation of another mineral. A similar elevation in activation energy for cancrinite precipitation under Bayer conditions was observed when cancrinite formed from sodalite rather than directly precipitating from solution [
54]. Muscovite or quartz could be sources of reactive silica for sodalite precipitation; however, neither were observed to dissolve to an appreciable extent within this study. No values for activation energies of precipitation of calcite, goethite, or hematite under similar reaction conditions were available in the literature.
The low values of
n returned from Sharp-Hancock analysis (0.10 <
n < 0.85) for minerals other than gibbsite suggest that precipitation of minerals proceeded via three-dimensional (3D) diffusion controlled reaction mechanisms (
Table 3), because these reactions occur with an ideal
n value of 0.57 [
55]. However, the activation energies calculated from Arrhenius plots of ln(
k) against 1/T ranged from 76–131 kJ·mol
−1 (
Table 5). These activation energies are far higher than expected for diffusion controlled reactions (generally <21 kJ·mol
−1; [
56]), and therefore suggest that precipitation reactions were in fact surface controlled.
Table 5.
Activation energies (Ea; kJ·mol−1), pre-exponential (“frequency”) factors (A; s−1), and reaction rates at 165 °C (k; s−1) calculated from Arrhenius plots for mineral transformations in bauxite residue. Mineral names are abbreviated as follows: Gi—gibbsite; B—boehmite; C—calcite; Go—goethite; H—hematite; S—sodalite.
| Parameter | Gi | B | C | Go | H | S |
|---|
| Ea | 190.79 | 88.03 | 99.58 | 75.54 | 75.71 | 131.15 |
| ln A | 49.00 | 12.80 | 18.45 | 9.79 | 8.38 | 21.07 |
| log(k), 165 °C | −1.47 | −4.94 | −3.86 | −4.76 | −5.39 | −6.50 |
In an attempt to distinguish which kinetic models best describe observed behaviour, lines were fitted to the reaction data for [ln(1 − α)] against t, which should result in a straight line with gradient k if the reaction is controlled by first-order kinetics, and [1 − (1 − α)
1/3]
2 against t, which should result in a straight line with gradient k if the reaction is controlled by 3D diffusion [
55]. Gibbsite data was also fitted to [1 − (1 − α)
1/2] against t, which should result in a straight line with gradient k if the reaction proceeds at a decelerating rate proportional to remaining mineral surface area (contracting area), and [1 − (1 − α)
1/3] against t, which should result in a straight line with gradient k if the reaction proceeds at a decelerating rate proportional to remaining mineral volume (contracting volume). Coefficient of determination values (
r2) were used to compare the linear fits achieved by each model. Fits achieved were similar, although
r2 values for first-order reaction models were generally better than
r2 values for 3D diffusion models for precipitating minerals (
Table 6). The gibbsite dissolution rate appears to be constant at 140 and 150 °C (
Figure 3 and
Figure 4), but appears to decelerate at 165 and 170 °C (
Figure 5 and
Figure 6). However, the first-order, contracting area, and contracting volume models fit gibbsite dissolution at 150 and 170 °C equally well (
Table 6). Overall, the fits to first-order, contracting area, and contracting volume models for gibbsite dissolution were almost identical, which does not allow the most appropriate model amongst these three to be identified.
Reaction half lives (time required for half of the reactant(s) in a chemical reaction to be consumed), as predicted by the Avrami-Erofe’ev Equation and using the values of n expected for first-order surface controlled and 3D diffusion controlled reactions, were compared with observed reaction half lives, calculated by interpolation of Sharp-Hancock lines of best fit. Precipitation reaction half lives were predicted far more accurately by the first-order surface control model (
Table 7). This information, combined with the high activation energies which are inconsistent with the 3D diffusion mechanism, suggests that the rates of these precipitation reactions were controlled by first-order surface kinetics. It also seems unlikely that 3D diffusion would control reaction rates in a continuously stirred system. However, there was more than an order of magnitude difference between observed and predicted reaction half lives for boehmite, goethite, muscovite, and sodalite using first-order kinetics, which suggests that first-order kinetics do not accurately model reaction kinetics in all cases.
Table 6.
Coefficient of determination (r2) values for least square lines fitted to mineral precipitation or dissolution data under a first-order surface control kinetic model (FO), 3D diffusion control kinetic model (3D), contracting area model (CA), and contracting volume model (CV). Mineral names are abbreviated as follows: Gi—gibbsite; B—boehmite; C—calcite; Go—goethite; H—hematite; S—sodalite.
| Mineral | Kinetic Model | Temperature (°C) |
|---|
| 100 | 165 | 235 | |
|---|
| B | FO | 0.985 | 0.998 | 0.785 | |
| | 3D | 0.999 | 0.989 | 0.813 | |
| C | FO | 0.995 | 0.989 | 0.938 | |
| | 3D | 0.996 | 0.994 | 0.944 | |
| Go | FO | 0.994 | 0.985 | 0.988 | |
| | 3D | 0.991 | 0.996 | 0.992 | |
| H | FO | 0.992 | 0.819 | 0.994 | |
| | 3D | 0.995 | 0.854 | 0.999 | |
| S | FO | 0.963 | 0.993 | 0.999 | |
| | 3D | 0.989 | 0.962 | 0.998 | |
| Mineral | Kinetic Model | Temperature (°C) |
| 140 | 150 | 165 | 170 |
| Gi | FO | 0.907 | 0.987 | 0.948 | 0.976 |
| | 3D | 0.890 | 0.954 | 0.937 | 0.916 |
| | CA | 0.907 | 0.986 | 0.939 | 0.986 |
| | CV | 0.907 | 0.987 | 0.943 | 0.984 |
Table 7.
Reaction half lives (t1/2) as calculated by interpolation of Sharp-Hancock lines of best fit to observed data (OB) and the Avrami-Erofe’ev equation predicted for first-order surface control (FO) and 3D diffusion control (3D) for mineral transformations in bauxite residue. Mineral names are abbreviated as follows: Gi—gibbsite; B—boehmite; C—calcite; Go—goethite; H—hematite; S—sodalite.
| Temperature | Kinetic Model | Gi | B | C | Go | H | S |
|---|
| 165°C (h) | OB | 0.0061 | 2 | 2 | 2 | 17 | 83 |
| FO | 0.0057 | 16.78 | 1.40 | 11 | 47 | 595 |
| 3D | 0.0570 | 67870 | 869 | 32412 | 416986 | 35509858 |
| 25 °C (years) | FO | 32098 | 164 | 61 | 21 | 94 | 1513193 |
Using the kinetic data presented in
Table 4 and
Table 5, and assuming that reactions are controlled by a first-order surface mechanism (
i.e.,
n = 1), reaction rates were extrapolated to determine reaction half lives at field conditions (1 atm pressure, 25 °C). Calcite, boehmite, goethite and hematite reach their reaction half lives within two centuries; however, gibbsite and sodalite take substantially longer to reach their half lives. Boehmite precipitation was predicted to occur more rapidly than gibbsite dissolution at field conditions, which indicates that gibbsite dissolution would control the gibbsite to boehmite transformation. Although auto-attenuation of residue alkalinity and salinity under closed system conditions is theoretically possible, it would take millions of years under field conditions if controlled by these mineral reactions. No mineral transformations or reactions were observed during simulated weathering that would be potentially deleterious to rehabilitation and long term environmental management, although the slow dissolution of calcite and sodalite (which precipitated to a minor extent under closed system conditions) during rainfall leaching would contribute to the maintenance of high alkalinity and salinity in bauxite residue pore water and leachates. Given the mineral transformations observed here, the soil forming from bauxite residue is likely to have similar mineralogical properties to deeply weathered soils characteristic of tropical environments, such as Nitisols and Ferralsols [
57], owing to the dominance of iron oxides and absence of high-activity clay minerals. These soils are not alkaline or saline so substantial leaching of residue would be required to remove soluble salts, especially sodium which remains in pore water at substantial concentrations (≥1.5 g·L
−1) even at the highest treatment temperature.
The reactions observed in this experiment may not occur under field conditions. Non-linearity in the response of activation energies and reaction rates to temperature and pressure can occur due to different reaction mechanisms being favoured [
56], which hinders the use of observed activation energies and rates to predict behaviour outside the observed range. Diffusion does not appear to be a significant rate limiting process in the observed reactions, but is dependent on pressure, and the direction of this dependence (and thus the effect of pressure on reaction rates according to Equation (1)) cannot be predicted without determining activation volumes of the reactions. The effect of pressure on reaction rates is considered to be small relative to temperature for pressures found in the Earth’s crust (1–10,000 kbar) [
56], and is, therefore, unlikely to cause substantial variation between observed and predicted reaction half lives within this study. However, the effect of temperature on activation energies, rates, and reaction mechanisms could result in a different suite of reactions occurring in bauxite residue within storage areas under ambient temperature and pressure compared to those observed at elevated temperatures and pressures. Results from this study illustrate a potential weathering trajectory for bauxite residue; but this would need to be validated against observations of mineral transformations in the long term for field weathered bauxite residues to confirm that the predicted reactions occur in the field. Further, trace element speciation and mobility, which were beyond the scope of this study, also merit evaluation under both simulated laboratory weathering and field weathering scenarios to ensure that the weathering reactions observed here do not result in pulses of elements, such as As, Se, Mo, and V, being released.


