3.1. Examination of Calcareous Deposits by SEM with EDX
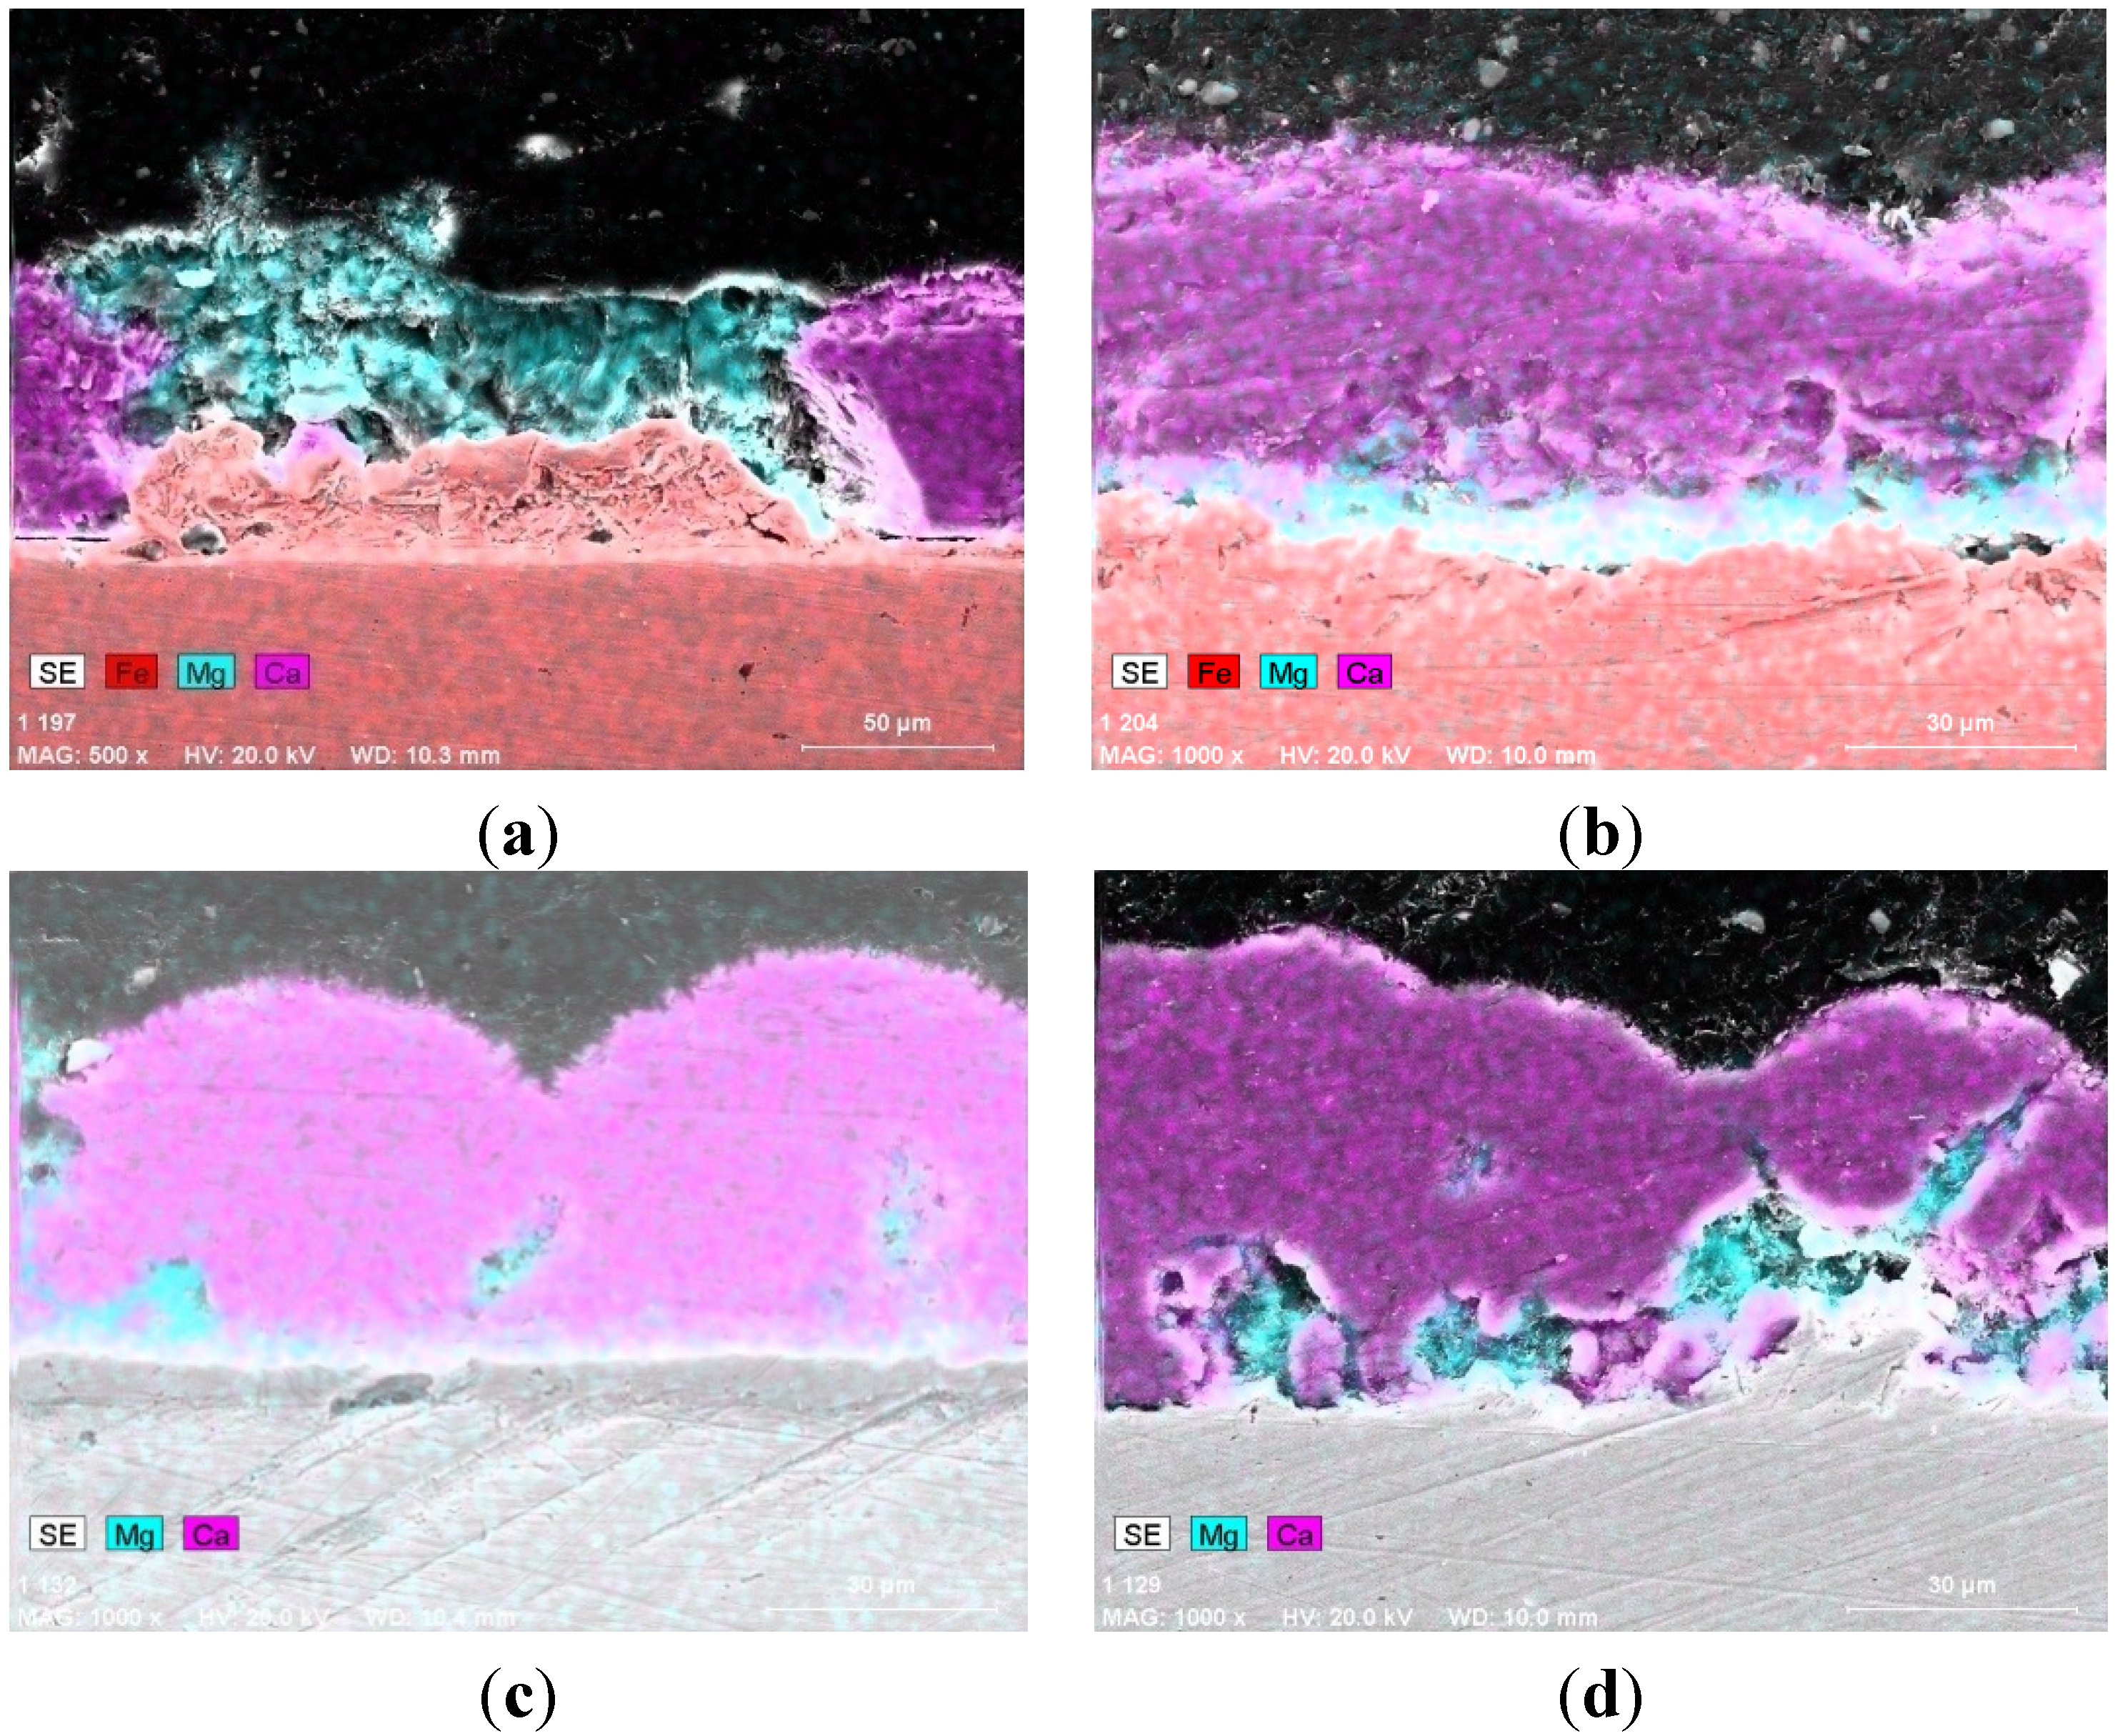
The SEM micrographs and corresponding overlaid Energy Dispersive X-Ray Analysis (EDX) element distribution maps for Mg, Ca and Fe of the cross-sectioned samples subjected to the four different current densities are presented in
Figure 2. The dark green area is magnesium containing, the pink area is calcium containing, and the red region is base iron metal or iron oxide.
The deposit layers formed at any level of cathodic protection are well defined, intact and adherent both to steel substrate and to each other (
Figure 2). The variation in total thickness of deposition is in the range of 30 and 50 μm and is observed to a larger extent along the steel surface compared to that of the level of cathodic protection. Furthermore, the magnesium containing layers are frequently found to be associated with iron. The magnesium-containing layer is clearly present above corrosion products of iron (
Figure 2a) or above the metal surface that has some degree of hydrated iron oxide formed during steel corrosion (
Figure 2b).
For under protected steel with deposition at lower current density of 100 mA·m
−2 and the steady potential of around −840 mV (SCE) the presence of local areas filled with corrosion products is a clear indication of the occurrence of anodic iron dissolution, where the precipitation of iron hydroxides is inevitable at a pH of 7.5. The presence of a relatively thick layer (thickness of about 30 μm) containing magnesium above iron hydroxides suggests co-precipitation of magnesium and iron hydroxides at localised sites on the steel surface. The presence of magnesium rich areas reveals sites of active steel dissolution when cathodically under-protected conditions are applied (
Figure 2a). Mapping the steel surface for the presence of magnesium can be used in assessing corrosion damage.
For protected steel with deposition at applied current densities of 150 and 200 mA·m
−2 with potentials of around −895 and −950 mV (SCE), respectively, the thin magnesium containing layer (thickness of about 10 μm) with incorporated iron is observed near the metal surface with the thick layer of calcium rich compound (thickness of about 30 and 50 μm, respectively) formed above it (
Figure 2b,c). The presence of the magnesium-containing layer near the metal indicates a small level of iron dissolution, which leads to the formation of a mixture of iron and magnesium hydroxides. This occurs prior to the protection provided by calcium carbonate, which deposits when the pH increases to above 8.7. Additionally, the magnesium rich compound only is observed within occasional pores indicating a significant pH increase above 10 and preferential precipitation of magnesium hydroxide within those pores during the formation of calcareous deposit layers. The high pH suggests that the reduction of oxygen proceeds at the bottom of the pore and associated mass transport processes lead to a fast pH increase compared with the pH at the deposit-seawater interface. Defined sites of oxygen reduction during the formation of layers usually correspond to areas of initial anodic dissolution of the steel, since a large amount of iron rich compound is present at the bottom of the pore (
Figure 2a). This evidence is used in developing the impedance model, where “active” pores propagate through both layers of deposit and provide sites for steel corrosion, oxygen reduction and mass transport of active species. Some magnesium rich areas can be observed within the bulk of calcium containing layer (
Figure 2c). The latter can be explained by cross-sectioning the large convoluted pore away from the surface of the metal; this reveals isolated areas of magnesium-rich compound within the calcium carbonate.
Figure 2.
Secondary electron micrographs and corresponding overlaid Energy Dispersive X-Ray Analysis (EDX) element distribution maps for Fe, Mg and Ca of cross-section of calcareous deposit formed after 144 h immersion in seawater at applied current densities of: (a) 100 mA·m−2; (b)150 mA·m−2; (c) 200 mA·m−2; (d) 300 mA·m−2.
For steel subjected to 300 mA·m
−2 and the potentials of −1050 mV (SCE) (
Figure 2d), a high level of alkalization near the metal surface is inevitable and is associated with the commencement of hydrogen evolution, which proceeds on the steel at the beginning of polarisation, and within the pores and cracks of the deposits after their formation. At this stage hydrogen evolves in the form of microscopic bubbles, as there is no detachment of the deposits. Under such conditions deposits have a not so well defined double layer structure with a preferential formation of a magnesium-rich compound near the surface at the early stages of polarisation, and within the developing pores and cracks of calcareous deposition later on.
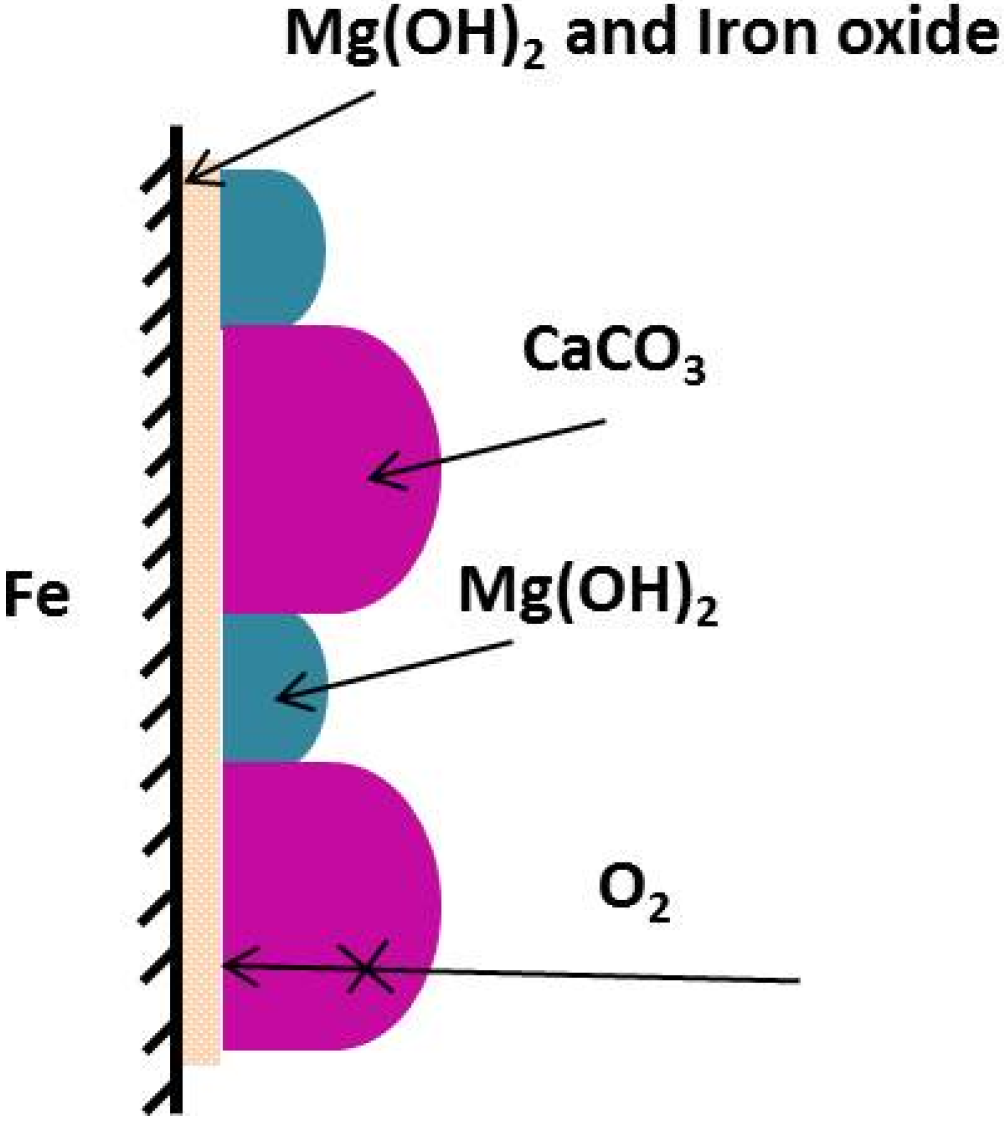
Currently, the presence and formation of a thin inner layer of magnesium hydroxide on the steel, under cathodic protection, is attributed to a high level of alkalisation (above 10) near the surface due to the reduction of oxygen and at very low potentials, due to the process of water reduction [
2,
5,
6,
15]. This statement is very well justified for cathodically protected steel, which has no evidence of corrosion. In a situation when corrosion proceeds in seawater, the hydrolysis of water results in the formation of iron (II and III) hydroxysalts, more commonly known as green rust [
8,
9,
27]. It is a known fact that the formation of corrosion products leads to acidified conditions near the surface of corroding steel promoting further dissolution of iron. For example, the measurement of pH near the surface of a corroding sea wreck indicated a pH variation in the range of 4.2–7.9 while seawater had an average pH of 8.4 [
28].
This work demonstrated the presence of an inner magnesium-containing layer, together with corrosion products, and the ready formation of magnesium hydroxide above corrosion products within the pores of the deposit under all levels of cathodic polarisation from 50 to 400 mA·m
−2. This can only be explained by the initial co-precipitation of magnesium and iron hydroxides at a pH lower than expected, and below a pH of 7.3 (commencement of calcium carbonate precipitation). The post-precipitation of magnesium hydroxide is possible over mixed magnesium-iron hydroxysalts at later stages of precipitation. Once precipitated, the magnesium hydroxide is only slightly soluble and does not re-dissolve [
29]. Co-precipitation of magnesium and iron (III) hydroxides is known at pH as low as 3.5 [
24] and since ionic radiuses of magnesium (II) and iron (III) are similar (0.64 Å), it is more likely the mechanism of co-precipitation is inclusion, which represents the most efficient co-precipitation method that produces mixed crystals [
30]. It was recently proposed to use magnesium hydroxide in the mining industry for the removal of acidity and metals from drainage water [
31]. The latter paper illustrated an increased rate for oxidation of iron (II) to iron (III) and the precipitation of iron (III) hydroxide at a pH of around 5.5–6 on the addition of magnesium hydroxide to water. Equilibrium between soluble/insoluble phases of magnesium hydroxide, which supported oxidation and precipitation of iron, is directly relevant to the mechanism of formation of calcareous deposits on steel under cathodic protection.
Overall, the SEM and EDX results obtained from samples under all cathodic protection levels revealed that the deposits were composed of two layers (inner layer was magnesium-rich whilst the outer layer was calcium-rich) with a clear boundary and occasional pores running through the layers filled with a magnesium-rich compound providing sites for reduction—oxidation and associated mass transport. These results were in agreement with previous findings [
3,
5,
6,
15] and provided the basis for the design of equivalent circuits utilised during analysis and the modelling of impedance data.
3.2. Study of the Calcareous Deposit Formation by Electrochemical Impedance Spectroscopy
A double-layered structure of deposition, with a limited amount of “active” pores, is used for modelling our system. The electrochemical behaviour of mild steel under conditions of cathodic protection with on-going electrochemical anodic and cathodic processes is based partly on the models proposed by Deslouis [
10,
11] and Chung [
32].
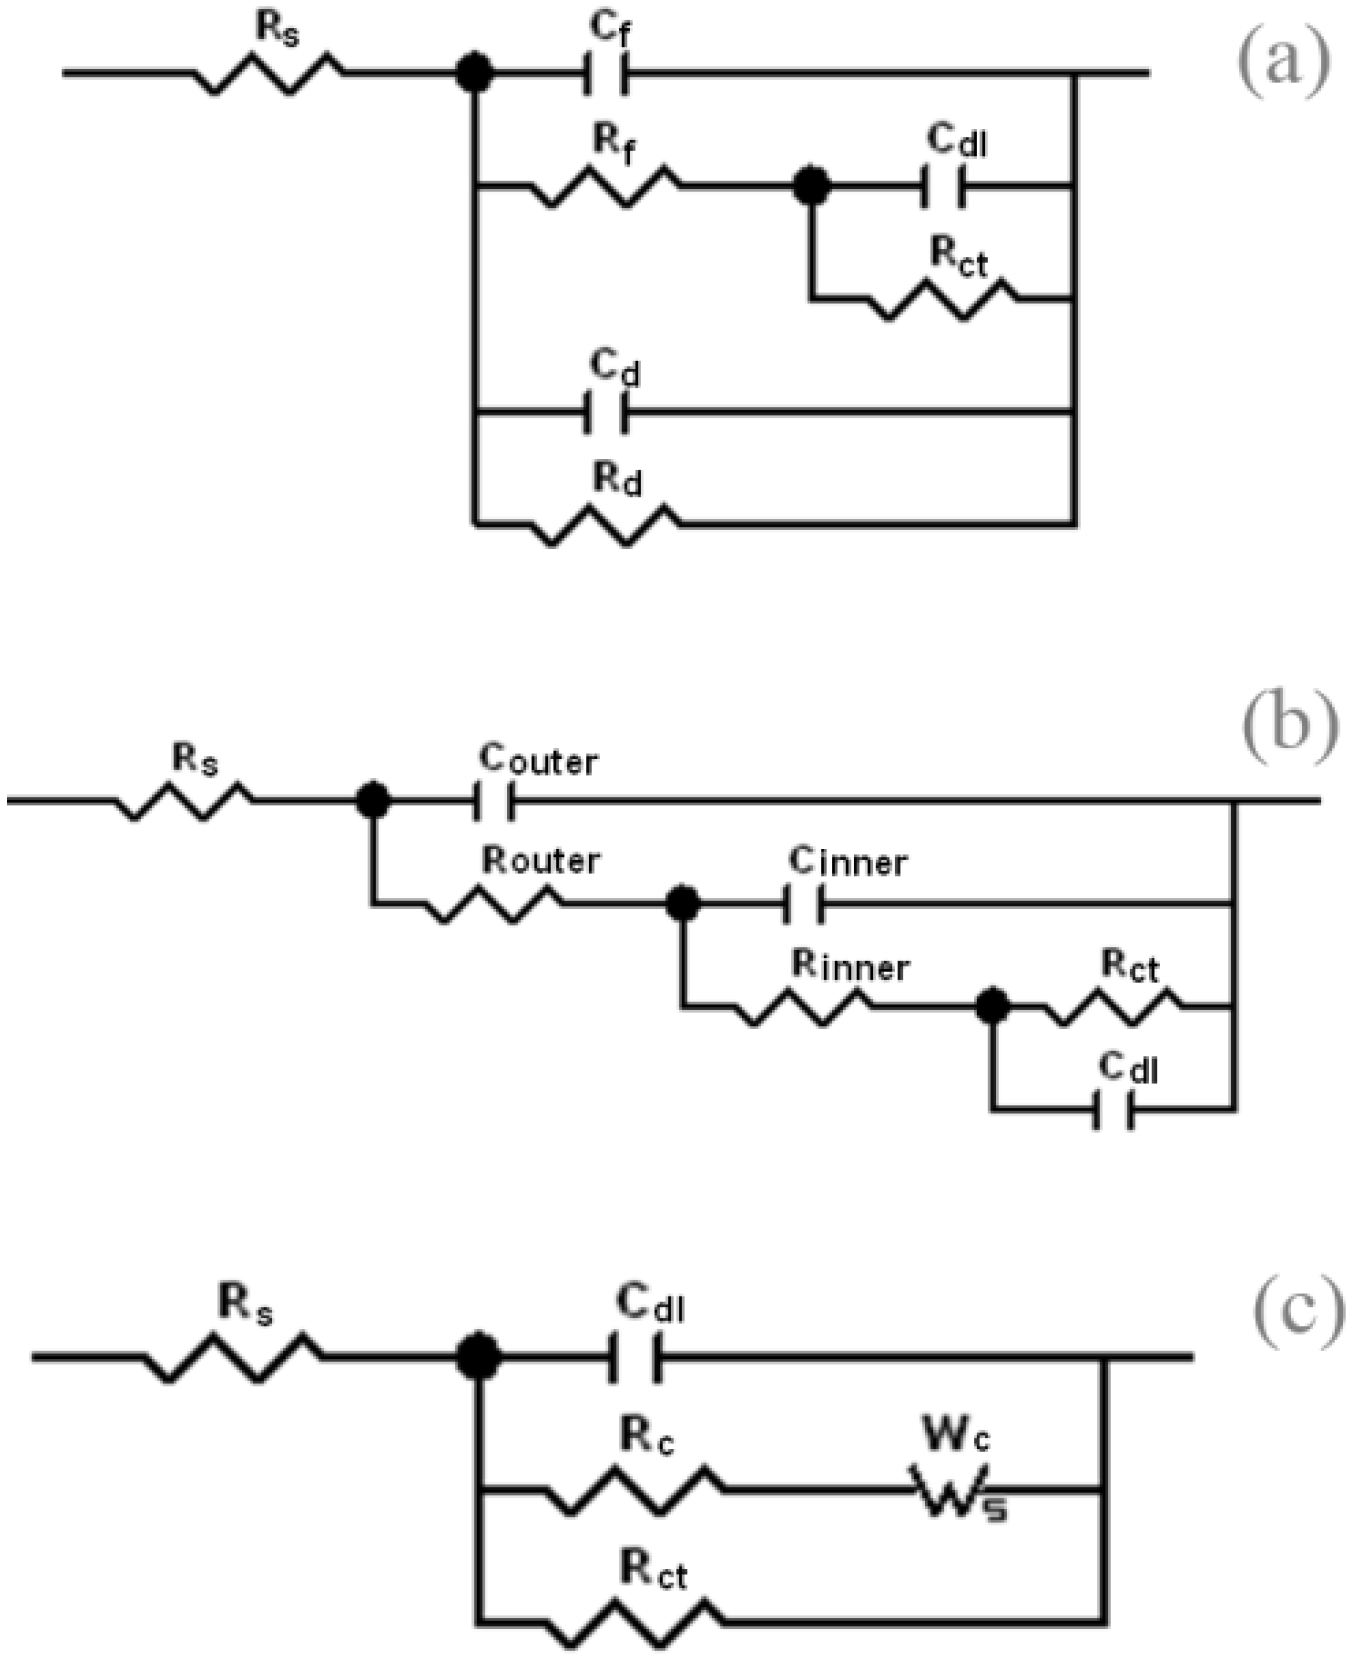
The Deslouis model had already been used for the interpretation of corrosion resistance of mild steel under cathodic protection in the presence of a calcareous deposition, which partially covered the surface (
Figure 3a). In this model the properties of the continuous film were represented by a parallel combination of film capacitance and resistance, C
f and R
f, respectively, together with a charge transfer resistance R
ct, and a double layer capacitor C
dl, and collectively these represented the corrosion processes proceeding at the metal interface. The aforementioned work also introduced an additional parallel combination of R
d and C
d to mimic the uncovered areas (pores) of the surface. However, this model did not take into consideration the formation of corrosion product within the film.
Figure 3.
Equivalent circuits of the models used previously: (
a) the equivalent circuit of original Deslouis’s model [
3]; (
b) the equivalent circuit of Chung’s model [
32]; (
c) the equivalent circuit of Barchiche and Deslouis’s model [
14].
The model introduced by Chung [
32] had been used for the description of the corrosion resistance of an anodic porous coating formed during spark anodising on zinc in NaCl solution. According to this model the coating film consisted of outer and inner layers where the pores of the inner layer were filled with corrosion products formed during metal dissolution at the interface (
Figure 3b). This model, or a modification of it, was considered as a possibility to explain our data.
The original Deslouis [
10] model did not consider the occurrence of cathodic electrochemical processes, which clearly should have a significant contribution to the impedance of cathodically protected steel. A second and subsequent model from Deslouis and co-workers [
14] showed that the corrosion filmed on mild steel under natural immersion conditions in NaCl solutions can be modelled by equivalent circuits with anodic and cathodic branches being in parallel with a double layer capacitor C
dl. The anodic branch was represented by the anodic charge transfer resistance R
ct, and the cathodic branch was under mixed control and comprised the resistance of the charge transfer reaction R
c, together with a diffusion limited Warburg impedance W
c (
Figure 3c).
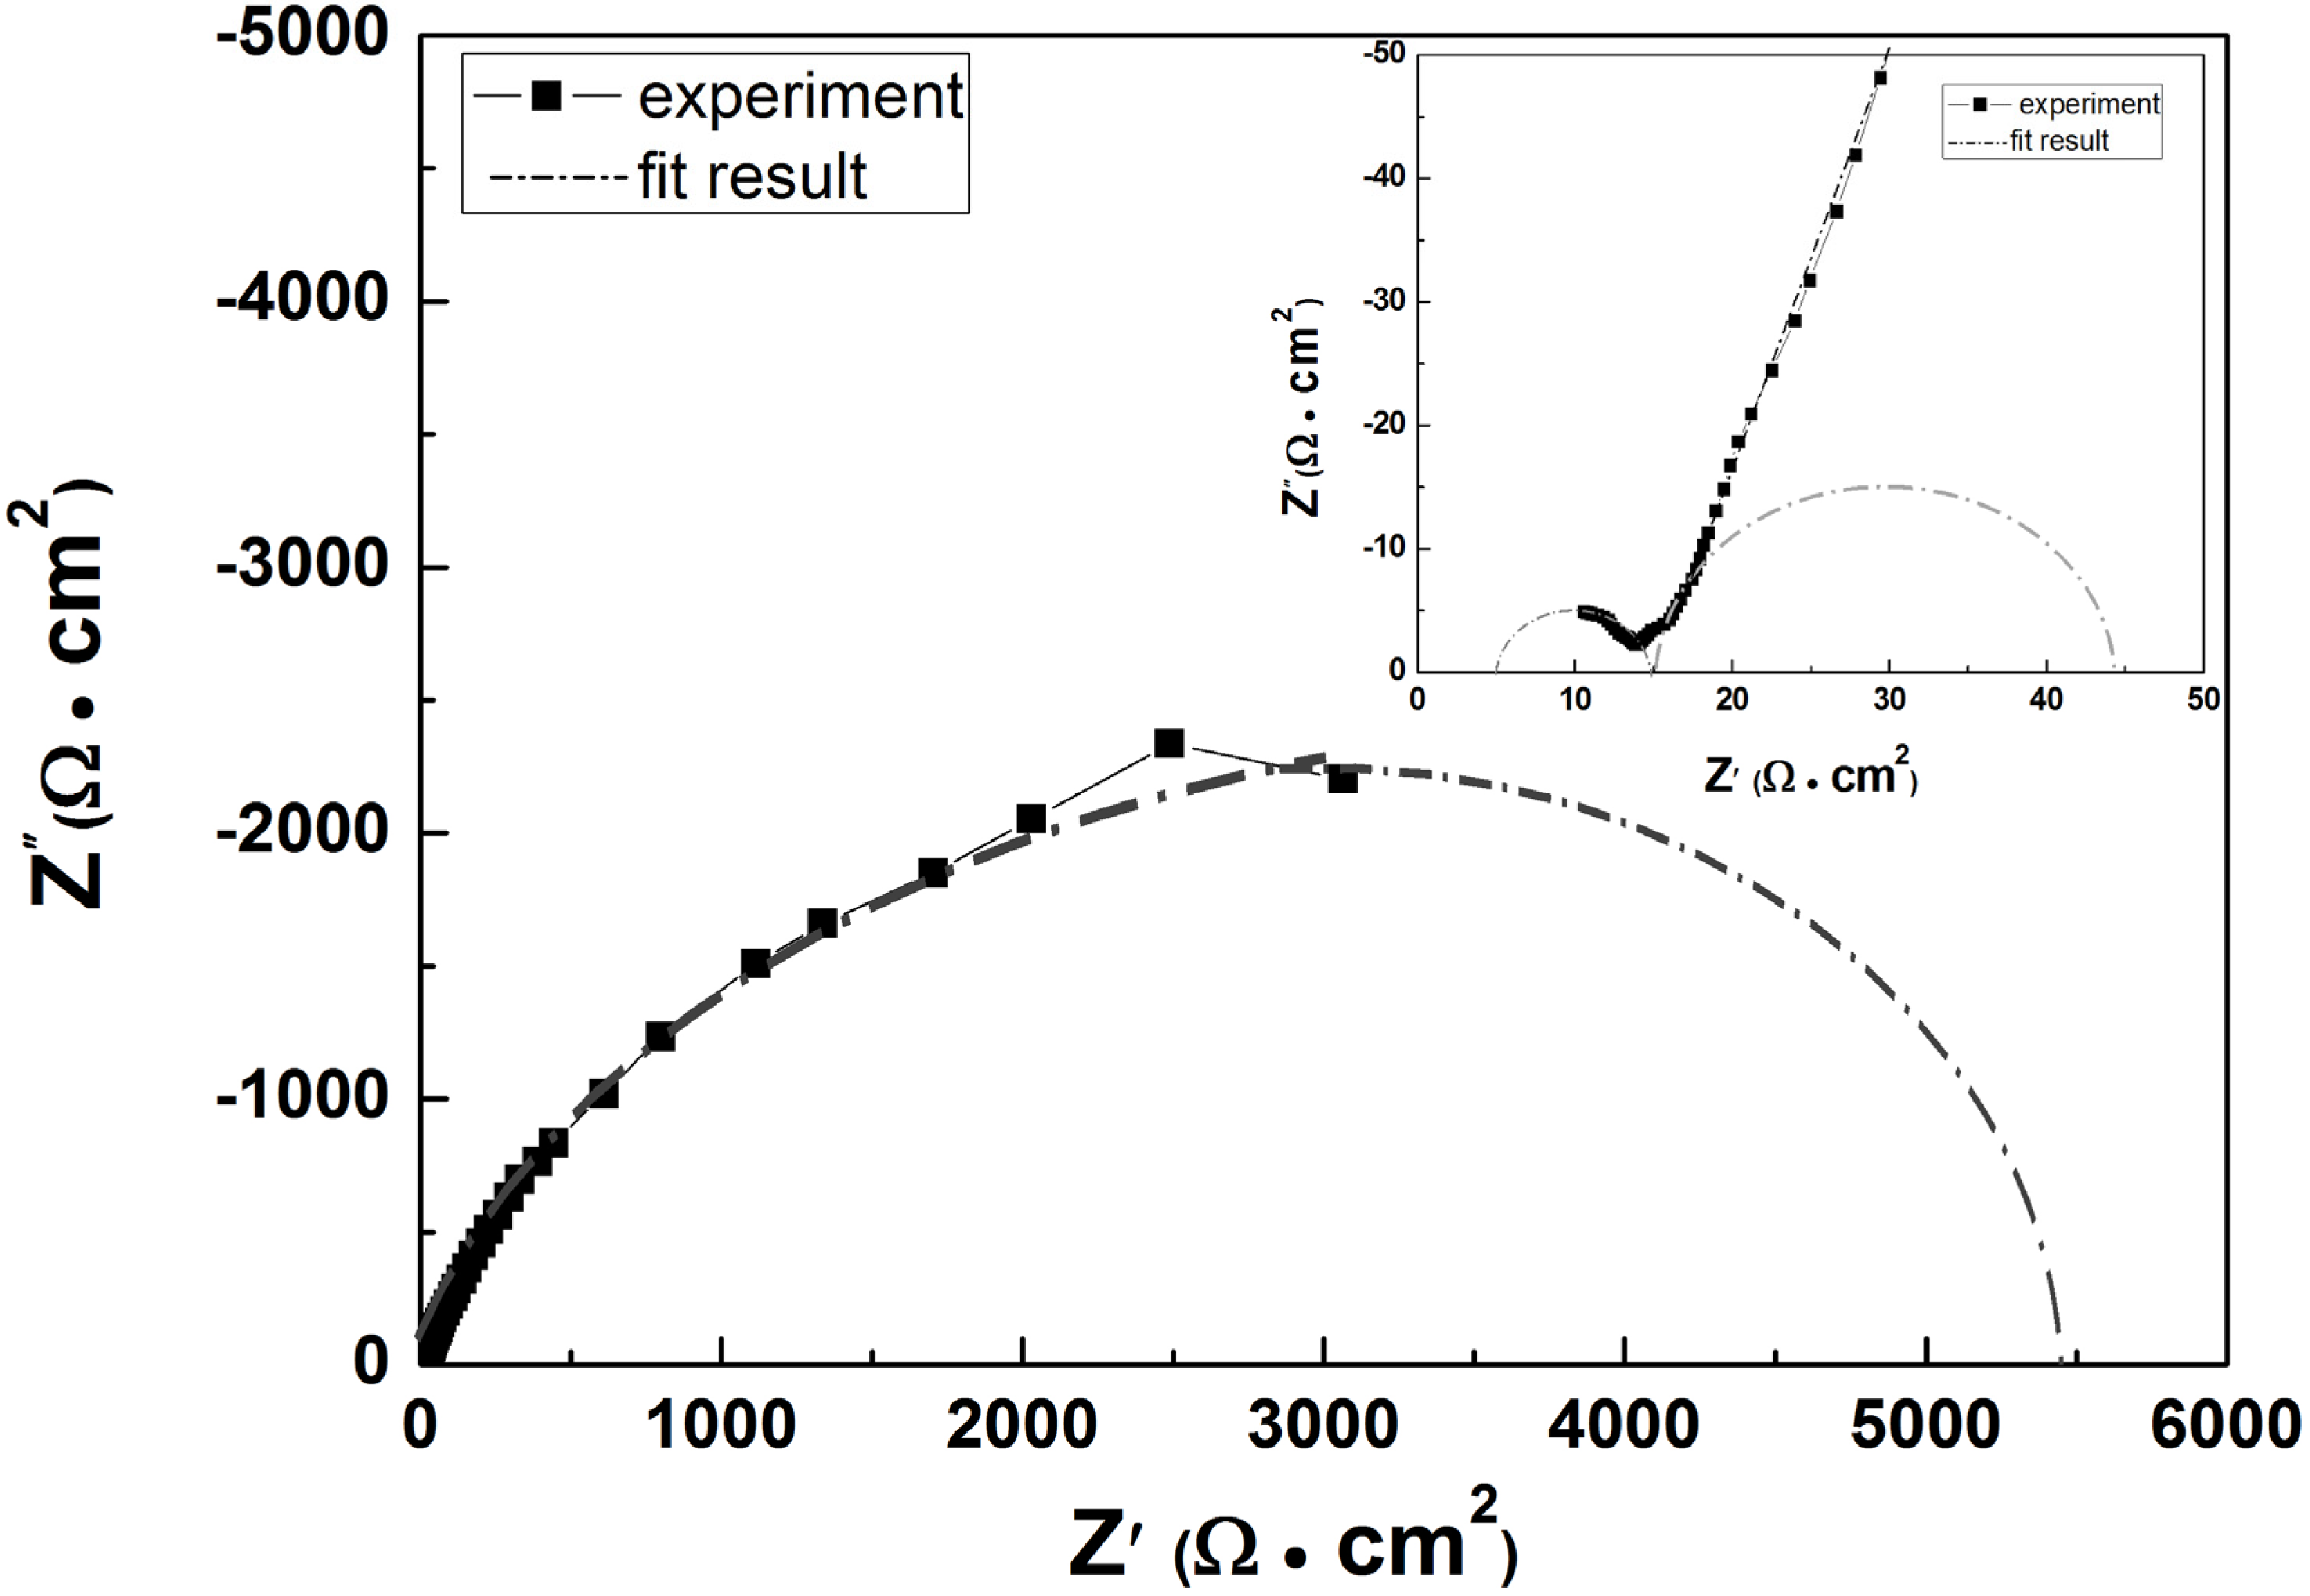
Analysis of our EIS data reveals that in most cases the impedance spectra consists of three semicircles with two semicircles of relatively small diameters probably associated with the properties of the calcareous film observed at higher frequencies, and one semicircle of large diameter associated with dissolution (corrosion of steel) followed by a straight line turning into a semicircle at lower frequencies.
Figure 4 gives a typical example for a Nyquist plot obtained for a sample using a current density of 150 mA·m
−2 over 72 h immersion in artificial seawater together with a modelling curve and a schematic diagram of the model proposed in
Figure 5. Schematic diagram is based on the total impedance of the system presented by equation:
when ω → 0 Z(ω) = R
s + R
outer + R
inner + (R
aW
C-R)/(R
a + W
C-R).
Figure 4.
The Nyquist plot obtained for a mild steel sample at 150 mA·m
−2 over 72 h immersion in artificial seawater and plotted together with modelling curve based on equivalent circuit of
Figure 5.
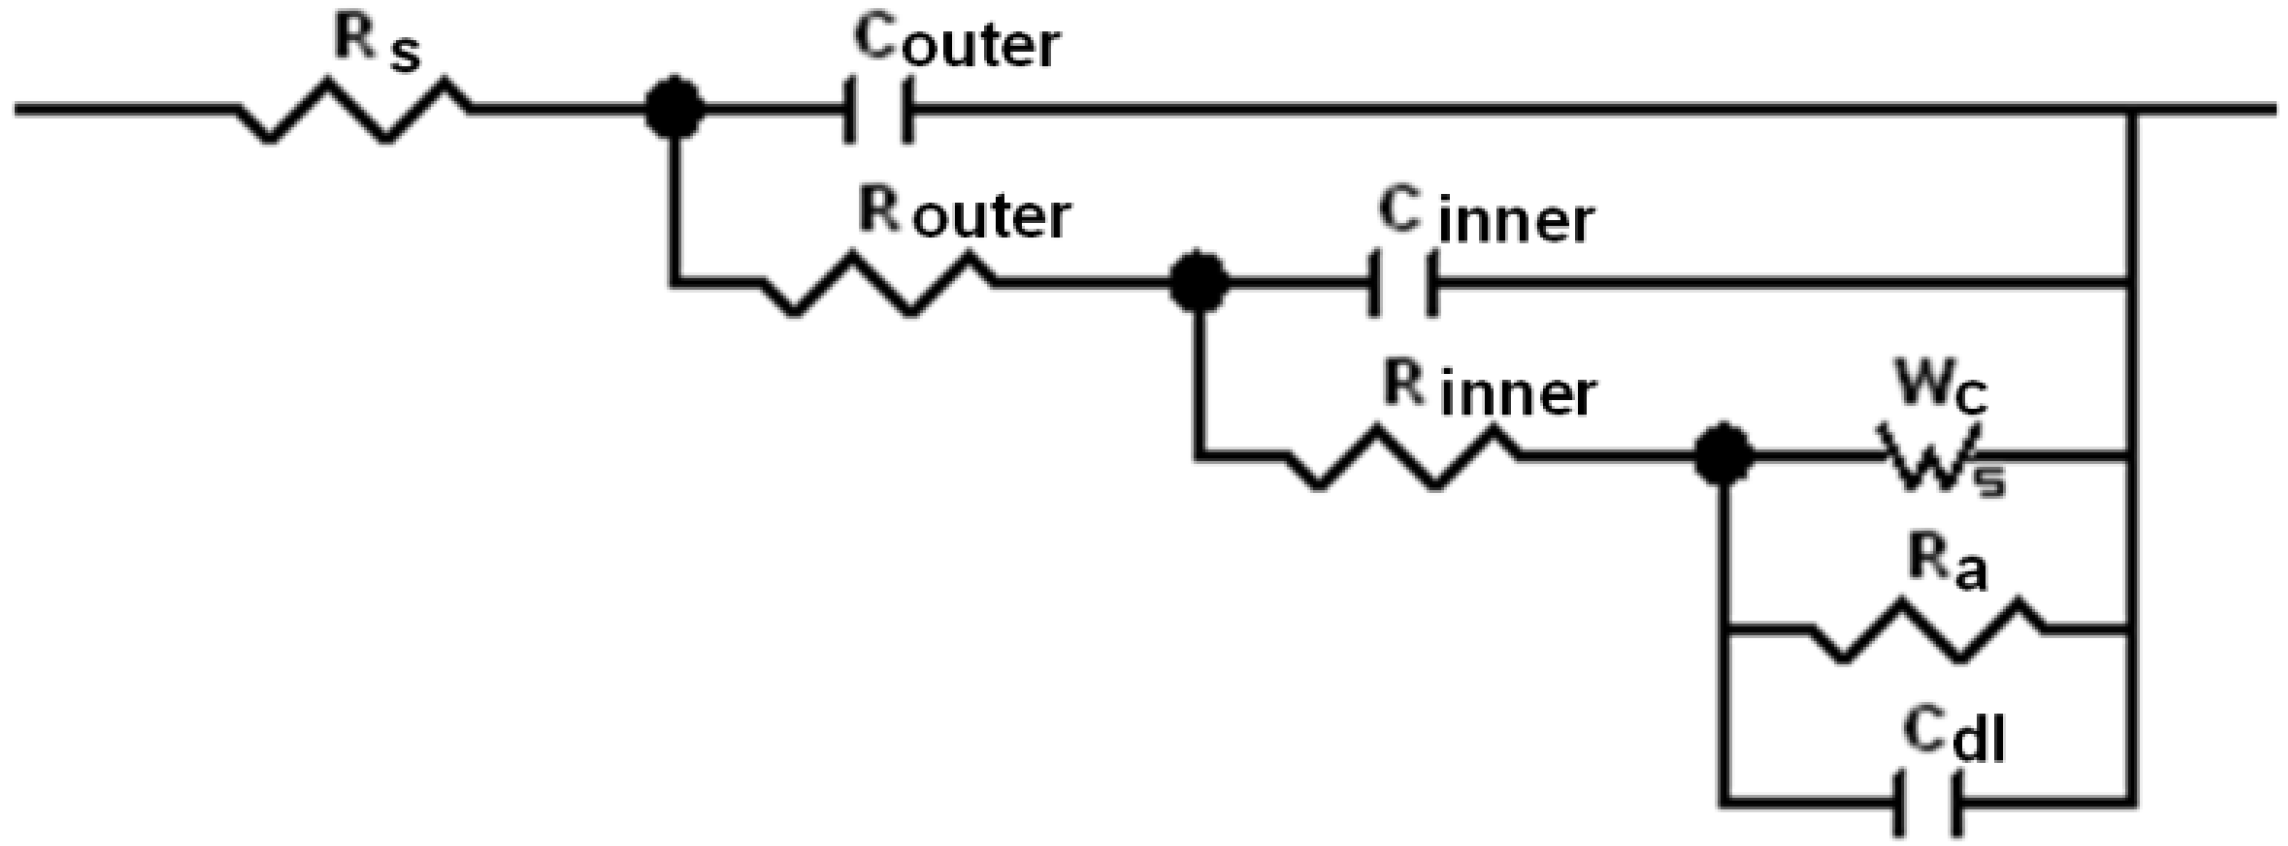
From
Figure 5, our model comprises a solution resistance R
s and a two layered deposit. The outer layer L
outer is a calcium rich layer; and the inner layer L
inner is a magnesium and iron rich layer. The outer layer L
outer is considered to be porous and is characterised by a parallel combination of a capacitor C
outer which is directly associated with the thickness of the calcium containing deposits, and a pore resistance R
outer which is defined by the resistance of all of the pores. The inner compact layer L
inner and the corroding steel are introduced into the equivalent circuit, which is in series with R
outer. The L
inner is also characterized by a parallel combination of a capacitor C
inner that determined by thickness of inner layer and a resistance R
inner, which determined the ionic path to the metal substrate. The R
inner is different from R
outer by the value of conductivity and the true area of conduction. The corroding interface is characterised by a parallel combination of a double layer capacitor C
dl, charge transfer anodic resistance R
a, and a finite-length impedance of diffusion W
c, which represents the cathodic process. To simplify our already complex equivalent circuit, the resistance of cathodic charge transfer reaction is considered small and the system is totally mass transport controlled unlike the model used by Bonnel (see
Figure 3c). The quality of our data fit (
Figure 4) clearly shows the validity of the model chosen and as an example the best fit result for equivalent circuit elements at 150 mA·m
−2 is presented in
Table 2.
Figure 5.
Equivalent circuit for mild steel in artificial seawater under cathodic protection, where Rs—resistance of the electrolyte; Couter—capacitor associated with calcium containing layer; Router—resistance associated with ionic conduction through the occasional pores; Cinner—capacitor associated with magnesium containing layer; Rinner—resistance associated with ionic conduction through this layer; Cdl—capacitor of double layer on metal/deposit interface; Ra—anodic charge transfer resistance; Wc—cathodic finite-length Warburg impedance.
Analysis of equivalent circuit elements for the applied current densities (as an example see
Table 2) indicates that the contribution of the inner and outer layer to the impedance of the system is less than 1% compared to the contribution of impedance associated with diffusion of cathodic active species through the layers and the impedance of anodic dissolution on the metal-deposit interface. Therefore the analysis of impedance data is focused on diffusion and anodic dissolution. The cathodic processes on the steel surface are described by the open finite-length Warburg impedance (open Warburg element) since diffusion of the electrochemically active species (oxygen) is thought to be a limiting stage of the cathodic process. The oxygen concentration near the metal interface is fixed and constant due to the slow diffusion of oxygen through the deposits of active pores. The open Warburg element is characterised by two parameters a W
C-R/Ω·cm
2·s
−0.5 and W
C-T/s
−0.5. The equation for open Warburg element is:
The open Warburg element on Nyquest plot will be a straight line with a 45° gradient at high frequencies (ω > 2/WC-T2) which will turn to a semicircle at very low frequencies, with ω approaching to 0. The WC-R parameter is the Warburg coefficient, which defines diffusion resistance and can be used to calculate a diffusion coefficient for the mobile species within the deposits. The WC-T parameter is a time constant which defines the time required for the species to diffuse through the deposits: WC-T = h × D−0.5, where h is the thickness of deposit and D is a diffusion coefficient of active species. The data, which has been extracted from our model, show an excellent fit with the open Warburg element.
Table 2.
Best fit results for equivalent circuit elements at applied current density of 150 mA·m−2.
| Immersion Time/h | 6 | 24 | 48 | 72 | 96 | 120 | 144 | 168 |
|---|
| Rs/Ω·cm2 | 12.3 | 13.6 | 12.1 | 9 | 10.5 | 9.8 | 10.8 | 11.8 |
| Couter/F·cm−2 | 2.1 × 10⁻⁶ | 1.1 × 10⁻⁶ | 0.6 × 10⁻⁶ | 2.4 × 10⁻⁶ | 3.4 × 10⁻⁶ | 2.6 × 10⁻⁶ | 3.2 × 10⁻⁶ | 1.3 × 10⁻⁶ |
| Router/Ω·cm2 | 7.4 | 10.7 | 14.6 | 6 | 5.4 | 6.8 | 6.3 | 9.8 |
| Cinner/F·cm−2 | 43 × 10−6 | 52 × 10−6 | 45 × 10−6 | 43 × 10−6 | 35 × 10−6 | 37 × 10−6 | 34 × 10−6 | 36 × 10−6 |
| Rinner/Ω·cm2 | 58 | 55 | 67 | 28 | 34 | 48 | 41 | 61 |
| WC-R/Ω·cm2 | 7400 | 7400 | 8900 | 7900 | 9000 | 10,000 | 8800 | 7800 |
| WC-T/s−0.5 | 2.8 | 4.4 | 4.6 | 3.6 | 4.3 | 5 | 5 | 3.5 |
| Ra/Ω·cm2 | 100,400 | 130,000 | 15,400 | 14,900 | 13,800 | 14,600 | 22,200 | 14,300 |
| Cdl/F·cm−2 | 26 × 10−6 | 37 × 10−6 | 28 × 10−6 | 32 × 10−6 | 24 × 10−6 | 25 × 10−6 | 25 × 10−6 | 23 × 10−6 |
The variation of cathodic parameters W
C-R and W
C-T over immersion time at different current densities is given in
Table 3 and
Table 4 and the variation of anodic charge transfer resistance, R
a is presented in
Table 5. Generally, the Warburg coefficient W
C-R increases with current density up to 200 mA·m
−2 followed by a significant reduction for current densities 300 mA·m
−2 and above. This behaviour coincides with reduction in W
C-T values (
Table 3 and
Table 4). The R
a increases with an increase in applied cathodic current density. The conditions (current density and immersion time) where anodic charge transfer resistances R
a are very high and above 100,000 Ω·cm
2 (highlighted in the grey in
Table 5), anodic iron dissolution is negligible or impossible. In the latter case the electrochemical potential of the system is below the redox potential of iron. The resistance, R
a of over 10,000 Ω·cm
2 has been arbitrarily chosen as a measure of full cathodic protection. It was confirmed that the anodic charge transfer resistance is clearly associated with iron dissolution, and closely follows weight loss experiments used in the calculation of corrosion rate [
17]; as the resistance increases so corrosion rate decreases.
Table 3.
Values of cathodic diffusion resistance WC-R/Ω·cm2·s−0.5 with immersion time at different applied current densities.
| Immersion Time/h | 6 | 24 | 48 | 72 | 96 | 120 | 144 | 168 |
|---|
| 50 mA·m−2 | 3000 | 5800 | 4800 | 4300 | 4300 | 3700 | 2100 | 3300 |
| 100 mA·m−2 | 3100 | 5200 | 6900 | 8100 | 6800 | 7300 | 7500 | 7900 |
| 150 mA·m−2 | 7400 | 7400 | 8900 | 7900 | 9000 | 10,000 | 8800 | 7800 |
| 200 mA·m−2 | 6900 | 10,600 | 8800 | 7300 | 8700 | 11,100 | 10,000 | 9000 |
| 300 mA·m−2 | 4100 | 4000 | 3300 | 2400 | 2600 | 2200 | 2000 | 1800 |
| 400 mA·m−2 | 3100 | 2000 | 2500 | 1400 | 1100 | 1400 | 1000 | 1000 |
Table 4.
Values of WC-T/s−0.5 with immersion time at different applied current densities.
| Immersion Time/h | 6 | 24 | 48 | 72 | 96 | 120 | 144 | 168 | Average WC-T between 24 and 168 h |
|---|
| 50 mA·m−2 | 1 | 3 | 3.3 | 3.2 | 3.6 | 3.3 | 4 | 3.2 | 3.4 |
| 100 mA·m−2 | 3.3 | 1.7 | 3.3 | 2.8 | 2.3 | 3 | 3.7 | 2.2 | 2.7 |
| 150 mA·m−2 | 2.8 | 4.4 | 4.6 | 3.6 | 4.3 | 5 | 5 | 3.5 | 4.3 |
| 200 mA·m−2 | 2.1 | 7 | 4.3 | 3.7 | 3.6 | 5.8 | 7.3 | 8.6 | 6.2 |
| 300 mA·m−2 | 1.4 | 2.2 | 1.4 | 0.6 | 1.1 | 0.7 | 0.8 | 0.8 | 1.1 |
| 400 mA·m−2 | 2.2 | 1.7 | 1.4 | 0.6 | 0.6 | 0.8 | 0.6 | 0.6 | 0.9 |
Table 5.
Values of anodic charge transfer resistance Ra/Ω·cm2 with immersion time at different applied current densities.
| Immersion Time/h | 6 | 24 | 48 | 72 | 96 | 120 | 144 | 168 |
|---|
| 50 mA·m−2 | 3100 | 4000 | 3500 | 3100 | 5700 | 3100 | 2400 | 2600 |
| 100 mA·m−2 | 58,700 | 20,000 | 8000 | 9600 | 6600 | 8800 | 10,000 | 20,000 |
| 150 mA·m−2 | 100,400 | 130,000 | 15,400 | 14,900 | 13,800 | 14,600 | 22,200 | 14,300 |
| 200 mA·m−2 | 1.15 × 10¹⁵ | 2.8 × 10¹⁰ | 34,600 | 10,300 | 23,800 | 12,000 | 25,000 | 30,000 |
| 300 mA·m−2 | 1 × 10²⁰ | 1 × 10²⁰ | 1 × 10²⁰ | 1 × 10²⁰ | 1 × 10²⁰ | 1 × 10²⁰ | 1 × 10²⁰ | 1 × 10²⁰ |
| 400 mA·m−2 | 1 × 10²⁰ | 1 × 10²⁰ | 1 × 10²⁰ | 1 × 10²⁰ | 1 × 10²⁰ | 1 × 10²⁰ | 1 × 10²⁰ | 1 × 10²⁰ |
For under-protected steel with an applied current density of 50 mA·m
−2, oxygen diffusion, oxygen reduction and iron dissolution proceed simultaneously. The values of R
a are fairly low, being between 2400–5700 Ω·cm
2, the values of W
C-R are in the range of 2100–5800 Ω·cm
2·s
−0.5 and W
C-T are between 1 and 4 s
−0.5, which is relatively high (
Table 3,
Table 4 and
Table 5). High values of W
C-T indicate that the oxygen reduction process needs to be considered in modelling at low current densities when the system is probably under mixed activation/diffusion control.
Increasing the current density to 100 mA·m
−2 results in slow steady increase in W
C-R from 3100 to 8100 Ω·cm
2·s
−0.5 during first 72 h immersion, then W
C-R reduce to 6800 Ω·cm
2·s
−0.5 after a further 24 h immersion (total 96 h), before increasing again to almost 8000 Ω·cm
2·s
−0.5 after 168 h immersion. The pattern of increasing Warburg coefficient followed by sudden decrease and subsequent increase is most likely explained by the slow thickening of deposited layers during first 72 h followed by sudden detachment of local regions of calcareous film at 96 h with further re-growth in the remaining 168 h. Detachment is possible due to the slow formation of the deposit under a relatively low current density. The thickness of layers is 12 μm and was calculated from average W
C-T of 2.7 s
−0.5 and the diffusion path of the active specie (oxygen), with the diffusion coefficient of oxygen D = 2.25 × 10
−5cm·s
−1 [
33]. Interestingly, the R
a varied between 6600 and 58,700 Ω·cm
2, where the lowest value of 6600 Ω·cm
2 is observed after 96 h of immersion, indicating an increased rate of corrosion. This further confirms possible detachment of the protected film at that point.
The impedance data for the two intermediate current densities of 150 and 200 mA·m
−2 show excellent corrosion resistance with R
a being above 10,300 Ω·cm
2 for the entire immersion time. The weight loss results clearly show that the metal dissolution is negligible at these current densities. Initially, after 6 h of immersion, the W
C-R values is 7400 and 6900 Ω·cm
2·s
−0.5, respectively, compared to 3100 Ω·cm
2·s
−0.5 observed at 100 mA·m
−2. This indicates a relatively fast film formation under such conditions. The film continues to grow over time achieving the maximum value of 11,000 Ω·cm
2·s
−0.5. The average diffusion paths of oxygen calculated from the average W
C-T values for 150 mA·m
−2 and 200 mA·m
−2 are 20 μm and 29 μm, respectively. The calculation with use of W
C-T values (5 s
−0.5 and 8.6 s
−0.5) close to the end of immersion time (144 h and 168 h) results in oxygen diffusion paths of 24 μm and 41 μm, respectively, which are very close to the thickness of deposits measured directly from SEM cross-section (
Figure 2b,c).
For the steel under cathodic protection of 300 and 400 mA·m−2, the values of anodic resistance Ra tend to infinity, indicating that the anodic dissolutions of iron has ceased. This conclusion is in agreement with values of cell potential of −1050 mV (SCE) at 300 mA·m−2 and −1100 mV (SCE) at 400 mA·m−2, respectively, those potentials being significantly below the redox potential of iron. The WC-R values are reduced and are in range of 1000 and 4100 Ω·cm2·s−0.5. The oxygen diffusion paths, calculated from the average WC-T values for 300 mA·m−2 and 400 mA·m−2, are 0.5 μm and 0.4 μm, respectively. The significantly reduced cathodic parameters are a result of neglecting the commencement of hydrogen evolution in the impedance model where an additional resistance assigned to activation controlled water reduction should be introduced parallel to the Warburg impedance.
The modelling of impedance data used in this work allows successful calculation of corrosion resistance of the steel for wide range of cathodic protection levels covering under-protected, fully protected and over-protected conditions. Additionally the thickness of the deposited layers is calculated reliably for steel under fully protected conditions of cathodic protection.


