Article

Research on the Vector Coherent Factor Threshold Total Focusing Imaging Method for Austenitic Stainless Steel Based on Material Characteristics

by
Tianwei Zhao
1,2,
Ziyu Liu
3,
Donghui Zhang
2,
Junlong Wang
2 and
Guowen Peng
1,*
1
School of Resources, Environment and Safety Engineering, University of South China, Hengyang 421001, China
2
China Nuclear Industry 23 Construction Co., Ltd., Beijing 101300, China
3
NDT&E Laboratory, Dalian University of Technology, Dalian 116024, China
*
Author to whom correspondence should be addressed.
Metals 2025, 15(8), 901; https://doi.org/10.3390/met15080901
Submission received: 30 June 2025 / Revised: 9 August 2025 / Accepted: 10 August 2025 / Published: 12 August 2025
(This article belongs to the Special Issue Non-Destructive Testing of Metallic Materials)

Abstract

The degree of anisotropy and heterogeneity in coarse-grained materials significantly affects ultrasonic propagation behavior and scattering. This paper proposes a vector coherent factor threshold total focusing imaging method (VCF-T-TFM) for austenitic stainless steel, based on material properties, through a combination of simulation and experimentation. Three types of austenitic stainless steel weld test blocks with varying degrees of heterogeneity were selected containing multiple side-drilled hole defects, each with a diameter of 2 mm. Full-matrix data were collected using a 32-element phased array probe with a center frequency of 5 MHz. The grain size and orientation of the material were quantitatively observed via electron backscatter diffraction (EBSD). By combining the instantaneous phase distribution of the TFM image, the coarse-grained material coherence compensation value (CA) and probability threshold (PT) were optimized for different heterogeneous regions, and the vector coherence imaging threshold (γ) was adjusted. The defect imaging results of homogeneous material (carbon steel) and three austenitic stainless steels with different levels of heterogeneity were compared, and the influence of coarse-grained, anisotropic heterogeneous structures on the imaging signal-to-noise ratio was analyzed. The results show that the VCF-T-TFM, which considers the influence of material properties on phase coherence, can suppress structural noise. Compared to compensation results that did not account for material properties, the signal-to-noise ratio was improved by 97.3%.

1. Introduction

Coarse-grained metallic materials, such as austenitic stainless steel, exhibit heterogeneity and acoustic anisotropy [1,2]. As ultrasonic waves propagate through these materials, they undergo significant attenuation and complex scattering phenomena [3,4], which manifest as prominent background noise in ultrasonic images, thereby affecting defect recognition and quantification [5,6,7]. Enhancing the signal-to-noise ratio (SNR) in ultrasonic imaging of coarse-grained materials remains one of the key challenges in the field of nondestructive testing [8,9].
Phase coherence imaging (PCI) [10] introduces signal phase information to construct the phase coherence weight coefficient and reconstructs the total focusing method (TFM) image, which reduces signal amplitude in non-defect areas, thereby suppressing background noise [11,12]. Among these, the vector coherence factor (VCF) [13] combines the continuous value of the circular coherence factor with the low computational complexity of the sign coherence factor, offering distinct advantages in improving the detection SNR and suppressing structural artifacts [14]. Huang et al. [15] combined the VCF with the total-focus method, increasing the SNR of cracks at a depth of 90 mm in an M18 bolt by approximately 2–3 dB. Guan et al. [16] introduced the VCF and sound field threshold segmentation into TFM imaging of an aeroengine TC2 ring forging surface, resulting in a 7 dB increase in the detection SNR for a Φ 0.8 mm side hole. Several researchers have explored the optimal setting of the vector coherence imaging threshold (γ) to suppress noise and improve the effectiveness of the VCF imaging method. Prado et al. [17] employed the Chebyshev inequality to determine the VCF threshold. By retaining the reflector amplitude and extracting a binary image, they were able to obtain the contours of four-hole defects with varying diameters. However, the segmentation resulted in edge deformation and loss of image details. Lesage et al. [14] used Shannon’s information theory to assess the distribution of VCF values and performed VCF threshold imaging on a bottom notch of 1.43 mm in length in a 304 stainless steel test block with a thickness of 9.52 mm. The amplitude difference between the defect and the bottom surface increased to 5.97 dB, though significant noise remained in the background of the image. The coarse-grained structure of the material causes ultrasonic scattering, which alters the VCF distribution, and this distribution changes with varying degrees of heterogeneity in scattering. Previous studies have assumed homogeneity in materials when optimizing the VCF threshold, neglecting the impact of complex structures on phase coherence. For materials with coarse-grained structures (e.g., austenitic stainless steels), scattering signals generated by coarse grains exhibit a certain level of phase coherence [18,19]. Direct application of PCI proves ineffective for filtering structural noise, significantly impeding defect identification. Current studies pertaining to phase coherence characterization and structural noise suppression techniques remain limited. To address this challenge, establishing foundational analysis correlating phase coherence with material microstructure is imperative [20]. By quantitatively associating coherence variations with grain characteristics (size, orientation), targeted optimization of PCI’s noise suppression capability becomes feasible. This material-centric approach enhances PCI’s SNR improvement efficacy and achieves superior defect detectability in complex microstructures.
Using austenitic stainless-steel welds as an example, this study, based on material acoustic characteristics and microstructure analysis, integrates the phase distribution of ultrasonic signals in different heterogeneous regions. The coarse-grained material coherence compensation value (CA) is selected, and the phase coherence factor threshold is optimized using the conditional probability distribution function of phase coherence to suppress the structural noise induced by the coarse-grained microstructure. The phase coherence weighting coefficient is then calculated, and the defect images are reconstructed. A high SNR imaging method based on vector coherent factor threshold total focusing imaging method (VCF-T-TFM) is proposed. The impact of tissue heterogeneity on the signal-to-noise ratio of the VCF-T-TFM is analyzed through a combination of experiments and simulations, and the effectiveness of the proposed method is validated. The VCF-T-TFM achieves effective structural noise suppression and significantly enhances the SNR by dynamically optimizing coherent compensation parameters through quantitative characterization of material microstructure (grain size, orientation) fused with TFM phase information.

2. Test Principle

2.1. Total Focusing Method

The basis of total focusing imaging is full-matrix capture (FMC), in which each array element is sequentially excited to emit ultrasonic pulses, and all array elements subsequently receive the echo signals. When the number of array elements is Ne, Ne2 time-domain signals, or full-matrix data, are obtained.
TFM imaging is generated through off-line processing of full-matrix data. The principle is illustrated in Figure 1. The imaging area is meshed, and a two-dimensional Cartesian coordinate system is established. The x-axis is parallel to the array arrangement direction, while the z-axis is perpendicular to the surface of the sample being measured. Suppose there are Ne elements in total. For any focal point P(xp, zp) within the imaging area, the delay law is computed based on the sound path from each element to point P, and superposition processing is performed. The total cumulative response amplitude of all signals passing through point P is given by [21,22]:
I TFM x p , z p = H i = 1 N e j = 1 N e S i j t i j x p , z p ,
where H is the Hilbert transform; Sij(t) represents the emission from array element i and the amplitude information received by array element j at the focal point P in the ultrasonic echo signal; and tij(xp, zp) is the time taken for the ultrasonic wave to pass through the point:
t i j x p , z p = x i x p 2 + z p 2 + x j x p 2 + z p 2 c L ,
where cL is the longitudinal wave velocity of the test block.
Similarly, the TFM image of the region can be obtained by calculating the total response amplitude at other focal points.

2.2. VCF Threshold Imaging

The phase coherence method quantifies the phase dispersion of the delayed signal. It integrates the phase coherence factor with TFM imaging and incorporates the phase information of the signal. This method can mitigate noise caused by phase dispersion and enhance the SNR of the image. Among these, the vector coherence factor (VCF) defines a set of unit vectors in the complex plane using the instantaneous phase. The magnitude of the vector sum can be used to assess phase consistency. When all phases are identical, meaning the signal phases are fully coherent, the magnitude of the vector sum approaches 1. Conversely, if the phases are uniformly distributed on the unit circle, the magnitude tends to reach 0. The calculation process of the VCF is outlined below [23].
First, define the complex analysis of the delay signal, which can be expressed as follows:
S i j x , z = S e i ϕ i j ,
Considering both the in-phase and quadrature components of the instantaneous phase of the signal, the VCF of an imaging point (x, z) in the imaging space can be defined as follows:
VCF x , z = i = 1 N e j = 1 N e R e S i j x , z S i j x , z 2 + i = 1 N e j = 1 N e I m S i j x , z S i j x , z 2 m ,
where Re is the real part; Im is the imaginary part; Ne is the number of array elements; and m is the modulation factor of side-lobe sensitivity, which is generally taken as 0.5, corresponding to L2 norm.
The VCF considers the magnitude of the sum of the vector sine and cosine of each signal’s instantaneous phase, which exhibits statistical characteristics. At any imaging point, the value of the VCF is jointly determined by the phase coherence number NC and the phase incoherence number NI. Considering the structure of FMC data, the following relationship holds:
N C + N I = N e 2 ,
Based on the statistical characteristics of the VCF, studies have shown that when all phases at a point in the imaging space are uniformly distributed between [−π, π], i.e., when the phases are completely incoherent, there is no scatterer response at that position. The probability distribution function in this case simplifies to a Rayleigh distribution, which is a special case of the Rician distribution [24]:
P VCF | σ = 2 VCF N e 2 e VCF N e 2 ,
where the value of the scale factor σ is N e 2 / 2 . The cumulative distribution function can be expressed as follows:
P VCF Z | σ = 1 e VCF 2 N e 2 ,
Austenitic stainless-steel welds contain a coarse-grained structure, which introduces structural noise characterized by weak scatterers and low coherence. This leads to an increase in the VCF value at certain imaging points, causing a change in the cumulative distribution function:
P VCF Z | σ = 1 e VCF 2 N e 2 ,
where CA is the coherent compensation value of coarse-grained material, which is related to the grain size of the material.
According to Equation (8), the imaging threshold γ is expressed by the following equation:
γ = N e ln 1 1 P T C A N e ,
where PT is the selected probability threshold.
The threshold-processed VCF is denoted as the T-VCF, and the T-VCF is used as the weighting coefficient, which is multiplied by the TFM image amplitude to obtain the corresponding phase-coherent image, referred to as the VCF-T-TFM:
I VCF T TFM x , z = T - VCF x , z × I TFM x , z ,

3. Result Analysis and Discussion

3.1. Test Blocks and Experiments

Based on ultrasonic attenuation, three austenitic stainless steel weld test blocks commonly used in nuclear engineering construction were selected for testing. These blocks exhibit varying degrees of heterogeneity and are designated as 1# ‘weak’, 2# ‘medium’, and 3# ‘strong’ test blocks, with their material properties detailed in Table 1. Each of the three test blocks contains several Φ2 side-drilled-hole defects, and some of the test blocks and defect images are shown in Figure 2. The ultrasonic experiment was conducted using a robust 128-channel phased array board. A 32-element linear array probe with a center frequency of 5 MHz was used, with a center-to-center distance of 0.5 mm between the elements. The detection method employed was the reflection method. Full-matrix data from the defects were collected using the contact method.
To obtain the acoustic characteristics of different heterogeneous austenitic stainless steels, the acoustic parameters, such as sound velocity and attenuation coefficient, of three austenitic stainless-steel weld test blocks were measured. The calculation formula for the longitudinal wave velocity of the material is given by [25]:
c L = A k n l t l v k / A l n k t k ,
where Ak is the distance from the baseline to the first through nth reflected echo along the A-scan display of the known sound velocity test block, in meters; nl is the number of complete paths in the tested material; tl is the thickness of the tested material, in meters; vk is the sound velocity in the test block with known sound velocity, in m/s; Al is the distance from the baseline to the first through nth reflected echo along the A-scan display of the tested material, in meters; nk is the number of complete paths in the test block; tk is the thickness of the test block with known sound velocity, in meters. The formula for calculating the ultrasonic attenuation coefficient of the material is given by [26]:
α = 20 lg A m / A n δ 2 n m t l ,
where α is the sound attenuation value, in dB/mm; Am and An are the amplitude values of the m-th and n-th bottom echoes, respectively (with n > m); δ is the reflection loss of the bottom surface. Generally, the reflection loss per unit time is approximately 0.5 dB. Based on the above formula, the measured acoustic parameter results are shown in Table 2.
It can be observed from the results that, compared with the test block (1#) and test block (2#), the sound velocity fluctuation of the test block (3#) is significantly greater, and the attenuation coefficients of the three test blocks increase in sequence, indicating that the more complex the microstructure, the greater the impact on ultrasonic signal propagation. This requires further comparison through microstructure analysis.
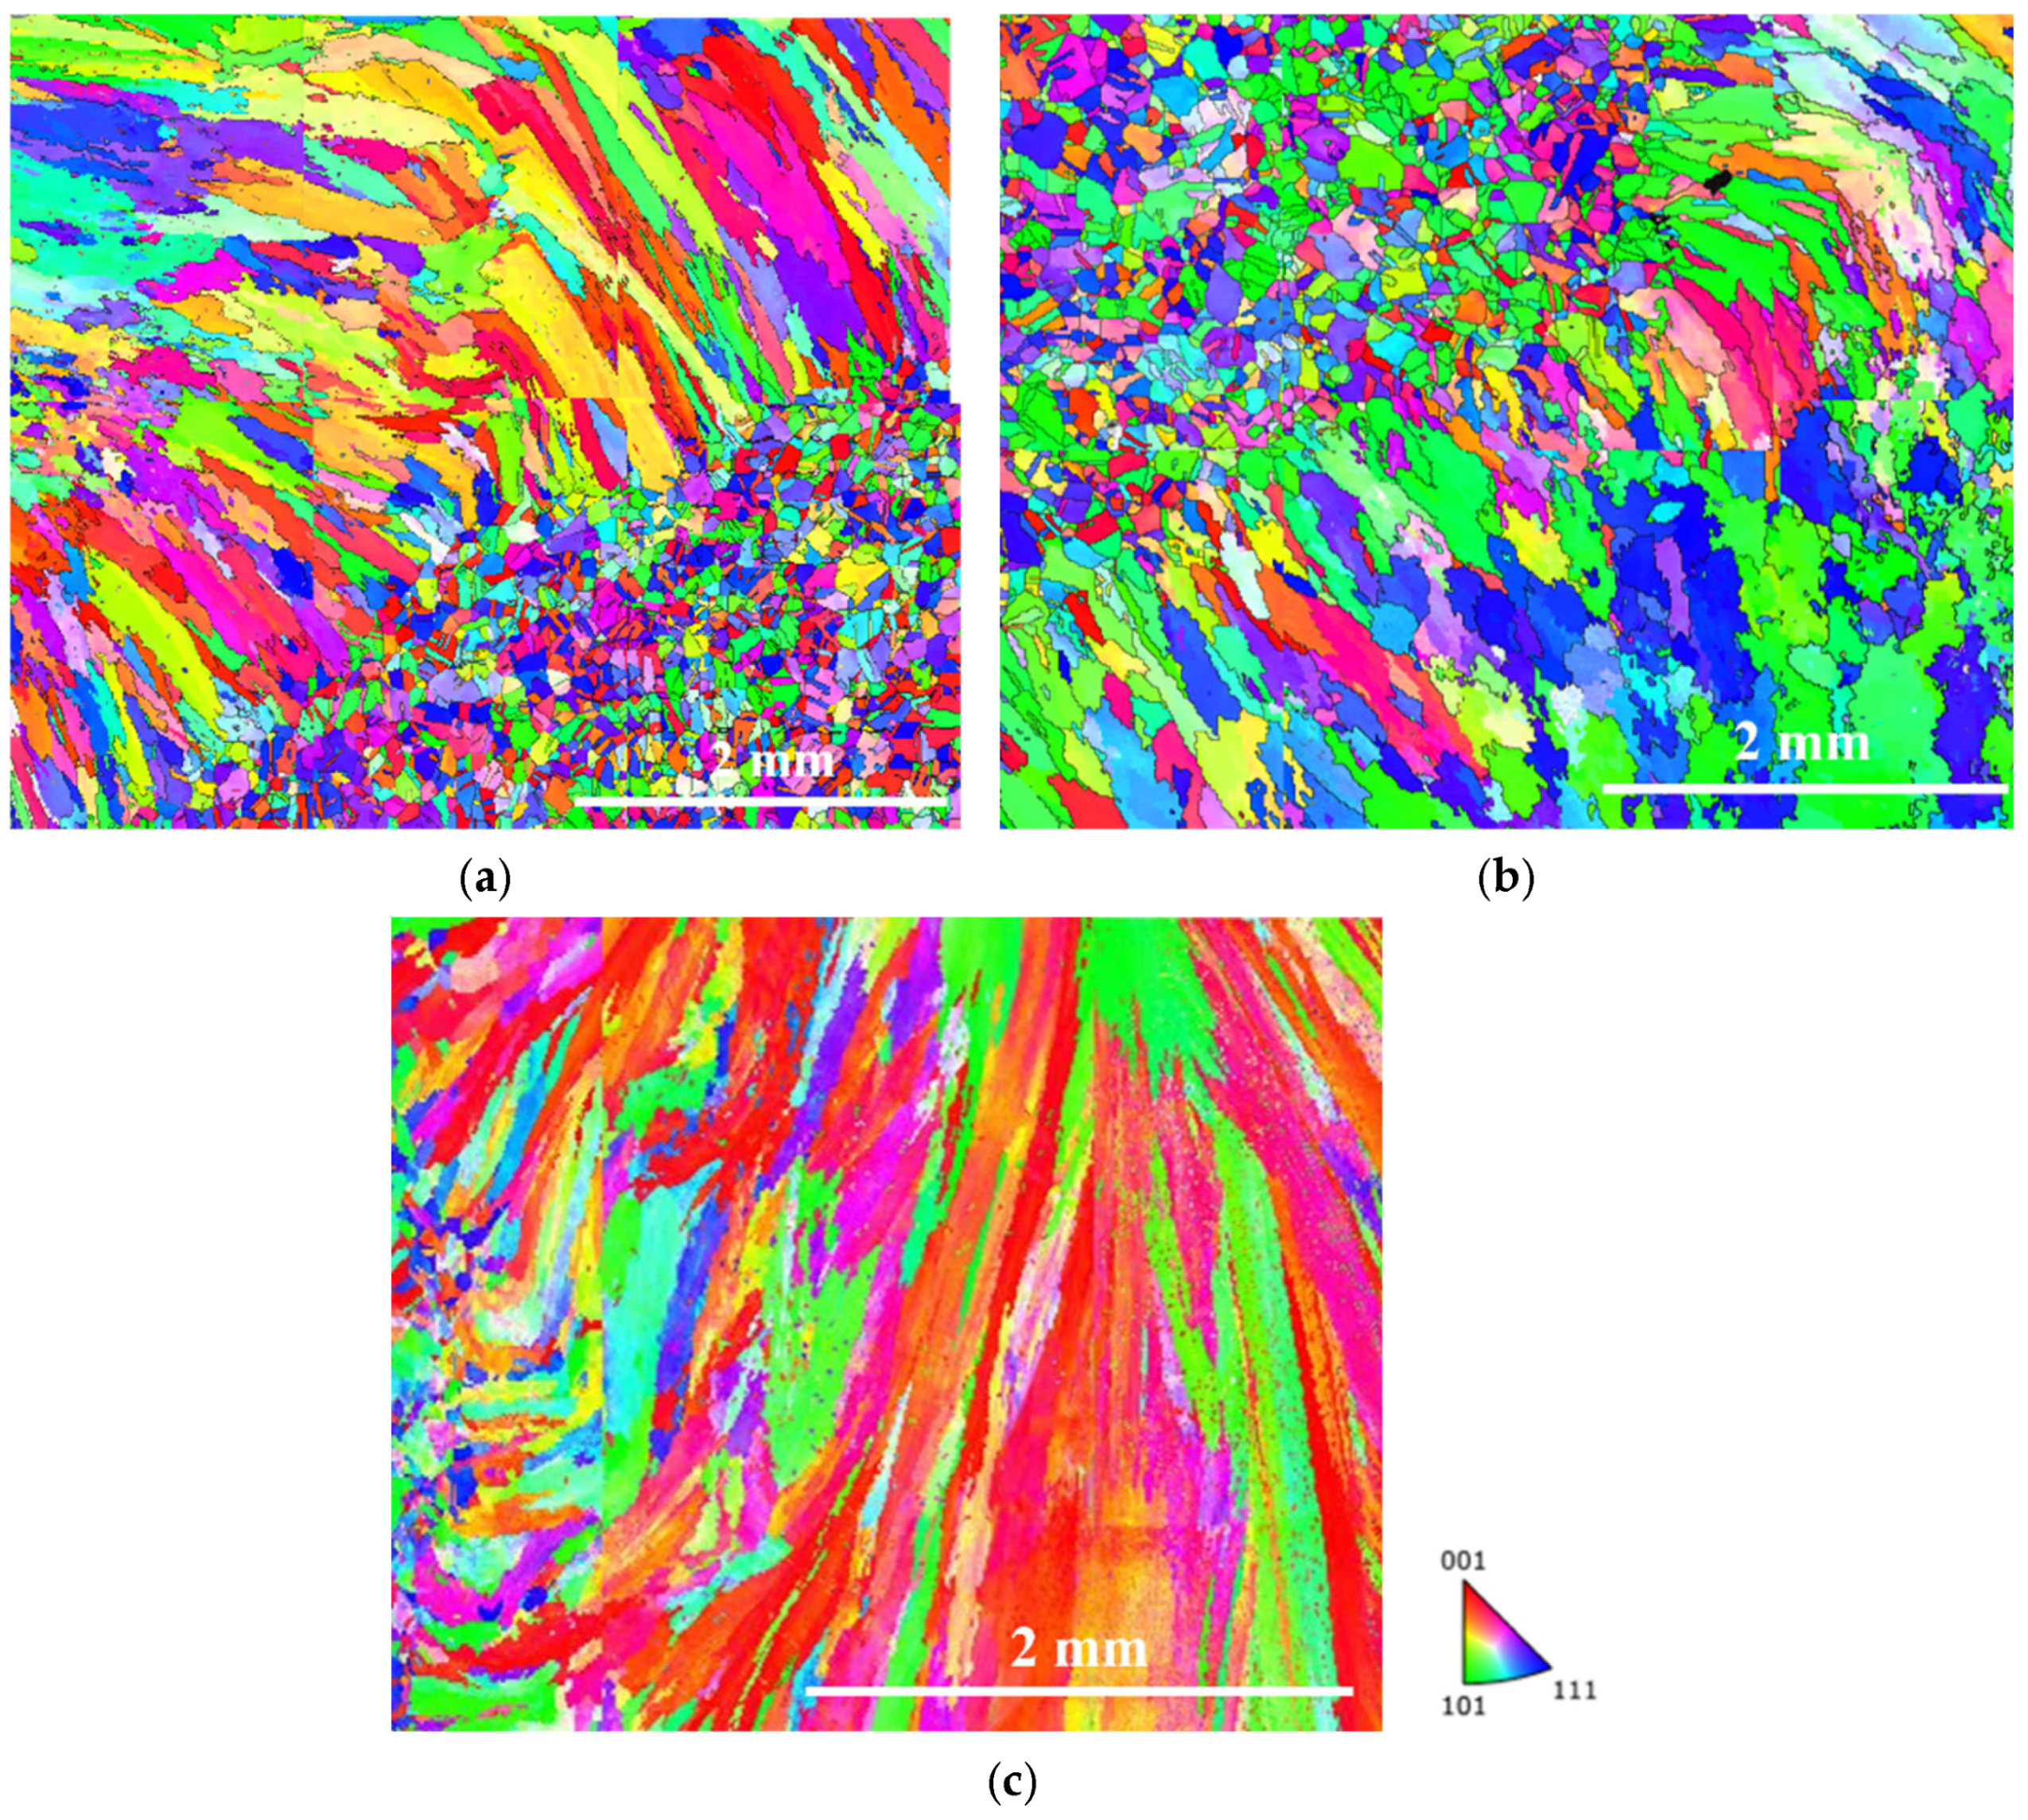
Test blocks were subjected to mechanical polishing followed by vibratory polishing. Electron backscatter diffraction (EBSD) analysis was conducted using a JSM-IT800 high-resolution field emission scanning electron microscope. Diffraction patterns were acquired from both the weld metal and base metal zones of test blocks 1#, 2#, and 3#, with respective scan areas of 5 × 4 mm, 5 × 4 mm, and 3.5 × 3 mm. Acquired data were processed through systematic indexing and post-processing via the AZtecCrystal (v.2.1) software platform. The scanning step was set to 3 μm/s, and the misorientation angle threshold was selected at 10°. Multiple areas were scanned and displayed in combination. The IPF maps referenced to the sample Z direction (ND) are presented in Figure 3. From the figure, it can be observed that the grain size and orientation differ significantly across the three regions. The results indicate that the test block (1#) contains relatively fine columnar crystals with a uniform size distribution, and the grain orientation is not clearly defined. In addition to the fine columnar grains similar to those in test block (1#), the test block (2#) also exhibits coarse grains with distinct orientation. The length of the columnar grains ranges from 89.44 μm to 1128.55 μm, with widths ranging from 90.24 μm to 145.78 μm. The maximum equivalent circle diameter of the coarse grains can reach up to 1545.62 μm. The test block (3#) predominantly consists of coarse columnar grains with clear orientation, with grain lengths exceeding 4 mm, showing significant heterogeneity. A comparison of the EBSD spectra from the three materials reveals that the heterogeneity in the austenitic stainless-steel welds progressively increases.

3.2. Simulated Analysis

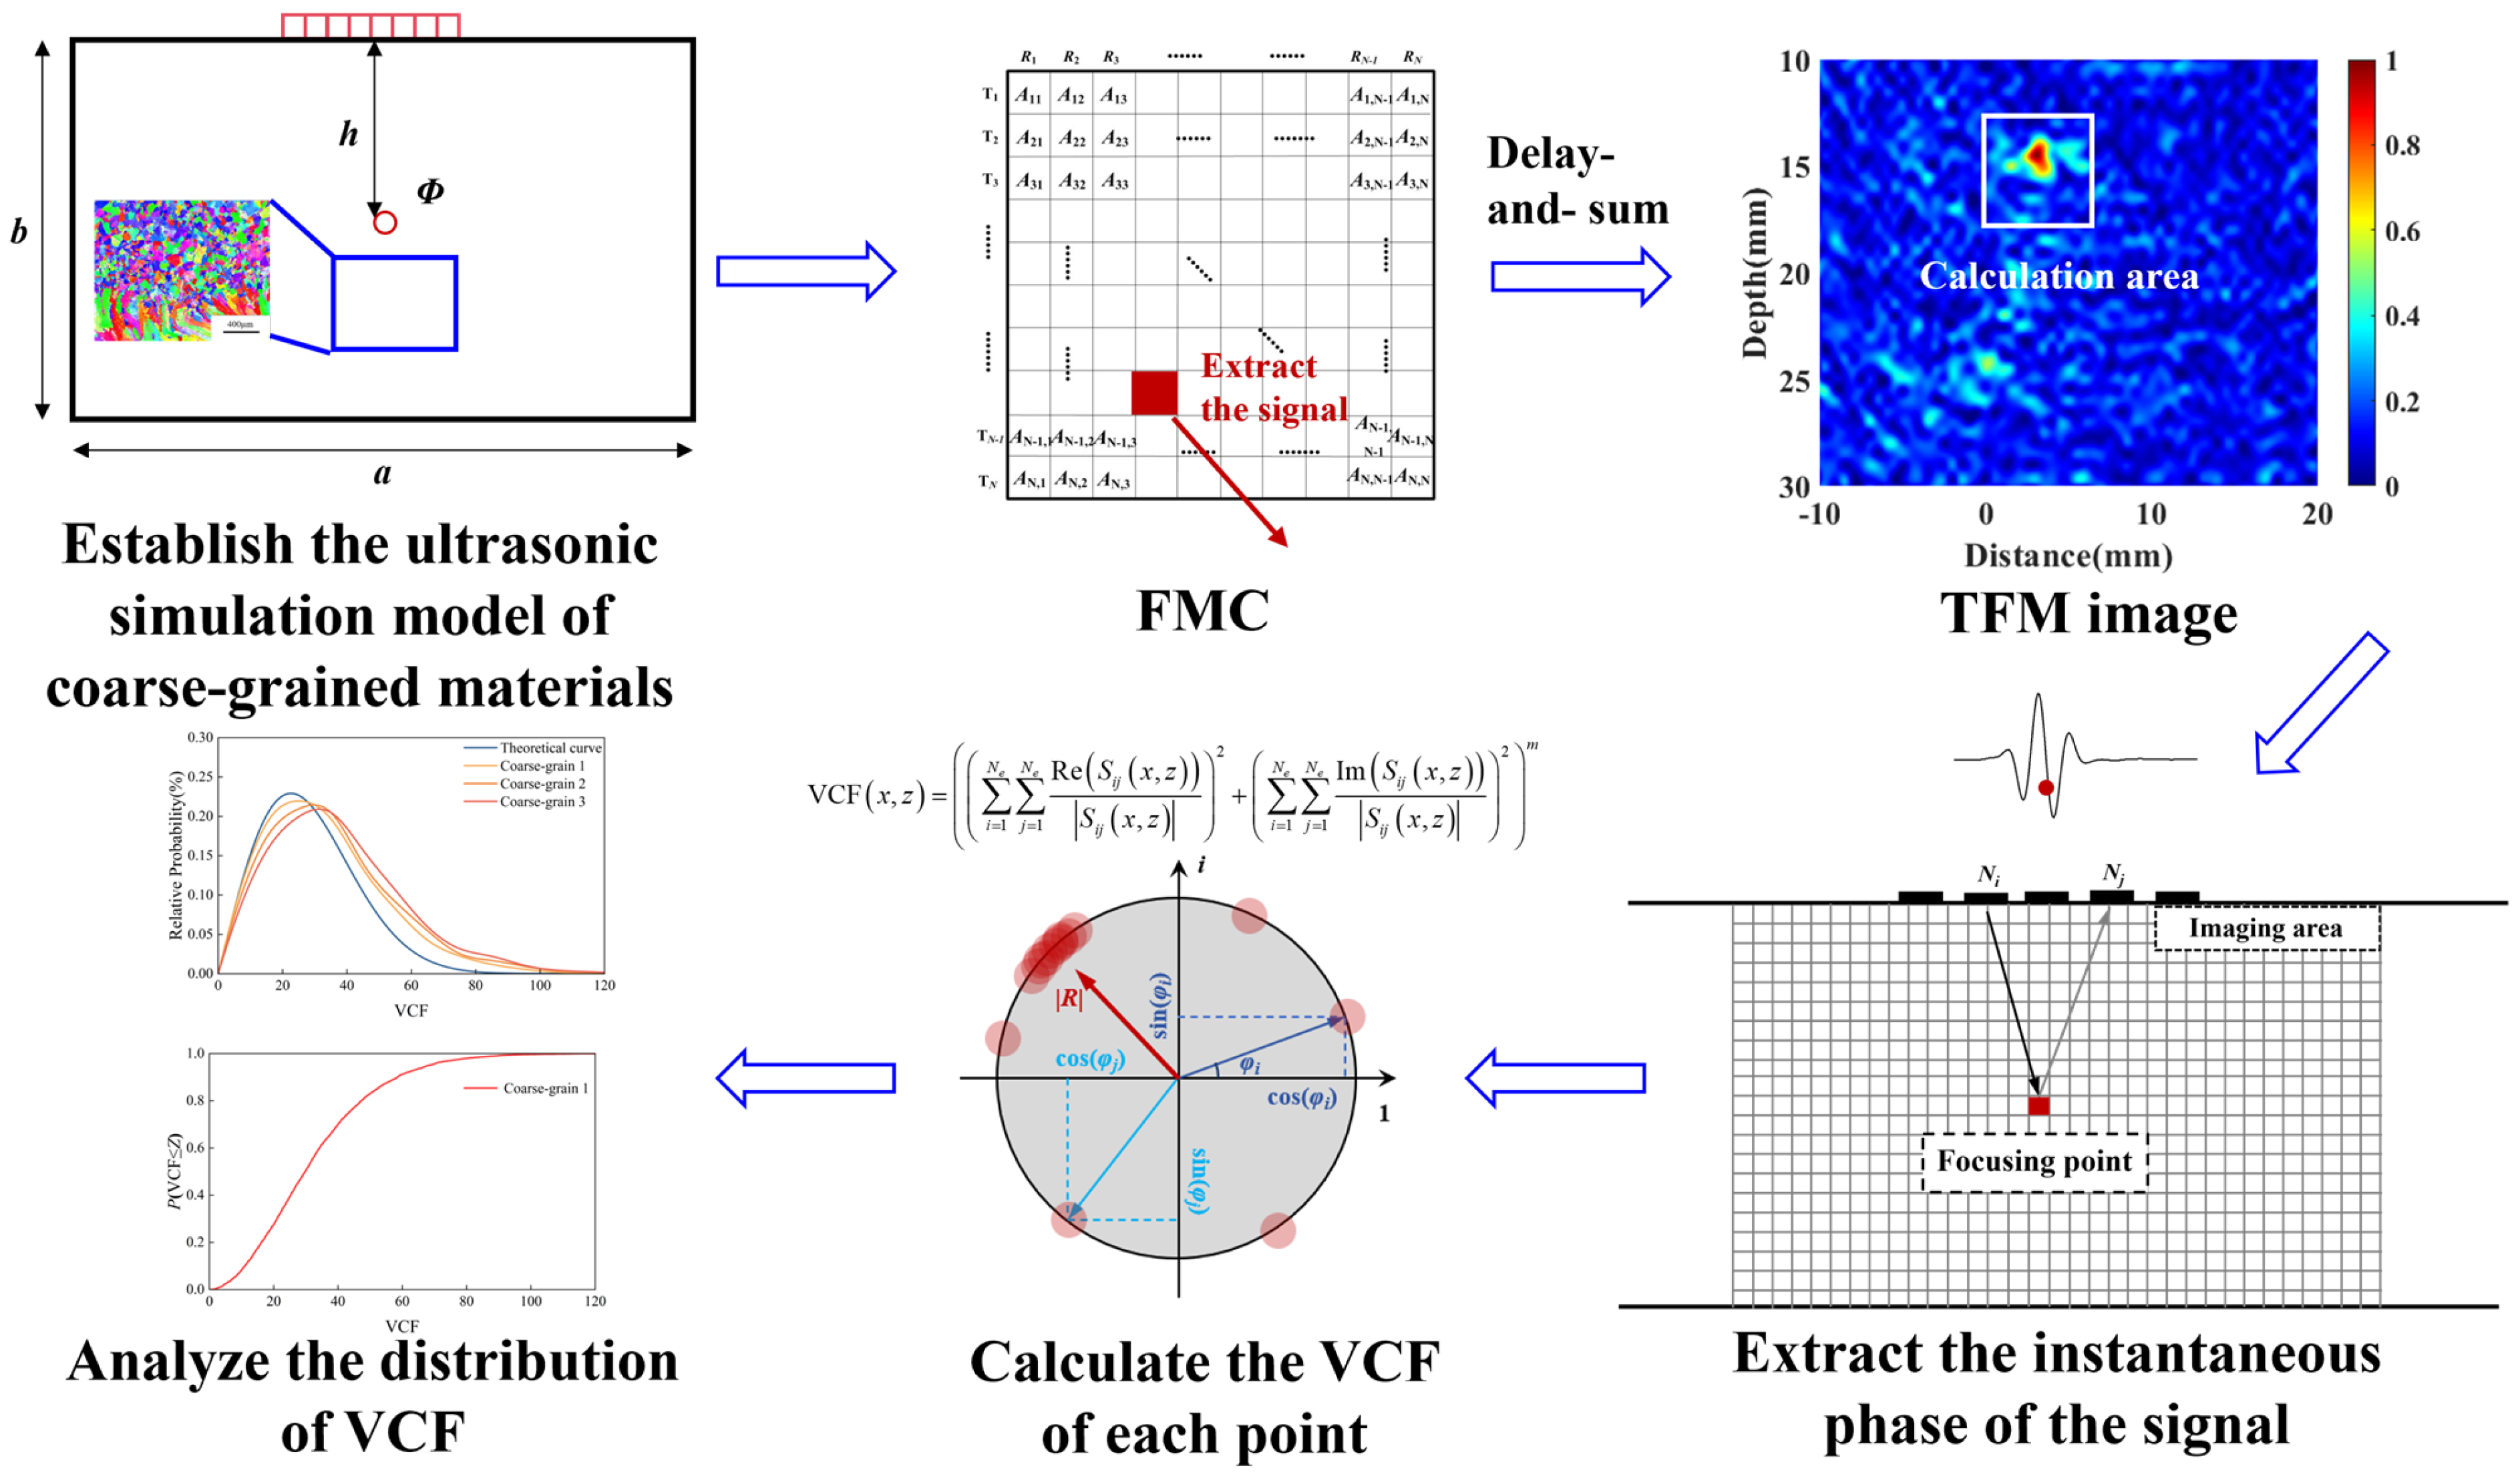
The microstructure of austenitic stainless-steel welds with varying degrees of heterogeneity differs, leading to variations in the degree of ultrasonic signal reflection and scattering. These differences, in turn, affect signal phase coherence and the distribution of the VCF, which influences the selection of the threshold γ. Through modeling and simulation, this paper analyzes the impact of different heterogeneous coarse-grained structures on the distribution of the VCF. The principle and process are illustrated in Figure 4. Initially, the Euler angles of grains were determined from the test blocks’ EBSD maps [27]. The Bond transformation was subsequently employed to compute the elasticity matrices for grains with distinct crystallographic orientations. These matrices were spatially mapped to corresponding regions within the specimen, enabling the development of an ultrasonic wave propagation simulation model for heterogeneous austenitic stainless-steel welts via the finite difference method [28].
Based on the established model, for each imaging point of austenitic stainless-steel welds with varying degrees of heterogeneity, the flight time of the ultrasonic wave from the transmitting array element to the receiving array element, via the imaging point, is calculated. The instantaneous phase of all signals in the full-matrix data is then obtained, from which the corresponding orthogonal and co-directional components are extracted. The VCF is calculated using Equation (4), and the VCF probability distribution is plotted, as shown in Figure 5. Compared with the theoretical distribution curve (Figure 5), the VCF probability distribution curves for the three types of heterogeneous austenitic stainless-steel welds show varying degrees of deviation towards stronger coherence. The offset for the test block (1#) is relatively small, as the size of the columnar crystals in the weld is small, resulting in weaker ultrasonic scattering. The results indicate that the columnar crystals in the test block (2#) are larger, and the grain orientation distribution is more complex, leading to increased ultrasonic scattering and enhanced phase coherence. The test block (3#) exhibits the largest deviation, primarily due to the presence of coarser columnar grains in the weld zone, which exhibit clear orientation. These grains have a stronger scattering and interference effect on the propagation of ultrasonic waves, leading to enhanced coherence of the ultrasonic waves. As a result, the relative probability of high VCF values in the space is increased, necessitating targeted compensation methods to mitigate this effect.
The coarse crystal coherence compensation value (CA) represents the difference between the actual and theoretical values of the VCF cumulative distribution at a specific probability. It must account for both the compensation capacity and the retention effect of defect information. When the CA is too small, the distribution curve still deviates from the actual behavior, and the compensation effect is not achieved. Conversely, if the CA is too large, it may filter out some defect imaging, thereby impairing defect recognition. Following the general principle for selecting confidence intervals, the effective cumulative distribution probability range for the VCF is chosen to be 0.5–0.95, and it is subsequently optimized based on the varying heterogeneity of coarse-grained materials.
From Equation (9), it can be observed that for a fixed number of array elements Ne, in addition to CA, the determination of the threshold γ also requires selecting an appropriate probability threshold PT. Generally, a confidence level greater than 90% is considered effective. Therefore, the VCF-T-TFM imaging is performed for three different PT values: 90%, 99%, and 99.9%. The results are shown in Figure 6.
When PT = 90% (Figure 6a), the image retains significant background noise and a low signal-to-noise ratio. When PT = 99% (Figure 6b), the background noise is suppressed, and the defects are clearly visible. However, when PT = 99.9% (Figure 6c), the background noise is almost completely eliminated, but the defect imaging shows significant deformation. This is mainly due to the threshold being set too high, causing the filtering of some effective signals and resulting in the loss of imaging details. In conclusion, a probability threshold of 99% is selected.
To further analyze the imaging effect of the VCF-T-TFM in both homogeneous materials and coarse-grained heterogeneous materials, the signal-to-noise ratio improvement of the VCF-T-TFM and conventional noise reduction methods were compared using the No. 1 defect as an example in carbon-steel and austenitic stainless-steel welds (Figure 7).
As shown in Figure 7, the defect images of the original TFM, the VCF-TFM, and the VCF-T-TFM are compared. It can be observed that the defect TFM image of the carbon-steel material shows no obvious background noise. The VCF-TFM suppresses the divergence of defect edges, and the results from the VCF-T-TFM are essentially identical to those from the VCF-TFM. In contrast, the TFM image of defects in austenitic stainless steel exhibits noticeable noise. The VCF-TFM corrects the defect smear but fails to effectively suppress the noise, leaving the background noise visible. However, the VCF-T-TFM, which incorporates phase coherence compensation for coarse-grained materials, can filter out the structural noise caused by the coarse-grained microstructure. The defect image becomes clearer, and the imaging SNR is significantly improved. It can be observed that the VCF-T-TFM employs coarse grain coherence compensation to optimize the impact of phase coherence levels at various points in the imaging space, primarily targeting the noise caused by ultrasonic scattering in coarse grain materials. This method has little to no effect on imaging of homogeneous materials but demonstrates a significant noise suppression effect on ultrasonic imaging of coarse-grain materials. The reconstructed image produced using this method shows almost no visible noise.
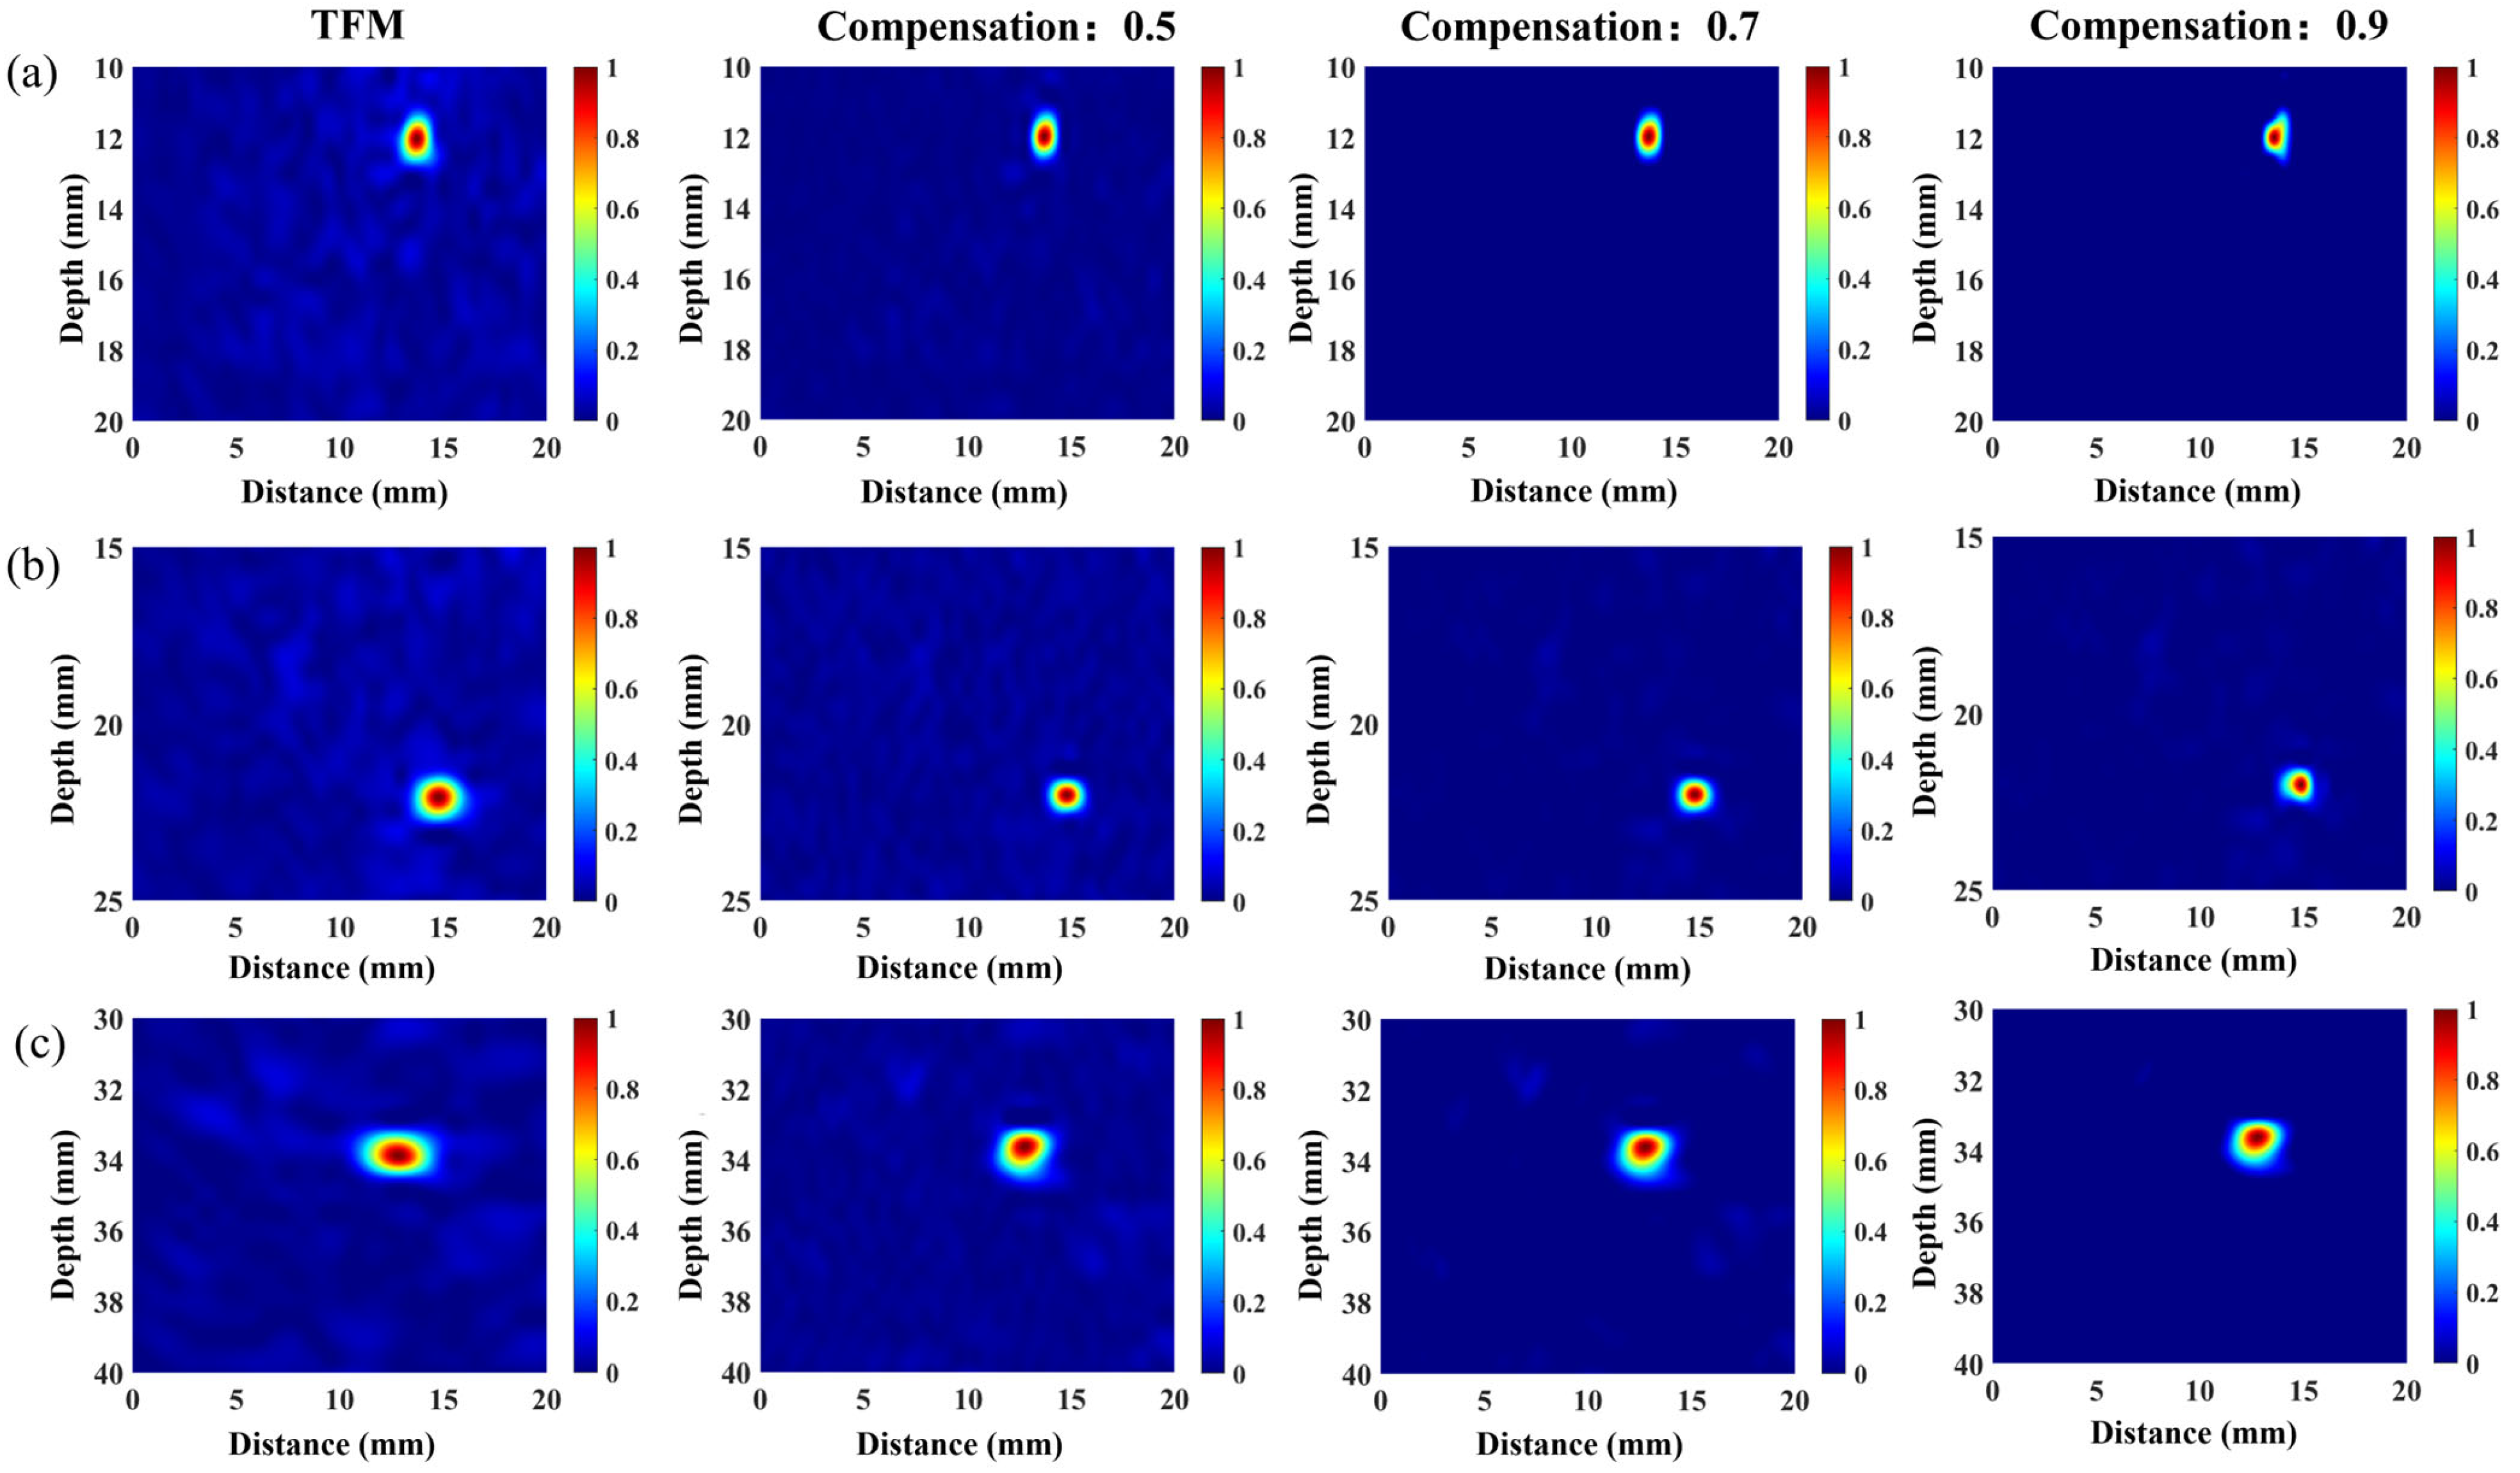
The heterogeneity in different regions of austenitic stainless steel significantly influences the selection of the coarse-grain coherence compensation value (CA). To analyze the impact of varying degrees of heterogeneity on the selection of CA and imaging outcomes, three types of austenitic stainless-steel welds with different heterogeneities were imaged and compared based on EBSD results. The CA was selected according to coarse-grain-phase dry compensation values corresponding to VCF cumulative distribution probabilities of 0.5, 0.7, and 0.9, respectively. The results are presented in Figure 8.
From the figure, it can be observed that, for the test block (1#) with lower heterogeneity, using a coarse-grain coherence compensation value of 0.5 effectively filters out significant noise. As the compensation value increases, the defect contours become distorted and incomplete, negatively impacting the imaging quality. When the coarse grain coherence compensation value reaches 0.7 in the test block (2#) with moderate heterogeneity, there is no discernible noise, but further increase in the compensation value causes deformation of the defect imaging. In contrast, the test block (3#) with higher heterogeneity requires the highest compensation value to effectively suppress structural noise. These observations indicate that the selection of the coarse grain coherence compensation value should be based on the degree of heterogeneity within the coarse grain material. In regions with high heterogeneity and low compensation values, the imaging quality is optimal with minimal background noise. However, excessively high compensation values may result in the loss of some defect details. Conversely, in areas with low heterogeneity, selecting a higher compensation value helps to effectively suppress coarse grain noise.

3.3. Experimental Result

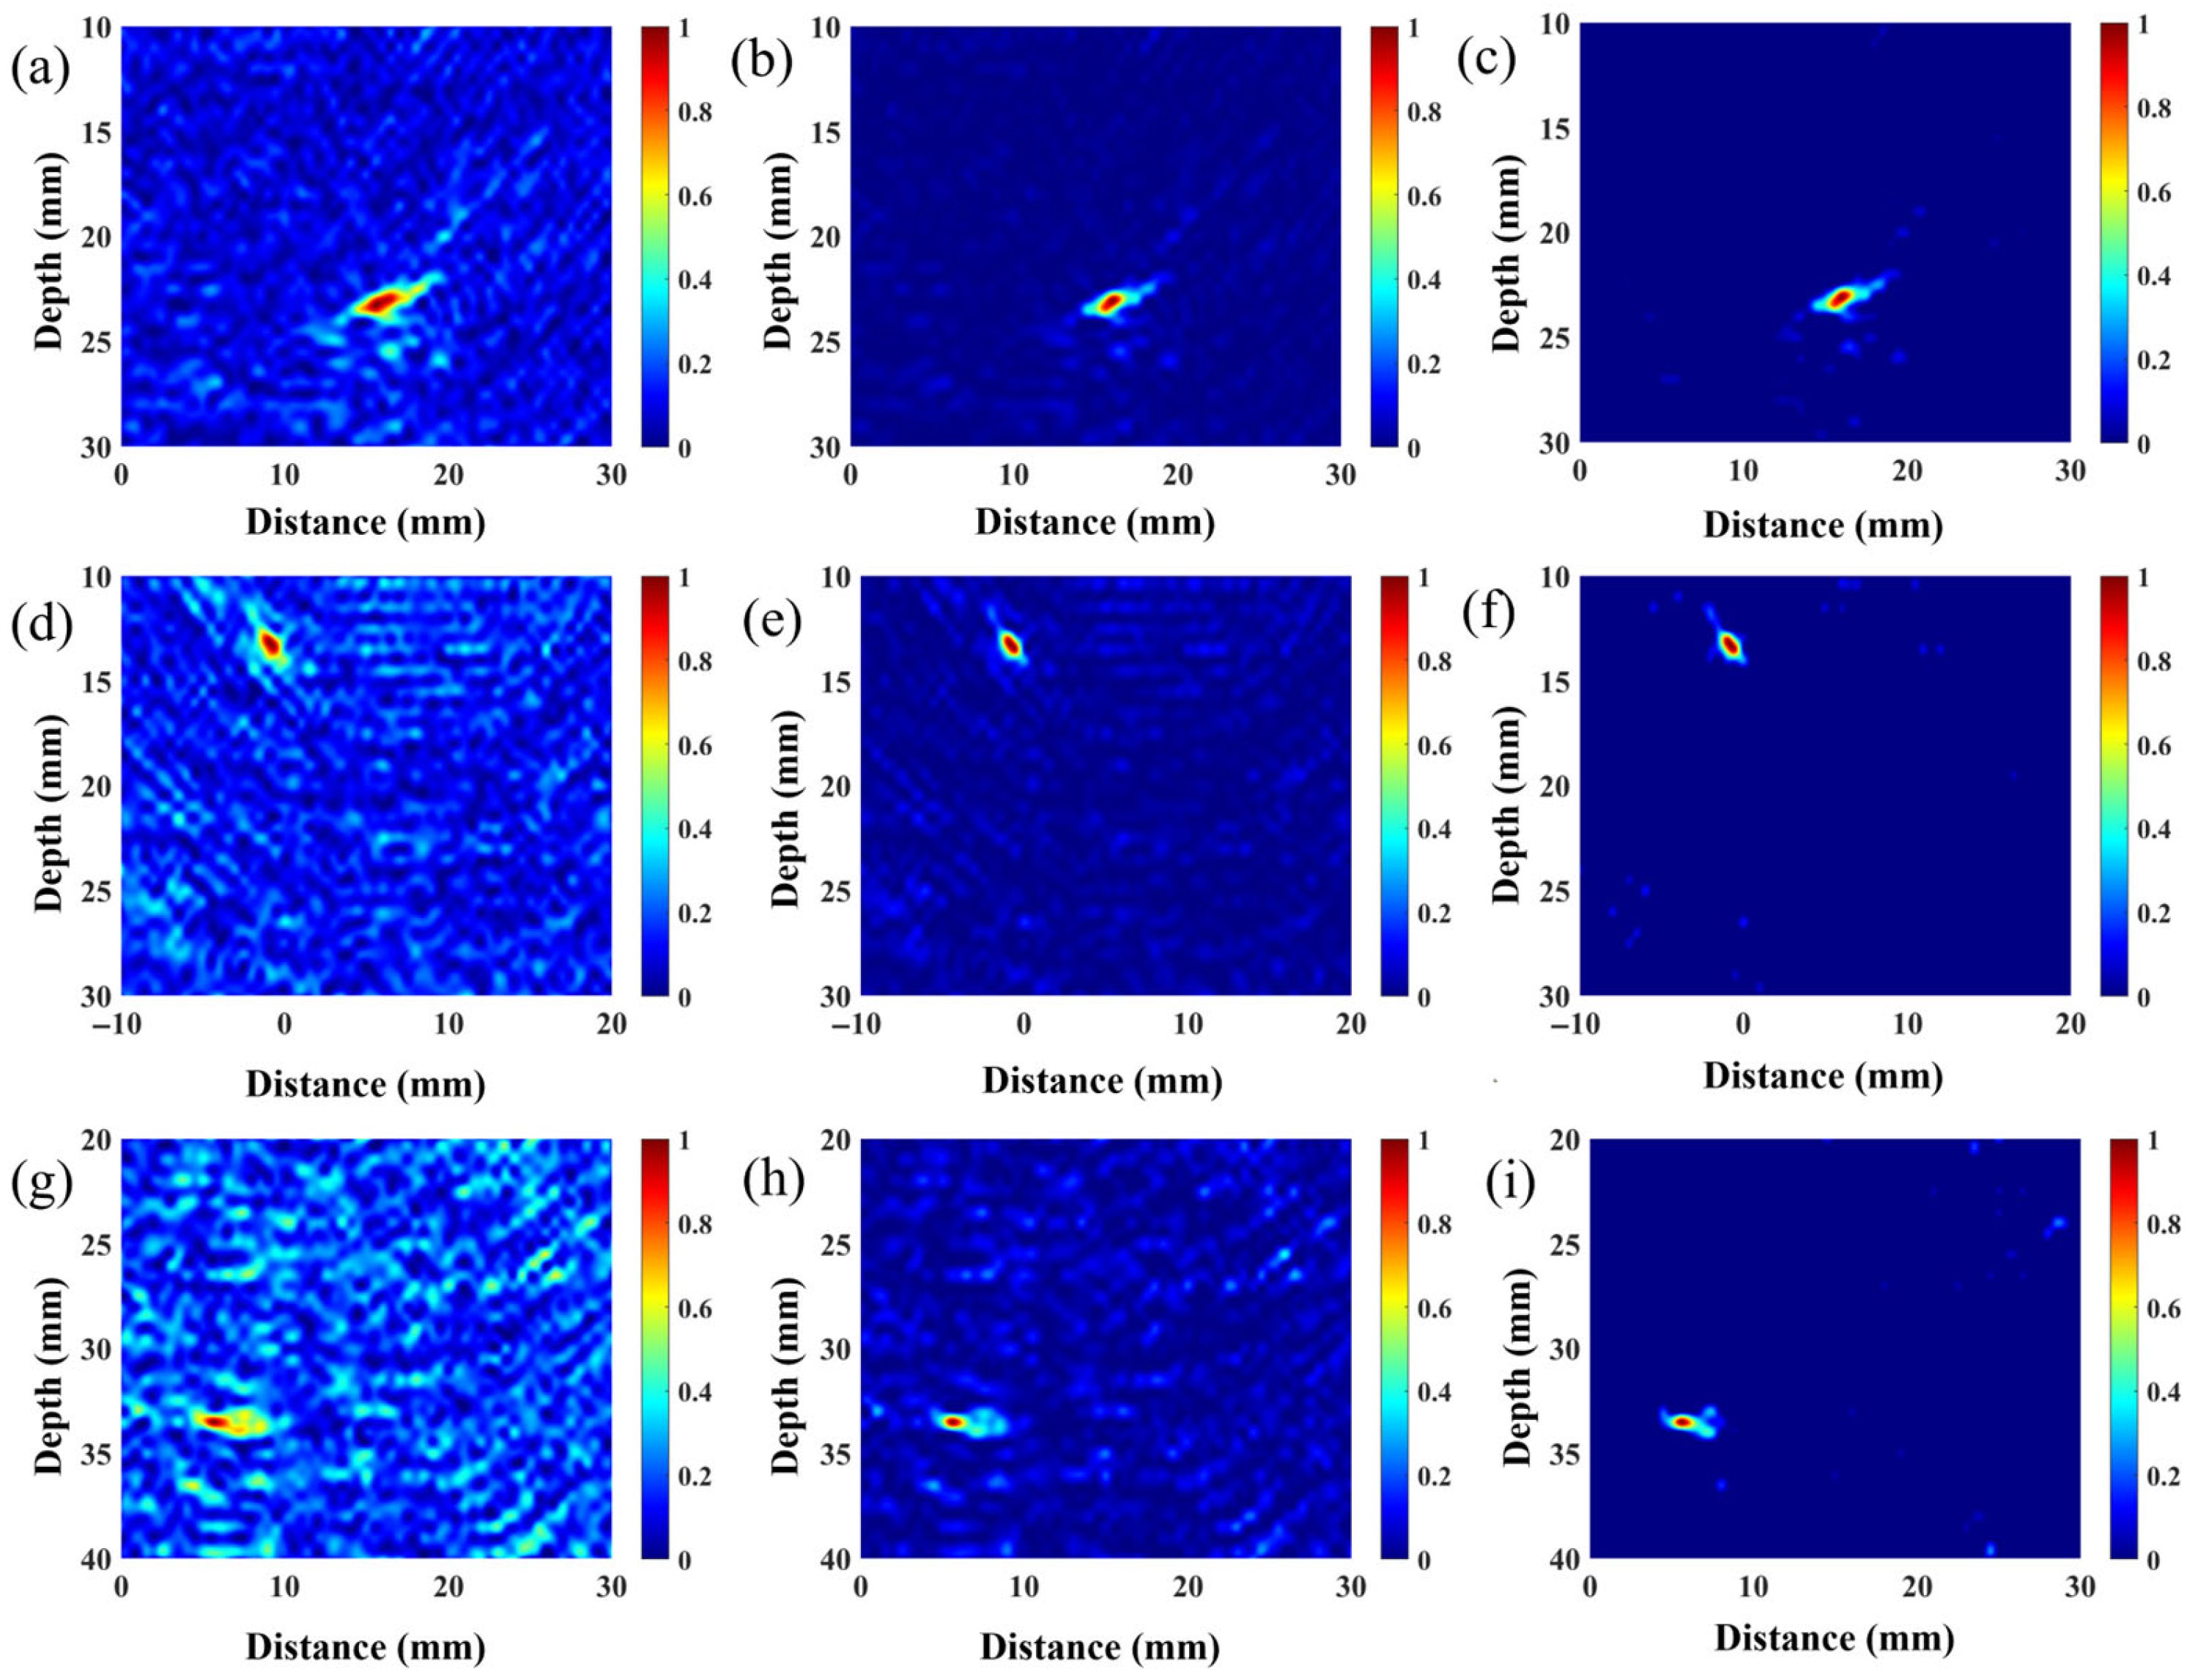
To evaluate the SNR enhancement effect of the VCF-T-TFM in ultrasonic imaging of austenitic stainless steel, ultrasonic testing was performed on nine side-drilled-hole (SDH) defects (designated No. 1 to No. 9), utilizing simulation-optimized imaging parameters. Figure 9 presents the imaging results for the TFM, the VCF-TFM, and the VCF-T-TFM applied to four representative defects.
From Figure 9, it can be observed that side-drilled-hole defects are detectable in the imaging results, although there are notable differences in imaging quality. Specifically, the defect imaging in TFM images is clear; however, the image background contains considerable noise. Additionally, dragging shadows are evident near the defect. As the defect depth increases, the dragging shadow region also expands, and the defect contours become increasingly blurred. The VCF-TFM helps reduce background noise to some extent, but significant noise persists. In comparison to the VCF-TFM imaging results without coarse-grain compensation, the VCF-T-TFM images exhibit a substantial reduction in noise, a marked decrease in the dragging shadow area, and clearer defect contours.
Imaging performance is compared using the signal-to-noise ratio (SNR), which can be calculated using Equation (13) [29]:
SNR = 20 lg I signal I noise
where Isignal and Inoise are the amplitude of defect images and the average amplitude of nearby noise artifacts, respectively.
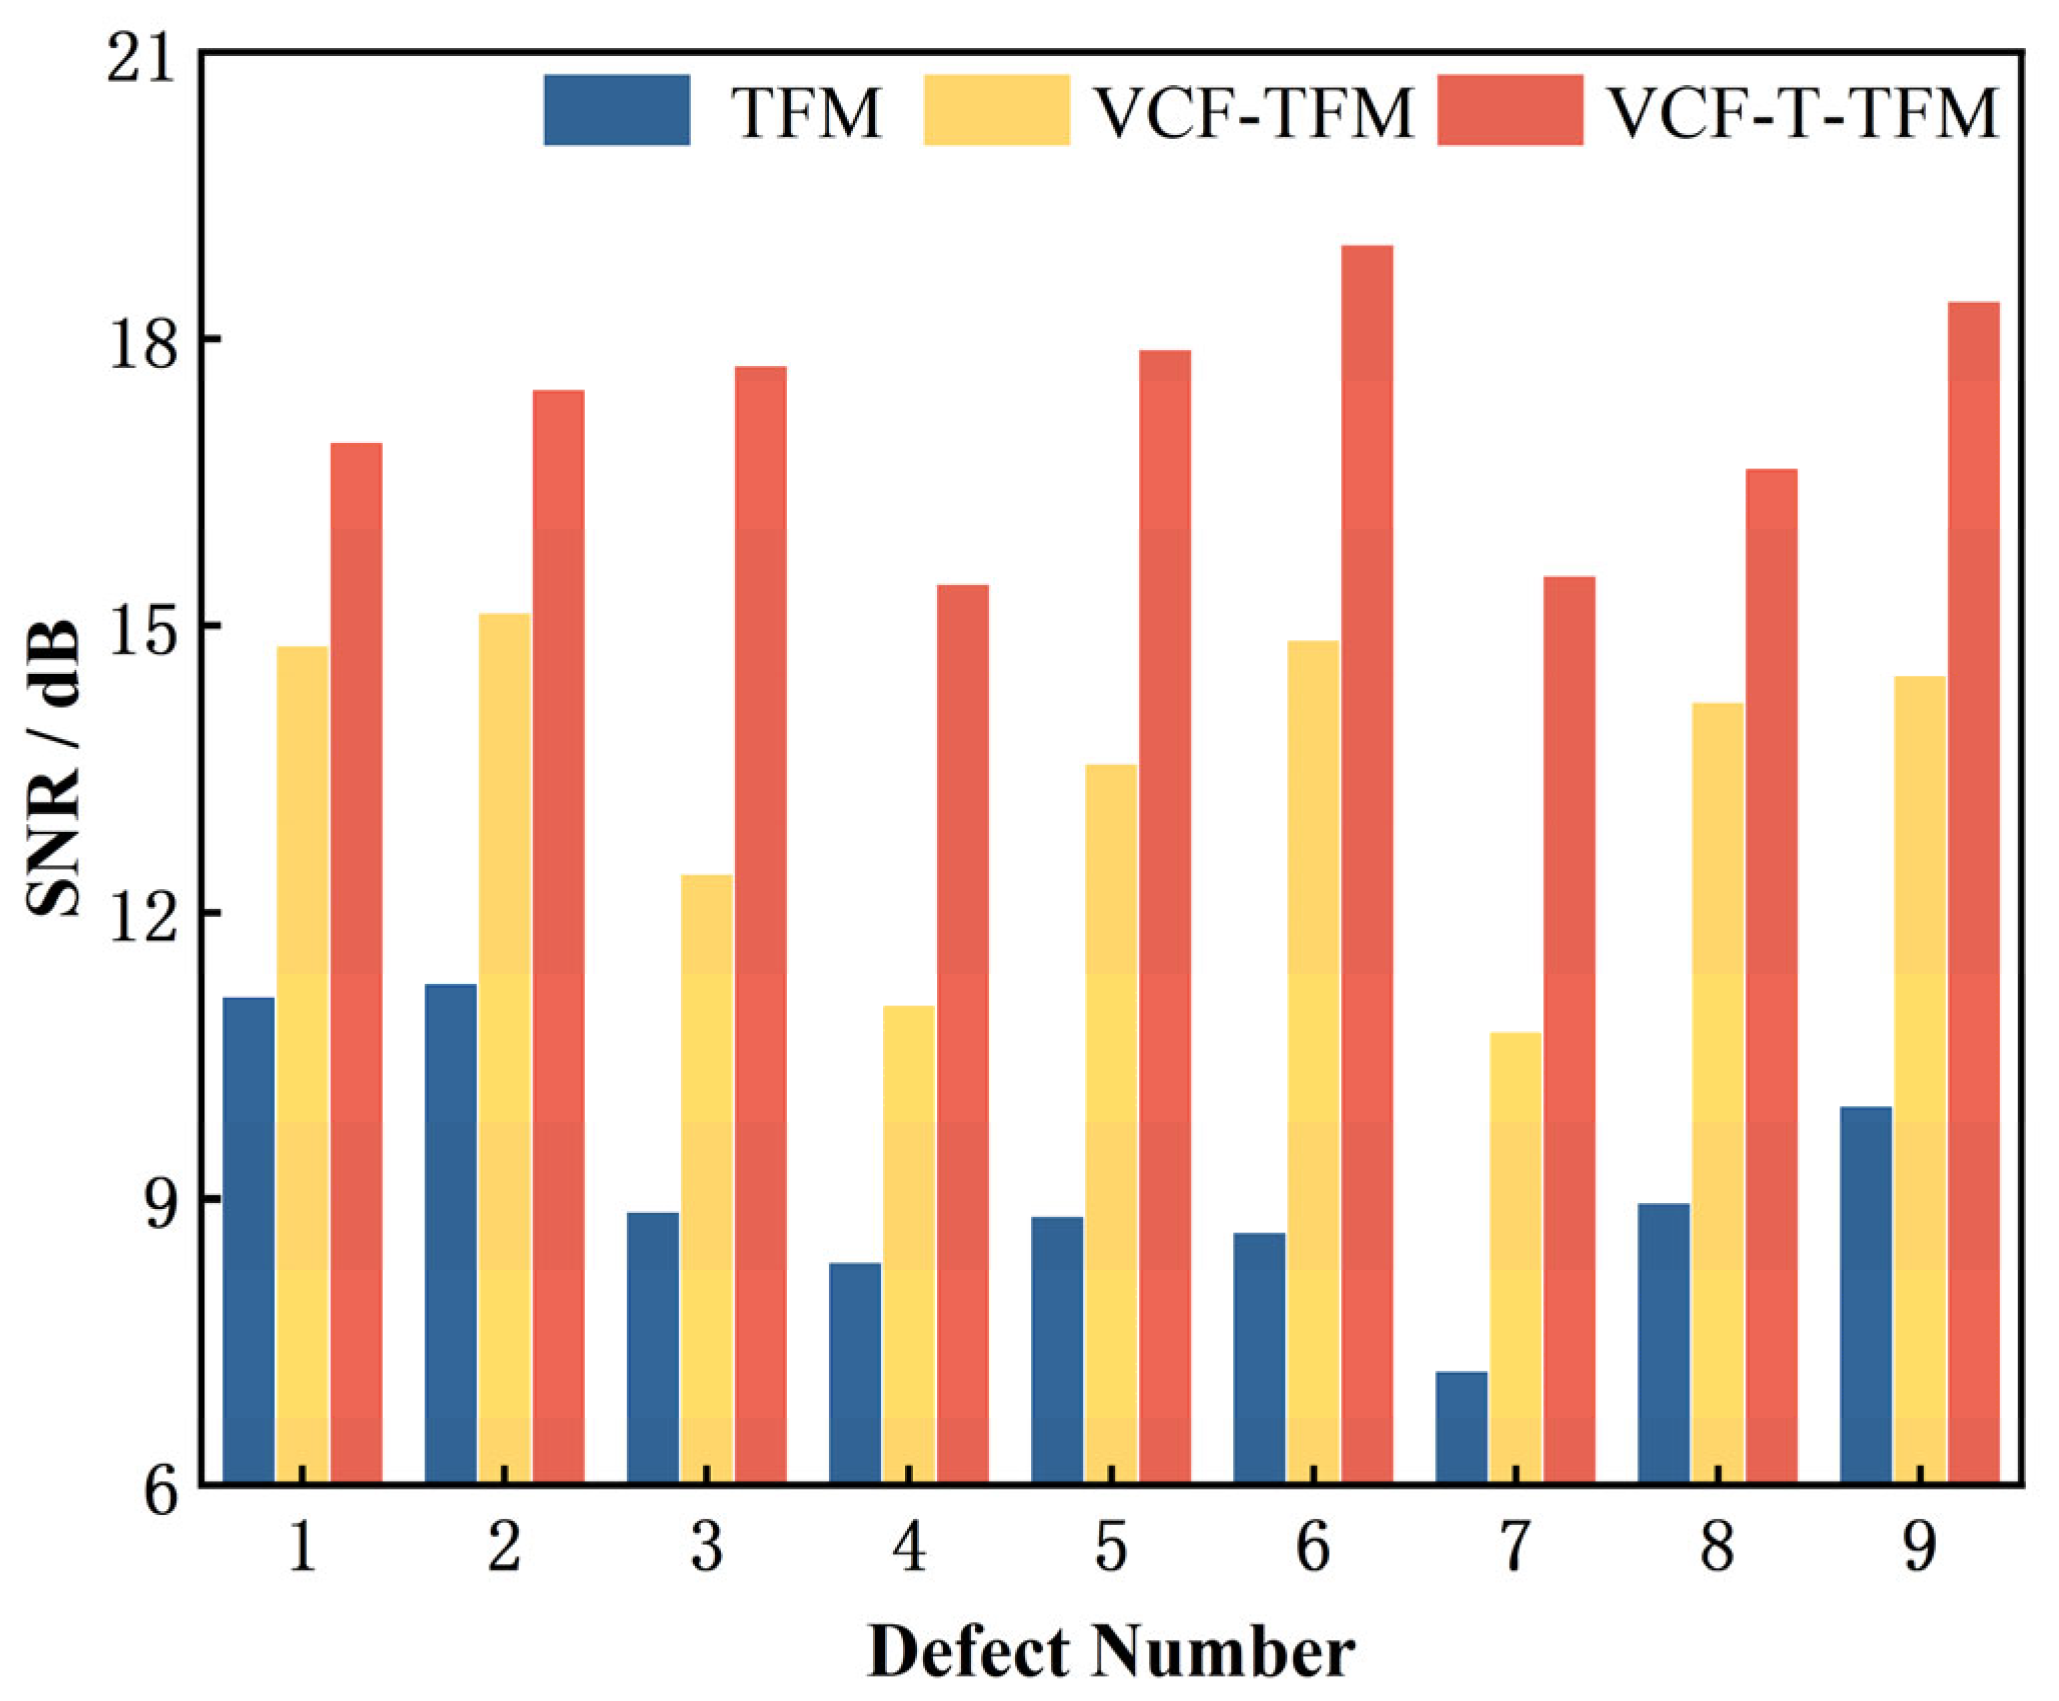
The SNR of defect imaging for the three methods mentioned above was compared, and the results are shown in Figure 10. Compared to TFM imaging, the SNR of the VCF-T-TFM images is improved by 5.80 dB to 10.34 dB. In comparison to VCF-TFM imaging, the introduction of coarse-crystal coherent compensation results in an improvement range of 2.13 dB to 5.32 dB in the detection SNR of the VCF-T-TFM. When compared to conventional noise reduction methods, the improvement amplitude reaches 78.9% to 97.3%.
The TFM improves defect detection accuracy by focusing on the entire imaging area point by point, which results in strong spatial averaging. However, when collecting full-matrix data, single-element emission is used, leading to low signal energy. For coarse crystal structures, the issues of weak signals and low SNR are more pronounced. In VCF-TFM imaging, calculating the phase coherence coefficients for all points in the imaging space and weighting them by the amplitude of the TFM image can filter out some background noise. However, it is insufficient to effectively identify structural noise caused by the coarse-grain structure. As a result, some degree of background noise remains in the image, negatively impacting the image quality. The VCF-T-TFM introduces phase information, accounts for the weak coherence of coarse-crystal structure noise, optimizes coarse-crystal coherence compensation, and sets appropriate imaging thresholds. Compared with the VCF-TFM, which does not consider heterogeneity compensation for coarse-crystal materials, this method effectively reduces the trailing image of defect contours, significantly improving the imaging SNR and enhancing defect imaging quality.

4. Conclusions

  • This study introduces the vector coherent factor threshold total focusing imaging method (VCF-T-TFM), incorporating material properties to enhance ultrasonic imaging in heterogeneous coarse-grained austenitic stainless steels. The efficacy of this approach in improving the signal-to-noise ratio (SNR) was rigorously validated through combined simulation and experimental investigations.
  • Simulation studies employed three austenitic stainless-steel weld specimens exhibiting graded heterogeneity. These studies compared the defect imaging performance of the VCF-T-TFM in carbon steel versus austenitic stainless steel across regions of differing heterogeneity, specifically analyzing the impact of tissue heterogeneity on the imaging SNR. Results demonstrate that, in contrast to homogeneous media, the VCF-T-TFM effectively suppresses backscattered structural noise within heterogeneous regions of coarse-grained materials. Furthermore, the analysis revealed a correlation between the optimal coarse-grain coherence compensation value and the degree of material heterogeneity.
  • Experimental validation involved ultrasonic testing of nine side-drilled-hole (SDH) defects at various locations within austenitic stainless-steel weld test blocks. Conventional denoising techniques without coarse-grain compensation achieved a maximum SNR improvement of 5.24 dB. In comparison, the proposed VCF-T-TFM, by incorporating coarse-grain coherent compensation, significantly enhanced defect detectability, suppressing structural noise inherent to coarse-grain structures. This yielded a substantial SNR improvement of up to 10.34 dB, representing a 97.3% enhancement over the uncompensated conventional approach.

Author Contributions

Conceptualization, T.Z. and G.P.; methodology, T.Z. and J.W.; software, Z.L.; validation, T.Z., Z.L. and D.Z.; formal analysis, T.Z. and J.W.; investigation, T.Z.; resources, D.Z. and G.P.; data curation, Z.L.; writing—original draft preparation, T.Z. and Z.L.; writing—review and editing, G.P.; visualization, Z.L.; supervision, G.P.; project administration, D.Z. All authors have read and agreed to the published version of the manuscript.

Funding

This research received no external funding.

Data Availability Statement

The original contributions presented in this study are included in the article. Further inquiries can be directed to the corresponding author.

Acknowledgments

The authors have reviewed and edited the output and take full responsibility for the content of this publication.

Conflicts of Interest

Authors Tianwei Zhao, Donghui Zhang and Junlong Wang were employed by the company China Nuclear Industry 23 Construction Co., Ltd. The remaining authors declare that the research was conducted in the absence of any commercial or financial relationships that could be construed as a potential conflict of interest.

Abbreviations

The following abbreviations are used in this manuscript:
TFMTotal Focusing Method
VCFVector Coherent Factor
EBSDElectron Backscatter Diffraction
SNRSignal-to-Noise Ratio

References

  1. Rokhlin, S.I.; Bolland, T.K.; Adler, L. High-frequency Ultrasonic Wave Propagation in Polycrystalline Materials. J. Acoust. Soc. Am. 1992, 91, 151–165. [Google Scholar] [CrossRef]
  2. Jiang, B.T.; Yan, S.G.; Zhang, B.X. Acoustic Simulation and Total Focusing Method Defect Detection in Austenitic Stainless Steel Welds. J. Appl. Acoust. 2023, 42, 1170–1176. [Google Scholar]
  3. Leymarie, N.; Imperiale, A.; Fortuna, T.; Edouard, D. Comparisons of Ray and Finite Element Simulations of Ultrasonic Wave Fields in Smoothly Inhomogeneous Austenitic Welds of Thick-walled Components. NDT E Int. 2024, 147, 103177. [Google Scholar] [CrossRef]
  4. Zhang, L.G.; Wu, W.; Ouyang, X.Q. Ultrasonic Testing Analysis of 304 Stainless Steel Crystal Grain Diffusion Properties. Nondestruct. Test. 2010, 32, 99–102. [Google Scholar]
  5. Bloxham, H.A.; Velichko, A.; Wilcox, P.D. Combining Simulated and Experimental Sata to Simulate Ultrasonic Array Data from Defects in Materials with High Structural Noise. IEEE Trans. Ultrason. Ferroelectr. Freq. Control 2016, 63, 2198–2206. [Google Scholar] [CrossRef]
  6. Hu, M.D.; Huang, H.D.; Wang, Q.; Chen, T.; Wu, L.L. Detection of the Defects in Austenitic Stainless Steel Weld by Using the Ultrasonic Total Focus Imaging. J. China Univ. Metrol. 2021, 32, 472–479. [Google Scholar]
  7. Li, Y. Complementarity of Phased-Array Technology and Total Focusing Method. Nondestruct. Test. Technol. 2017, 41, 1–5. [Google Scholar]
  8. Ponseenivasan, S.; Kumar, A.; Rajkumar, K.V. Anisotropy Corrected FMC/TFM Based Phased Array Ultrasonic Imaging in an Austenitic Buttering Layer. Appl. Sci. 2023, 13, 5195. [Google Scholar] [CrossRef]
  9. Liao, J.Y.; Su, J.K.; Li, X.; Zhang, X.F.; Jin, S.J.; Yang, H.M.; Lin, L. Defect Detection of BOSS Welds in Nuclear Power Plant by Ultrasonic Total Focusing Method. Nondestruct. Test. Technol. 2023, 47, 1–4. [Google Scholar]
  10. Camacho, J.; Fritsch, C. Phase Coherence Imaging of Grained Materials. IEEE Trans. Ultrason. Ferroelectr. Freq. Control 2011, 58, 1006–1015. [Google Scholar] [CrossRef]
  11. Chen, M.; Chen, Y.; Xiao, S.K.; Lu, C.; Li, Q.F. Shear Wave Full-skip Total Focusing Method of Upper Surface-breaking Cracks Based on Circular Statistic Vector Threshold Weighting. Chin. J. Sci. Instrum. 2023, 44, 52–60. [Google Scholar]
  12. Chen, Y. Modeling of Ultrasonic Testing and Noise Suppression Using Phase Coherence Imaging Algorithm in Heavy-Walled Cast Austenitic Stainless Steel. Ph.D. Thesis, Dalian University of Technology, Dalian, China, 2016. [Google Scholar]
  13. Bilodeau, M.; Quaegebeur, N.; Berry, A.; Masson, P. Correlation-based Ultrasound Imaging of Strong Reflectors with Phase Coherence Filtering. Ultrasonics 2022, 119, 106631. [Google Scholar] [CrossRef] [PubMed]
  14. Lesage, J.C.; Marvasti, M.; Farla, O. Vector Coherence Imaging for Enhancement of Small Omni-directional Scatterers and Suppression of Geometric Reflections. NDT E Int. 2021, 123, 102502. [Google Scholar] [CrossRef]
  15. Huang, J.X.; Chen, M.; Kong, Q.R.; Xiao, L.Z.; Lu, C.; Chen, Y. Phased Array Ultrasonic Sector Scan Imaging of Helicopter Damper Bolts Based on Vector Coherence Factor. Appl. Sci. 2022, 12, 9936. [Google Scholar] [CrossRef]
  16. Guan, S.Y.; Wang, X.K.; Hua, L.; Li, Y.X. TFM Imaging of Aeroengine Casing Ring Forgings with Curved Surfaces using Acoustic Field Threshold Segmentation and Vector Coherence Factor. Chin. J. Aeronaut. 2022, 35, 401–415. [Google Scholar] [CrossRef]
  17. Prado, V.T.; Higuti, R.T.; Kitano, C.; Martinez-Graullera, O. Instantaneous Phase Threshold for Reflector Detection in Ultrasonic Images. IEEE Trans. Ultrason. Ferroelectr. Freq. Control 2014, 61, 1204–1215. [Google Scholar] [CrossRef]
  18. Gauthier, B.; Painchaud-April, G.; Le Duff, A.; Belanger, P. Lightweight and Amplitude-Free Ultrasonic Imaging Using Single-Bit Digitization and Instantaneous Phase Coherence. IEEE Trans. Ultrason. Ferroelectr. Freq. Control 2022, 69, 1763–1774. [Google Scholar] [CrossRef]
  19. Bazulin, E.G. Using coherence factor to improve the quality of reflector images in ultrasonic testing. Russ. J. Nondestruct. 2017, 53, 401–414. [Google Scholar] [CrossRef]
  20. Menard, C.; Robert, S.; Miorelli, R.; Lesselier, D. Optimization algorithms for ultrasonic array imaging in homogeneous anisotropic steel components with unknown properties. NDT E Int. 2020, 116, 102327. [Google Scholar] [CrossRef]
  21. Piedade, L.P.; Painchaud-April, G.; Le Duff, A.; Belanger, P. Minimum Transmission Events for Fast Ultrasonic TFM Imaging: A Comparative Study. NDT E Int. 2022, 128, 102627. [Google Scholar] [CrossRef]
  22. Lin, L.; Shi, S.Q.; Sun, X.; Ma, Z.Y.; Zhang, X.F.; Liu, L.L.; Jin, S.J. Resolution Enhancement of Total Focusing Imaging Combining with Autoregressive Spectral Extrapolation. J. Mech. Eng. 2020, 56, 8–13. [Google Scholar]
  23. Cruza, J.F.; Camacho, J.; Fritsch, C. Plane-wave phase-coherence Imaging for NDE. NDT E Int. Indep. Nondestruct. Test. Eval. 2017, 87, 31–37. [Google Scholar] [CrossRef]
  24. Gauthier, B.; Painchaud-April, G.; Le Duff, A.; Belanger, P. Ultrasonic Multi-view Data Merging using the Vector Coherence Factor. NDT E Int. 2023, 136, 102805. [Google Scholar] [CrossRef]
  25. ASTM E494-05; Standard Practice for Measuring Ultrasonic Velocity in Materials. ASTM International: West Conshohocken, PA, USA, 2005.
  26. Li, W. Non-Destructive Testing Manual, 2nd ed.; Chapter Ten; Machinery Industry Press: Beijing, China, 2012; pp. 43–44. [Google Scholar]
  27. Qi, Z.D.; Yang, Z.; Meng, X.F.; Guo, Q.Q.; Huang, S.X.; Yang, X.G. Hot deformation behavior and hot rolled properties of Gd-rich 316 L austenitic stainless steel neutron shielding material for spent nuclear fuel storage and transportation. Mater. Charact. 2024, 218, 114493. [Google Scholar] [CrossRef]
  28. Chen, Y.; Luo, Z.B.; Zhou, Q.; Zou, L.J.; Lin, L. Modeling of Ultrasonic Propagation in Heavy-walled Centrifugally Cast Austenitic Stainless Steel Based on EBSD Analysis. Ultrasonics 2015, 59, 31–39. [Google Scholar] [CrossRef]
  29. Zhang, J.; Drinkwater, B.D.; Wilcox, P.D.; Hunter, A.J. Defect detection using ultrasonic arrays: The multi-mode total focusing method. NDT E Int. 2010, 43, 123–133. [Google Scholar] [CrossRef]
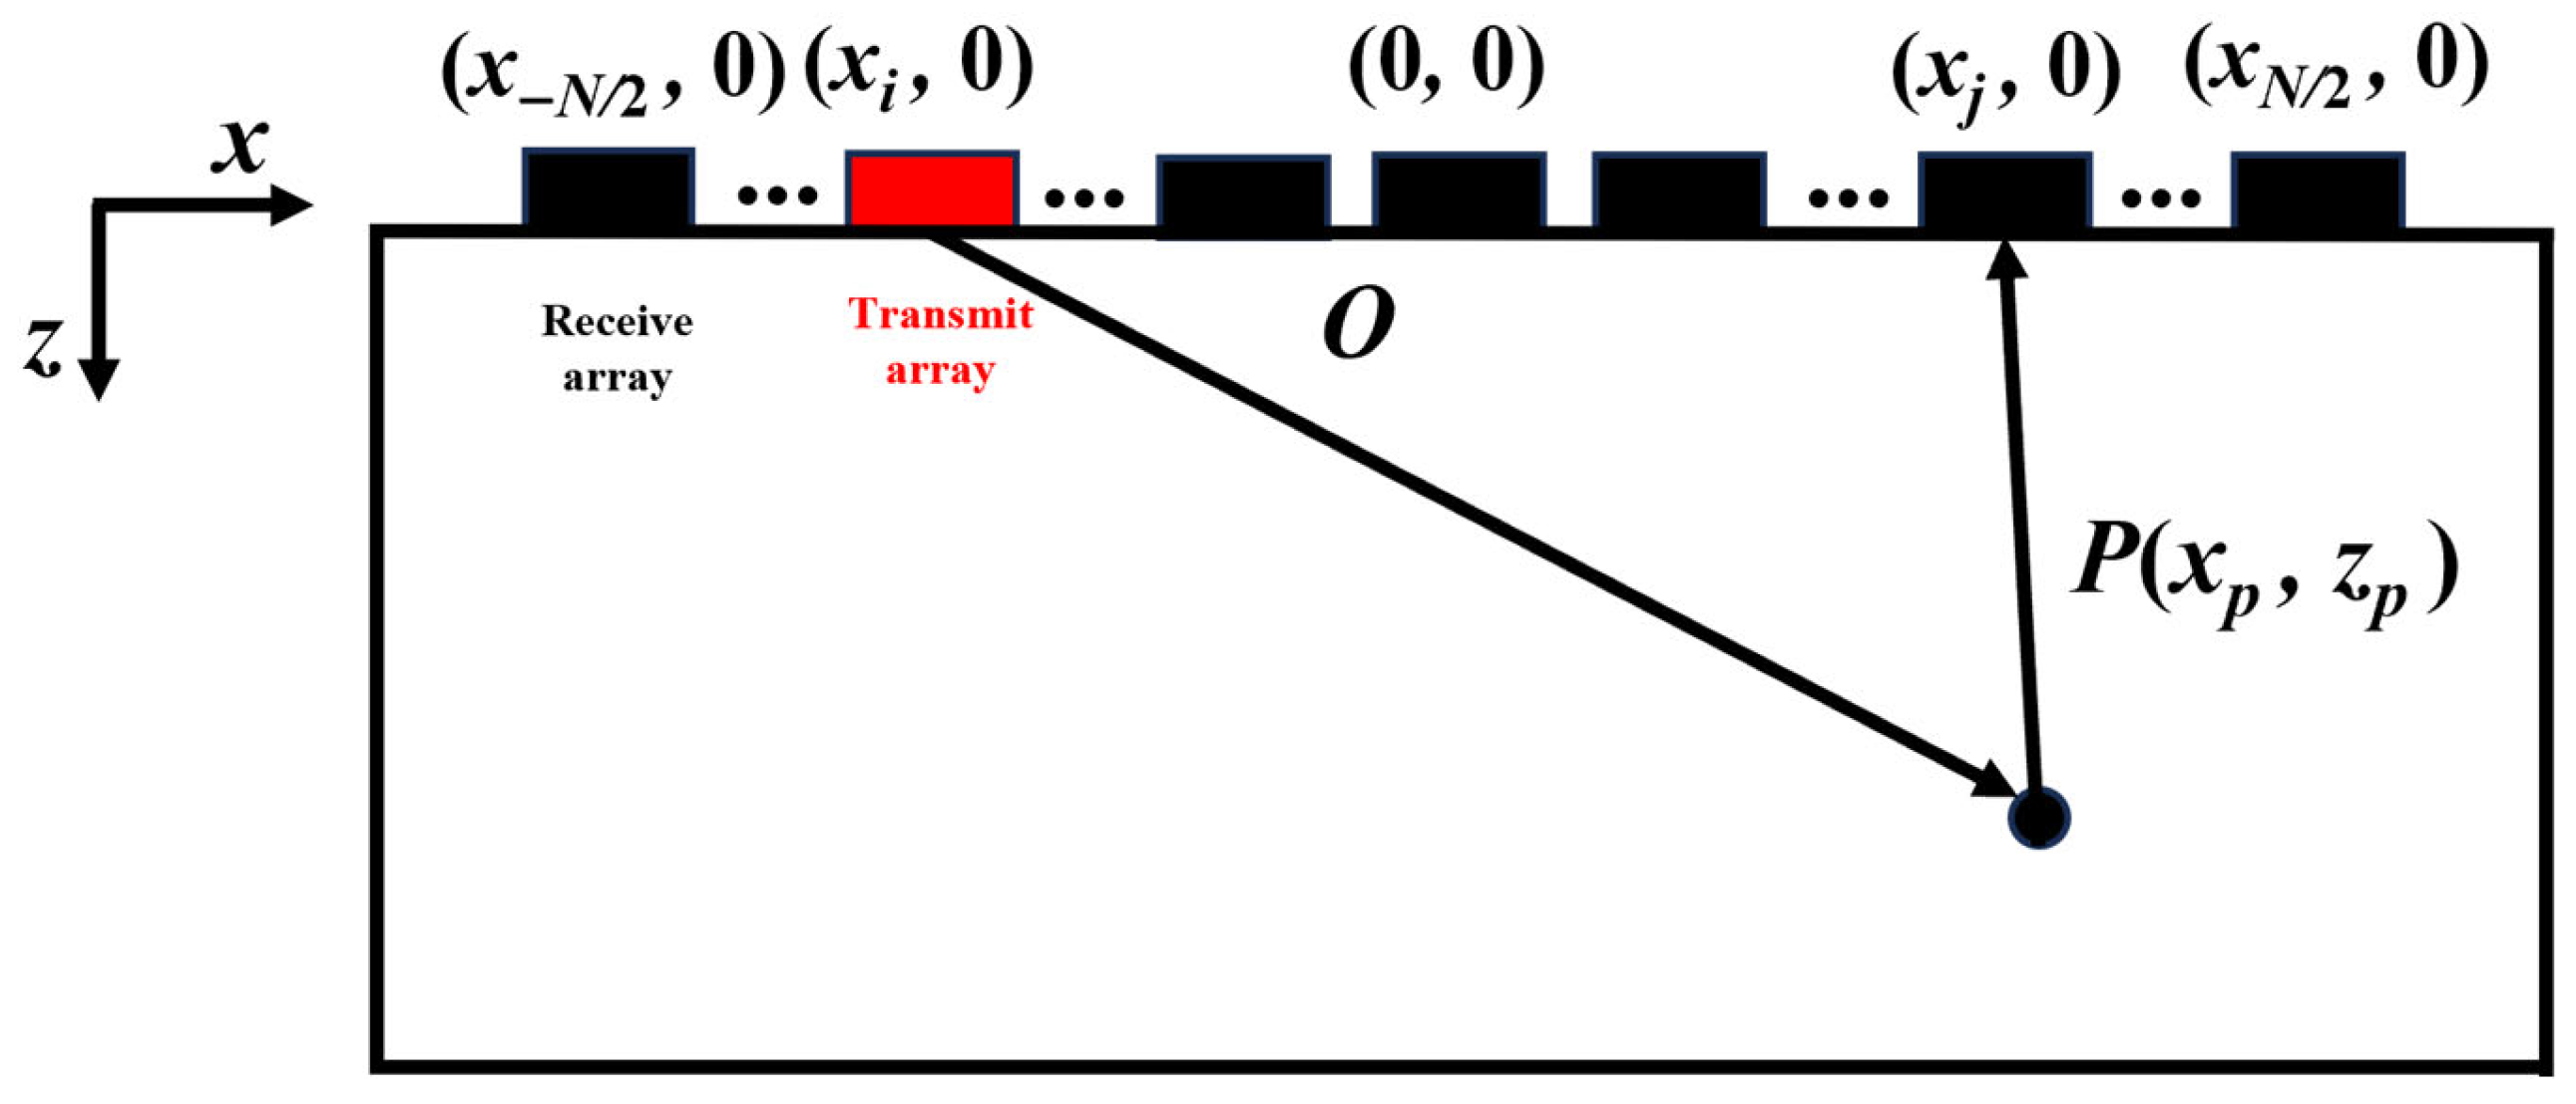
Figure 1. Schematic diagram of the TFM imaging principle.
Metals 15 00901 g001
Figure 2. Some austenitic stainless-steel weld test blocks exhibiting varying degrees of heterogeneity, with side-drilled holes: (a) 1# ‘weak’; (b) 2# ‘medium’; (c) 3# ‘strong’.
Metals 15 00901 g002
Figure 3. EBSD atlas of austenitic stainless-steel welds with different heterogeneity levels: (a) test block (1#); (b) test block (2#); (c) test block (3#).
Metals 15 00901 g003
Figure 4. Schematic diagram of VCF distribution analysis.
Metals 15 00901 g004
Figure 5. The probability distribution of the VCF for different heterogeneous austenitic stainless-steel test blocks.
Metals 15 00901 g005
Figure 6. Comparison of simulation imaging results of the VCF-T-TFM for defect No. 1 under different probability thresholds PT: (a) 90%; (b) 99%; (c) 99.9%.
Metals 15 00901 g006
Figure 7. Comparison of simulation imaging results of defects in carbon steel and austenitic stainless steel before and after coarse-grain coherent compensation.
Metals 15 00901 g007
Figure 8. Imaging comparison of different heterogeneous regions in austenitic stainless steel: (a) test block (1#); (b) test block (2#); (c) test block (3#).
Metals 15 00901 g008
Figure 9. Imaging results of side-drilled-hole defects in the weld seam of austenitic stainless steel: (a) 1# TFM; (b) 1# VCF-TFM; (c) 1# VCF-T-TFM; (d) 2# TFM; (e) 2# VCF-TFM; (f) 2# VCF-T-TFM; (g) 3# TFM; (h) 3# VCF-TFM; (i) 3# VCF-T-TFM.
Metals 15 00901 g009
Figure 10. Comparison of the imaging SNR of side-drilled-hole defects in austenitic stainless-steel welds using different imaging methods.
Metals 15 00901 g010
Table 1. Material parameters of austenitic stainless-steel weld test blocks with different homogeneity levels.
Test Block NumberMaterialWelding Procedure
1#Z2CN18-10-MPlasma arc welding
2#Z2CN18-10-MPlasma arc welding
3#X2CrNiMo18-12 (nitrogen-controlled)Narrow gap automatic welding
Table 2. Measurement results of acoustic parameters of austenitic stainless-steel welds with different degrees of heterogeneity.
Test Block NumberLongitudinal Wave Velocity
(m/s)
Attenuation Coefficient
(dB/mm)
1#5826.5~5860.30.15~0.19
2#5769.2~5836.30.16~0.21
3#5624.3~5706.80.18~0.25
Disclaimer/Publisher’s Note: The statements, opinions and data contained in all publications are solely those of the individual author(s) and contributor(s) and not of MDPI and/or the editor(s). MDPI and/or the editor(s) disclaim responsibility for any injury to people or property resulting from any ideas, methods, instructions or products referred to in the content.