3.1. Anisotropic Earing and Deformation Heterogeneity in Deep Drawing
To comprehend the relationship between the crystal rotation kinematics of deep drawing and earing behavior, we adapted a CPFEM and compared the simulated results with the experimental findings on aluminum single crystals obtained from the study conducted by Tucker [
33]. Subsequently, we focused on the development of crystal rotation induced by deep drawing kinematics for cube orientation. The development of earing behavior resulting from crystal rotation will be discussed for cube orientation in the following sections. In this study, the RD, TD, and ND of the sample coordinates are the X, Y, and Z axes, respectively (
Figure 1). The position of a pole figure can be described using the azimuthal angle
, and the radial angle
is illustrated in a pole figure shown in
Figure 1b.
The values of the work-hardening parameters listed in
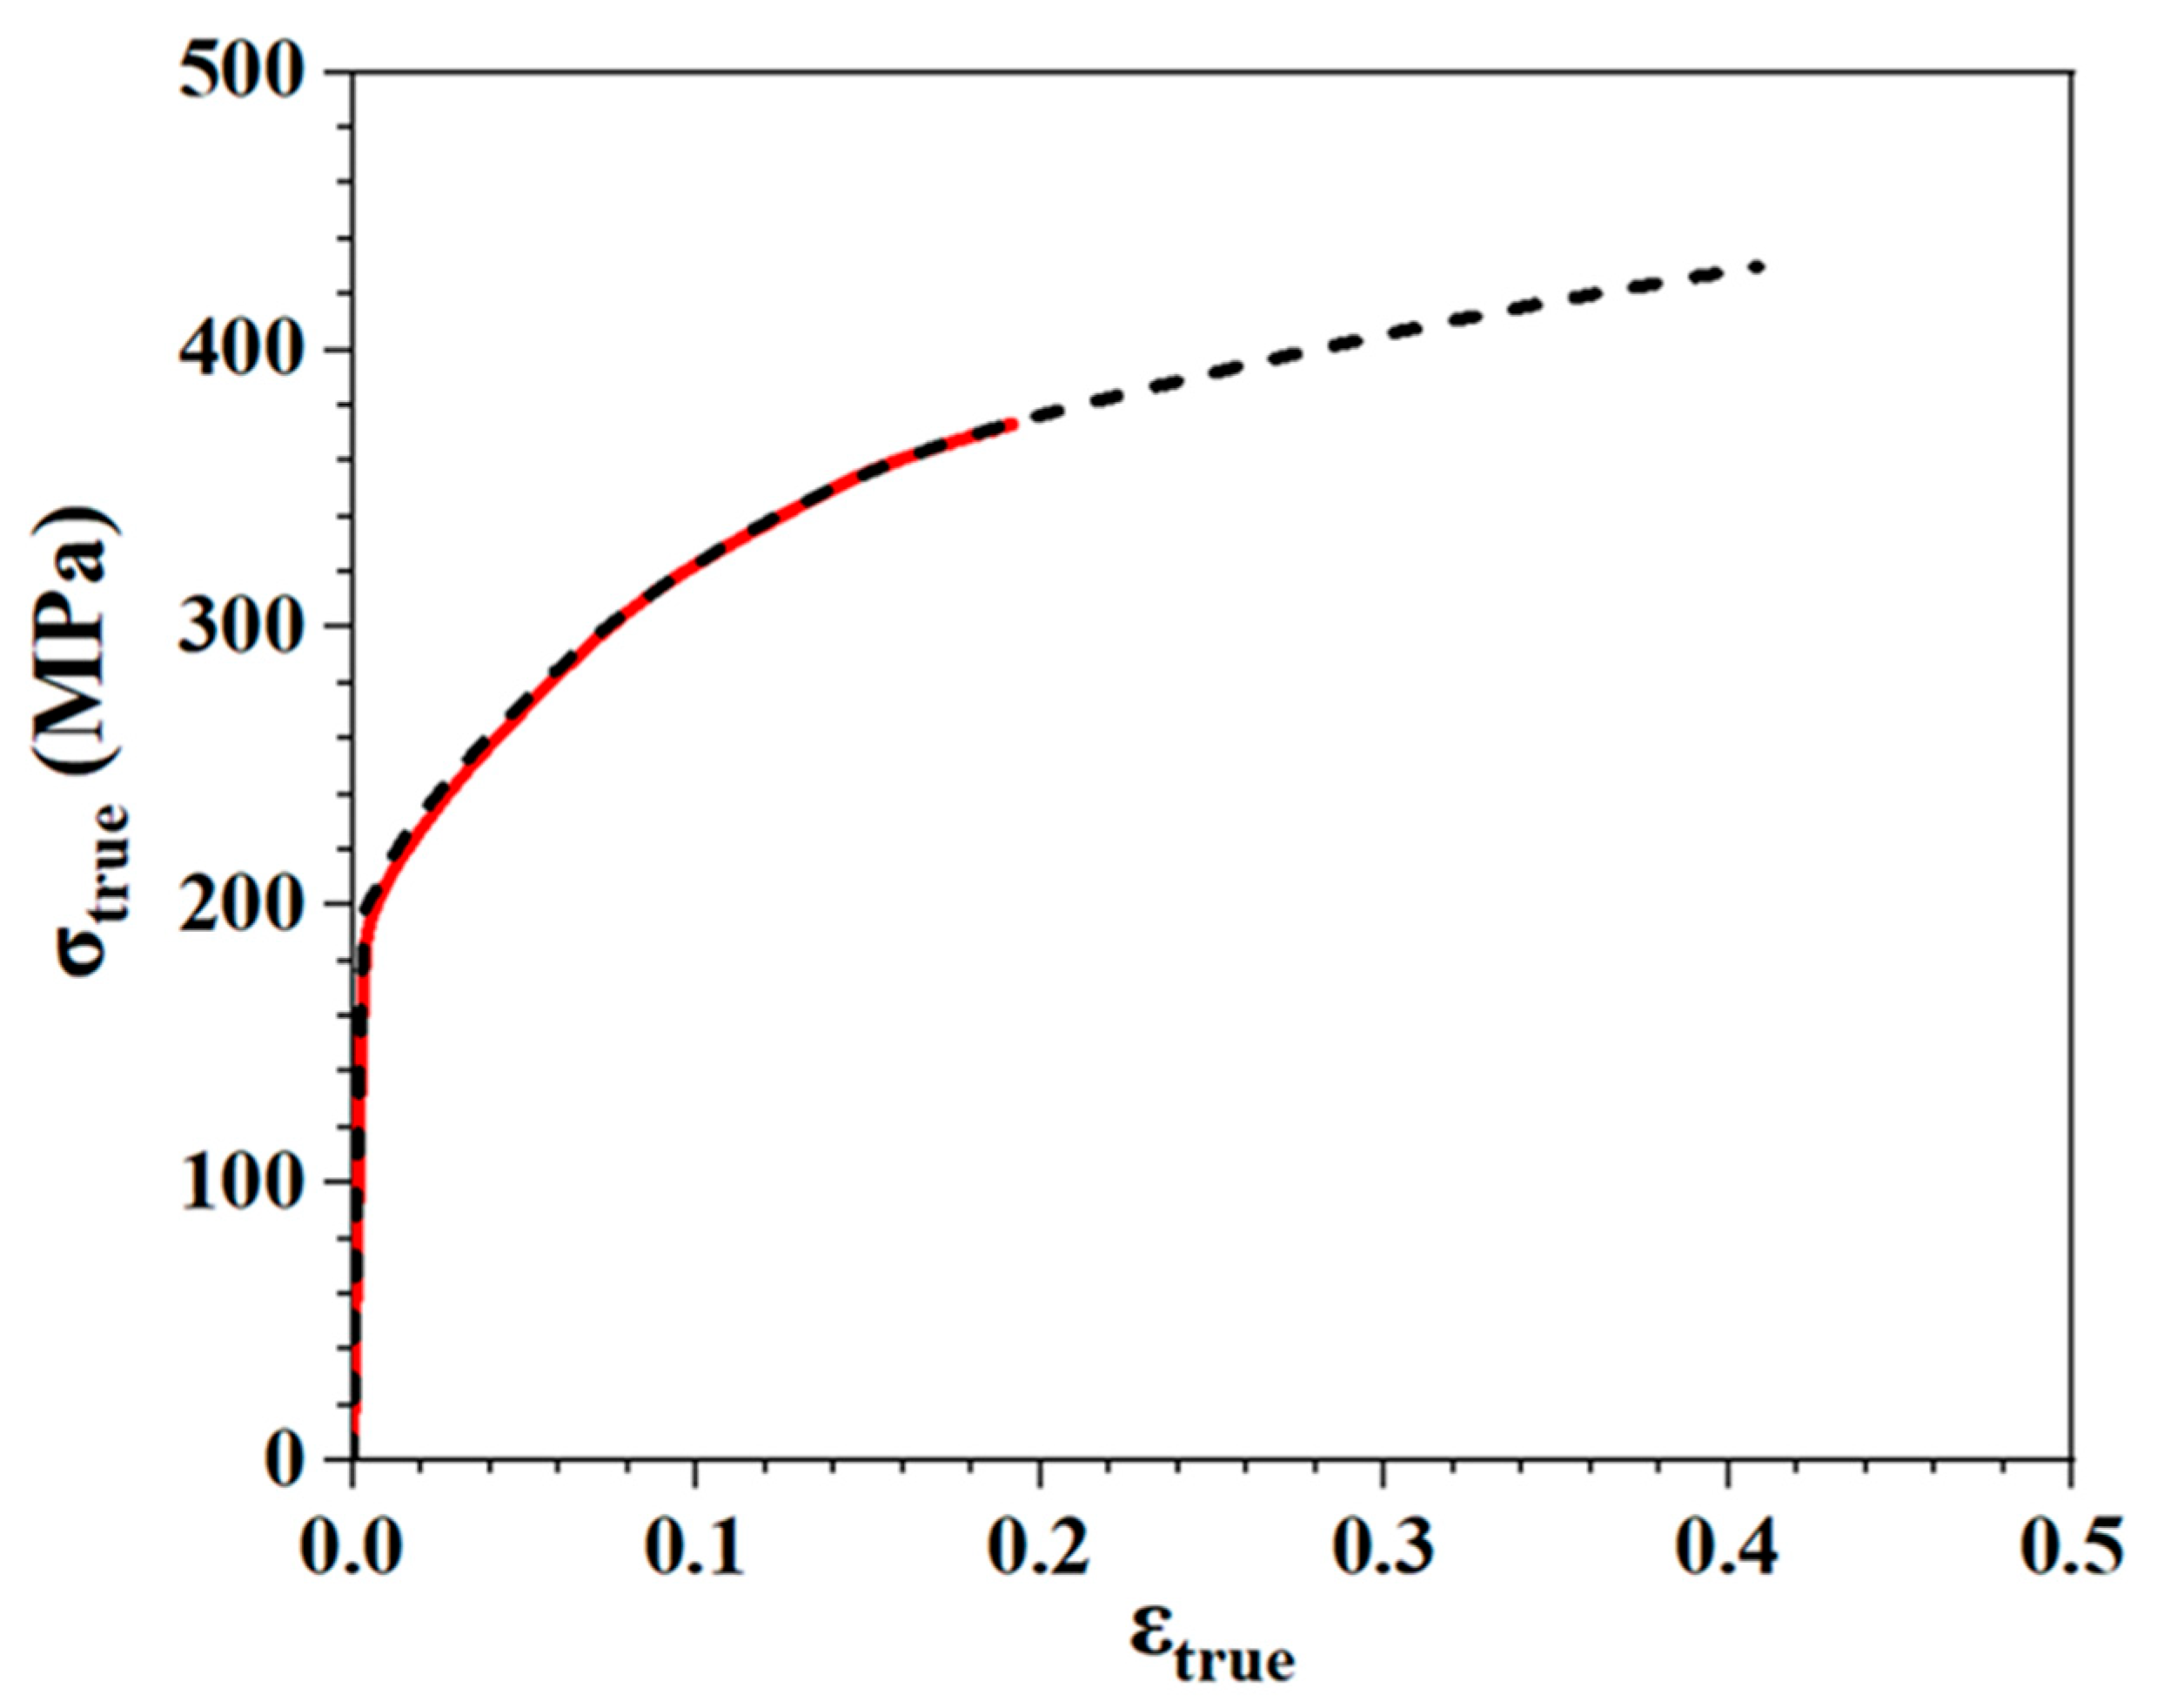
Table 3 were used to plot the stress–strain curve under uniaxial tension through numerical simulations along the RD, as shown in
Figure 3, where the numerical model has one element with a thickness of 3.2 mm. The predicted stress–strain curve corresponded to the experimental data obtained in a previous study [
34] (
Figure 4). The material model could accurately capture the anisotropic yield and the differential work hardening observed experimentally. The experimental data on the earing profile collected by Tucker [
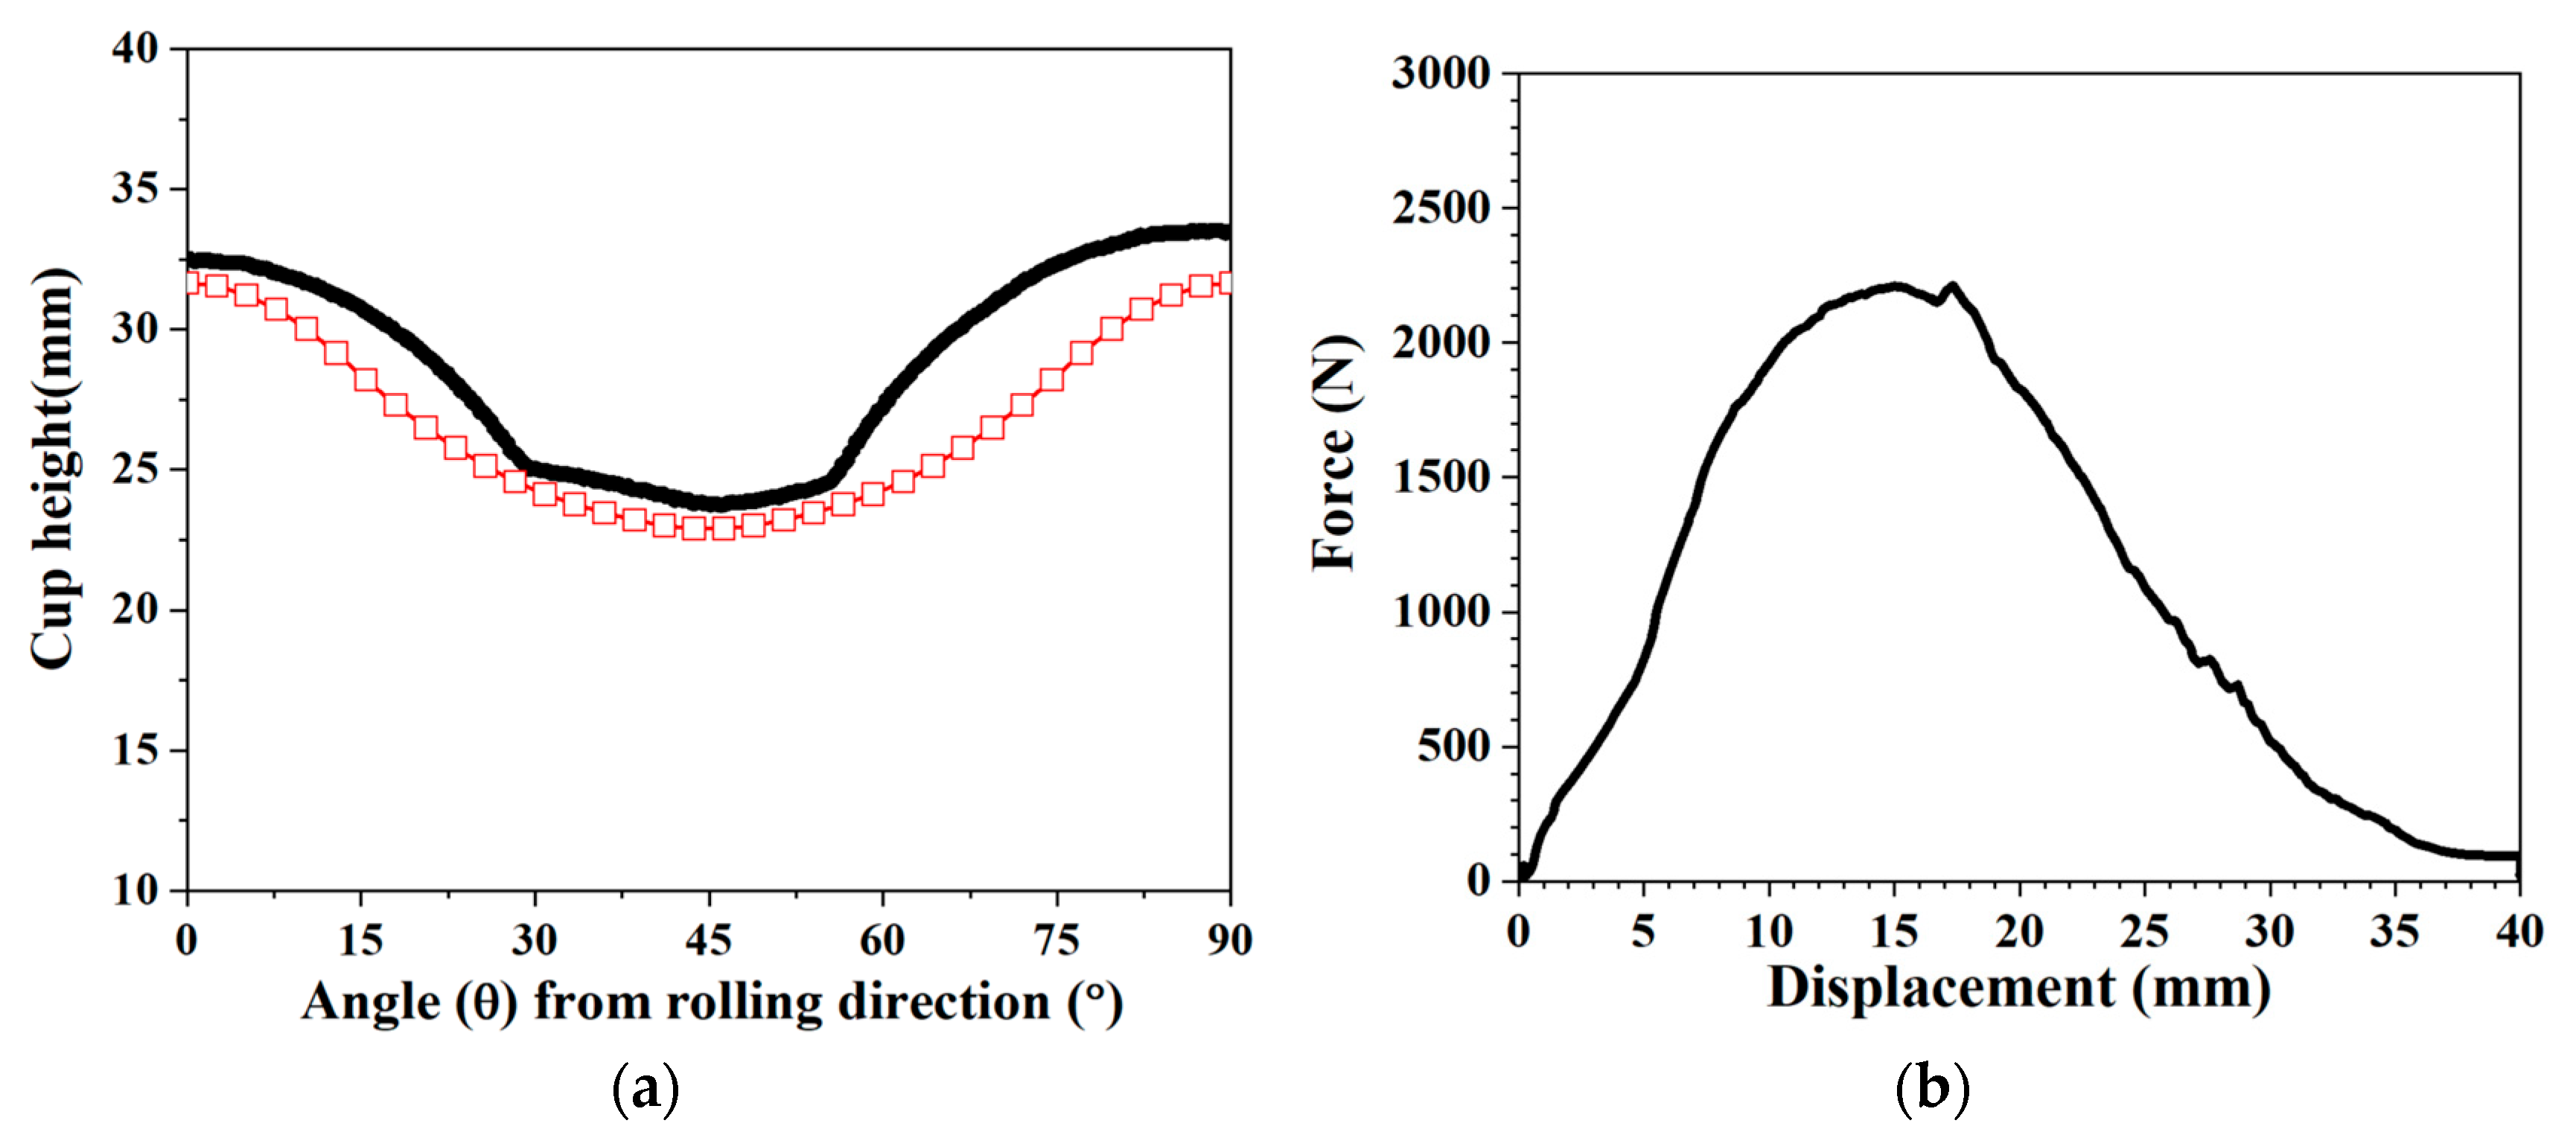
33] were employed in the comparison with the cup height predicted using the CPFEM (
Figure 5a). For the cube orientation {001}<100>, two ears were formed in the simulation and experiment at azimuthal angles (
) of 0° and 90° with respect to the RD in the range of 0–90°, that is, four ears at
= 0°, 90°, 180°, and 360°, owing to sample symmetry.
Figure 5a shows the cup height plotted with respect to
. The simulation and experimental results show two ears at
= 0° and 90°. The agreements were reasonable in terms of the cup height prediction, although the absolute cup height could not be determined due to the lubrication condition during deep drawing. In addition, the CPFEM results were used to plot the punch force–displacement curve of the deep drawing process (
Figure 5b).
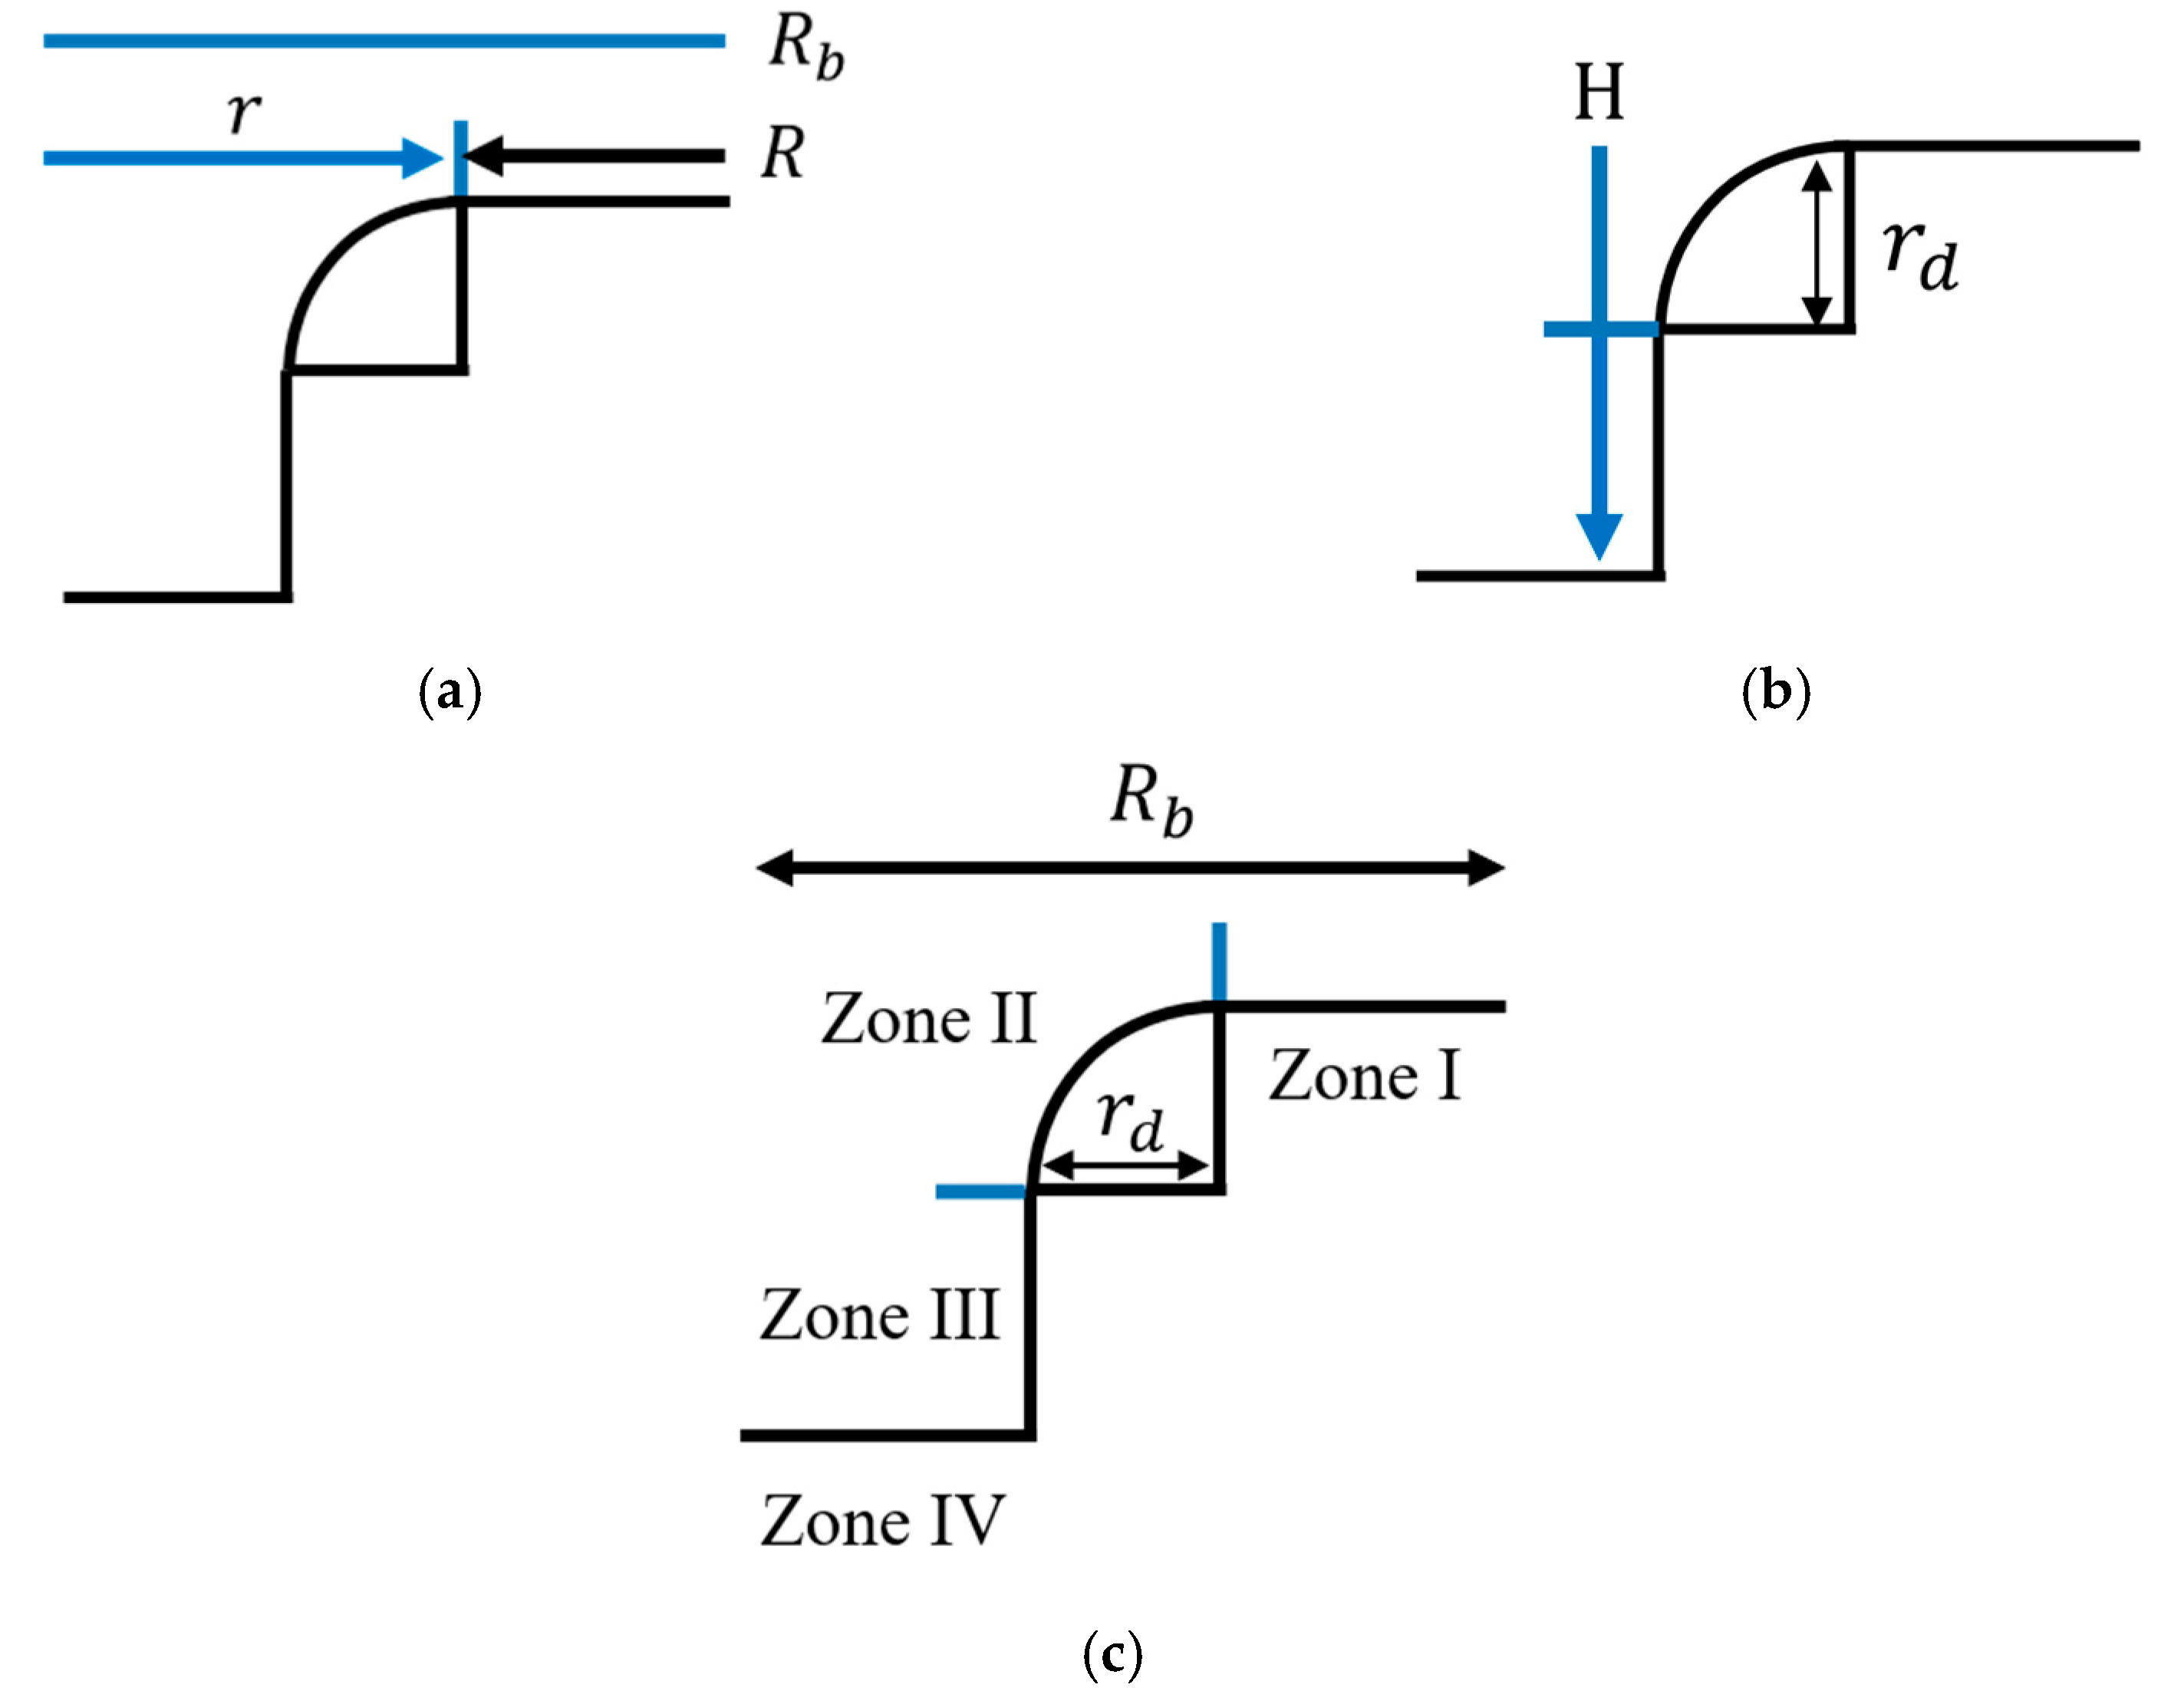
The specified position A of the cup shape during deep drawing can be described by the
position along the ND, as shown in
Figure 6b, and by the radial position
and circumferential position
along the
and
directions in the coordinates of the RD and TD planes, where the drawing depth
is used for position Z of the cup. The radial positions of
and
=
−
imply the distance measured from the center and that measured from the rim of the circle, respectively (
Figure 7a). In addition, the drawing depth
and radial distance
are expressed in terms of the die radius
as
and
, respectively. With this, the current position of a given node during deep drawing can be specified.
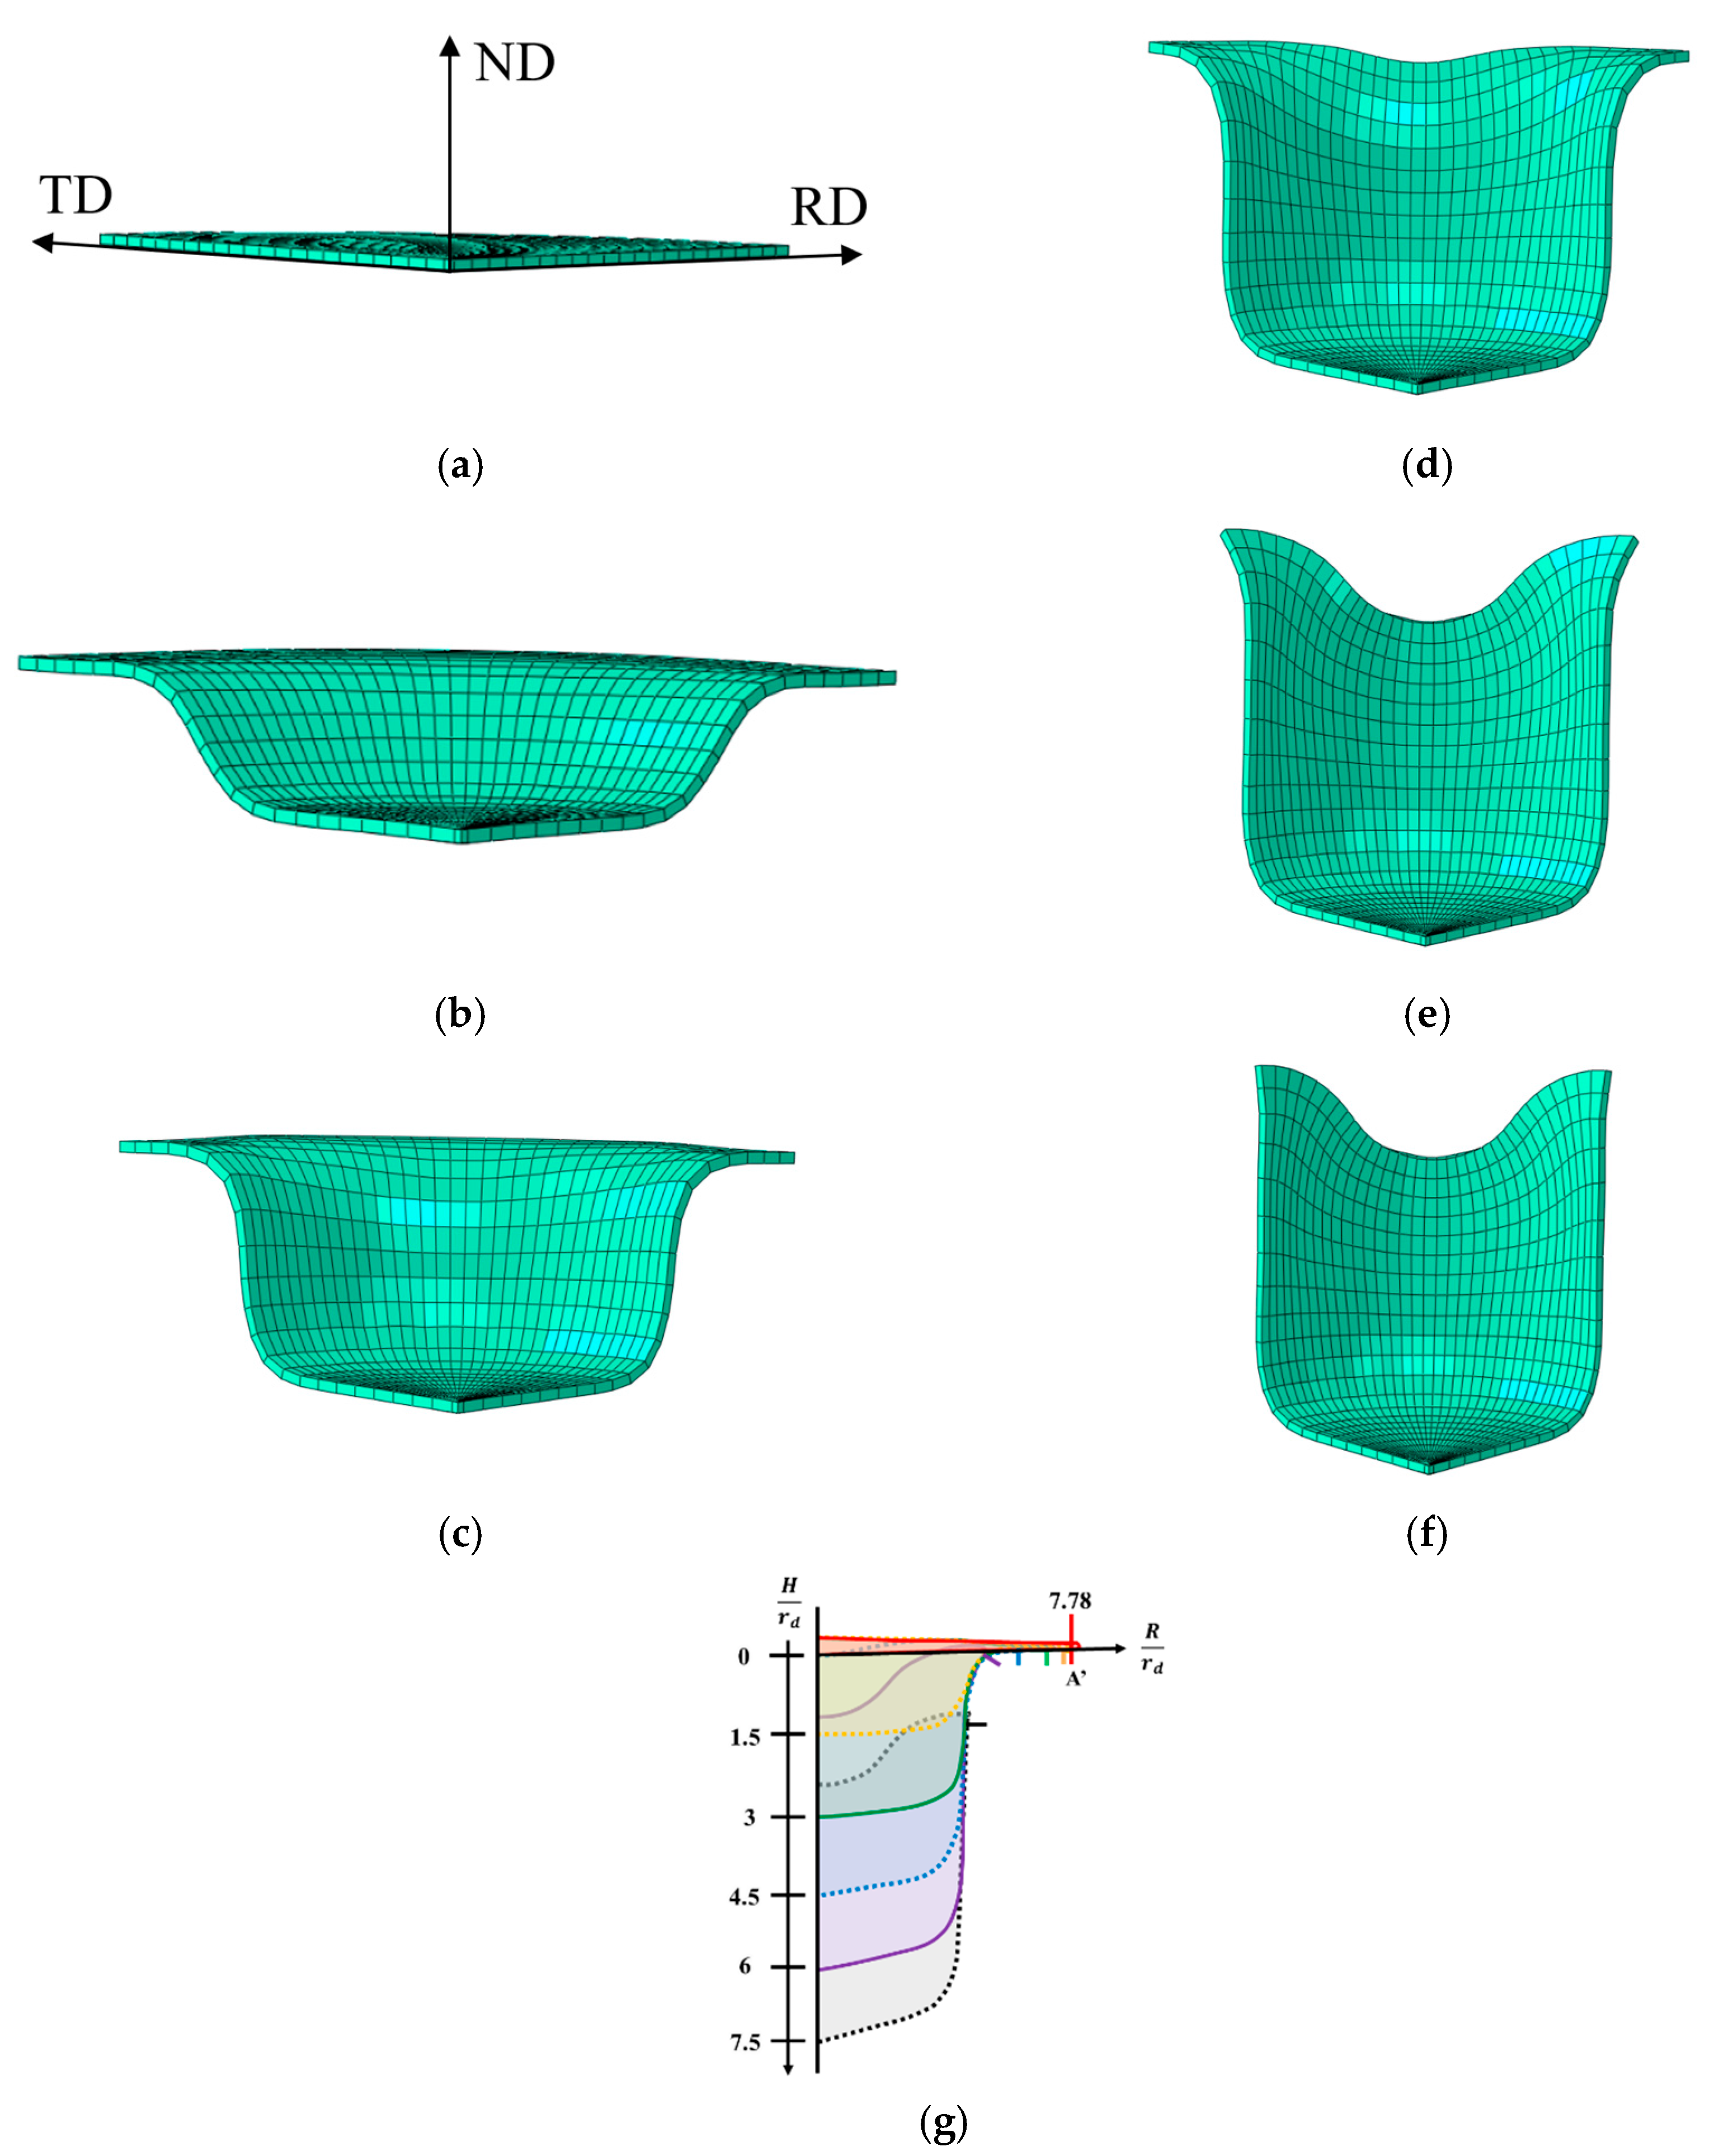
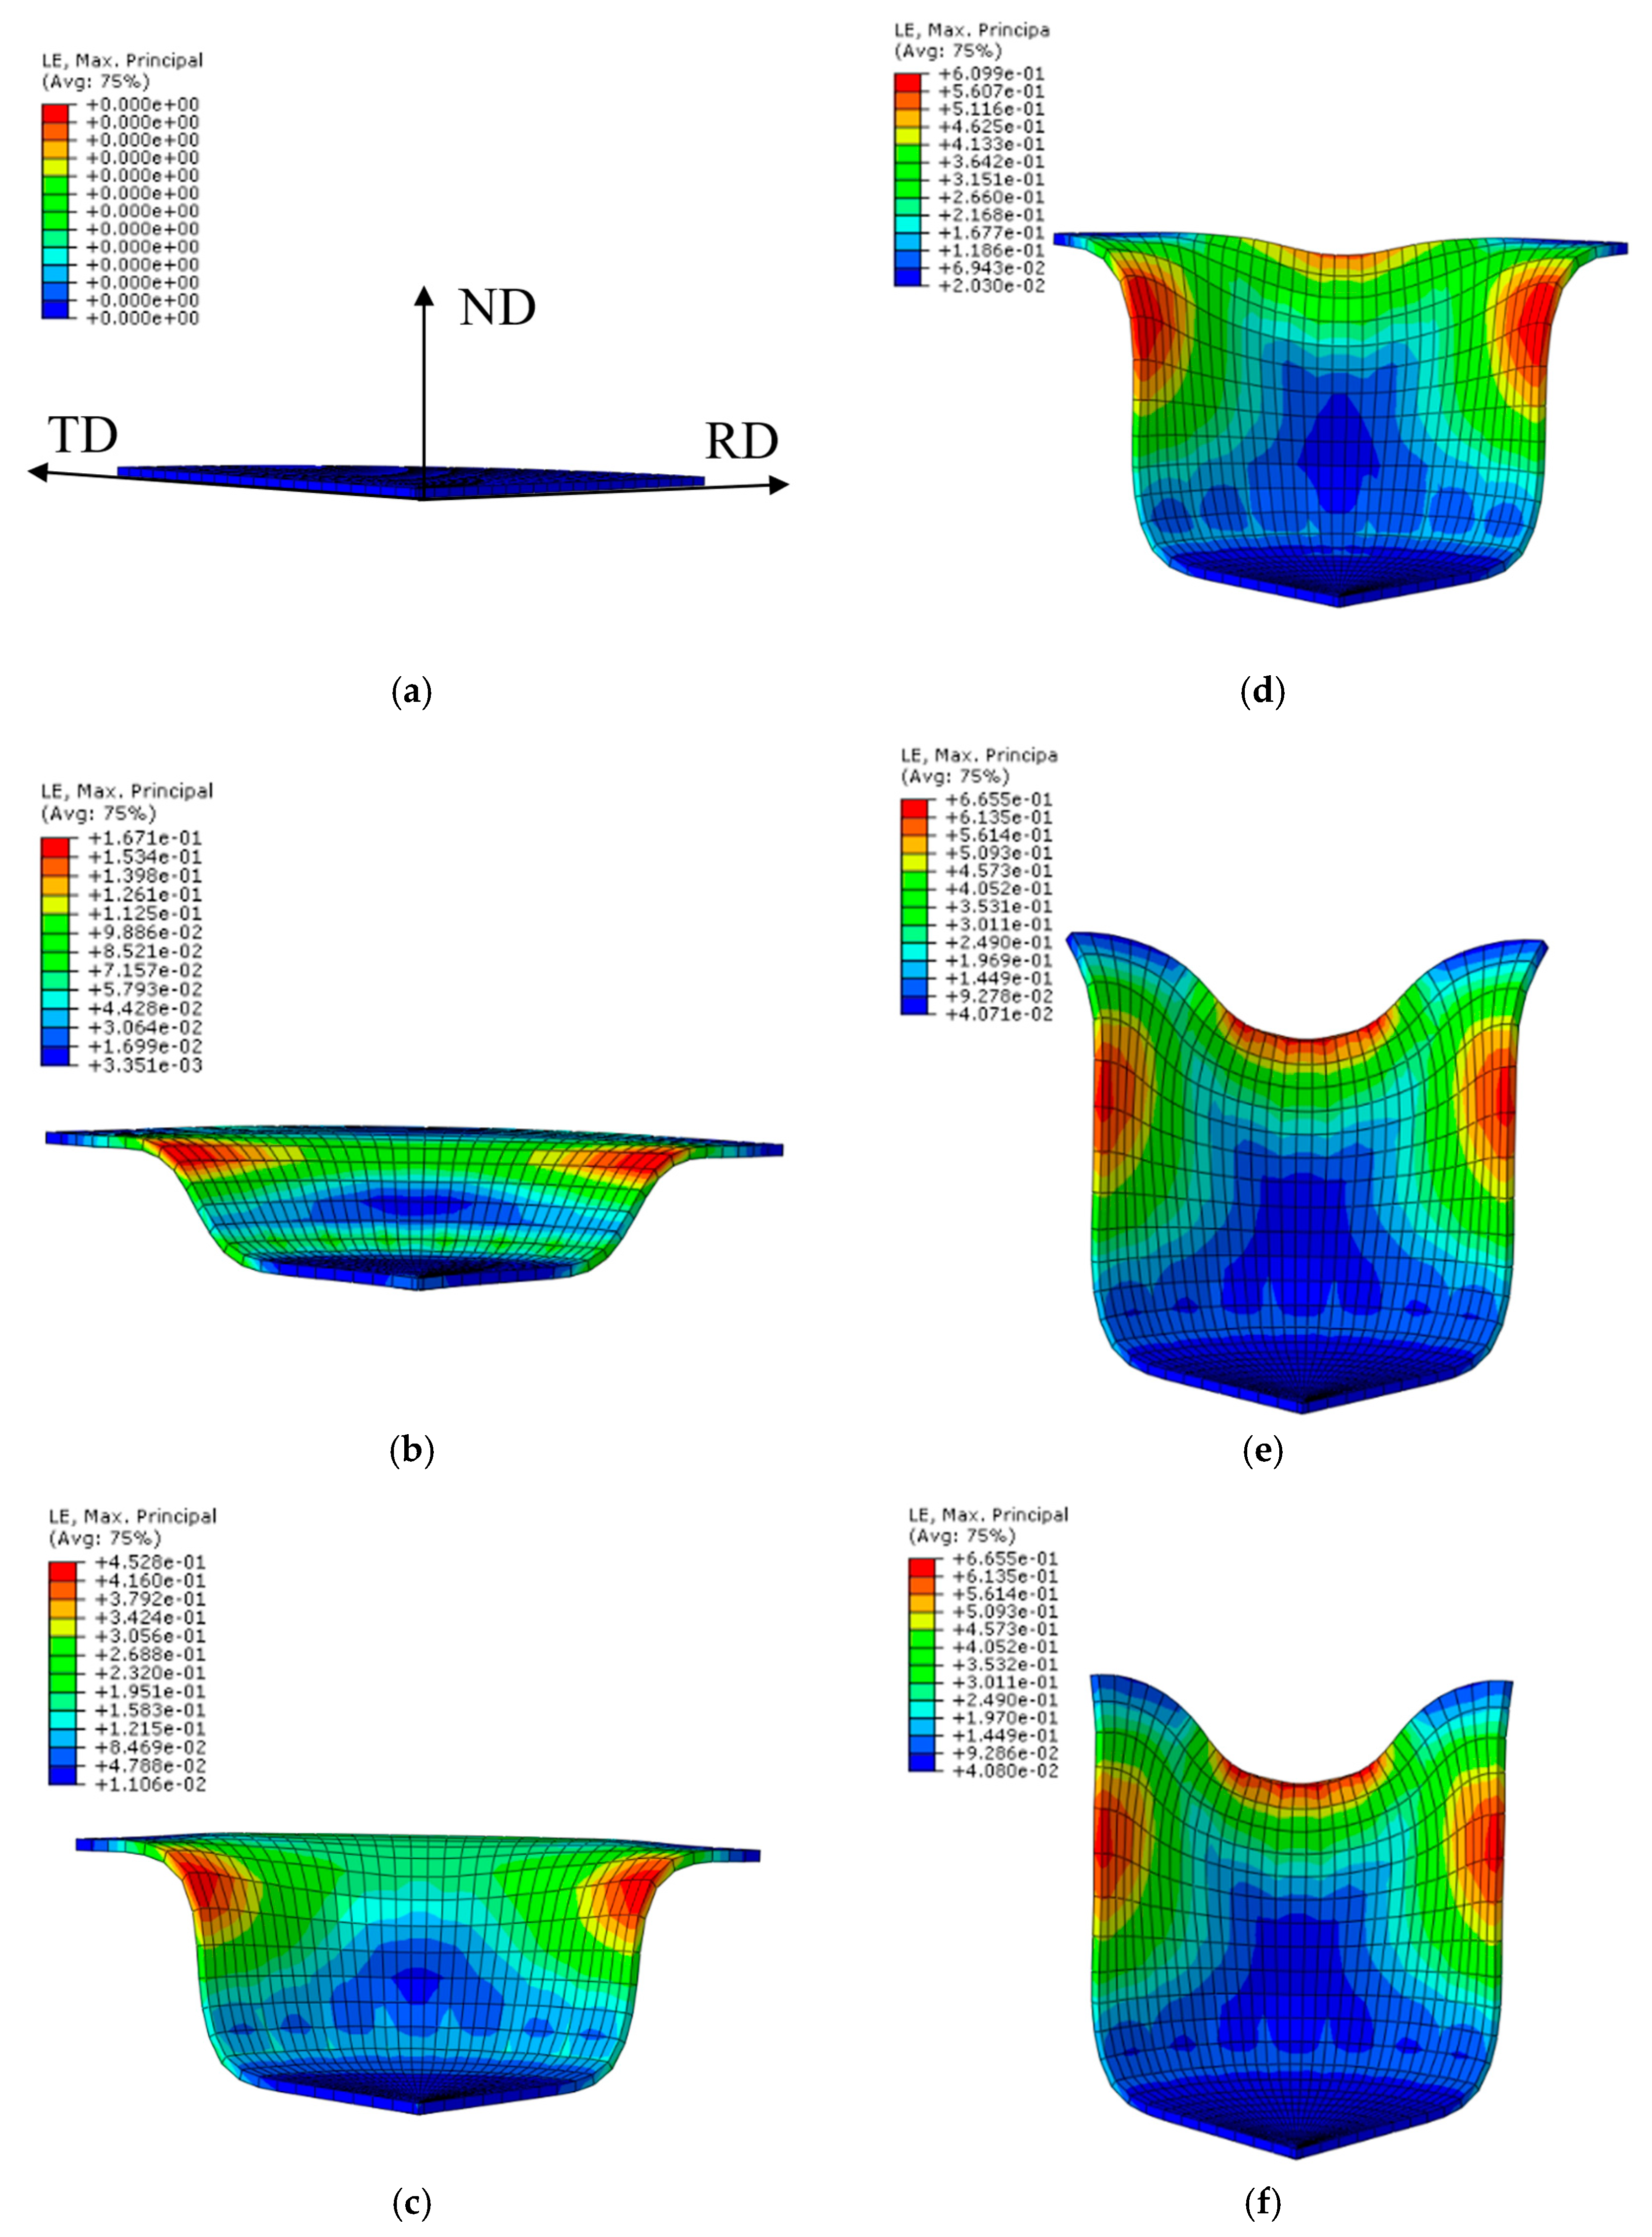
Figure 8 and
Figure 9 show the cup shape and strain field contour in the drawn cups as a function of the drawing depth using the
ratio, respectively. In terms of the cup shape, the drawn cup can be split into three zones: a cup flange (Zone I), the transition region between the flange and the wall (Zone II), and the cup wall (Zone III) and cup bottom (IV) (
Figure 7c). The stresses at the various regions of the cup, i.e., bottom, wall, and flange, are different, and the normal stress component is neglected. The cup flange (Zone I) is under tensile stress along the RD and compressive stress along the circumferential direction. The cup wall (Zone III) and cup bottom (Zone IV) are in a biaxial tensile stress state. During material flow from the flange into the die, the bending of the sheet metal (Zone II) induces tensile and compressive bending stresses in the outermost and innermost layers, respectively.
The principal strains at an angle of
α = 0° completely differed from those at
α = 45° (
Figure 9d–f)). The cup shapes and principal strain contours revealed a complex local deformation depending on the position at angle
with respect to the RD. Herein, we traced the initial positions A–F at
0°, 45°, which corresponded to the final positions A’–F’ at the cup bottom, wall, and flange (
Figure 6).
3.2. Effect of Drawing Process on the Lattice Rotation
To determine the lattice rotation, the orientation evolution at the given positions A–F in
Figure 9 during deep drawing must be identified. In this study, we expressed the crystal orientation
of a single crystal with respect to the sample coordinates in the RD, TD, and ND directions (
Figure 1). For a CPFEM simulation, cube orientation refers to the initial orientation of aluminum single crystals and serves as the reference orientation. Considering that position A has a given orientation
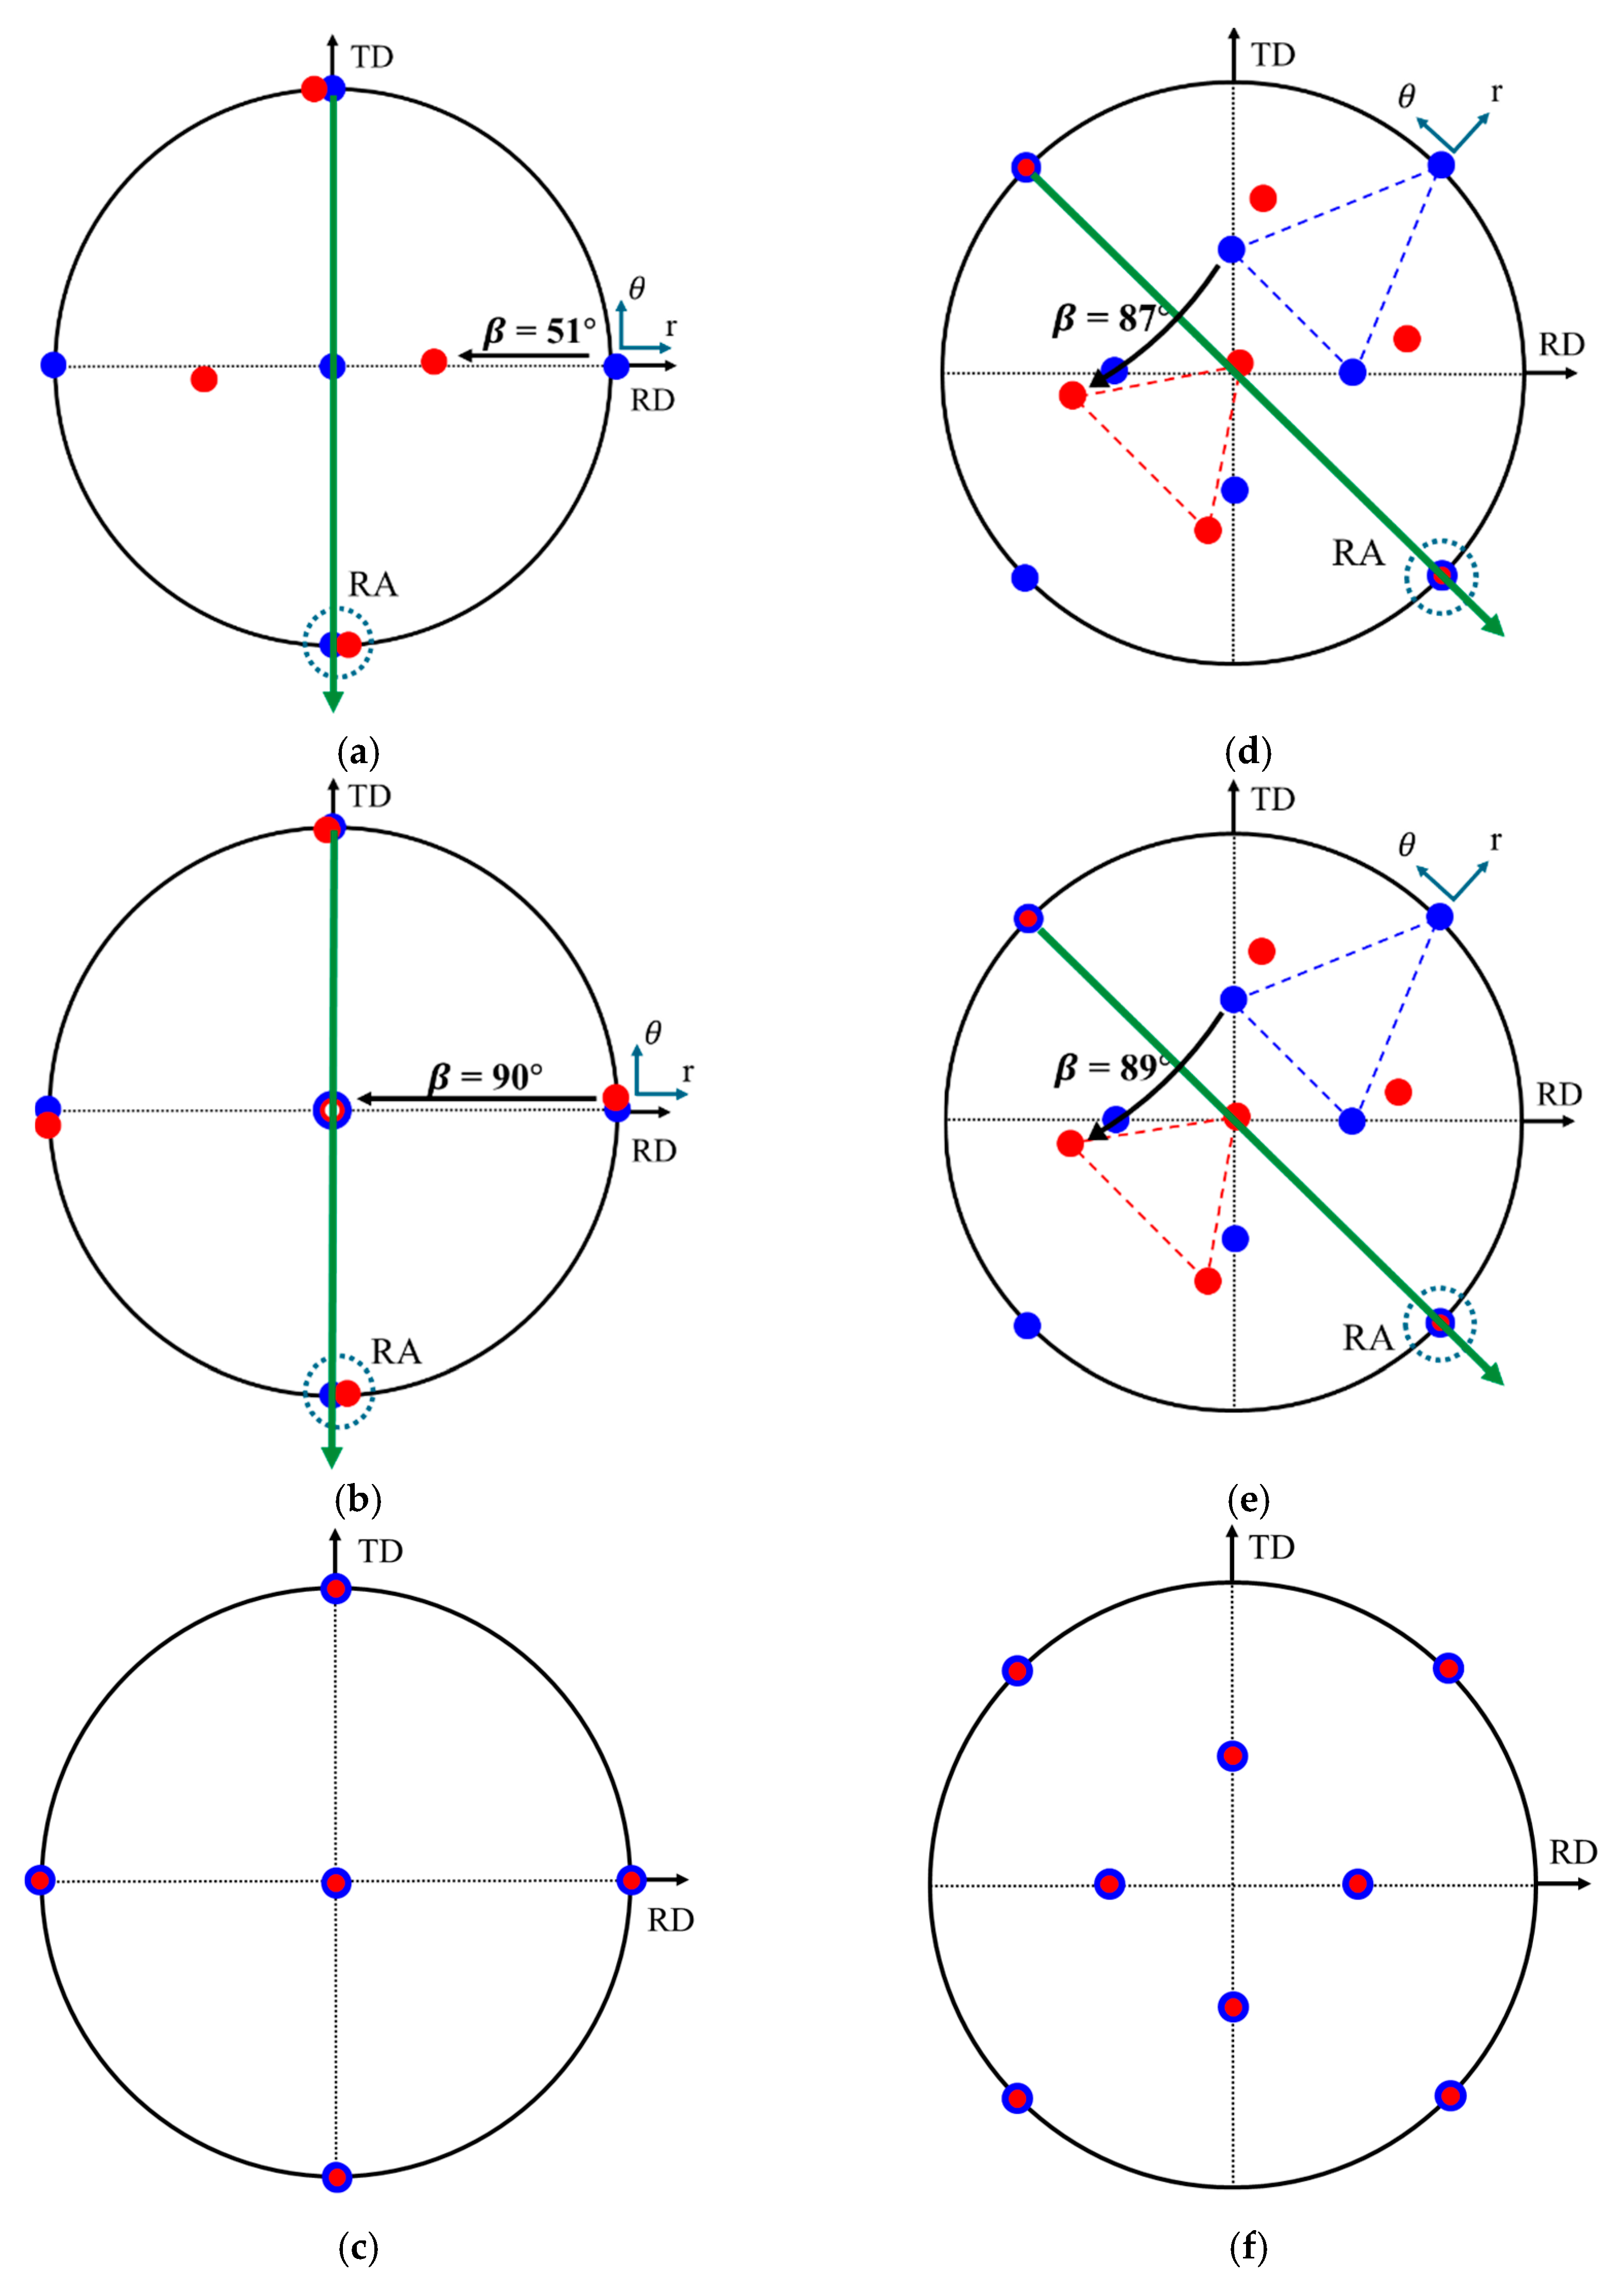
of the cube marked in blue, the {100} pole figure with all {100} poles can be visualized as the NDs of the {100} planes with respect to the RD and TD (
Figure 10a).
After deep drawing, position A changed its orientation to the orientation
of position A’ with Euler angles of 274°, 51°, and 90° marked in red. The rotation from orientation A marked in blue is expressed by the rotation angle
= 51°, which is counterclockwise to the rotation axis (
) of
with respect to the A’ orientation marked in red. A comparison of the {010} pole figures of A and A’ revealed that these poles were largely at the same position RA in
Figure 10a. Such an outcome was observed because the RA remained unchanged, whereas the other poles changed their positions through the rotation of angle
= 51°. The vector of
=
was directed from the center to the
pole parallel to the negative TD. The lattice rotation can be expressed using the rotation axis
=
between the initial orientation
and orientation
at A and A’ positions after drawing.
Considering the different positions at
after deep drawing with
= 6, we determined the {100} poles of positions A’, B’, and C’ at the cup flange (Zone I), cup wall (Zone III), and cup bottom (Zone IV) after the deep drawing (
Figure 10a–c). Biaxial tension occurred in Zone IV, with
σ1 =
σr =
σ2 =
σθ > 0 and
σ3 =
σt = 0, which led to
and
. Although the blank thickness decreased in this region of Zone IV, according to the predictions made by applying the von Mises yield criterion and associated flow rule, plastic deformation barely occurred owing to the high flow stress [
35]. The {100} poles of the C’ position in Zone IV with Euler angles of 270°, 0°, and 90° at the cup bottom remained at the same position without any rotation, as shown in
Figure 10c. Thus, lattice rotation did not occur here. In Zones I and II, the plane stress states were the maximum principal stress
σ1 =
σr > 0, the medium one
σ2 =
σt = 0 (near zero), and the minimum one
σ3 =
σθ < 0, resulting in incremental principal plastic strains:
,
, and
. Detailed discussions on the relationship between the stress and plastic strain components can be found in a previous work [
35]. Thus, the blank thickness in this region increased. Position A’ in Zone I with Euler angles of 274°, 51°, and 90° at the cup flange showed a lattice rotation by
=
(
Figure 10a). In Zone III, plane strain occurred, and the stress states can be expressed as
σ1 =
σr > 0 and
σ2 =
σθ = 1/2
σr > 0 due to the von Mises yield criterion and
σ3 =
σt = 0. Therefore,
,
, and
, that is, the blank thickness also decreased. Position B’ in Zone III with Euler angles of 273°, 90°, and 90° at the cup wall rotated the angle
of 90° at the rotation axis
by
=
, as shown in
Figure 10b. Therefore, for the positions at an inclination of
to the RD, the positions of A and B indicate the rotation axis of
.
For
α = 45°, after deep drawing with
= 6, we determined the {110} pole figures of the D’, E’, and F’ positions at the cup flange (Zone I), cup wall (Zone III), and cup bottom (Zone IV) (
Figure 10d–f). The {110} poles of the F’ orientation with Euler angles of 135°, 0°, and 225° in Zone IV at the cup bottom remained at the same position without rotation, as shown in
Figure 10f, that is, lattice rotation did not occur. Position D’ with Euler angles of 315°, 87°, and 45° in Zone I at the cup flange presented lattice rotation by
=
(
Figure 10d). Position E’ with Euler angles of 315°, 89°, and 45° in Zone III at the cup wall rotated the angle
= 90° at the rotation axis
by
=
(
Figure 10e).
From the results on the rotation axis at positions A–F for
α = 0° and 45°, positions A–C at
had the rotation axis of
and positions D–F at α = 45° exhibited a rotation axis of
. These observations suggest a direct dependence of the rotation axis on angle
. For
, the
=
was parallel to the negative TD, which could be derived by determining the tangent to the circle at
α = 0°, as shown in
Figure 10a,b. In addition, the tangent direction is defined using the circumferential direction
and corresponds to the rotation axis. Given the polar coordinates, the local coordinates of a specified position are given by the RD
and circumferential direction
, as shown in
Figure 10a,d, respectively. Therefore, the circumferential direction
can be defined as the rotation axis.
During deep drawing, the drawing trajectory, called the drawing path, which is constrained by the circular shape of the die, must be specified in the RD. In addition, the rotation axis, which lies along the circumferential direction, is perpendicular to the RD (
Figure 10a,d). Thus, we can propose an
-angle dependence relationship of
, which can be formulated with the angular position
measured from the RD in a counterclockwise manner as follows:
For the verification of this equation at α = 22°, we considered the cup flange and cup wall, denoted by G and H, respectively, at α = 22° with respect to the RD and with the same radius as the positions of A and B. After deep drawing, the new orientations of G’ and H’ predicted through the CPFEM simulation rotated to Euler angles of 298°, 82°, and 98° and 283°, 90°, and 331°, with Bunge’s definition expressed by rotation angle/axis 84° , 91° . Applying Equation (10), we found that the theoretical of was close to the simulated RA of . Only a slight difference between the theoretical and simulated angles was observed owing to the minimal distortion during deep drawing.
Figure 6a shows the local coordinates of a specified position given by the polar coordinate of the radial direction
, the circumferential direction
, and the thickness direction
. The radial and thickness directions of the local coordinates at a given position can be expressed using the rotation angle
measured from the RD about the ND. The orientation
of the position at
= 0° with Euler angles of
can be used to describe the relationship between the sample and local coordinates:
In addition, the radial
and thickness
directions of the position at
can be calculated as follows:
The relationship between the initial orientation
and orientation
in the RD at
with respect to the RD can be expressed as follows:
where
denotes the rotation matrix corresponding to the rotation of angle
at approximately the ND. This
-dependent orientation function was applied to predict the earing of single crystals according to [
33,
34,
35,
36,
37]. Thus, the orientation of the rim in a circular single-crystal blank is a function of the
angle measured from the RD using Equation (15).
Finally, it comes to the question of the ND rotation during drawing. In the process of deep drawing, the punch force loading on the circular blank causes the blank edge to wrap over the punch surface. This force at the cup bottom transfers to the cup wall, and the edge of the circular blank is radially pulled toward the die cavity. Thus, the cylindrical elements in the edge of the ring blank are subjected to the same radial tension of
and circumferential compression of
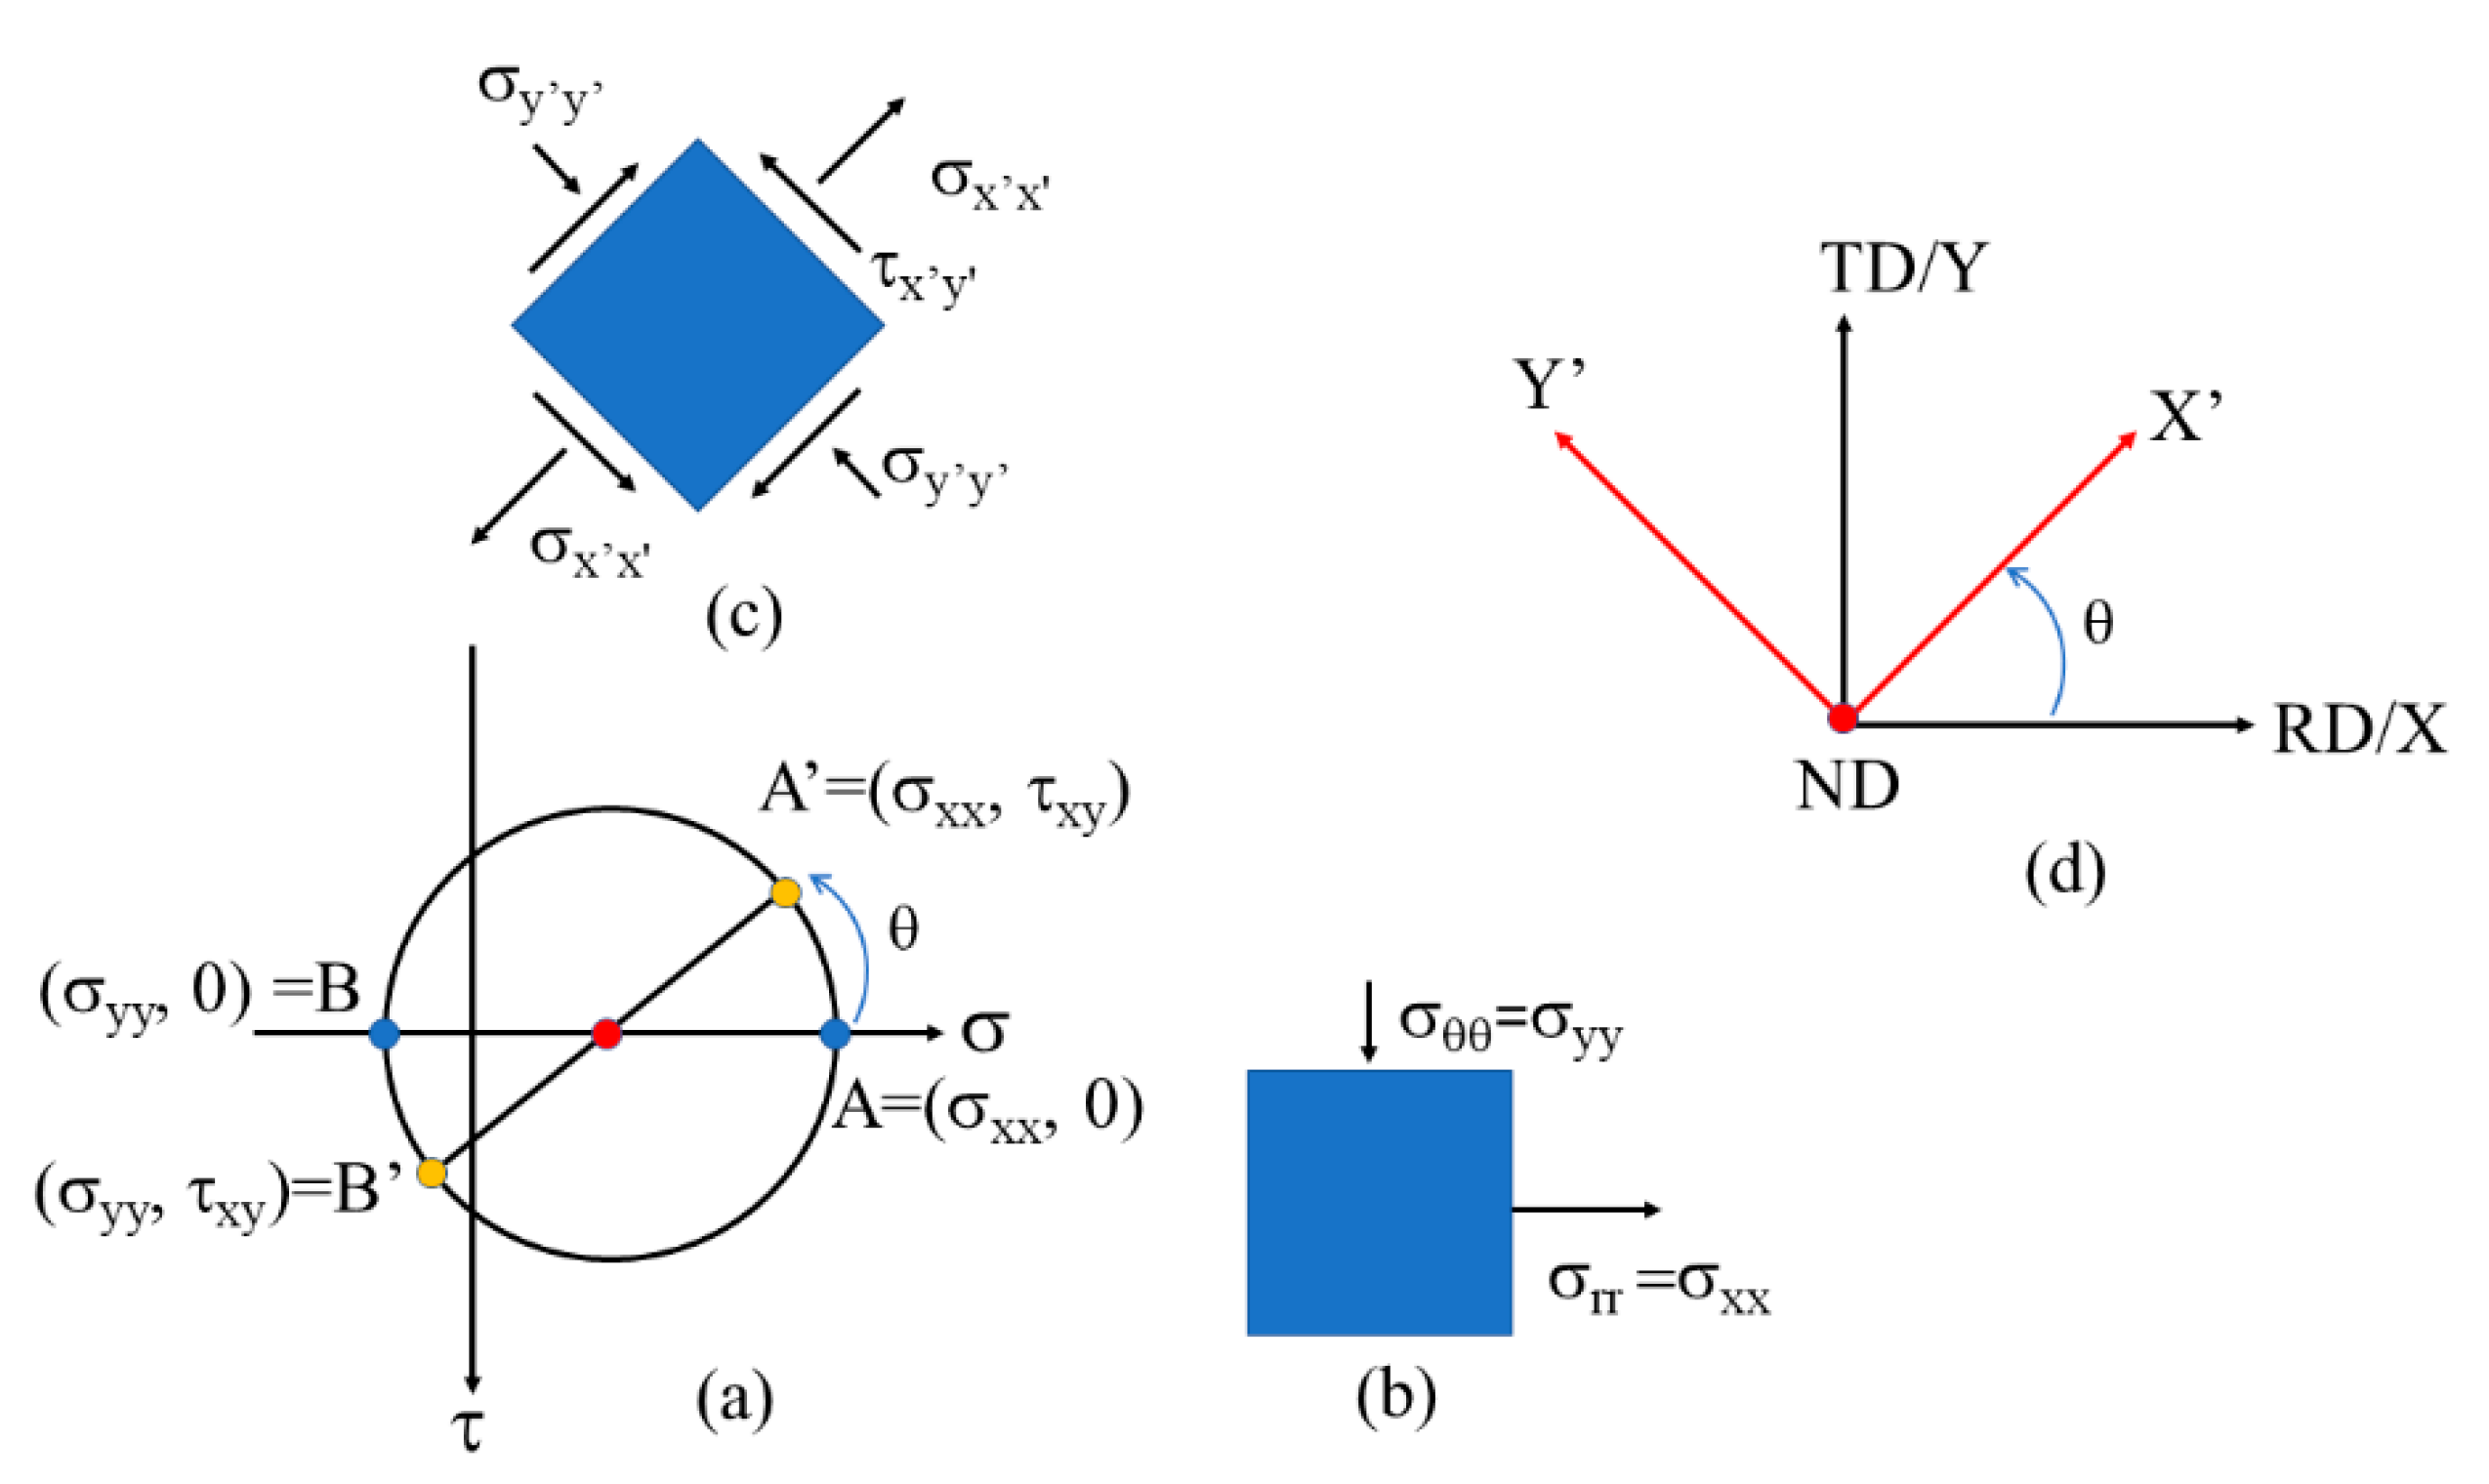
because the black edge is constrained by the blank holder. It is observed under the same sample coordinates of RD, TD and ND directions that the stresses after θ rotation show
,
and
using Mohr’s circle analysis in
Figure 11a. It is impossible to meet the constraint conditions of
and
because the stress of
is not equal to zero in
Figure 11c.
Consequently, the body rigid rotation along the ND direction shown in
Figure 11d is required in order to satisfy the conditions of the same
and
for the cylindrical elements. This relationship between the initial
orientation and
orientation of the cylindrical element at
with respect to the RD is expressed in Equation (15). With the help of the body rigid rotation along the ND, the stresses are
and
, and the body rigid rotation around the ND direction is found by comparing the pole positions between the {100} and {110} pole figures in
Figure 10c,f.
3.3. Effect of Bending Process on Lattice Rotation
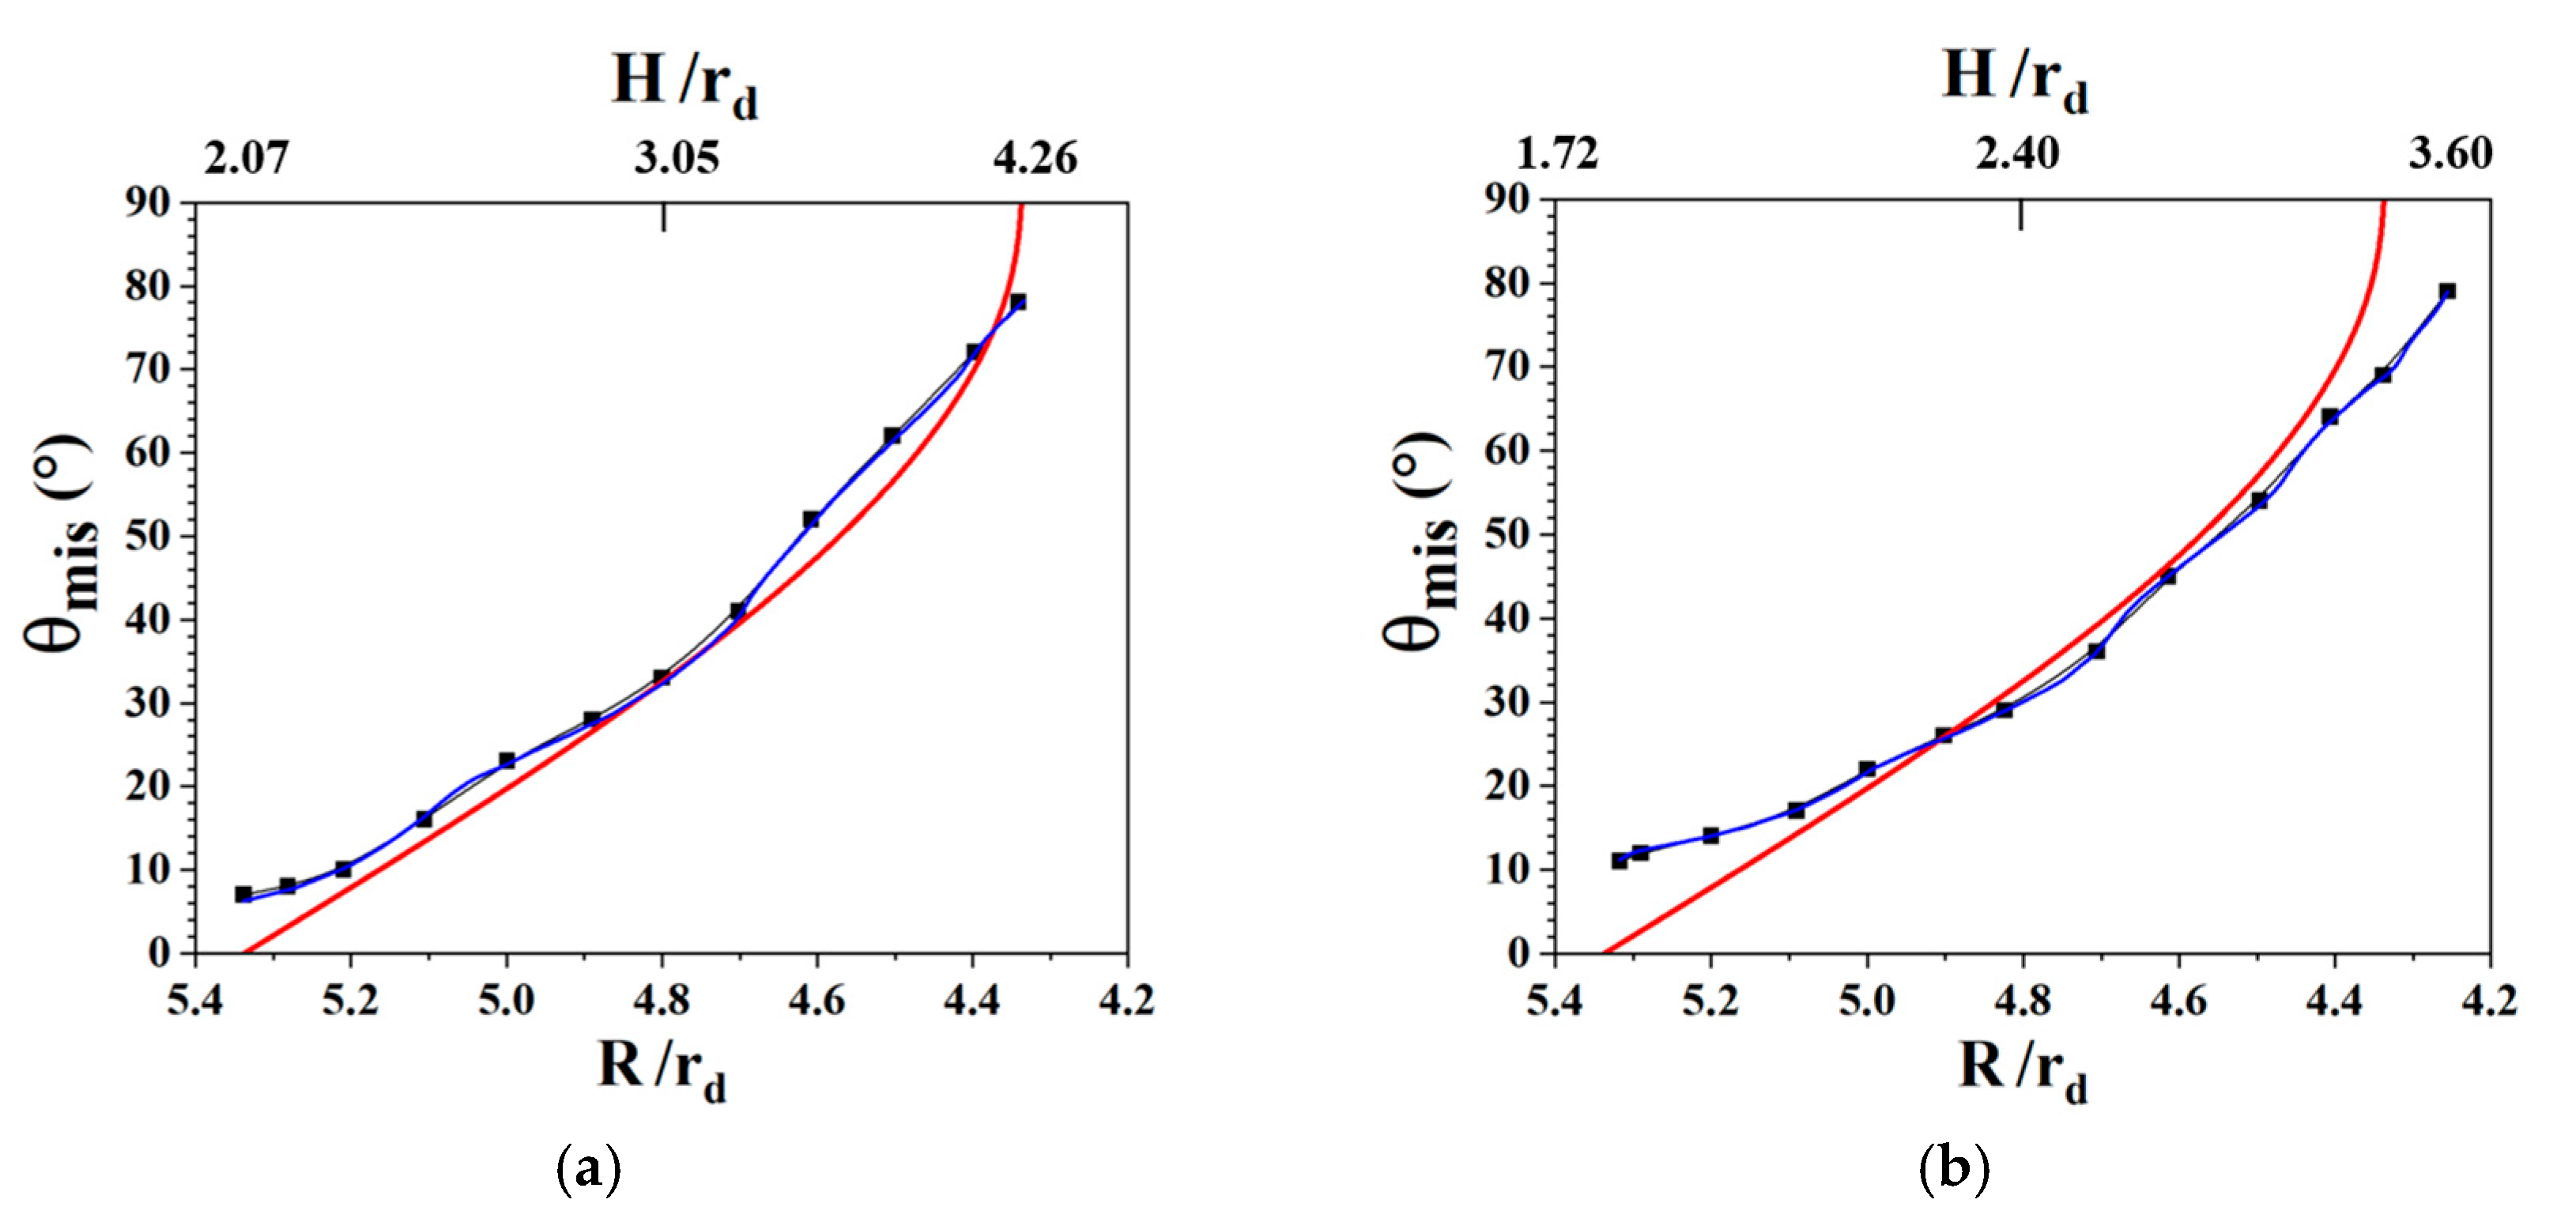
To gain insights into the lattice rotation in the drawing path, we plotted a misorientation called the rotation angle
as a function of the deep depth ratio
for positions A and B (
Figure 12a,b, respectively) because no rotation was observed in Zone IV. Position A was subjected to bending in Zone II at
= 5.0, with the rotation angle
ranging from 20° to 75°. For the B position, the starting point in Zone II was at
= 2.0, with the rotation angle
between 10° and 75°. These results imply considerable rotation in Zone II for Positions A and B under bending deformation, whereas a slight lattice rotation occurred in Zones I and III at the cup flange and wall.
After discussions on the angle dependence of the rotation axis, we focused on the lattice rotation behaviors during deep drawing. The lattice rotation between the deformed and initial orientations can be expressed using the RA and rotation angle called misorientation. First, considering the case of
, we plotted the misorientation as a function of the deep depth ratio
for positions A and B at the cup flange and wall (
Figure 12a,b), where the deep depth ratio is described in
Section 3.1. The cup bottom in Zone IV did not present any misorientation because no rotation was observed in this region. The drawing path of any specific node is expressed in terms of the time and positions of Z and RD. Thus, the deep depth ratio
can be considered the drawing path of the node, and the transition point between Zones I and II represents the beginning of bending in Zone II at
= 5.0 for position A. The deep depth ratio in Zone II ranged from 5 to 7, corresponding to the rotation angle
ranging from 20° to 75°. In case position B, the starting point in Zone II was at
= 2.0, with the rotation angle
ranging from 10 to 75°. For positions A and B, a notable rotation occurred in Zone II in the transition region during the bending process, and a slight lattice rotation transpired in Zones I and III at the cup flange and wall.
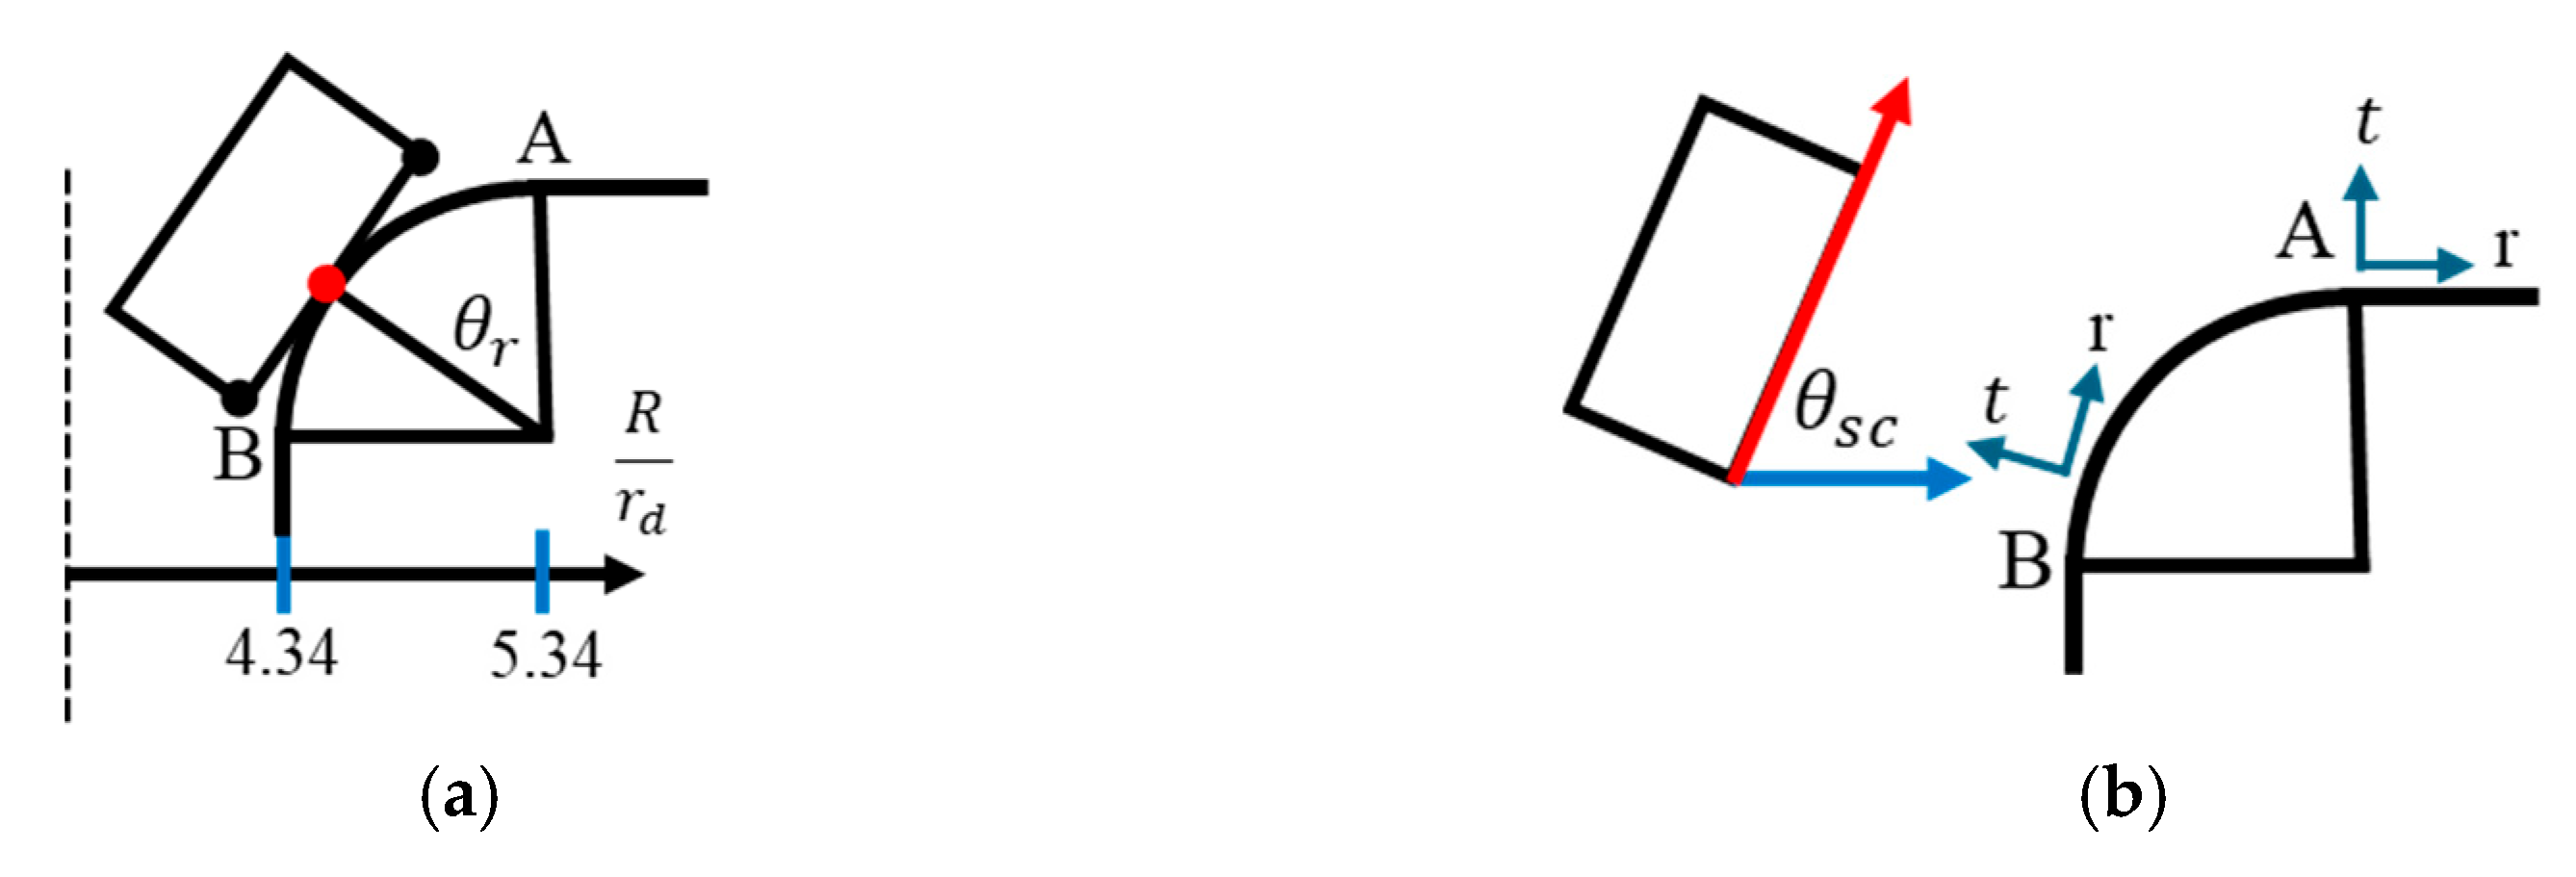
The rotation angle can be described using two methods: radial angle
and tangential angle
(
Figure 13). The radial angle
was measured using the circular motion of a given position along the circumference of a quarter circle from the vertical position A to a specific position shown in
Figure 13a. The value was
= 0° at position A and 90° at position B. The tangential angle
was calculated using the slope of a node at a specific position shown in
Figure 13b, and its value was 0° at position A and 90° at position B.
Figure 14 shows the rotation angle
predicted using the calculation method of the
angle compared with the theoretical angles of
and
. The misorientations were consistent with
and
.
According to the kinematic considerations of bending based on the stationary axis of rotation and bending radius
r, the effective arc length
s of the specimen can be calculated as a function of the rotation angle
under pure bending:
Thus, Zone II can be considered the sum of an infinite decrement arc length ∆
s, that is, the sum of infinite decrements of the rotation angle
. The rotation angle increases with the increase in the arc length. During deep drawing, the drawing trajectory is constrained along the circumference of the quarter circle of a die subjected to the bending process. Therefore, such bending kinematics of deep drawing can lead to lattice rotation, and the rotation angle increases with an increase in the depth of deep drawing. This finding is supported by the agreement of the misorientations with
, that is, the lattice rotation around the circumferential direction induced by the kinematic bending process. We calculated the deformed orientation from the initial orientation by the rotation around the circumferential direction with the rotation angle
:
where
and
denote the orientations in the
direction before and after the bending process, respectively,
represents the initial orientation, and
indicates the rotation at
in terms of the matrix.
3.4. Earing Formation Induced by Crystal Plasticity
After comprehending the angle dependence relationship and orientation change, we combined the concepts of crystal plasticity and orientation to calculate the cup height to gain insights into the formation mechanism of ears during deep drawing. Following the drawing path of position A at
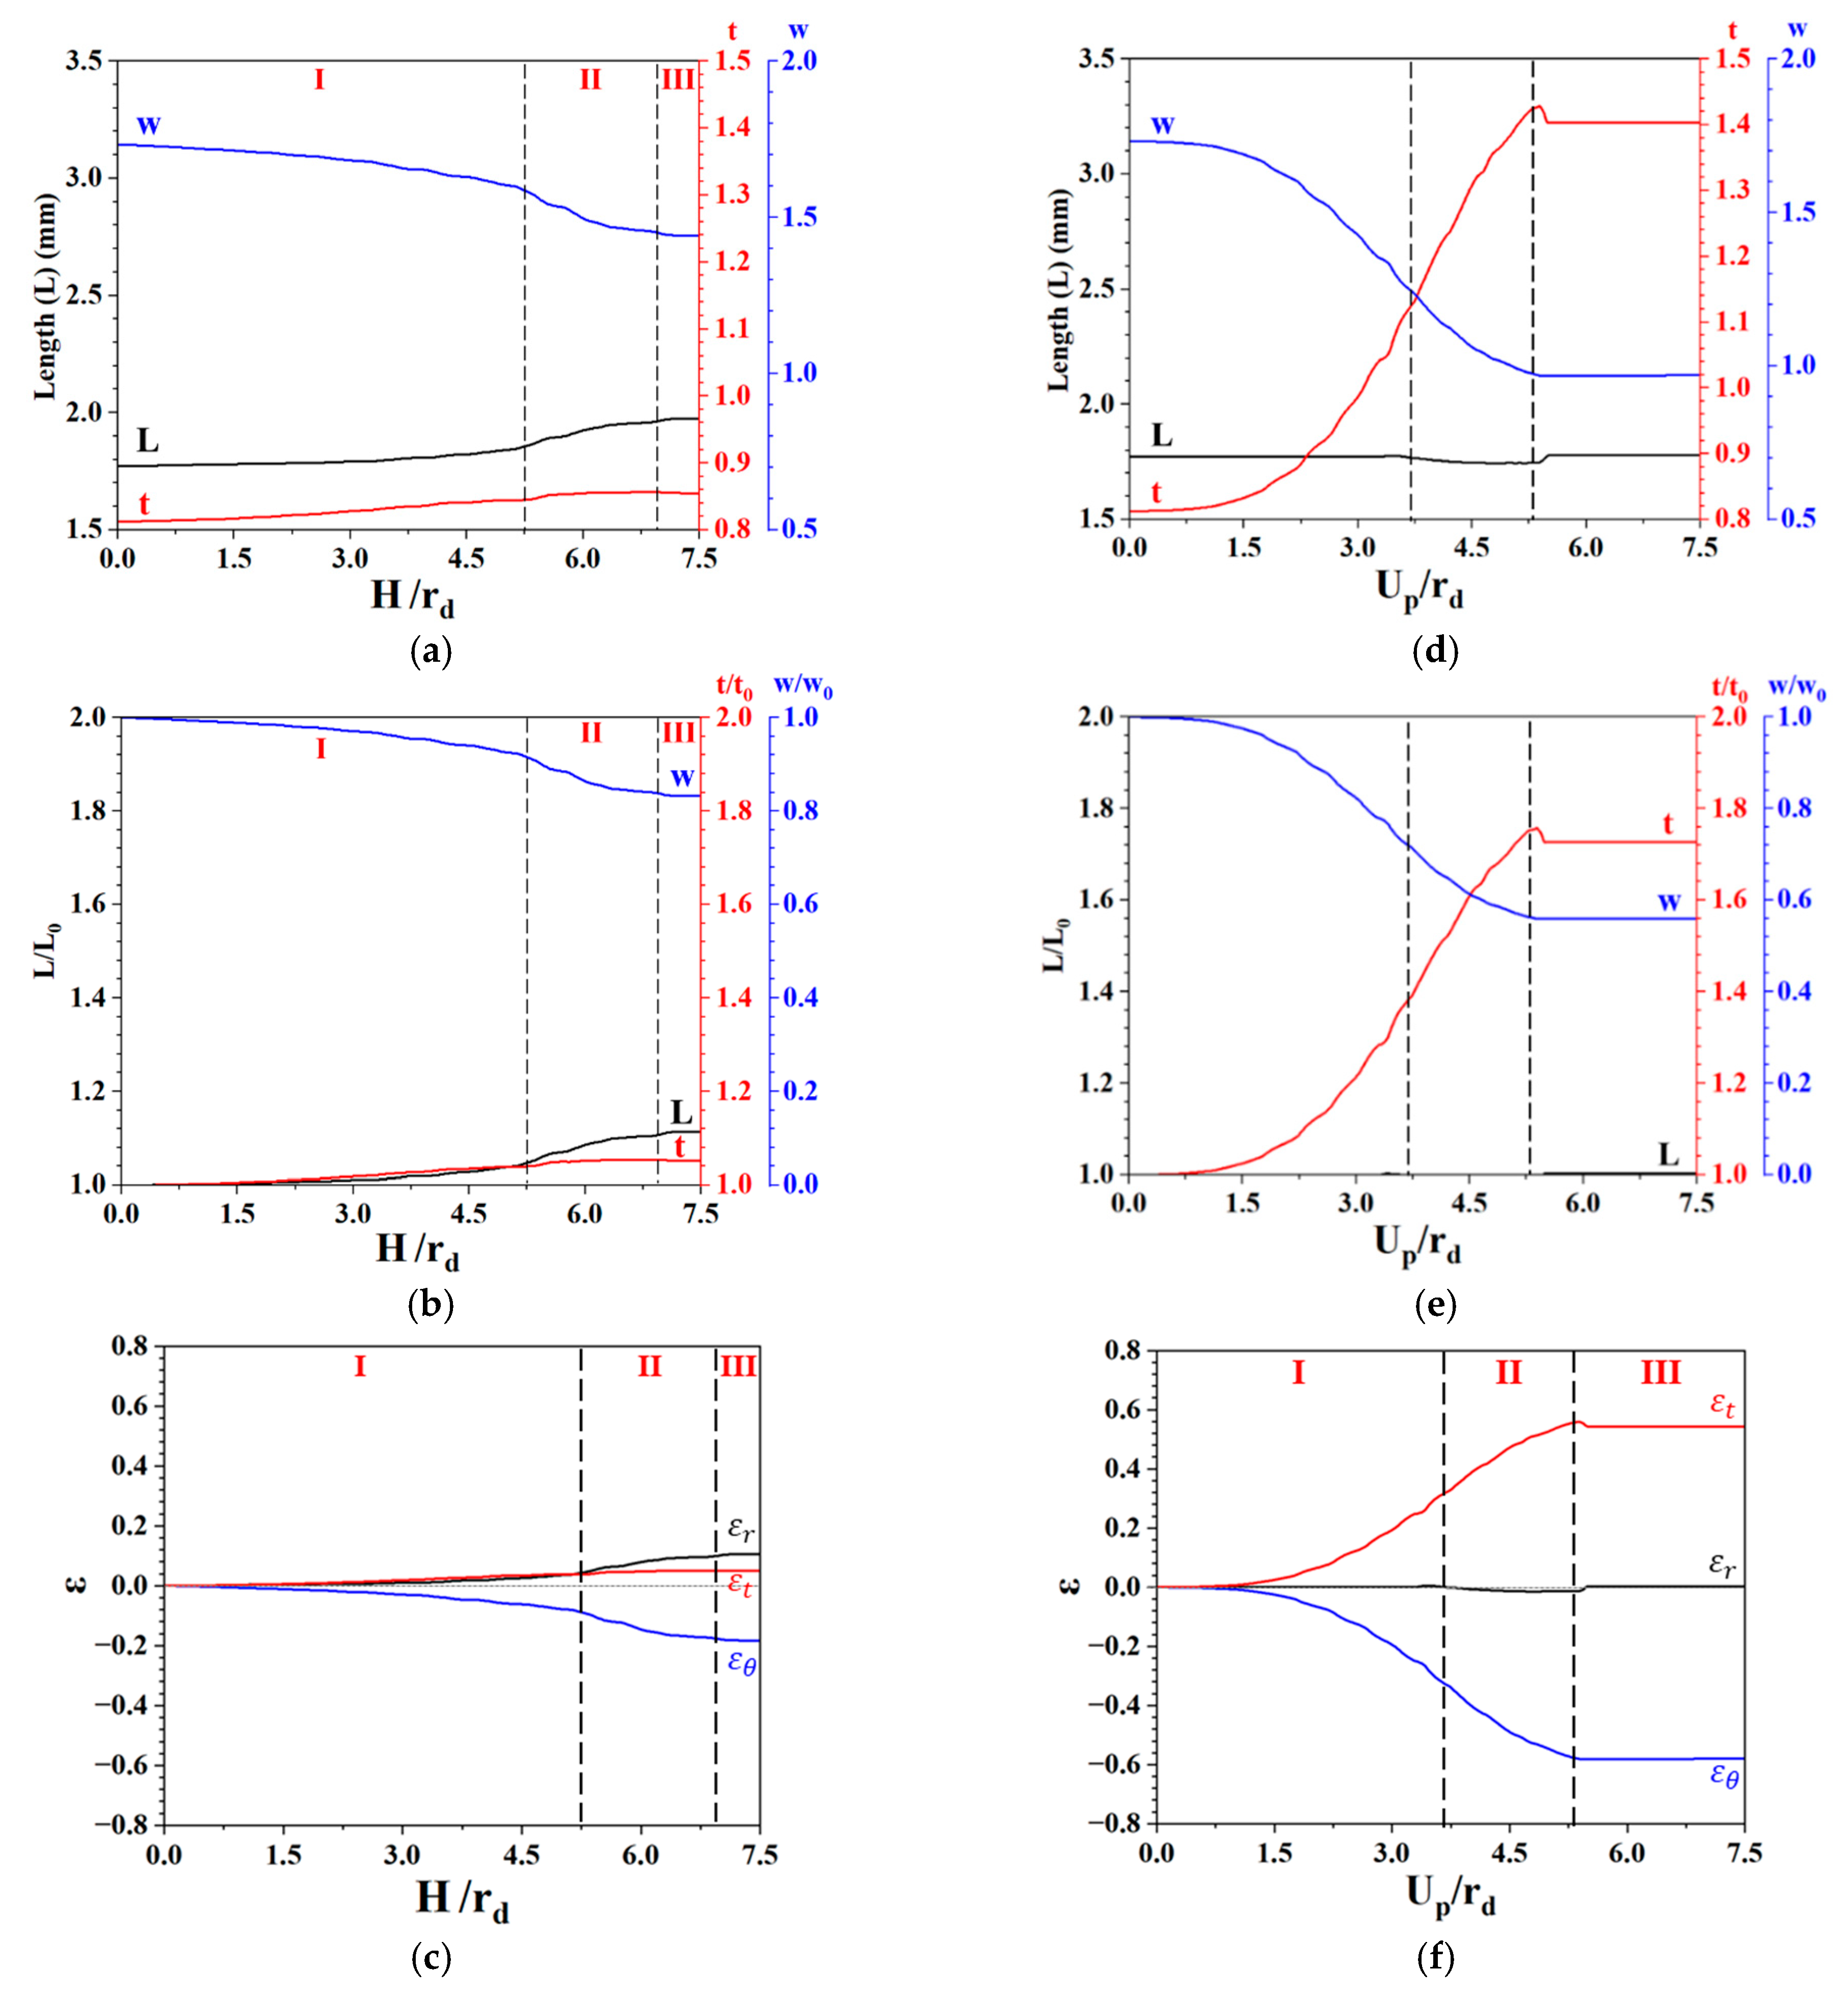
= 0°, the evolutions of the length, width, and height were determined (
Figure 15a).
Figure 15b shows the normalized length, width, and height obtained from the simulation results of the CPFEM.
Figure 15c shows the strains of
,
, and
, which were used to trace the values along the drawing path for position A. The absolute value of
was greater than that of
, and the
strain was lower than the others. Furthermore, the radial strain
in Zone III was greater than that in Zone II and close to zero in Zone I. This finding suggests the occurrence of radial strain in Zone III at the cup flange.
After discussing the angle-dependent orientation relationship, we now comprehend earing formation in the deep drawing of a circular blank. The formation of the earing can be attributed to the inhomogeneity of the radial strain along the circumferential direction in the flange of a circular blank. The strain
along the RD can be expressed in terms of the shear
for activated slip systems s:
where the Schmid tensor
is defined using the component of the unit vector
, which is normal to the slip plane, and unit vector
, which is parallel to the slip direction of the slip system
s. The slip systems, as shown in
Table 4, were divided into three types, namely, A, B, and C, based on the projection direction of the slip direction on the RD–TD plane (
Figure 16), where A is 45° with respect to RD or TD, and B and C are parallel to the TD and RD, respectively.
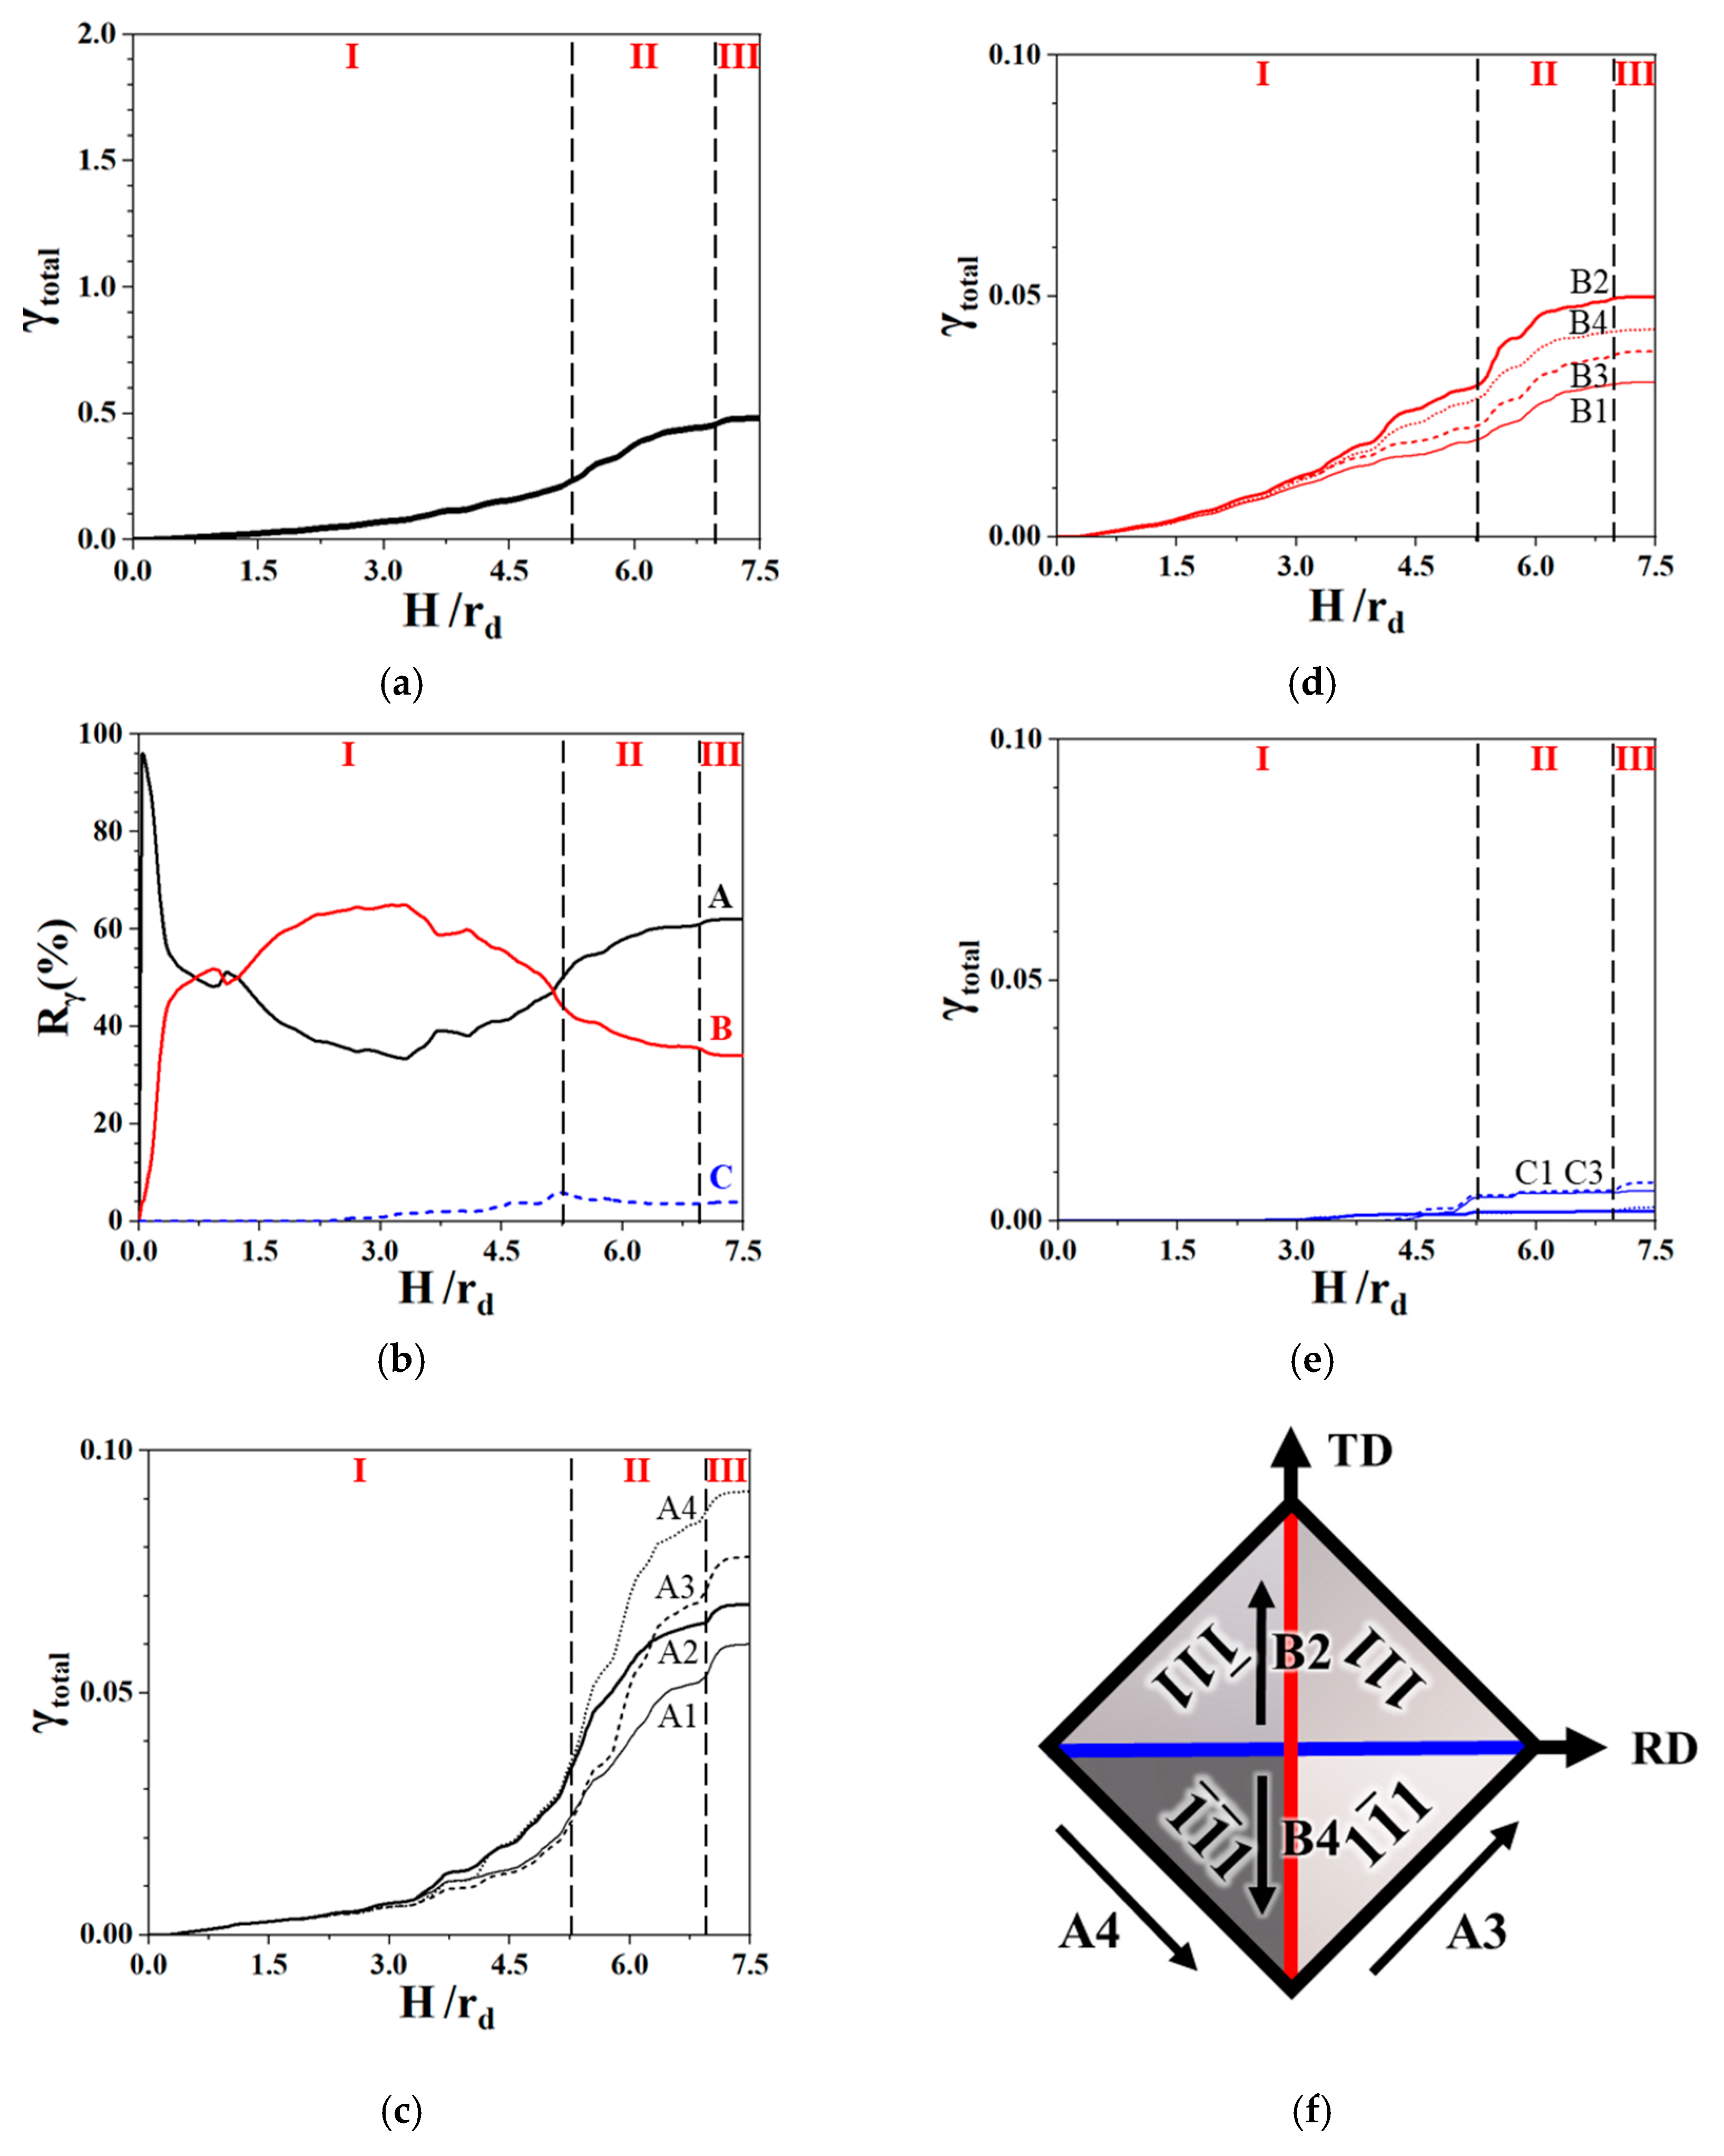
Figure 17a shows that the simulated total shear (
) of 12 slip systems in Zone III is greater than that in Zone II and close to zero in Zone I. During the deep drawing process, the change in the orientation is first attributed to the
-dependent rotation axis constrained by the die, as expressed in Equation (15), in Zone I and then to the bending rotation, as expressed in Equation (17), in Zone II. The radial strain considerably increased during the bending process in Zone II and reached the saturation value in Zone III (
Figure 15c). This observation is in agreement with the results of the radial strain shown in
Figure 15c. The total shear was mainly contributed by types A and B (
Figure 17b). In addition, types A and B mainly contributed to A3, A4, B2, and B4 (
Figure 17c,d). The shears of
and
resulted in the increased components of
and
along the RD and TD, and the shears of
and
led to the increased component of
along the TD. This outcome explains why the absolute value of
contributed by the four major shears (
,
,
, and
) was greater than that of
from two major shears (
and
) (
Figure 17f).
For the drawing path of position D at
= 45°,
Figure 15d shows the evolutions of the length, width, and height.
Figure 15e shows the normalized length, width, and height.
Figure 15f reveals the strains
,
, and
, which were used to trace the drawing path of position D. The absolute value of
was greater than that of
, and that of the
strain was close to zero. Furthermore, the strain
substantially increased between Zones I and II for position D at
= 45°, and the strain
increased from Zone II for position A at
= 0°. This finding supports the earing formation at
= 45° due to the radial strain. In addition, the difference in the boundary conditions depends on its orientation during the bending process.
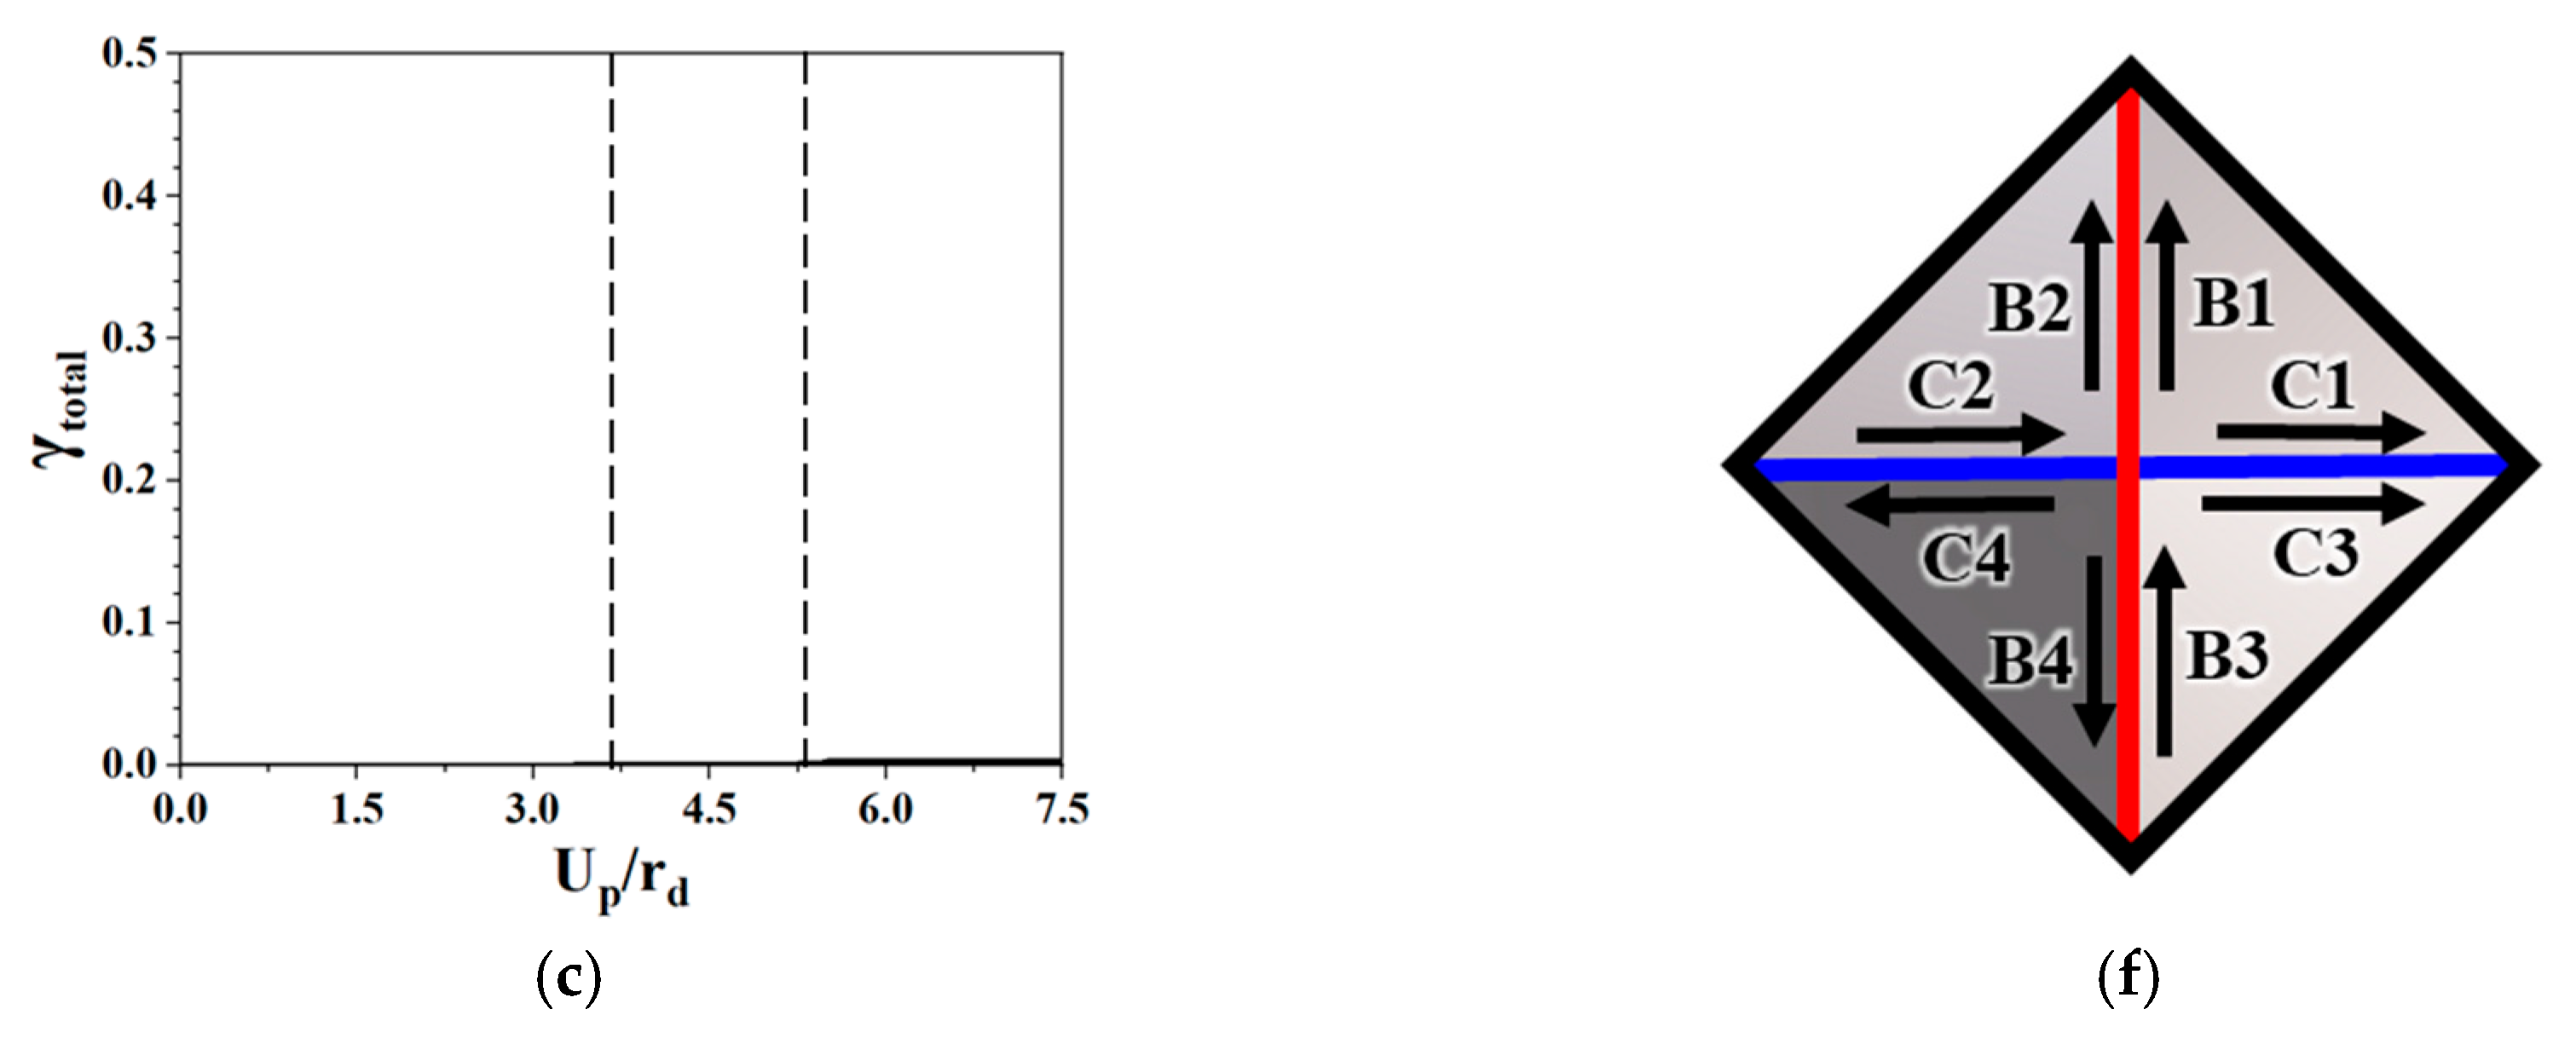
With regard to slip systems, the simulated total shear (
) of the 12 slip systems in Zone III was greater than that in Zone II (
Figure 18a). In addition, the radial strain substantially increased during the bending process in Zone II and reached the saturation value in Zone III (
Figure 15f). This observation is in good agreement with the results of the radial strain shown in
Figure 15f. In addition, the total shear in
Figure 18b was mainly contributed by types A and B. Moreover, types B and C mainly contributed to B2, B3, C2, and C3 (
Figure 18c,d). The shears of
and
resulted in an increase in the components of
and
along the ND and TD, and those of
and
led to an increase in the components of
and
along the ND and TD. This finding explains the greater absolute value of
contributed by the four major shears
,
,
, and
than that of
from the four major shears
,
,
, and
(
Figure 18f). A comparison at
= 0° and
= 45° revealed that type A of the slip systems contributed to the radial strain
at
= 0°, and types B and C of the slip systems accounted for strains
and
in the circumferential and thickness directions at
= 45°.
Preferred crystallographic orientation or texture induced during the deep drawing process gives rise to an anisotropic yield function. Thus, variational anisotropic yield functions have been employed to calculate the anisotropy of the Lankford coefficient, ignoring the sheet textures [
14,
38,
39]. Apart from the anisotropic yield functions, CPFE methods explicitly consider variational crystal plasticity formulations in a polycrystal for direct, comprehensive visualization of the physics of deformation processes [
19]. CPFE methods were recently applied to predict the earing phenomenon by combining different texture components [
25]. These observations support a direct relationship between the earing phenomenon and texture components.
Tucker [
33], Kanetake et al. [
36], and Hsiao et al. [
37] considered the
-dependent function of resolved shear stresses on slip systems resulting in earing. Resolved shear stress is determined by the stress state applied at the rim in a circular blank, and the position of the rim depends on the
angle measured from the RD. Herein, the orientation of single crystals is fixed but the stress state is the
-dependent function. In the present study, it was found that the α-angle dependence of the crystal rotation gives rise to variational orientations. This observation is consistent with the results reported by Tucker [
33]. Hence, earing is a characteristic phenomenon associated with the crystallographic textures of the material.


