1. Introduction
Shale oil and gas are important components of energy at present. However, shale oil and gas reservoirs are difficult to exploit, requiring horizontal well exploration and fracturing. Fracturing tools and temporary plugging tools are required during the exploration and fracturing process of horizontal wells. Dissoluble magnesium alloy fracturing tools have gradually been replacing drillable tools. Temporary plugging material is a very important type of material in horizontal well fracturing technology. It can temporarily plug boreholes or cracks, allowing the pressure of the fracturing fluid to act on other parts, causing more cracks to be formed. And the presence of more cracks allows more oil and gas to flow out of the cracks and into the casing, increasing oil and gas production.
Degradable fiber temporary plugging agents are a new type of plugging tool [
1]. The fibers are easy to bend and form into various shapes, which can be filled into the micropores or small pores of the cracks, making the temporary plugging layer denser [
2]. In addition, the fiber density is low, and it is easy to fill the cracks and form a temporary blocking layer after entering the gaps. However, the scarcity of synthetic products, complex synthesis processes, and high costs of certain materials in degradable fibers have limited their application. In addition to cost factors, degradable fibers also have the following disadvantages in practical applications: low pressure-bearing capacity, poor heat resistance and chemical stability, and easy aggregation and blockage of pipelines during construction. Therefore, finding a suitable material to weave knots and overcome the various drawbacks of polymer knots is an urgent task that the academic community needs to face.
Magnesium alloys have the characteristics of high specific strength, good thermal conductivity, good thermal stability, good mechanical properties, and easy corrosion [
3,
4,
5,
6,
7,
8]. In addition, magnesium resources are widely distributed in nature, with abundant reserves and low cost. Adding some chemically active alloying elements to magnesium alloys can cause corrosion and dissolution under certain conditions, making them suitable as dissoluble materials [
9,
10,
11]. The application of dissoluble magnesium alloys in shale oil and gas extraction mainly includes dissoluble bridge plugs and dissoluble fracturing balls. So far, the studies on magnesium alloys for hydraulic fracturing have focused on Mg-Al [
12,
13], Mg-Zn [
14], and Mg-RE [
15,
16] alloy systems. Most of the reported studies on dissoluble magnesium alloys for hydraulic fracturing have focused on high strength, with relatively little investigation of plasticity. For example, Zhong et al. [
17] found that in Mg-2Gd-0.5 (Cu/Ni) alloys, adding Ni instead of Cu in trace amounts is more effective in refining grains, improving the texture strength of the basal plane, and promoting the formation of the LPSO phase, resulting in better strength. However, the addition of Ni is not conducive to improving the work hardening rate and elongation of the alloy. In addition, Ma et al. [
18] investigated the effect of Ni on the mechanical properties and corrosion behavior of MgGd1Nix alloy. The results indicate that the LPSO phase containing Ni not only improves the compressive strength of the alloy but also accelerates the alloy dissolution process under galvanic corrosion. Liu et al. [
12] investigated the role of Cu in AZ91 alloy. The results showed that AZ91-RE-3Cu alloy had the highest strength, with a yield strength and maximum compressive strength of 244 and 405 MPa, respectively. However, so far the reports on dissoluble magnesium alloys have mostly focused on the extruded rods, with almost no relevant reports on dissoluble magnesium alloy wires. In the field of dissoluble magnesium alloy wire, only related literature on a portion of biodegradable magnesium alloy wire is available for reference. The reason for this status is that magnesium alloys have a hexagonal structure with poor plasticity, which makes the preparation of dissoluble magnesium alloy wires extremely difficult. As mentioned earlier, if magnesium alloy wire is used to weave knots, it will overcome the disadvantages of low strength and poor thermal and chemical stability of polymer knots. At the same time, due to the good solubility of dissoluble magnesium alloys, it can also overcome the problem of poor solubility of polymer knots. However, designing high-plasticity dissoluble magnesium alloys and preparing ultrafine dissoluble magnesium alloy wires are indeed challenges faced in both academia and industry.
The Mg-Li alloy system is a representative system of high-plasticity magnesium alloys. This alloy exhibits ultra-high plasticity due to its BCC lattice structure. For example, Ji et al. [
19] increased the plasticity of Mg-Li-Al alloy to over 40% by regulating the precipitation phase at the grain boundaries. In summary, Mg-Li alloy may be an ideal material for developing ultrafine magnesium alloy wires. However, so far there have been no reports in the academic community on dissoluble Mg-Li alloy wires. Therefore, based on this idea, this article intends to develop a novel dissoluble Mg-Li alloy and prepare ultrafine wire materials through Cu microalloying. At the same time, in order to further enhance the plasticity of the wire, annealing treatment is carried out on the wire, and the microstructure, mechanical, and corrosion properties of the wire in two states are studied, especially the plasticization and dissolution.
2. Experimental Procedure
In this paper, the alloy composition Mg-14Li-0.8Al-0.5Cu was smelted by using pure Mg (99.99 wt.%), pure Li (99.999 wt.%), pure Al (99.99 wt.%), and Mg-Cu (25 wt.%). A vacuum induction furnace was used to melt the alloy, and the alloys were cast into the metal mold to obtain the required ϕ 90 × 100 mm ingot. After alloy melting, homogenization treatment was carried out at a heat treatment temperature of 230 °C for 5 h, followed by air cooling. Before extrusion, the ingot and mold were preheated to 220 °C. The extrusion temperature was 220 °C, and the extrusion ratio was 24:1. Then the extruded alloy rod could be processed into a round rod with a diameter of 6 mm. Before drawing, the alloys were annealed at 200 °C/10 min, followed by cold drawing. The deformation amount per pass was 10%~15%; when the deformation was 55% to 70%, the alloy wires were annealed at 200 °C/10 min. The final deformation was 75%, and finally alloy wires with a diameter of 1 mm were obtained.
XRD tests were carried out (Smart Lab, Nippon Science, Tokyo, Japan). The microstructure was observed by scanning electron microscope (SEM, Zeiss supra55, Carl Zeiss AG, Oberkochen, German). The texture of wires was collected and analyzed by X-ray diffractometer (Smart Lab, Nippon Science, Japan). The precipitated phase of the sample was observed by transmission electron microscope (TEM, Talosf200x, Thermo Fisher Scientific, Waltham, MA, USA). Tensile specimens with gauge dimensions of 1 mm in diameter and 25 cm in length were prepared. Then the CMT6104 testing machine (MTS Systems Corporation (China) Limited, Shenzhen, China) was employed to conduct the tensile test and the initial rate was 1 mm/min.
To evaluate corrosion behaviors, the weight loss of the samples immersed in the solution for 1 h at 93 °C was measured. The composition of the solution was 3% KCl. Hank’s solution was also used for the weight loss test to obtain a comparison of the degradation rate among the different materials. The sample with a length of 35 mm was used for the measurement of weight loss. Before the measurement, the samples were ultrasonically cleaned with alcohol. Then the samples were immersed in a solution of 200 g/L Cr2O3 + 10 g/L AgNO3 to remove the corrosion products, rinsed with distilled water and ethanol, and finally dried in warm flowing air.
Potentiodynamic polarization and electrochemical impedance spectroscopy (EIS) were analyzed using a CS310H electrochemical testing system (Wuhan Corrtest Instrument Co., Ltd., Wuhan, China) in 3% KCl solutions at 93 °C. The impedance spectrum test parameters were as follows: the DC potential was selected as a relative open circuit, the potential was set to 0 V, and the AC amplitude was set to 10 mV. The polarization curve setting parameters were as follows: the initial potential was set to −0.3~−0.5 V, the termination potential was set to 1 V, the potential type was selected as a relative open circuit, the scanning frequency was set to 0.5 mV/s, and the sampling frequency was set to 2. Scanning Kelvin Probe Force Microscopy (SKPFM, SPI4000/SPA300HV, NSK LTD., Tokyo, Japan) was used to measure the Volta potential of the matrix and other phases.
4. Discussion
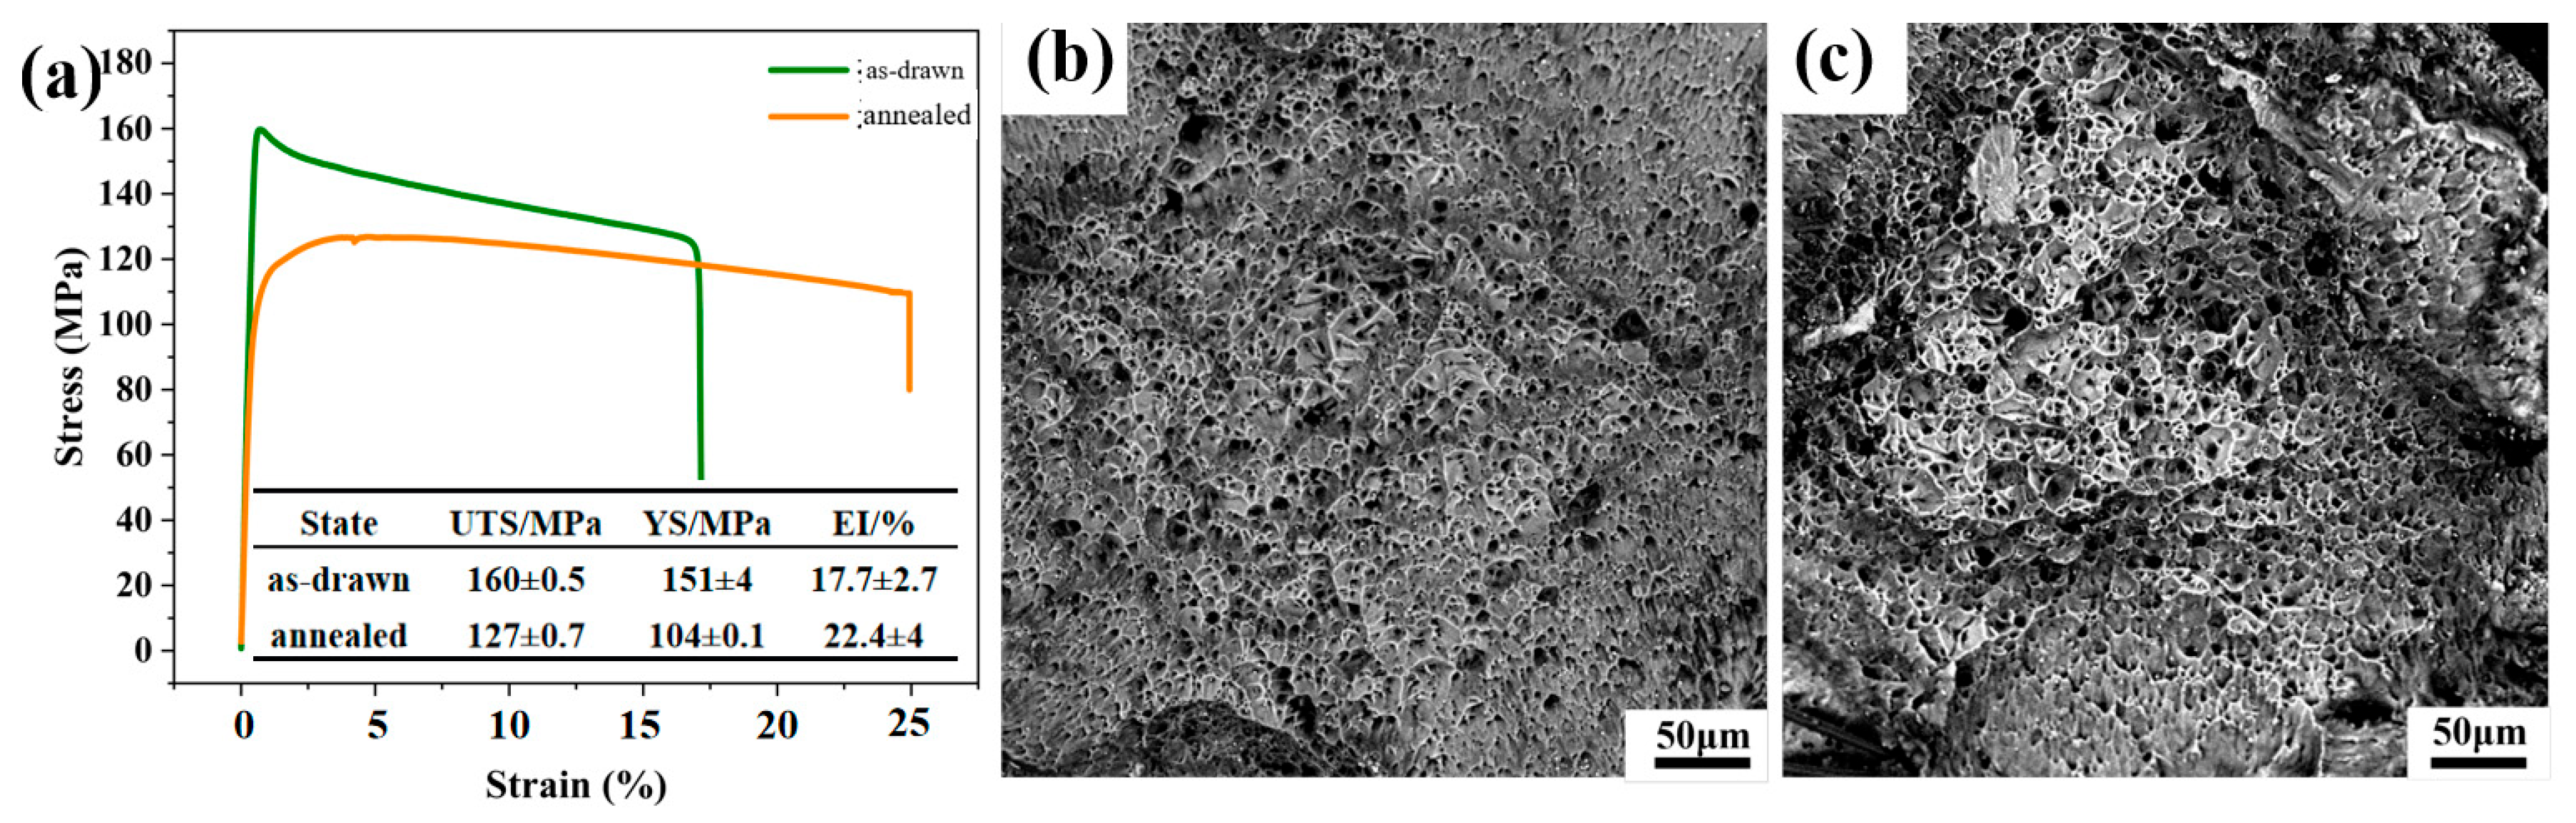
It can be seen from
Figure 5a that the mechanical properties of the drawn and annealed wires are completely different. As shown in
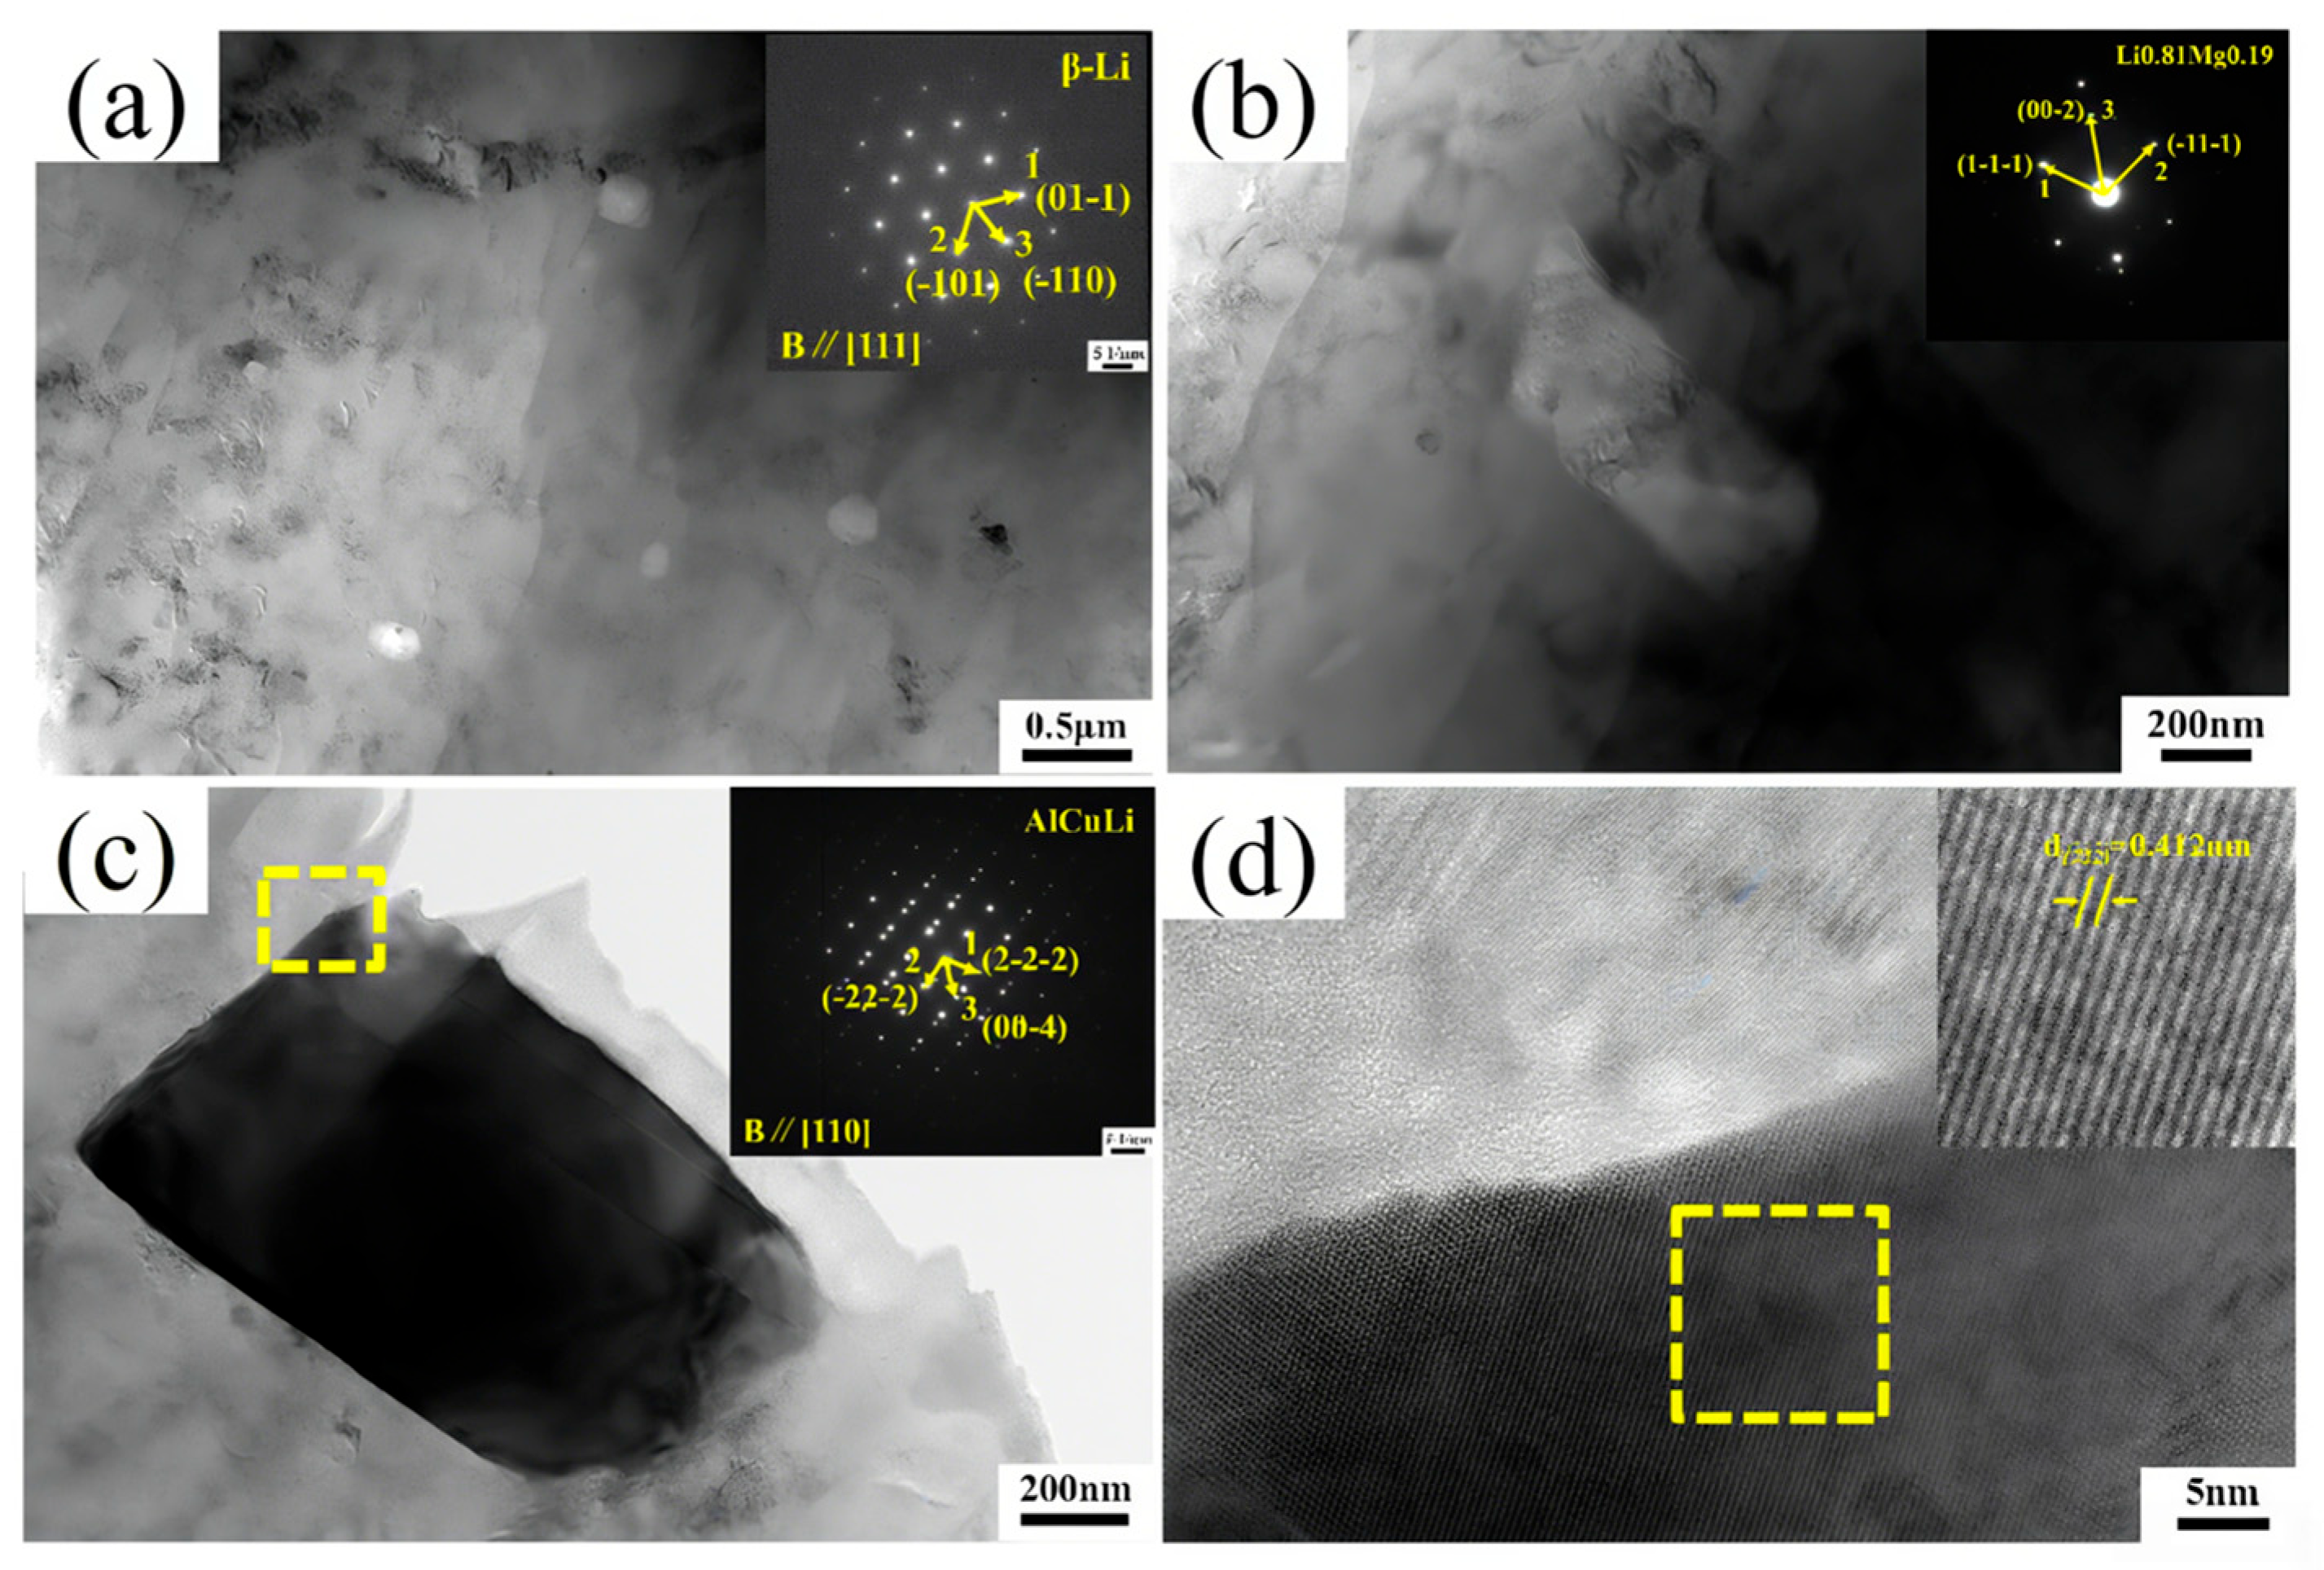
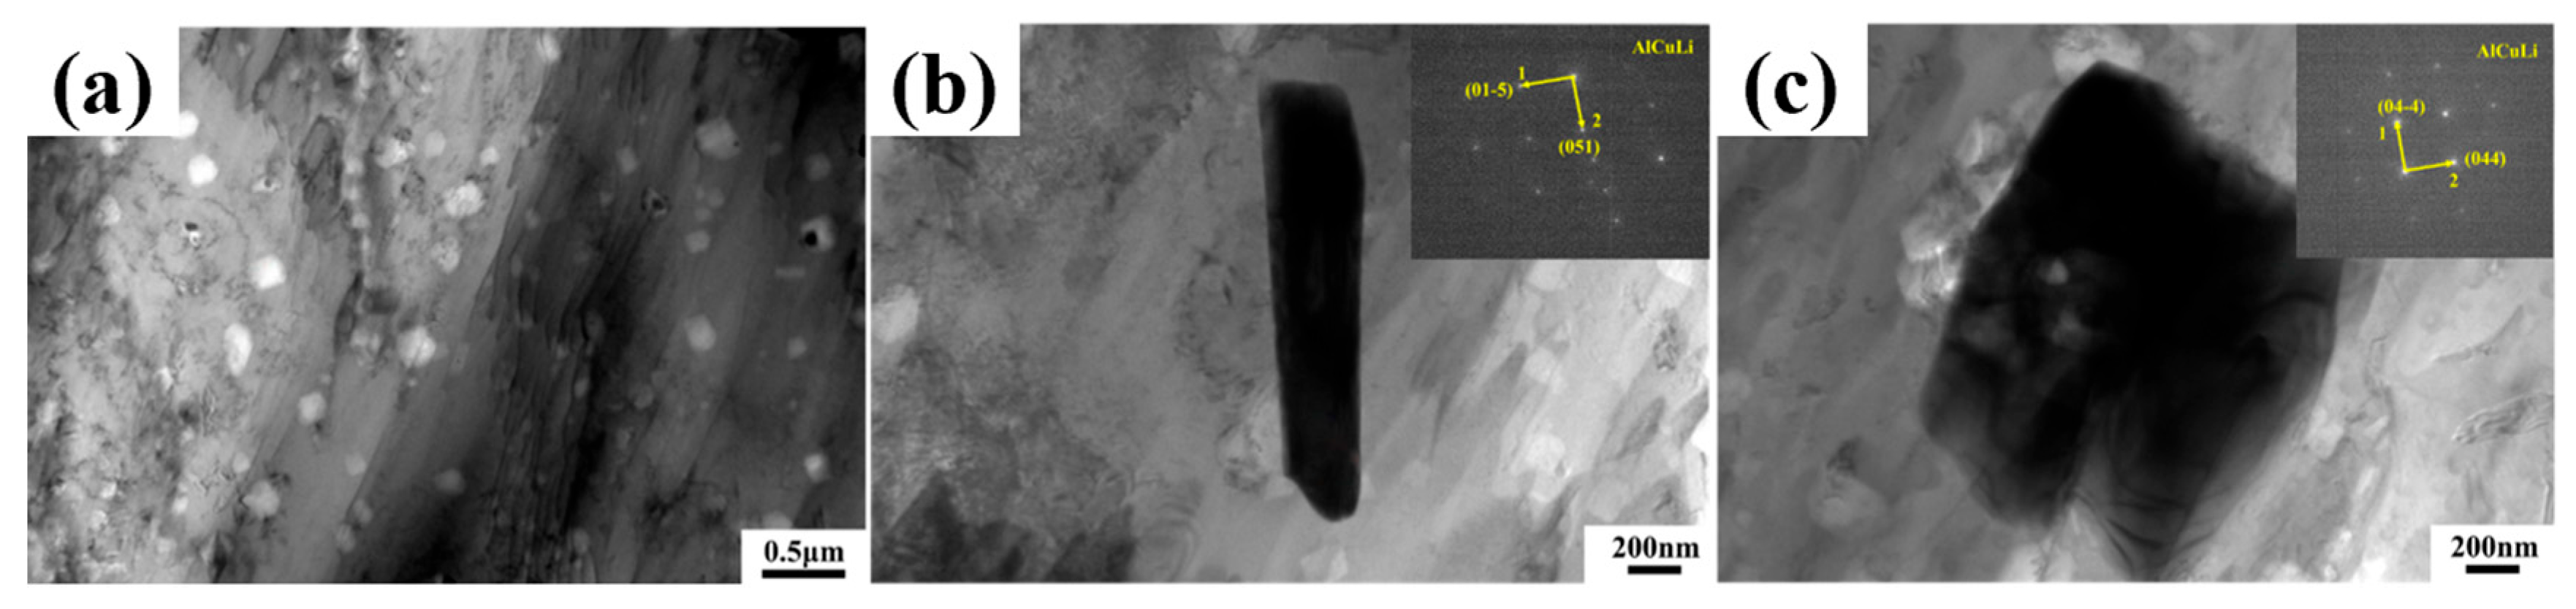
Figure 5b,c, after adding alloying elements, a large number of second-phase particles appear in LA141-0.5Cu alloy. According to dislocation theory, there are dislocation loops around the second-phase particles, which are in an equilibrium state in the absence of external forces. During the deformation process, when the external force is large enough, the dislocation loop will restart and move towards the second-phase particles, causing them to separate from the matrix and form micro voids. A large number of voids will grow and connect to form tough dimples [
21]. Due to the uniform and fine second-phase particles in LA141-0.5Cu alloy, the toughness dimples in LA141-0.5Cu alloy are relatively small. According to transmission electron microscopy, the second phase in LA141-0.5Cu alloy is mostly distributed within the crystal, reducing the segregation of alloy elements at grain boundaries, reducing intergranular fracture of the alloy, and improving the plasticity of the alloy to a certain extent. After annealing, the stress in the wire material is released and dislocations are reduced, resulting in increased plasticity and decreased strength.
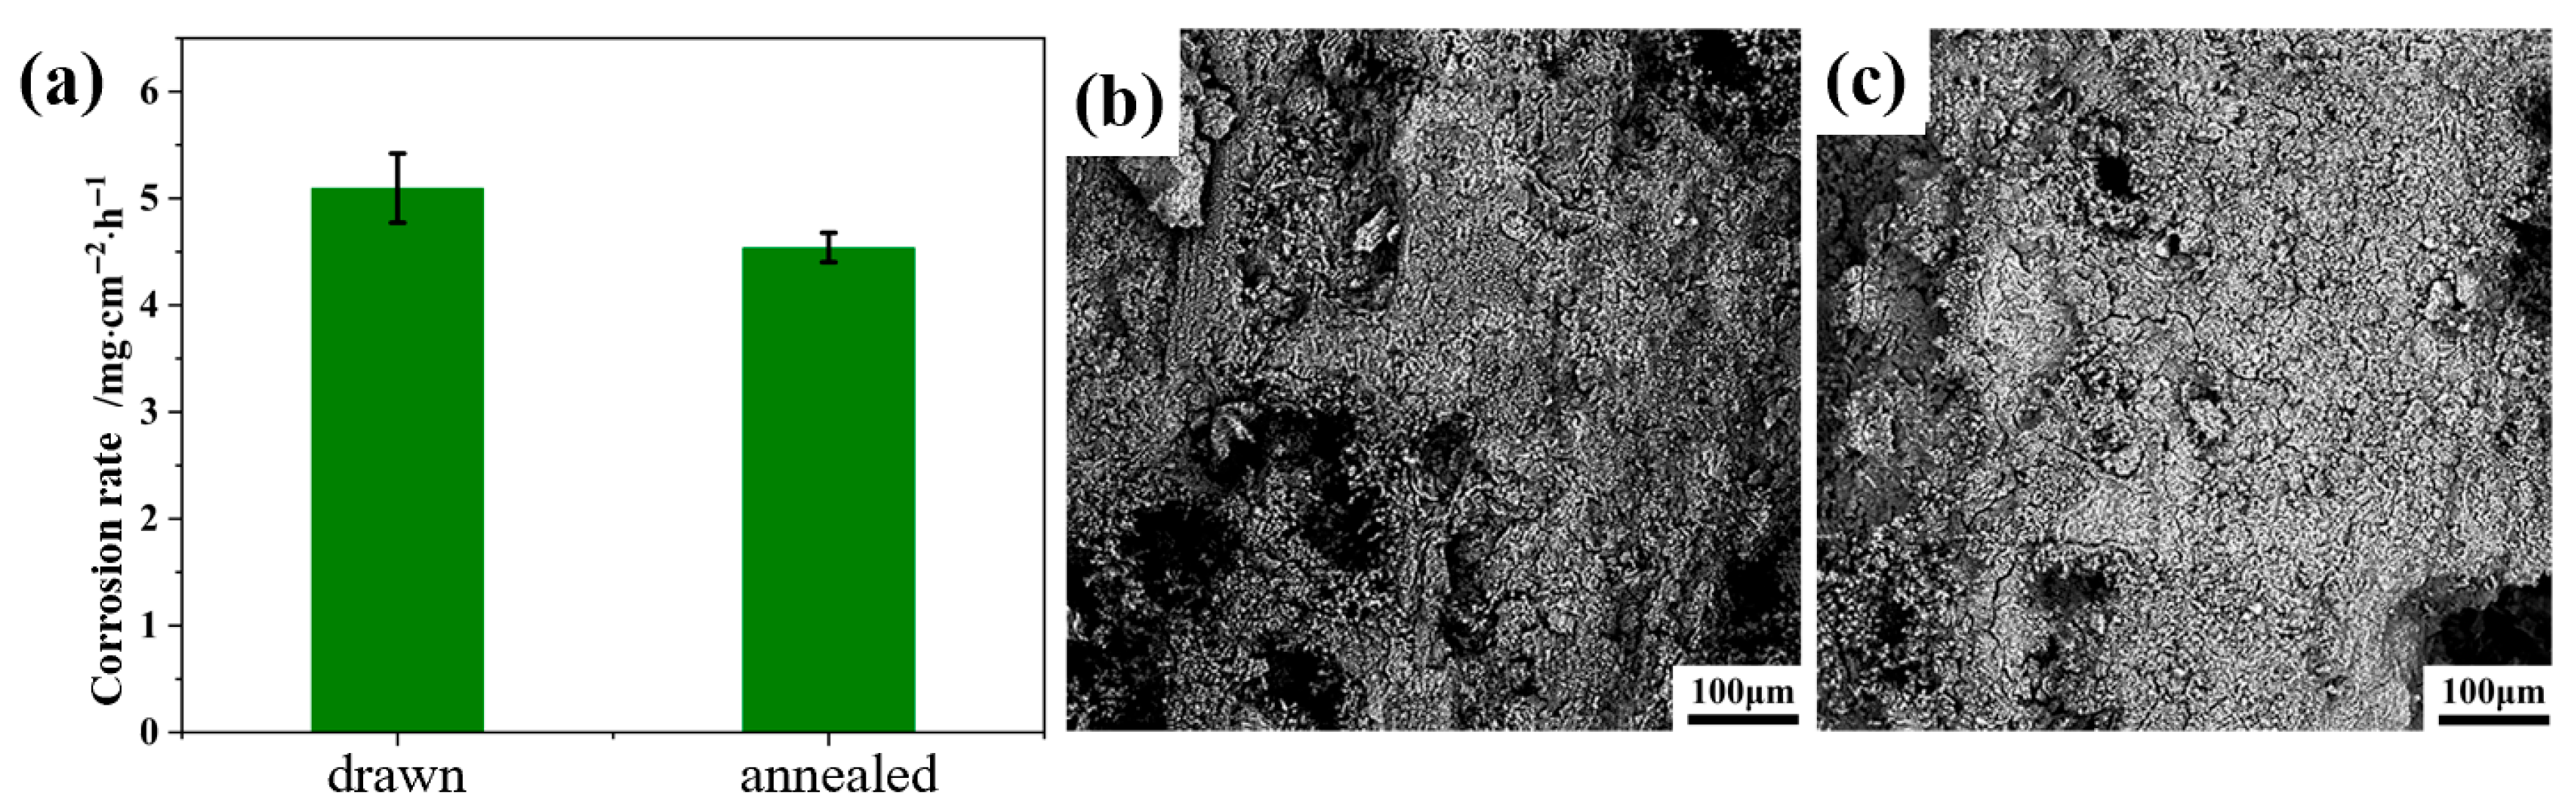
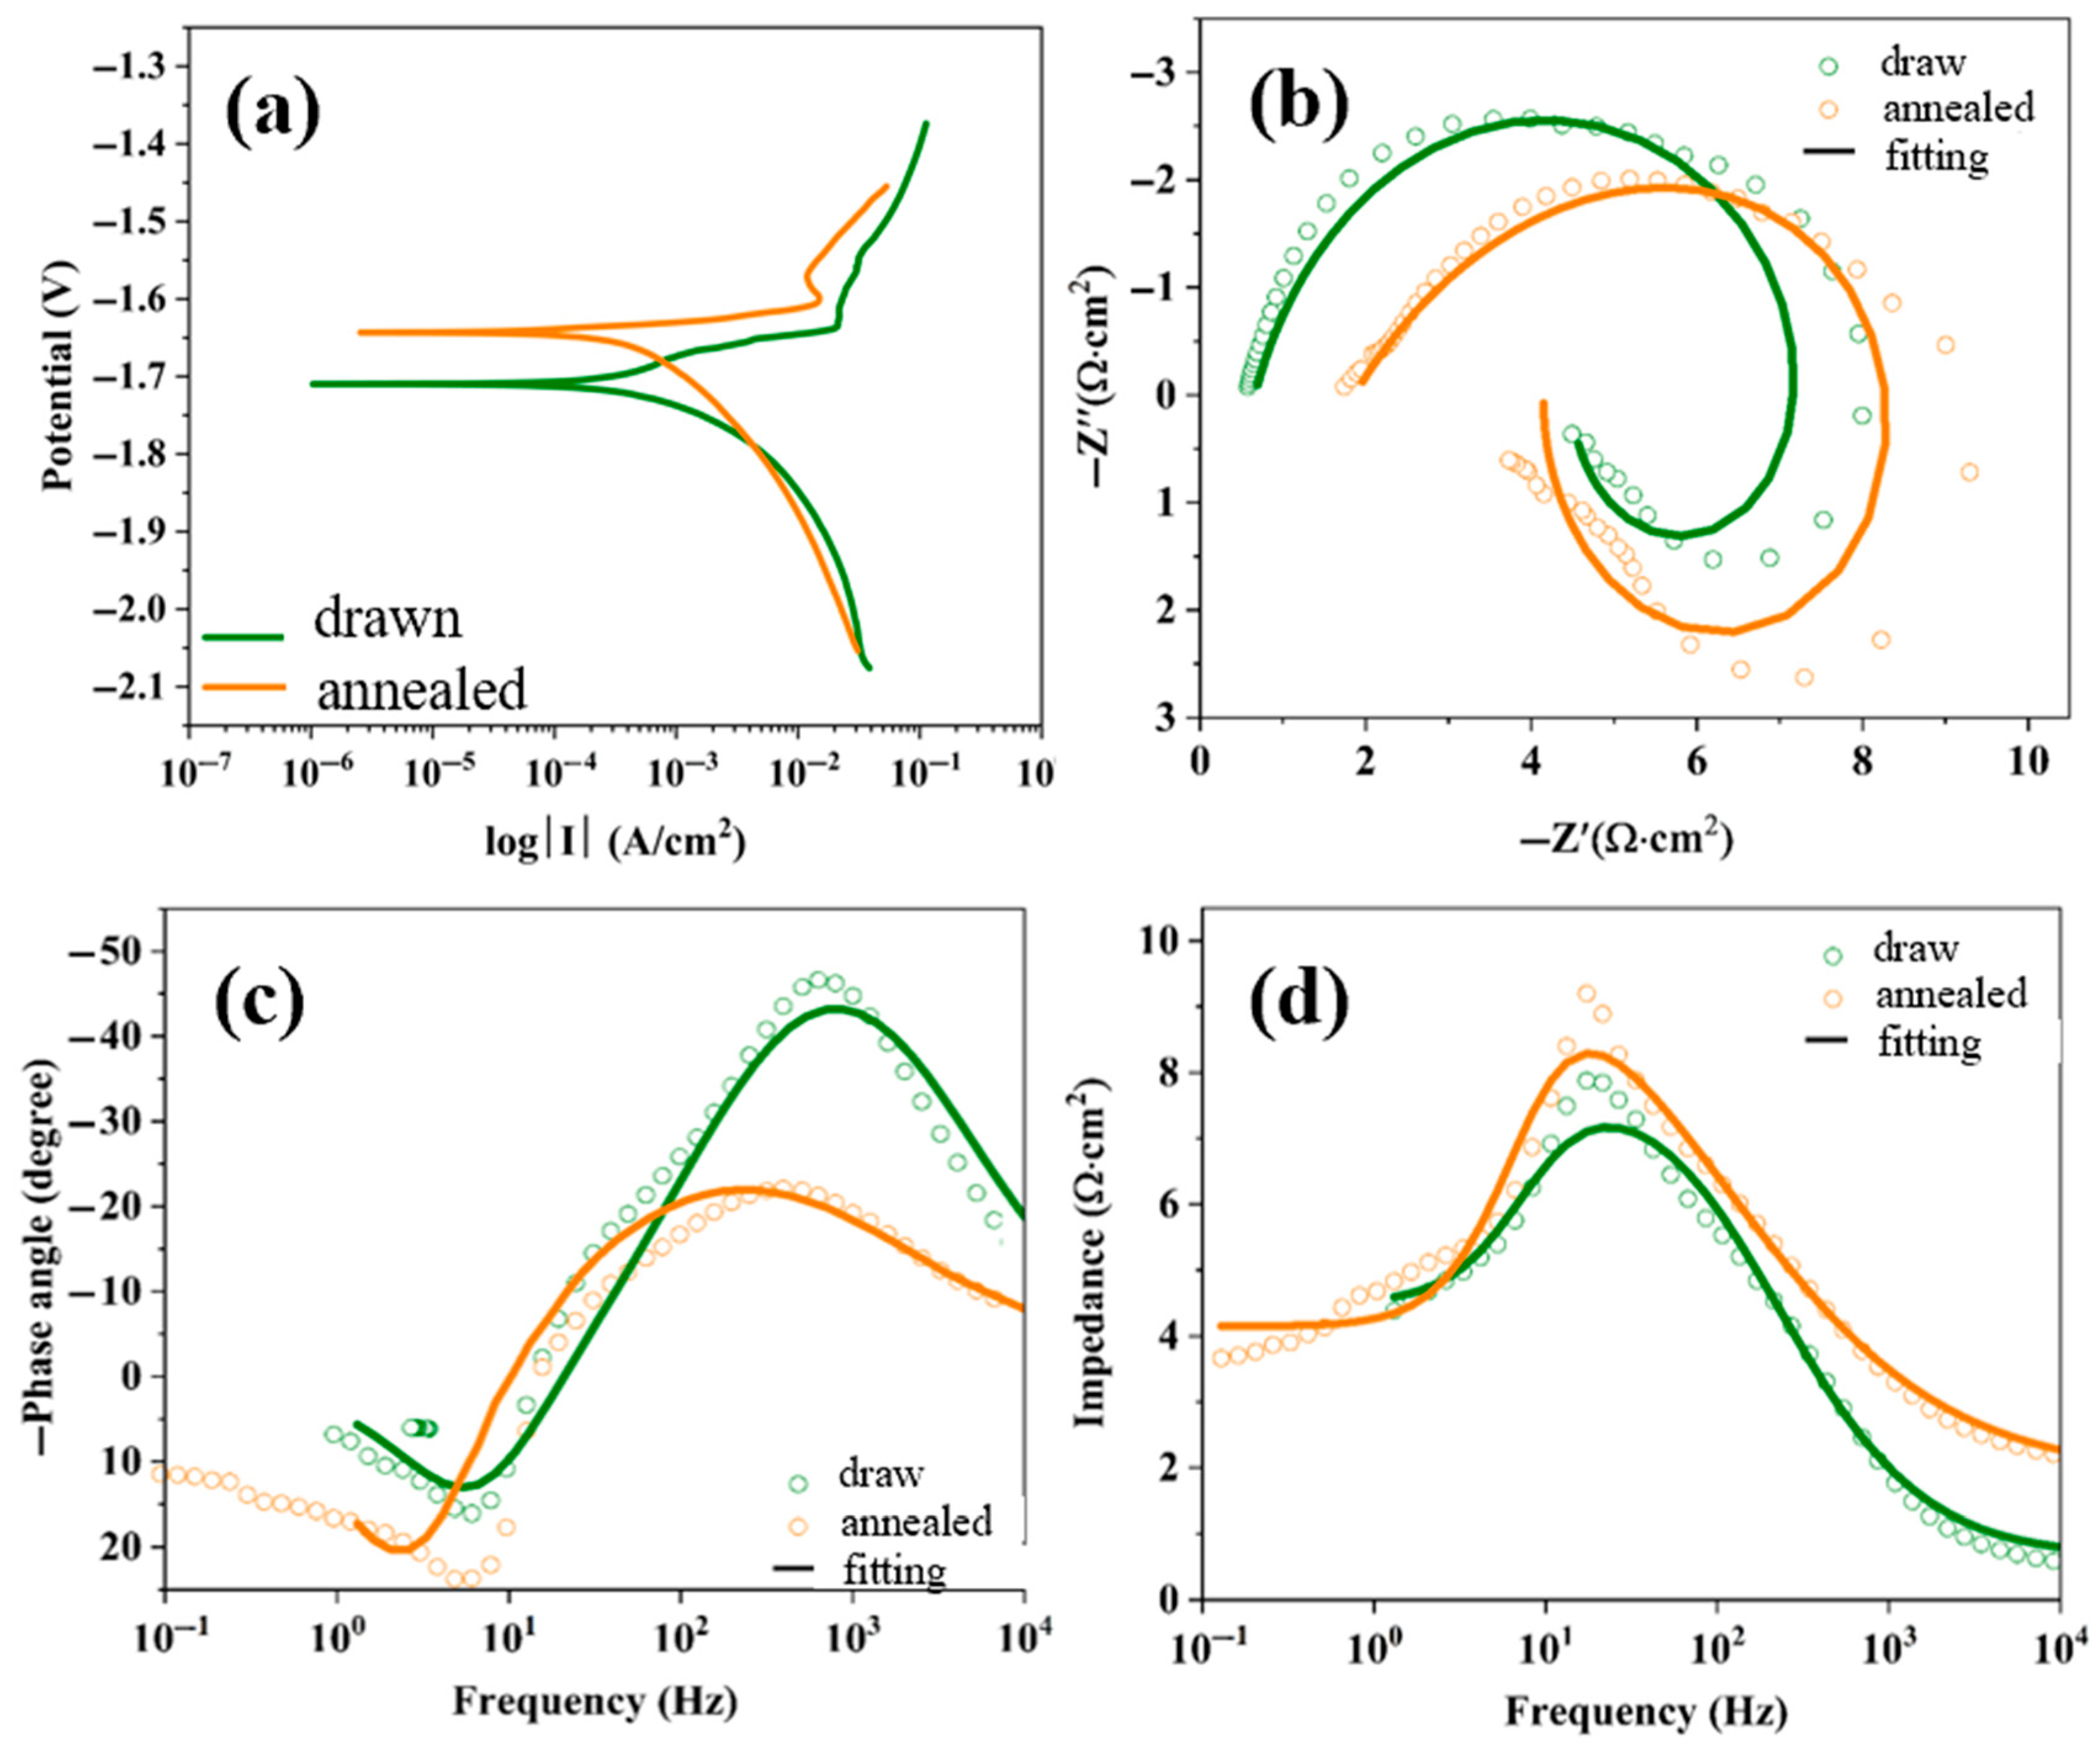
In the electrochemical impedance spectroscopy (
Figure 7), it can be seen that an inductive arc appears in the LA141-0.5Cu wires, indicating that the corrosion product film of the alloy has been damaged. The drawn LA141-0.5Cu wires can be completely dissolved in a 93 °C/3wt% KCl solution for about 6 h. Based on this, it is speculated that the corrosion process of the alloy is as follows: After corrosion, the surface of the alloy rapidly corrodes, forming a corrosion product film. Under the action of Cl
−, the corrosion product film is quickly destroyed, and the exposed Mg continues to corrode. The Cu-containing second phase in the alloy undergoes galvanic corrosion with the substrate, further promoting the corrosion of Mg-Li alloys.
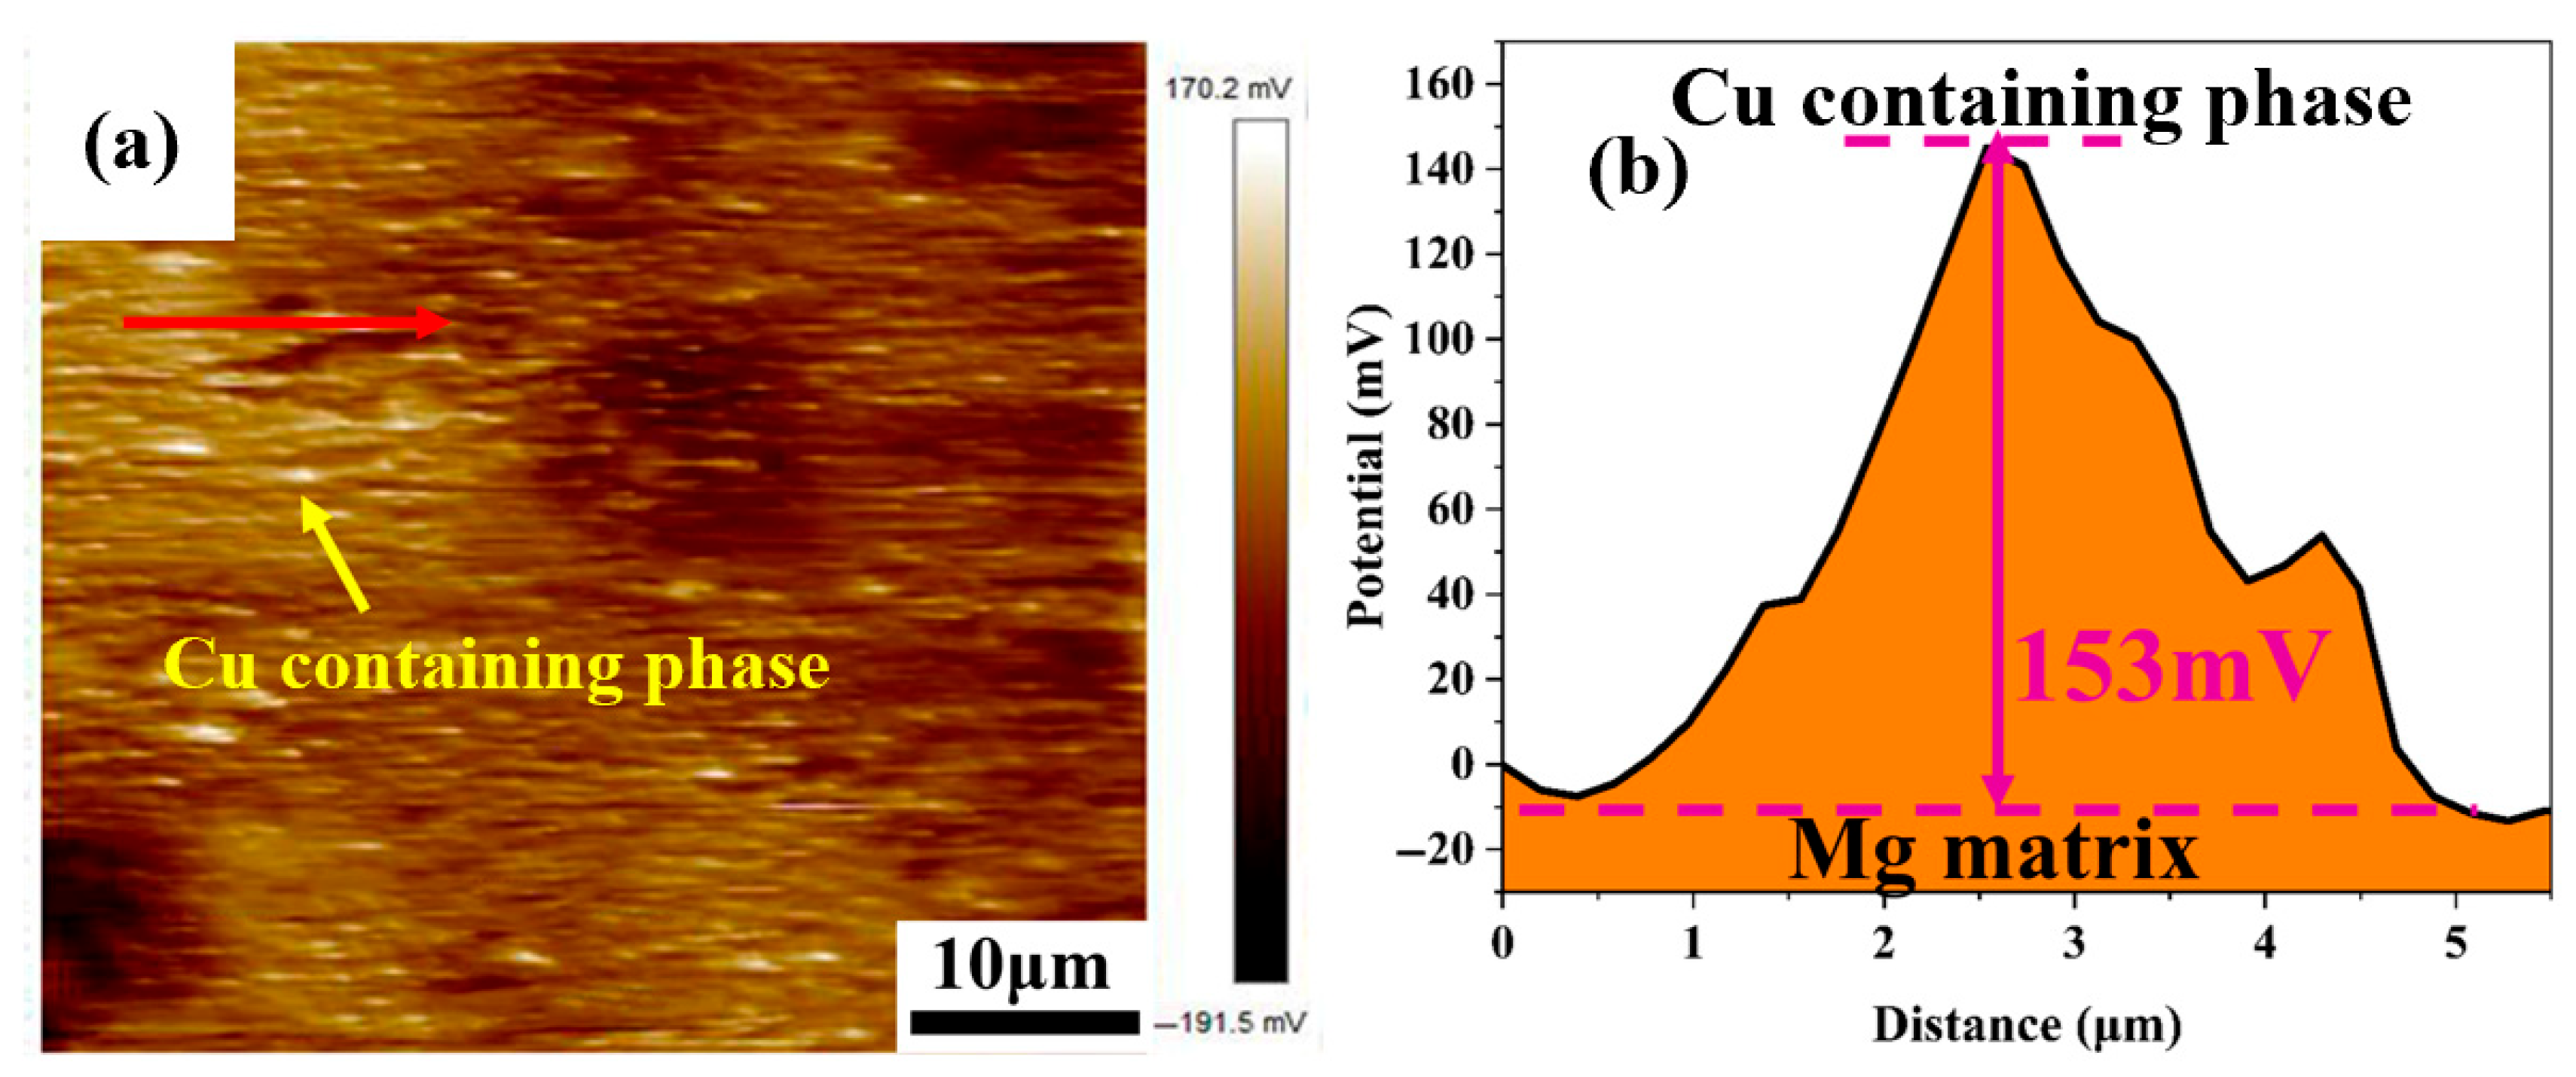
The second phase is an important factor affecting the corrosion of magnesium alloys. In LA141-0.5Cu wires, there is a potential difference between the Cu-containing second phase and α-Mg; as shown in
Figure 8, the potential of the second phase is higher than the potential of α-Mg. And the potential of α-Mg is higher than the potential of β-Li [
22], which can form an electric couple with the matrix, leading to galvanic corrosion in the alloy. The solid solubility of Cu in Mg and Li is extremely low, almost insoluble in Mg-Li alloys, and exists in the form of a second phase in Mg-Li alloys. In previous microstructural studies, it was found that the vast majority of the second phase in Mg-Li-Al-Cu alloys is the Cu-containing phase. The electrode potential of the Cu-containing phase is high, and even with trace addition, the corrosion rate will sharply increase [
23]. In LA141-0.5Cu wires, the potential difference between the Cu-containing phase and the matrix is as high as 153 mV (
Figure 8). The presence of a large amount of Cu-containing second phase greatly promotes the corrosion of the alloy and significantly reduces the corrosion resistance of LA141-0.5Cu wires.
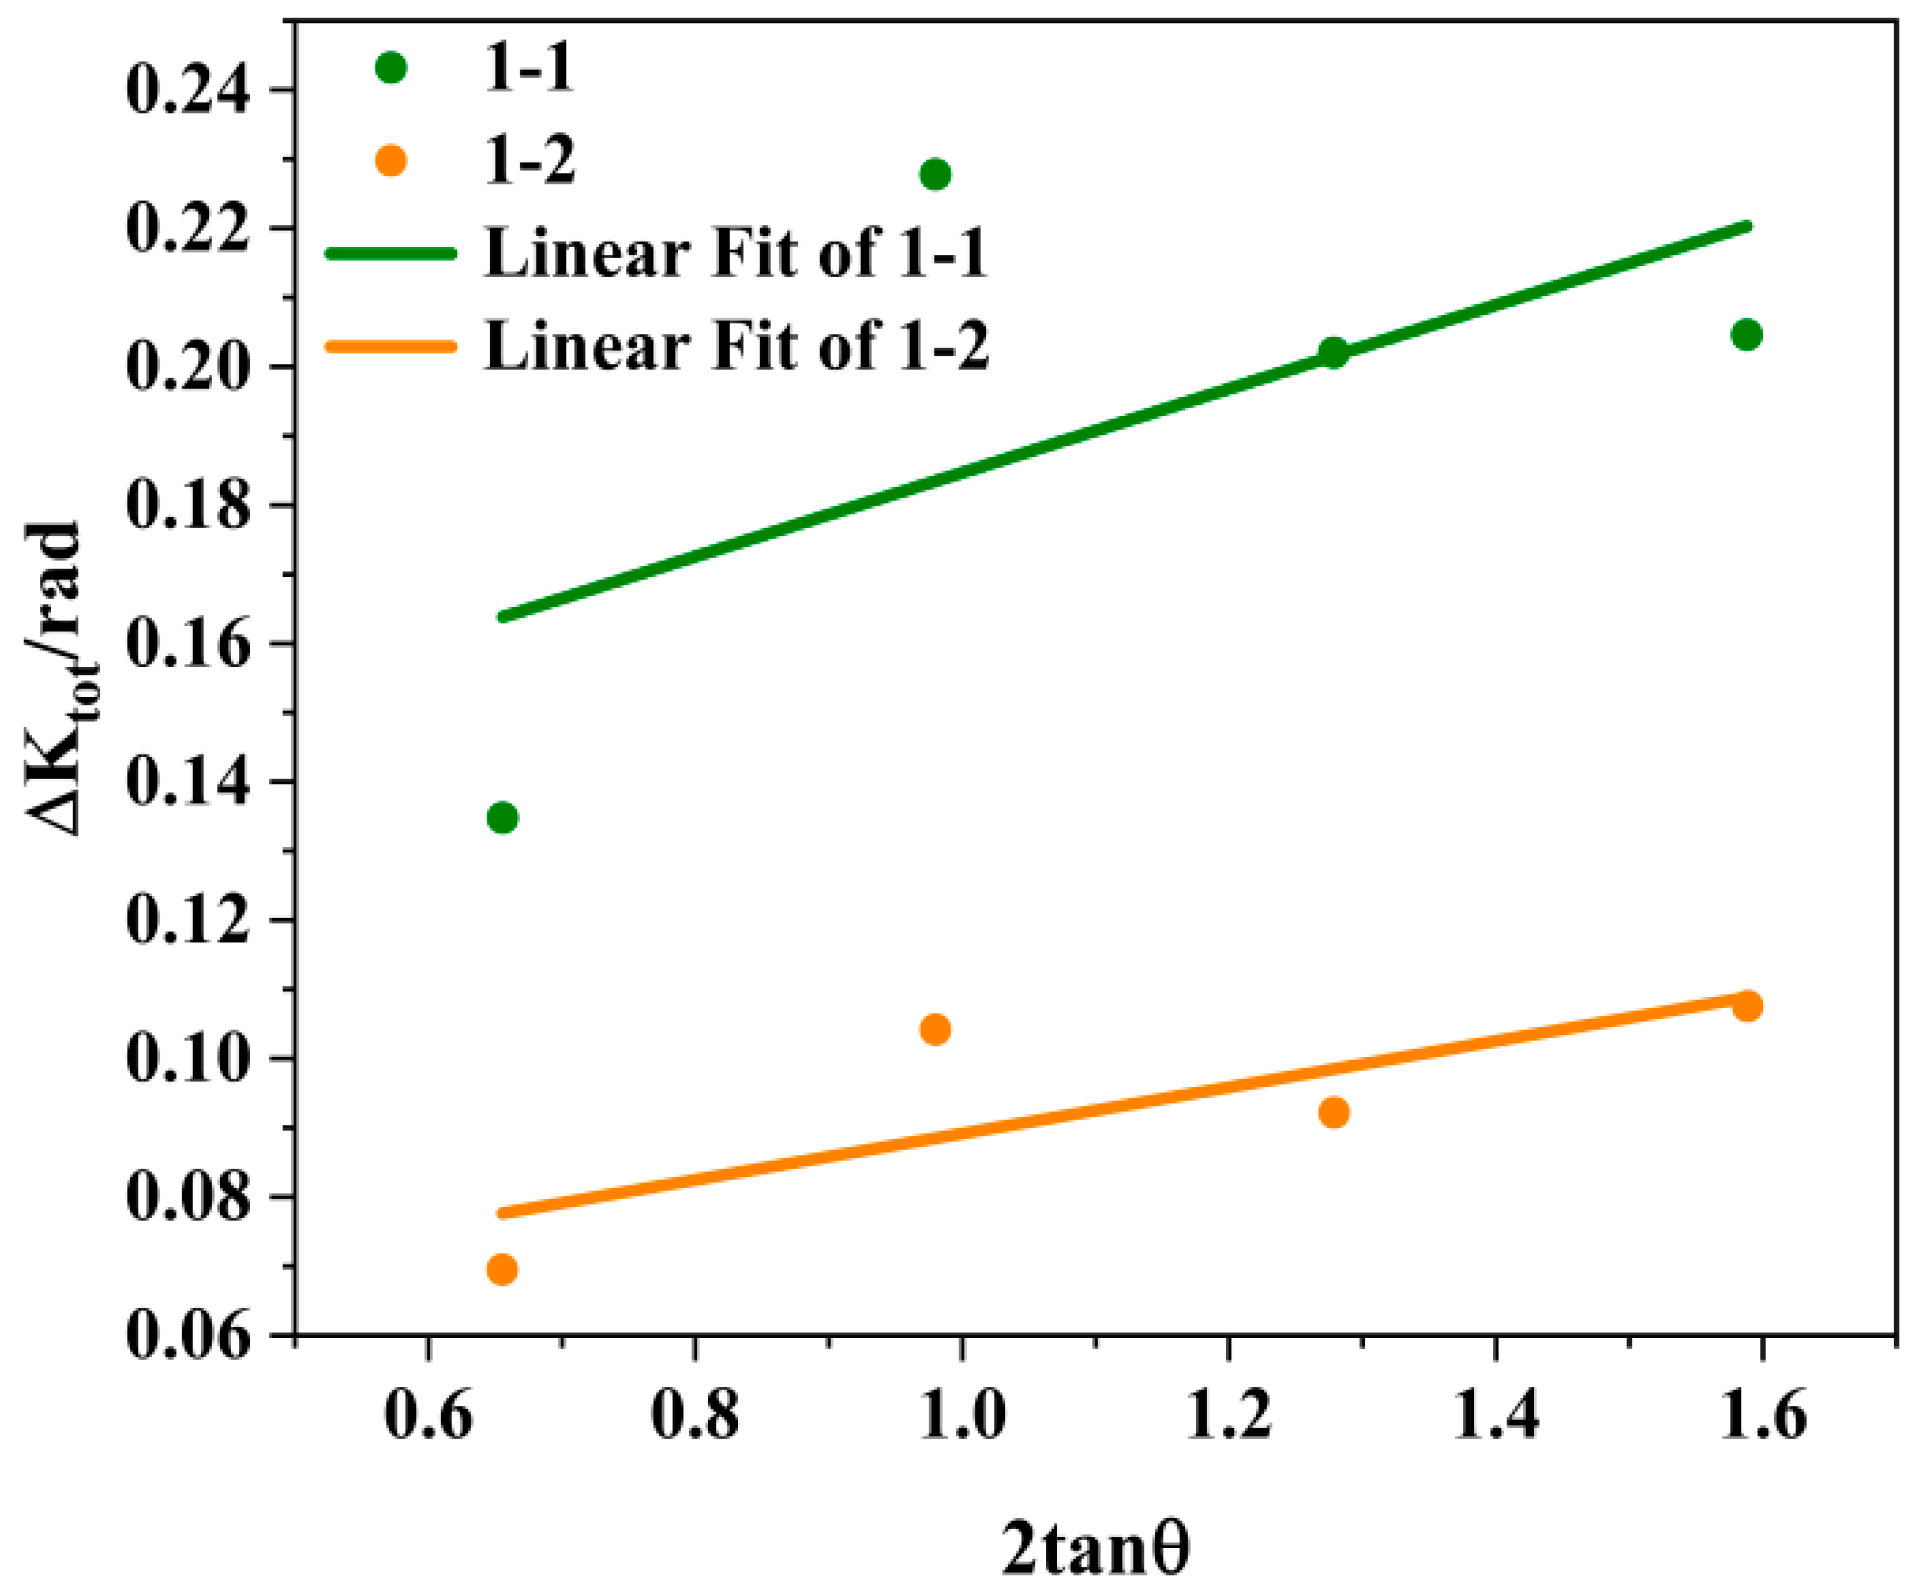
The dislocation density can be roughly calculated using XRD results, and it is related to the diffraction peak width. The grain size and lattice distortion caused by defects such as dislocations and stacking faults can all affect the diffraction peak width of XRD. Here, the Williamson–Hall formula is used to calculate dislocation density [
24]. The formula for calculating the diffraction peak width related to grain size is Equation (1), the formula for calculating the diffraction peak width related to lattice distortion is Equation (2), and the formula for calculating the total diffraction peak width is Equation (3):
In the formula, λ is the wavelength of the incident wave (λ = 0.15406 nm), L is the average grain size, θ is the diffraction angle, and k is a constant with a value of 0.9 [
25]. ε is the full width at half maximum of the strain distribution, and the value of ε is related to the crystal plane. The formula here assumes that the strain distribution is isotropic and does not consider the influence of anisotropy, so the ε value of any diffraction crystal plane is the same. The value c is a constant, and its value is related to the distribution of lattice distortion in the grain. Here, the value of c is set to 2. At this point, Δ K
tot = (k λ)/(Lcos θ) + c ε tan θ = 0.135414/(Lcos θ) + ε 2tan θ. Using 2tan θ as the horizontal axis and Δ Ktot as the vertical axis, the fitting results are shown in
Figure 9, where 1-1 represents the drawn state and 1-2 represents the annealed state. It was clearly observed that the slope ε decreased after annealing, and the fitting results showed that the as-drawn ε was 0.06059 and the as-annealed ε was 0.03345.
The calculation formula for dislocation density is shown in Equation (4) [
24]:
Here, ρ is the dislocation density, B is a constant related to the elastic modulus and dislocation configuration of the material, and b is the Bernoulli vector modulus [
24]. This formula assumes the isotropy of continuum mechanics and elasticity, without considering the anisotropy of elasticity on different crystal planes. After annealing, the value of ε decreases, which leads to a decrease in dislocation density. The ε of drawn wires is 1.8 times that of the annealed wires; therefore the dislocation density in the drawn wires is 1.8 times that of the annealed wires. This is the reason why the corrosion rate decreases after annealing [
26].
Author Contributions
Conceptualization, J.X. and Q.S.; methodology, Y.S. and J.Q.; validation, Q.S., Y.S. and D.W.; formal analysis, Q.S. and R.W.; investigation, S.Z. and Z.T.; data curation, R.W. and J.Q.; writing—original draft preparation, Q.S. and Z.T.; writing—review and editing, J.X. and S.Z.; visualization, D.W.; supervision, Y.S.; project administration, J.X.; funding acquisition, J.X. All authors have read and agreed to the published version of the manuscript.
Funding
This work was funded by the China National Petroleum Corporation Technology Project (2022yjcq05, 2023ZZ28YJ02).
Data Availability Statement
The original contributions presented in this study are included in the article. Further inquiries can be directed to the corresponding author.
Conflicts of Interest
All authors are employed by the Research Institute of Petroleum Exploration & Development and the Key Laboratory of Oil and Gas Reservoir Transformation of China National Petroleum Corporation. All authors declare that the research was conducted in the absence of any commercial or financial relationships that could be construed as a potential conflict of interest.
References
- Sun, J.; Du, W.; Fu, J.; Liu, K.; Li, S.; Wang, Z.; Liang, H. A review on magnesium alloys for application of degradable fracturing tools. J. Magnes. Alloys 2022, 10, 2649–2672. [Google Scholar] [CrossRef]
- Zheng, C.; Liu, Y.; Wang, H.; Chen, C.; Qin, J.; Liu, Z.; Shen, Y. Numerical simulation of the conveyance characteristics of fracturing ball in the horizontal section. J. Nat. Gas Sci. Eng. 2016, 34, 401–411. [Google Scholar] [CrossRef]
- Ali, N.A.; Ismail, M. Advanced hydrogen storage of the Mg-Na-Al system: A review. J. Magnes. Alloys 2021, 9, 1111–1122. [Google Scholar] [CrossRef]
- Chaharmahali, R.; Fattah-Alhosseini, A.; Babaei, K. Surface characterization and corrosion behavior of calcium phosphate (Ca-P) base composite layer on Mg and its alloys using plasma electrolytic oxidation (PEO): A review. J. Magnes. Alloys 2021, 9, 21–40. [Google Scholar] [CrossRef]
- Farshid, S.; Kharaziha, M. Micro and nano-enabled approaches to improve the performance of plasma electrolytic oxidation coated magnesium alloys. J. Magnes. Alloys 2021, 9, 1487–1504. [Google Scholar] [CrossRef]
- Javaid, A.; Czerwinski, F. Progress in twin roll casting of magnesium alloys: A review. J. Magnes. Alloys 2021, 9, 362–391. [Google Scholar] [CrossRef]
- Li, Q.; Lu, Y.; Luo, Q.; Yang, X.; Yang, Y.; Tan, J.; Dong, Z.; Dang, J.; Li, J.; Chen, Y.; et al. Thermodynamics and kinetics of hydriding and dehydriding reactions in Mg-based hydrogen storage materials. J. Magnes. Alloys 2021, 9, 1922–1941. [Google Scholar] [CrossRef]
- Jia, X.; Song, J.; Xiao, B.; Liu, Q.; Zhao, H.; Yang, Z.; Wu, L.; Jiang, B.; Atrens, A.; Pan, F. Influence of indentation size on the corrosion behaviour of a phosphate conversion coated AZ80 magnesium alloy. J. Mater. Res. Technol. 2021, 14, 1739–1753. [Google Scholar] [CrossRef]
- Kim, J.I.; Nguyen, H.N.; You, B.S.; Kim, Y.M. Effect of Y addition on removal of Fe impurity from magnesium alloys. Scr. Mater. 2019, 165, 355–360. [Google Scholar] [CrossRef]
- Liu, M.; Uggowitzer, P.J.; Nagasekhar, A.V.; Schmutz, P.; Easton, M.; Song, G.L.; Atrens, A. Calculated phase diagrams and the corrosion of die-cast Mg–Al alloys. Corros. Sci. 2009, 51, 602–619. [Google Scholar] [CrossRef]
- Liu, M.; Song, G.L. Impurity control and corrosion resistance of magnesium—Aluminum alloy. Corros. Sci. 2013, 77, 143–150. [Google Scholar] [CrossRef]
- Liu, B.; Yang, Y.; Zhang, Y.; Du, H.; Hou, L.; Wei, Y. Investigation of rapidly decomposable AZ91-RE-xCu (x = 0, 1, 2, 3, 4) alloys for petroleum fracturing balls. J. Phys. Chem. Solids 2020, 144, 109499. [Google Scholar] [CrossRef]
- Wang, X.W.; Wang, W.; Chen, W.; Chen, D.M. Effects of Indium on corrosion behavior of Mg-Al-Cu alloy. Mater. Charact. 2021, 177, 111157. [Google Scholar] [CrossRef]
- Niu, H.; Deng, K.; Nie, K.; Cao, F.; Zhang, X.; Li, W. Microstructure, mechanical properties and corrosion properties of Mg-4Zn-xNi alloys for degradable fracturing ball applications. J. Alloys Compd. 2019, 787, 1290–1300. [Google Scholar] [CrossRef]
- Liu, Y.H.; Zhang, Z.R.; Wang, J.; Li, Y.; Li, H.X.; Jia, L.Y.; Wang, J.H.; Zhang, J.S. A novel Mg-Gd-Y-Zn-Cu-Ni alloy with excellent combination of strength and dissolution via peak-aging treatment. J. Magnes. Alloys 2023, 11, 720–734. [Google Scholar] [CrossRef]
- Wang, J.; Gao, S.; Liu, X.; Peng, X.; Wang, K.; Liu, S.; Jiang, W.; Guo, S.; Pan, F. Enhanced mechanical properties and degradation rate of Mg–Ni–Y alloy by introducing LPSO phase for degradable fracturing ball applications. J. Magnes. Alloys 2020, 8, 127–133. [Google Scholar] [CrossRef]
- Zhong, S.; Zhang, D.; Wang, Y.; Chai, S.; Feng, J.; Luo, Y.; Hua, J.; Dai, Q.; Hu, G.; Xu, J.; et al. Microstructures, mechanical properties and degradability of Mg-2Gd-0.5(Cu/Ni) alloys: A comparison study. J. Mater. Sci. Technol. 2022, 128, 44–58. [Google Scholar] [CrossRef]
- Ma, K.; Liu, S.; Dai, C.; Liu, X.; Ren, J.; Pan, Y.; Peng, Y.; Su, C.; Wang, J.; Pan, F. Effect of Ni on the microstructure, mechanical properties and corrosion behavior of MgGd1Nix alloys for fracturing ball applications. J. Mater. Sci. Technol. 2021, 91, 121–133. [Google Scholar] [CrossRef]
- Ji, F.; Xin, T.; Zhao, Y.; Yang, W.; Bai, G.; Tang, S.; Guo, E.; Zhou, M.; Shi, Q.; Cui, L.; et al. Enhancing plasticity in BCC Mg-Li-Al alloys through controlled precipitation at grain boundaries. Int. J. Plast. 2024, 181, 104105. [Google Scholar] [CrossRef]
- Liu, Y.; Li, H.; Zhang, Z.; Li, Y.; Jia, L.; Wang, J.; Wang, J.; Zhang, J. Effect of Cu micro-alloying on the microstructure, mechanical and corrosion properties of Mg-Gd-Y-Zn based alloy applied as plugging tools. J. Alloys Compd. 2023, 939, 168768. [Google Scholar] [CrossRef]
- Zhong, Q.P. Fractography; Higher Education Press: Beijing, China, 2006. [Google Scholar]
- Dong, L.; Liu, X.; Liang, J.; Li, C.; Dong, Y.; Zhang, Z. Corrosion behavior of a eutectic Mg−8Li alloy in NaCl solution. Electrochem. Commun. 2021, 129, 107087. [Google Scholar] [CrossRef]
- Xiao, D.; Geng, Z.W.; Chen, L.; Wu, Z.; Diao, H.Y.; Song, M.; Zhou, P.F. Effects of Alloying Elements on Microstructure and Properties of Magnesium Alloys for Tripling Ball. Metall. Mater. Trans. A 2015, 46, 4793–4803. [Google Scholar] [CrossRef]
- Li, Y.Z.; Huang, M.X. A Method to Calculate the Dislocation Density of a TWIP Steel Based on Neutron Diffraction and Synchrotron X-Ray Diffraction. Acta Metall. Sin. 2020, 56, 487–493. [Google Scholar]
- Holzwarth, U.; Gibson, N. The Scherrer equation versus the ‘Debye-Scherrer equation’. Nat. Nanotechnol. 2011, 6, 534. [Google Scholar] [CrossRef]
- Zhang, C.; Wu, L.; Huang, G.; Chen, L.; Xia, D.; Jiang, B.; Atrens, A.; Pan, F. Effects of Fe concentration on microstructure and corrosion of Mg-6Al-1Zn-xFe alloys for fracturing balls applications. J. Mater. Sci. Technol. 2019, 35, 2086–2098. [Google Scholar] [CrossRef]
| Disclaimer/Publisher’s Note: The statements, opinions and data contained in all publications are solely those of the individual author(s) and contributor(s) and not of MDPI and/or the editor(s). MDPI and/or the editor(s) disclaim responsibility for any injury to people or property resulting from any ideas, methods, instructions or products referred to in the content. |
© 2025 by the authors. Licensee MDPI, Basel, Switzerland. This article is an open access article distributed under the terms and conditions of the Creative Commons Attribution (CC BY) license (https://creativecommons.org/licenses/by/4.0/).

