Abstract
Rare-earth tantalates (RETaO4) are considered as a type of emerging thermal barrier coating materials applied to the hot components of gas turbines and aerospace engines due to their excellent thermal stability, high-temperature fracture toughness, corrosion resistance and extremely low thermal conductivity. However, the relatively low hardness and thermal expansion coefficients may limit their service lifetime in a harsh engine environment. To address the current limitation of rare-earth tantalates and further optimize the mechanical and thermal properties, the defective fluorite-structured Y₂Zr₂O₇ (YZ) was introduced as a second phase into the YTaO4 (YT) matrix to form YT1−x–YZx (x = 0, 0.25, 0.5, 0.75, 1) composite ceramics in this work. The mechanical and thermal properties of YT1−x–YZx composite ceramics are significantly improved compared to pure-phase YTaO4 ceramics. The Vickers hardness of YT1−x–YZx (x = 0.25, 0.5, 0.75) composite ceramics is 9.1~11.3 GPa, which are 2~2.5 times higher than that of YTaO4 (4.5 GPa). Among them, YT0.75–YZ0.25 exhibits a maximum fracture toughness (3.7 ± 0.5 MPa·m1/2), achieving a 23% improvement compared to YTaO4 (3.0 ± 0.23 MPa·m1/2) and a 118% improvement compared to Y2Zr2O7 (1.73 ± 0.28 MPa·m1/2). The enhancement is attributed to the combined effect of the intrinsic strengthening of the second phase, as well as the residual stress and grain refinement caused by the introduction of a second phase. Additionally, the thermal expansion coefficients of YT1−x–YZx composite ceramics at 1673 K range from 10.3 × 10⁻⁶ K⁻1 to 11.0 × 10⁻⁶ K⁻1, which is also higher than that of YTaO4 (10.0 × 10⁻⁶ K−1). Consequently, the superior mechanical and thermal properties indicate that YT–YZ composite ceramics possess promising application prospects for thermal barrier coatings.
1. Introduction
Thermal barrier coating (TBC) materials are essential for modern aircrafts and gas turbine engines to protect the hot components from high-temperature combustion damage and improve the service temperature and fuel efficiency [1,2,3,4]. In general, the key criteria for evaluating TBC materials are their thermal insulation performance and service lifetime [5,6,7]. The thermal insulation performance of TBC materials is closely related to the thermal conductivity, i.e., a lower thermal conductivity leads to better insulation and thereby significantly reduces the surface temperature of the alloy substrate. On the other hand, the intrinsic properties, such as hardness, fracture toughness, thermal expansion coefficient (TEC) and high-temperature stability of TBC materials directly affect their service lifetime in extreme environments [8,9]. High hardness and fracture toughness are beneficial for resisting the damage caused by external particle impacts, minimizing crack initiation and propagation, protecting the coating’s integrity, and thus extends the service lifetime [10,11,12]. The current TBC system consists of a ceramic topcoat and a bond coat [13]. The bond coat, which is in direct contact with the ceramic layer, is most commonly a Ni-based alloy, which enhances the bonding strength between the ceramic layer and the substrate. The thermal expansion coefficient compatibility between the bond coat and the ceramic layer is a key factor for the service lifetime, because good compatibility can reduce the thermal stresses between the ceramic layer and the bond coat [11,14,15]. In addition, TBC materials cannot undergo phase transitions or decomposition in high-temperature environments, which requires the TBC materials to possess excellent thermal stability [16]. Overall, low thermal conductivity, matched TEC with the bond alloy, good mechanical properties and thermal stability are priorities when selecting TBC materials [4].
Currently, the most widely used ceramic topcoat material for TBCs is yttria-stabilized zirconia (YSZ) for its superior mechanical and thermal physical properties, such as excellent fracture toughness, high thermal expansion coefficient and low thermal conductivity [17,18,19]. However, YSZ undergoes a phase transformation from the metastable tetragonal phase to the tetragonal structure when the service temperature is above 1473 K and reverses back to the monoclinic phase upon cooling with a sudden volume change in the range of 3–5%, which results in significant internal stress in the coatings and ultimately coating spallation [20]. In order to improve the working temperature of TBCs, several types of candidate materials with better thermal stability have been proposed in recent years, including RE2Zr2O7, REPO4, RE2SiO5 and RETaO4 [1,2,3,4,6,7,21]. Among these materials, rare-earth tantalates (RETaO4) are a type of emerging TBC material with higher service temperatures (above 1673 K) and lower thermal conductivity (3.94–1.40 W·m⁻1·K⁻1 at 373–1173 K) [7]. More importantly, the fracture toughness of RETaO4 (2.4–3.8 MPa·m1/2) is significantly higher than that of other candidate materials due to the ferroelastic domains switching the toughening effect [22]. When RETaO4 ceramics are subjected to external loads, the ferroelastic domains that are randomly distributed in the grains of RETaO4 switch to a direction that is parallel to the applied load. This ferroelastic domain switching provides an additional channel to the crack energy dissipation and thus results in a toughening effect [23]. However, the hardness and thermal expansion coefficients of RETaO4 are relatively low compared to YSZ, which is not conductive to the long-term service of RETaO4 coatings in the engine environments that require withstanding high-speed particle impacts and strong thermal shocks [24,25]. Unfortunately, the previous investigations of RETaO4 materials mainly concentrate on the enhancement of the fracture toughness and the suppression of the thermal conduction; few studies focus on the regulation of hardness and thermal expansion coefficients that are closely related to the service lifetime of TBCs. Numerous results indicate that introducing a second phase with a high thermal expansion coefficient and hardness can effectively improve the comprehensive properties of the matrix materials [26,27,28,29,30]. For example, Wang et al. reported a kind of rare-earth tantalate (Y1/6Yb5/6TaO4) ceramic enhanced by introducing 8YSZ as a second phase, which exhibits higher toughness and lower thermal conductivity compared to single-phase rare-earth tantalates [31]. Nevertheless, due to the limitation of the phase stability temperature of YSZ, this composite ceramic strengthened by introducing YSZ may not be capable of long-term service at higher temperatures. Compared to YSZ, rare-earth zirconate (RE2Zr2O7) is a class of TBC candidate material that possesses higher thermal stability and outstanding mechanical properties, which can be considered as an ideal second-phase matrix to form YT1−x–YZx (x represents the volume ratios of the YZ phase in the composite ceramics, which are 0, 0.25, 0.5, 0.75, and 1) composite ceramics in this work. The YT–YZ composite ceramics exhibit enhanced hardness (9.1–11.3 GPa), fracture toughness (1.8–3.7 MPa·m1/2) and higher TECs (10.3–11 × 10⁻⁶ K⁻1) compared with single-phase YTaO4 and Y₂Zr₂O₇. The multiple mechanisms, including the intrinsic properties of the second phase, residual stress and grain refinement caused by the introduction of the second phase that synergistically affect the mechanical and thermal properties of the composite ceramics, are comprehensively investigated.
2. Experiments and Methods
2.1. Synthesis and Densification
The YT (YTaO4) and YZ (Y2Zr2O7) powders were synthesized by using a solid-state reaction method. Firstly, the raw materials, Y2O3, Ta2O5 and ZrO2 powders (purity 99.99%, Aladdin Biochemical Technology Co., Ltd., Shanghai, China), were mixed in the stoichiometric ratio of the target products. The mixture was then placed in a ball mill jar and ball milled at a speed of 350 rpm for 24 h in anhydrous ethanol. After ball milling, the mixture was dried in an oven at 393 K for 48 h to obtain mixed powders. The mixed powders were then calcined in a muffle furnace at 1823 K for 6 h to obtain YT and YZ powders. To prepare the composite ceramics, the as-synthesized YT and YZ powders in different volume ratios were mixed by ball milling first. The mixed powders, as well as the individual YT and YZ powders, were then placed into a 15 mm-diameter die mold. A uniaxial press and a cold isostatic press were successively used to apply the pressures of 240 MPa and 400 MPa, respectively, to form disc-shaped samples with a thickness of 2 mm. The disc-shaped samples were sintered in a furnace at 1973 K for 4 h to obtain YT1−x–YZx (x = 0.25, 0.5, 0.75) composite ceramics as well as the single-phase YT and YZ ceramics.
2.2. Phase Composition and Microstructure Characterization
The phase composition was determined by using an X-ray diffraction device (XRD, MiniFlex 600, Rigaku, Tokyo, Japan) with a step of 0.02° at a scanning rate of 5°/min. A scanning electron microscope (SEM, Apreo-2-S, Thermo Fisher, Waltham, MA, USA) equipped with an energy dispersive spectrometer (EDS, Ultim-MAX-65, Oxford Instruments, Oxford, UK) was used to observe the microstructure of the samples. Prior to the SEM observation, the YT1−x–YZx (x = 0, 0.25, 0.5, 0.75, 1) ceramic blocks were polished and received treatment at 1773 K for 4 h to make the grain boundaries clear.
2.3. Mechanical Properties
The elastic modulus measurement was performed via the ultrasonic reflection method by using an ultrasonic reflection device (UMS-100, Teclab, Tassin-la-Demi-Lune, France). During the measurement, a transverse wave transducer (probe frequency: 5 MHz, excitation voltage: 50 V) and a longitudinal wave transducer (probe frequency: 20 MHz, excitation voltage: 200 V) were utilized to measure the transverse sound velocity (VL) and longitudinal sound velocity (VT) of the samples. The mean acoustic velocity (VM), Young’s modulus (E) and Poisson’s ratio (υ) were calculated based on VL and VT based on the following equation [32]:
The measurements of VL and VT were repeated three times, and the average values were used for the calculation. The shear modulus (G) and bulk modulus (B) were obtained by the following relationships [32]:
Since the sintered bulk specimens are not fully dense, the Young’s modulus of the fully dense materials (E′) is corrected by the following equation to eliminate the effect of residual micro-pores [33]:
where P is the porosity of the specimens, E is the experimental Young’s modulus of the specimens.
The Vickers hardness (Hv) and fracture toughness (KIC) were measured by using a Vickers hardness tester (HMV-G-FA, Shimadzu, Japan). The schematic diagram of Vickers hardness and fracture toughness measurements by the Vickers indentation is shown in Figure 1. The measured surfaces of the samples were mounted and polished to achieve a smooth and mirror-like surface. The indentation load was set to 9.8 N with a holding time of 15 s. The Vickers hardness (Hv) was calculated by using the following equation [34]:
where F is the indentation load and d is half of the indentation diagonal length. The calculation of the fracture toughness (KIC) is based on the indentation of the Vickers hardness measurement, which is obtained by the following equation [34]:
where c represents half the crack length and E is Young’s modulus.

Figure 1.
Schematic diagram of Vickers hardness and fracture toughness measurement by the Vickers indentation, a is the indentation diagonal length, c is the indentation diagonal crack length.
2.4. Thermal Properties
The thermal expansion coefficient of the samples was measured by using a horizontal push-rod dilatometer (DIL 402, Netzsch, Selb, Germany) at a heating rate of 5 K/min in a temperature range of 298–1673 K. Before the measurement, the samples were cut and polished into strips with dimensions of 9 mm × 2 mm × 1 mm. The thermal expansion coefficient was calculated by using the following equation:
where ΔL represents the change in the sample length, L is the sample length at room temperature, T0 is the room temperature (298 K) and T is the measurement temperature.
Since the thermal expansion coefficient between the dual phases was different, a residual stress was generated in YZ and YT upon cooling from the sintering temperature (1973 K) to room temperature. The residual stress in YT and YZ of dual-phase ceramics is calculated as [35,36,37]:
where σp, σm and Ep, Em are the thermal residual stresses in the second-phase particles and matrix, respectively, and x, ν, Tr, TP, α and E represent the volume fraction of the second phase, Poisson’s ratio, measurement temperature, sintering temperature, thermal expansion coefficient and elastic modulus, respectively.
The thermal diffusivity (λ) was measured by using a laser flash thermal analysis instrument (LFA457, Netzsch, Germany) in an argon atmosphere within a temperature range of 298–1173 K. Before the measurement, the samples were cut and polished into circular discs with a diameter of 6 mm and a thickness of 1 mm ± 0.1 mm. To ensure maximum energy transfer during the laser flash method, the surface of the samples was coated with carbon. To minimize measurement errors, three laser shots were performed at each temperature point, and the average value was calculated. The thermal conductivity (k) was calculated from the thermal diffusivity (λ) according to the following equation [38]:
where Cp represents the specific heat capacity, which is calculated using the Neumann–Kopp rule [39], and ρ denotes the sample density.
In Equation (13), the effect of the sample’s porosity on the thermal conductivity was not considered. To ensure the accuracy of the thermal conductivity, a correction formula was applied [40]:
where φ represents the porosity of the sample and k0 is the intrinsic thermal conductivity of a fully dense sample.
3. Results
3.1. Phase Composition and Microstructure Analysis
Figure 2a shows the XRD patterns of YT1−x–YZx (x = 0, 0.25, 0.5, 0.75, 1) composite ceramics sintered at 1973 K for 4 h. The XRD patterns reveal that there are no additional peaks apart from the YT and YZ phases, indicating that the composite ceramics were synthesized successfully, and the YT and YZ phases have excellent chemical compatibility within 1973 K. Significantly, the XRD pattern of the YT0.25–YZ0.75 sample only displays diffraction peaks of YZ, which is due to the solid solution reaction that occurred between YZ and YT at a high temperature. Upon increasing the YT content, the diffraction peaks of the YT phase appear and gradually strengthen. Another example of the solid solution reaction comes from the corresponding magnified XRD patterns (27° ≤ 2θ ≤ 32°) in Figure 2b. It can be seen that the diffraction peaks of the YZ phase in the YTx–YZ1−x (x = 0.25, 0.5, 0.75) composite samples shift toward a higher diffraction angle direction when compared to the single-phase YZ sample. According to Bragg’s equation, this shift of the diffraction angles is attributed to the change in the interplanar spacing, where a higher angle shift represents a lattice contraction while a lower angle shift implies a lattice expansion [41]. Since the ionic radius of Ta⁵⁺ (0.64 Å) is smaller than that of Zr⁴⁺ (0.72 Å), the interplanar spacing of YZ tends to shrink when the Zr⁴⁺ in the crystal structure of the YZ phase is replaced by the Ta⁵⁺ in the YT phase.
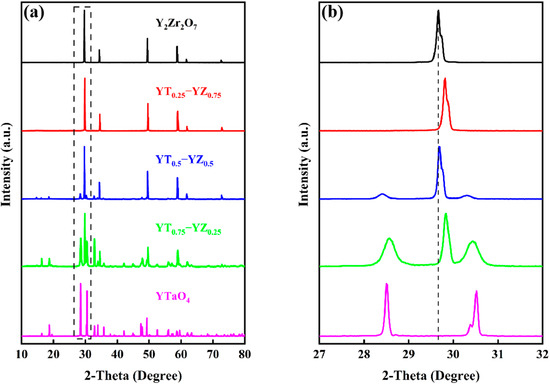
Figure 2.
(a) X-ray diffraction (XRD) patterns of YT1−x–YZx (x = 0, 0.25, 0.5, 0.75, 1) composite ceramics; (b) the corresponding magnified diffraction patterns (27° ≤ 2-Theta ≤ 32°).
Figure 3 shows the backscattered electron (BSE) images and the corresponding EDS mappings for YT1−x–YZx (x = 0, 0.25, 0.5, 0.75, 1) composite ceramics. Due to the significant atomic weight difference between Ta (180.95 g/mol) and Zr (91.22 g/mol), the contrast between YT and YZ grains in the BSE images is obvious, where YT grains appear lighter in color, while YZ grains appear darker. It can be seen that the YT and YZ grains in Figure 3b,c are uniformly distributed, indicating that YZ is successfully introduced as the second phase into the YT matrix phase. In addition, Figure 3d shows that Zr and Ta elements are uniformly distributed in every grain of the YT0.25–YZ0.75 sample and there is only one phase that can be identified, further confirming that a solid solution reaction occurred between YT and YZ, which is consistent with the results of the XRD analysis. Figure 4 shows the surface morphologies of YT1−x–YZx (x = 0, 0.25, 0.5, 0.75, 1) composite ceramics observed by the secondary electron imaging mode of SEM. It can be seen that the YT1−x–YZx (x = 0.25, 0.5, 0.75) composite ceramics exhibit varying degrees of grain refinement compared to the single-phase YT and YZ ceramics, which is attributed to the mutual grain-boundary pinning effect of composite ceramics [42]. To quantitatively describe the degree of grain refinement, the grain size distributions of the samples were statistically counted and the results are presented in Figure 5. The average grain sizes of single-phase YT and YZ are 15.08 and 4.59 μm, respectively. In contrast, the average grain size of the YT1−x–YZx (x = 0.25, 0.5, 0.75) composite ceramics is as low as 2.10–2.94 μm, representing an 81–86% reduction compared to the single-phase YT ceramic. This significant grain refinement indicates that the composite ceramics are expected to possess strengthened mechanical properties due to the Hall–Petch effect [43,44].
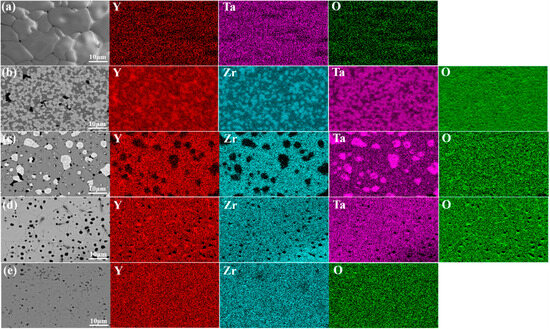
Figure 3.
Backscattered electron (BSE) images and the corresponding EDS mappings of YT1−x–YZx (x = 0, 0.25, 0.5, 0.75, 1) composite ceramics: (a) YT; (b) YT0.25–YZ0.75; (c) YT0.5–YZ0.5; (d) YT0.75–YZ0.25; (e) YZ.

Figure 4.
Surface morphologies of YT1−x–YZx (x = 0, 0.25, 0.5, 0.75, 1) composite ceramics observed by the secondary electron imaging mode of SEM: (a) YT; (b) enlarged image of YT grains in Figure 3a; (c) YT0.75–YZ0.25; (d) YT0.5–YZ0.5; (e) YT0.25–YZ0.75; (f) YZ.
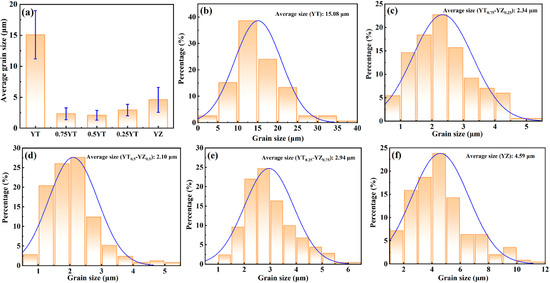
Figure 5.
Grain size distributions of YT1−x–YZx (x = 0, 0.25, 0.5, 0.75, 1) composite ceramics: (a) average grain size of the composite ceramics; (b) YT; (c) YT0.75–YZ0.25; (d) YT0.5–YZ0.5; (e) YT0.25–YZ0.75; (f) YZ.
3.2. Mechanical Property Analysis
Table 1 exhibits the sound velocities (VL, VT, VM), Young’s modulus (E), shear modulus (G), bulk modulus (B) and Poisson’s ratio (υ) of YT1−x–YZx (x = 0, 0.25, 0.5, 0.75, 1) composite ceramics. As the YZ content increases from 0 to 1, the mean acoustic velocity (VM) of YT1−x–YZx increases from 2948 m/s to 4544 m/s. The increased sound velocity represents an increase in the strength of chemical bonds, which also implies the strengthening of the elastic modulus. Thus, the Young’s modulus (E), shear modulus (G) and bulk modulus (B) of the composite ceramics present a gradually increasing tendency with the increase in the YZ content, as exhibited in Figure 6. It is worth noting that the YT0.25–YZ0.75 sample exhibits the highest elastic modulus, which is even higher than that of the single-phase YZ.

Table 1.
Sound velocities (VL, VT, VM), Young’s modulus (E), shear modulus (G), bulk modulus (B) and Poisson’s ratio (υ) of YT1−x–YZx (x = 0, 0.25, 0.5, 0.75, 1) composite ceramics.
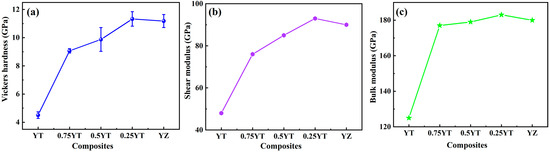
Figure 6.
Elastic modulus of YT1−x–YZx (x = 0, 0.25, 0.5, 0.75, 1) composite ceramics: (a) Young’s modulus (E); (b) shear modulus (G); (c) bulk modulus (B).
The enhanced elastic moludus implies that the composite ceramcis are expected to possess excellent mechanical strength. Figure 7 shows the experimental Vickers hardness and fracture toughness of YT1−x–YZx (x = 0, 0.25, 0.5, 0.75, 1) composite ceramics and the corresponding calculated values obtained by the mixing law. As exhibited in Figure 2 and Figure 3, the YT and YZ phases are uniformly distributed in the composite ceramics and no orientation and texture were detected; thus, we assume that the composite ceramics are isotropic materials when calculating the expected values of the Vickers hardness and fracture toughness of the composite ceramics, which are expressed as:
where x is the volume ratio of the YZ phase in the composite ceramics; Hv(YT) and Hv(YZ) represent the experimental Vickers hardness of single-phase YT and YZ ceramics, respectively; while Kic(YT) and Kic(YZ) represent the experimental fracture toughness of single-phase YT and YZ ceramics, respectively. It can be seen in Figure 7a that the experimental Vickers hardness of YT1−x–YZx composite ceramics exhibits a similar trend of variation as the elastic moludus, which increases as the YZ content increases. Moreover, the experimental Vickers hardness of YT1−x–YZx (x = 0.25, 0.5, 0.75) composite ceramics (9.1~11.3 GPa) is also significantly higher than the calculated values, which is 2~2.5 times higher than that of single-phase YTaO4 (4.5 GPa). Regarding the fracture toughness, it displays a varying trend distinct from that of the elastic moludus and Vickers hardness. As shown in Figure 7b, the fracture toughness of the YT1−x–YZx composite ceramics initially increases to a maximum value and then monotonically decreases with the increase in the YZ content. Correspondingly, YT0.75–YZ0.25 possesses a maximum fracture toughness (3.7 ± 0.5 MPa·m1/2), which is 23% higher than that of YT (3.0 ± 0.23 MPa·m1/2) and 118% higher than that of YZ (1.73 ± 0.28 MPa·m1/2). Furthermore, when comparing the experimental and calculated values of the fracture toughness of the composite ceramics, it becomes evident that the introduction of the YZ phase exhibits varying degrees of influence on the fracture toughness of different samples. Specifically, the experimental fracture toughness of YT0.75–YZ0.25 (3.73 MPa·m1/2) is about 37% higher than the corresponding calculated value (2.67 MPa·m1/2), while that for YT0.5–YZ0.5 (2.43 MPa·m1/2) is essentially close to the calculated value (2.36 MPa·m1/2). However, for YT0.25–YZ0.75 (1.77 MPa·m1/2), it is obviously lower than the calculated value (2.05 MPa·m1/2). The discrepancy between the experimental and calculated values suggests that the mechanical properties of YT1−x–YZx composite ceramics may be influenced by multiple mechanisms, rather than being solely attributed to the intrinsic properties of YZ. Therefore, the mechanism of influence on the mechanical properties of the composite ceramics is elaborated upon in the Discussion Section.
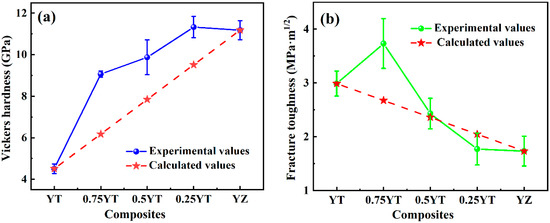
Figure 7.
(a) Experimental Vickers hardness and (b) fracture toughness of YT1−x–YZx (x = 0, 0.25, 0.5, 0.75, 1) composite ceramics and the calculated values obtained by the mixing law are also shown for comparison.
3.3. Thermal Performance Analysis
Thermal expansion properties are also essential to thermal barrier coating materials since the close thermal expansion coefficients between the coating and the substrate can reduce the cracking risk of the coatings caused by thermal stress. Figure 8a exhibits the thermal expansion curves of YT1−x–YZx composite ceramics measured from room temperature to 1673 K. All the samples have a linear expansion characteristic and no sudden volume change can be observed, which indicates that the samples exhibit excellent phase stability within the measurement temperature range. The thermal expansion coefficients of YT1−x–YZx composite ceramics are displayed in Figure 8b. It can be seen that the samples manifest diverse thermal expansion behavior at different temperatures. Specifically, the thermal expansion coefficients increase rapidly with the increasing temperature below 873 K, and then the increasing rate gradually slows down at a range of 873–1473 K. When the temperature is above 1473 K, the thermal expansion coefficients tend to be constant. The thermal expansion coefficients of YT1−x–YZx composite ceramics increase with the increment in the YZ content and vary from 10.0 × 10⁻⁶/K to 11.0 × 10⁻⁶/K at 1673 K, which is higher than those of other candidate TBC materials, like La2Zr2O7 (8.6 × 10⁻⁶/K) [21] and LaMgAl11O19 (9.17 × 10⁻⁶/K) [45]. It is commonly acknowledged that the thermal expansion coefficient of nickel-based alloys (13–18 × 10−6/K) [46] used for manufacturing the hot components of aero-engines is higher than those of most oxide ceramics. Therefore, when working in a thermal shock environment, the high TECs of YT1−x–YZx TBC materials are beneficial for reducing the thermal stress between the TBCs and the superalloy substrate.
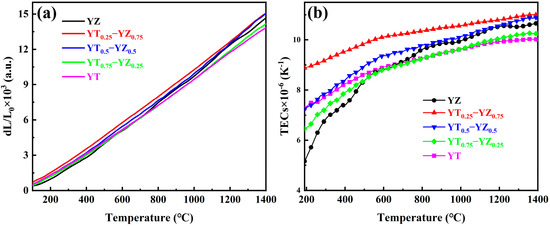
Figure 8.
Thermal expansion properties curves of YT1−x–YZx (x = 0, 0.25, 0.5, 0.75, 1) composite ceramics at different temperatures: (a) thermal expansion curves; (b) thermal expansion coefficient curves.
Besides the matched thermal expansion, the thermal transport properties are also key factors for the selection of thermal barrier coating materials since an excellent thermal insulation performance can reduce the surface temperature of hot components and thereby extend the service lifetime of the components. Thermal insulation performance is inversely proportional to thermal conductivity; thus, reducing the thermal conductivity is one of the key research directions for TBCs. The thermal conductivity of composite ceramics is obtained through its relationship with the heat capacity (Cp), the thermal diffusivity (λ) and the density (ρ), as exhibited in Equation (10). The heat capacity of YT1−x–YZx composite ceramics from room temperature to 1173 K is shown in Figure 9a, which gradually increases with rising temperatures since higher phonon energy levels are produced at high temperatures, leading to increased heat absorption and thereby a higher heat capacity. Additionally, as the YZ content increases, the heat capacity of the composite ceramics are also rises because of the higher intrinsic heat capacity of YZ. Figure 9b illustrates the temperature-dependent thermal diffusivity of YT1−x–YZx composite ceramics, which decreases with the increasing temperature and gradually approaches a limit, as the phonon mean free path decreases and approaches the average atomic spacing. Furthermore, the thermal diffusivity of YT1−x–YZx composite ceramics decreases with the increase in the YZ content. Figure 9c shows the thermal conductivity of YT1−x–YZx composite ceramics at different temperatures, and those of other representative TBC materials, such as YSZ and γ-Y₂Si₂O₇, are also exhibited for comparison. YT1−x–YZx composite ceramics exhibit a typical crystalline thermal conductivity behavior characteristic, which decreases with the rising temperature. The thermal conductivity of YT1−x–YZx (x = 0.25, 0.5, and 0.75) composite ceramics at 900 °C is about 1.54 W·m⁻1·K⁻1, which is lower than that of single-phase YTaO4 (1.63 W·m⁻1·K⁻1), and also significantly lower than that of other TBC materials, like YSZ (3.07 W·m⁻1·K⁻1) [47] and γ-Y₂Si₂O₇ (3.49 W·m⁻1·K⁻1) [48]. This reduction in the thermal conductivity is attributed to the low intrinsic thermal conductivity of the introduced second phase as well as the interface thermal resistance arising at the interface between the YZ and YT phases due to significant crystal structure difference between the dual phases [16,35,49,50]. It leads to the enhancement of phonon scattering and the reduction in thermal conductivity. Figure 9d shows the variation in the phonon mean free path of YTx–YZ1−x composite ceramics with the temperature. As the YZ content increases, the phonon mean free path of YT1−x–YZx (x = 0.25, 0.5, 0.75) composite ceramics decreases, reaching minimum values of 0.4 nm, 0.46 nm and 0.51 nm at 1173 K, implying that strong phonon scattering is induced in the lattice of the composite ceramics. In brief, the excellent thermal stability, high thermal expansion coefficients and low thermal conductivity ensure that the YT1−x–YZx composite ceramics possess a sufficient service lifetime and thermal insulation performance to withstand high temperatures and strong thermal shock environments.
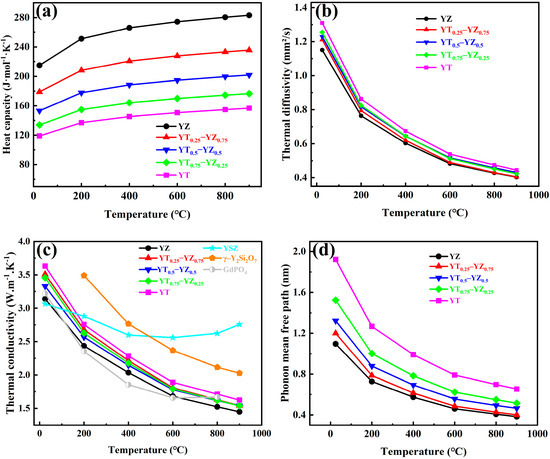
Figure 9.
Thermal properties of YT1−x–YZx (x = 0, 0.25, 0.5, 0.75, 1) composite ceramics at different temperatures: (a) heat capacity; (b) thermal diffusivity; (c) thermal conductivity; (d) phonon mean free path.
4. Discussion
4.1. Strengthening Mechanisms of the Mechanical Properties of YT1−x–YZx Composite Ceramics
In general, introducing a strengthening second phase with higher hardness and mechanical strength is an effective method to improve the mechanical properties of composite ceramics. Moreover, the degree of strengthening in composite ceramics is expected to positively correlate with the second phase. However, in this work, the significant deviation between the experimental and calculated values of hardness and fracture toughness in composite ceramics indicates that the reinforcement of the composite ceramics may originate from the combined effects of multiple mechanisms. Thus, in order to conform to the reasons for the enhancement of the composite ceramics, the following possible strengthening mechanisms are discussed separately.
The first toughening mechanism could be the solid solution strengthening effect of Ta atoms on the YZ phase, which is the reason for the abnormally high elastic modulus and hardness of YT0.25–YZ0.75, as shown in the Figure 6 and Figure 7a. Based on the analysis of the phase composition and microstructure (Figure 2 and Figure 3), it can be concluded that YT0.25–YZ0.75 forms a solid solution with the defective fluorite structure, where partial Zr atoms are substituted by Ta atoms instead of a dual-phase ceramic. Since the ionic radius of Zr⁴⁺ (0.72 Å) is smaller than that of Ta⁵⁺ (0.64 Å), the crystal lattice of the YT0.25–YZ0.75 solid solution tends to shrink (as shown in Figure 2) compared to the pure YZ phase, which leads to the shorter and stronger chemical bonds between metal atoms and oxygen atoms, thereby resulting in the stronger elastic modulus and hardness of the YT0.25–YZ0.75 solid solution than that of the pure YZ phase. In addition, this solid solution strengthening effect still exists in the YZ phase of YT0.5–YZ0.5 and YT0.75–YZ0.25, which correspondingly increases the intrinsic modulus and hardness of the YZ phase in these composite ceramics.
The second toughening mechanism originates from the fine-grain strengthening due to the mutual grain-boundary pinning effect caused by the introduction of the second phase. As shown in the Figure 5, the average grain size of the YT1−x–YZx (x = 0.25, 0.5, 0.75) composite ceramics is 2.10–2.94 μm, which is about an 81–86% reduction compared to the single-phase YT ceramic (15.08 μm). The grain refinement represents an increase in the number of grain boundaries. When the Vickers indenter is pressed onto the surface of the specimen, the specimen undergoes a local plastic deformation due to the dislocation motion, ultimately forming an indentation. As the number of grain boundaries increases, the hindering effect of the grain boundaries on the dislocation motion intensifies, leading to greater resistance to ceramic deformation and correspondingly higher hardness. On the other hand, the increased grain boundaries also result in a higher fracture energy being consumed when the indentation cracks propagate to cross the grain boundaries, thereby enhancing the fracture toughness [51,52].
As for YT0.5–YZ0.5 and YT0.75–YZ0.25 composite ceramics, the additional toughening mechanism also includes the internal stress strengthening arising from the thermal expansion mismatch between the YT and YZ solid solution phase. Since the thermal expansion coefficient of the YZ solid solution (11 ×10−6/K) is higher than that of YT (10 × 10−6/K), as shown in Figure 8b, tensile and compressive stresses were generated in the YZ solid solution and YT upon cooling from the sintering temperature (1973 K) to room temperature. According to Equations (10)–(12), the residual stress in the YT and YZ solid solutions of dual-phase ceramics at room temperature was calculated and the results are presented in Figure 10. When calculating the residual stress, the YT phase is treated as the matrix and YZ is treated as the second-phase particles for YT0.75–YZ0.25, while the roles are the opposite for YT0.5–YZ0.5. As shown in Figure 10, the compressive stress of the YT phase in YT0.75–YZ0.25 and YT0.5–YZ0.5 is 75 MPa and 244 MPa respectively, whereas the tensile stress of the YZ phase is 153 MPa and 81 MPa, respectively. Generally, the hardness of the sample is inversely proportional to the residual stress, that is the hardness decreases when there is a tensile stress on the sample surface, whereas when there is compressive stress, the hardness increases [53]. For YT0.75–YZ0.25, the compressive stress of the composite ceramic is dominant because the content of the YT phase is significantly higher than that of the YZ solid solution phase. For YT0.5–YZ0.5, considering the consumption of the YT phase by solid solution reaction, the content of the YZ solid solution phase is higher than the YT phase, and therefore the residual stress of the composite ceramic tends to be dominated by the tensile stress. Figure 11 shows the contributions of the above three different mechanisms to the strengthening of the hardness of the YT1−x–YZx (x = 0.25, 0.5, 0.75) composite ceramics, including the absolute values (Figure 11a) and the percentage (Figure 11b). It is evident that the reinforcement contributions of different mechanisms to the three composite ceramics vary significantly. For YT0.25–YZ0.75, the enhancement of the hardness is solely attributed to the solid solution effect of Ta atoms due to the absence of the second phase. The introduction of the YZ solid solution contributed 75% and 92% to the hardness strengthening of YT0.75–YZ0.25 and YT0.5–YZ0.5, respectively. In addition, since the grain sizes of the three composite ceramics are quite similar (2.10–2.94 μm), the contribution of grain refinement to hardness enhancement can be deemed to be equivalent. Accordingly, the enhancement due to the residual stress in YT0.75–YZ0.25 is significantly greater than that in YT0.5–YZ0.5. On the other hand, the strengthening effect of the residual stress on fracture toughness can be described by a model developed by Evans et al. and Cutler et al. [54,55]:
where σm is the residual compressive stress in the matrix phase, D is the average particulate spacing. Equation (17) indicates the fracture toughness enhancement is proportional to the residual compressive stress in the YT matrix. When the crack encounters the YT grains during its propagation, the crack tip exhibits a tendency to close due to the surrounding compressive stress, thereby impeding the crack propagation and enhancing the fracture toughness [56,57]. Therefore, under the synergistic effects of the compressive stress and the grain refinement due to the mutual grain-boundary pinning effect, YT0.75–YZ0.25 exhibits a higher fracture toughness than the single-phase YT.
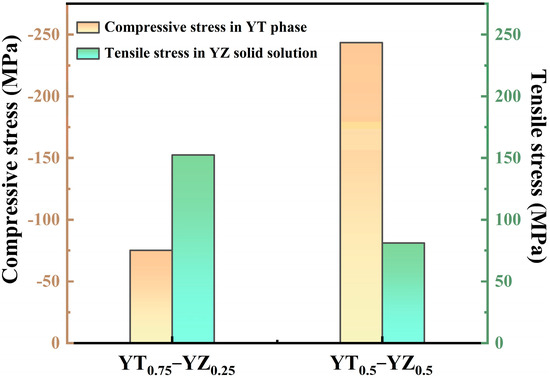
Figure 10.
The residual stress in the YT and YZ solid solutions of dual-phase ceramics at room temperature, where the positive values represent tensile stress and the negative values represent compressive stress.
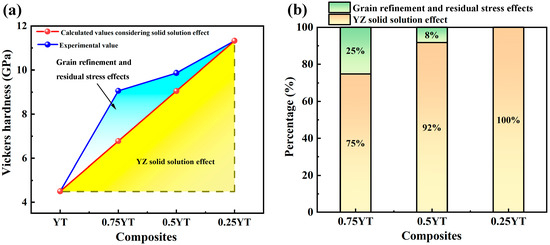
Figure 11.
The contributions of different mechanisms to the hardness of the YT1−x–YZx (x = 0.25, 0.5, 0.75) composite ceramics: (a) absolute values of the contributions; (b) percentage of the contributions.
4.2. The Balance of Thermal and Mechanical Properties for TBC Materials
Over the past decade, the development needs of hypersonic vehicles and advanced aero-engines have made the search for novel TBC materials a research focus. However, no candidate material has yet been able to fully replace YSZ since the selection of TBC materials is restricted by multiple basic requirements, including mechanical and thermal properties instead of outstanding single performance. For most oxide candidate materials, like RE2Zr2O7, REPO4 and other materials, typically exhibit superior thermal stability and thermal insulation performance compared to YSZ, but their mechanical properties, especially fracture toughness, cannot meet the requirement of TBCs [4,21]. It is commendable that rare-earth tantalates (RETaO4) have an excellent high-temperature fracture toughness due to the ferroelastic toughening effect, but the low hardness and thermal expansion coefficient pose severe challenges in the environments of high-speed particle erosion and strong thermal shock [7,24]. Therefore, the balance between mechanical and thermal properties is crucial for TBC materials to possess an excellent service performance. Figure 12 presents a radar chart comparing the properties of YT1−x–YZx composite ceramics and the state-of-the-art TBC material 8YSZ [4]. The chart includes thermal properties (thermal conductivity κ, thermal expansion coefficients) and mechanical properties (Young’s modulus E, fracture toughness KIc, hardness Hv). It can be seen that the YT1−x–YZx composite ceramics achieved a balanced improvement in both thermal and mechanical properties. Among them, YT0.75–YZ0.25 composite ceramics demonstrated an optimal comprehensive performance, including enhanced hardness (9.06 GPa), the highest toughness (3.7 ± 0.5 MPa·m1/2), a high thermal expansion coefficient (10.3 × 10⁻⁶ K⁻1 at 1673 K) and reduced thermal conductivity (1.54 W·m⁻1·K⁻1 at 1173 K). In brief, the balance between enhanced mechanical and thermal properties makes YT0.75–YZ0.25 composite ceramics possess an excellent service performance for TBC applications.
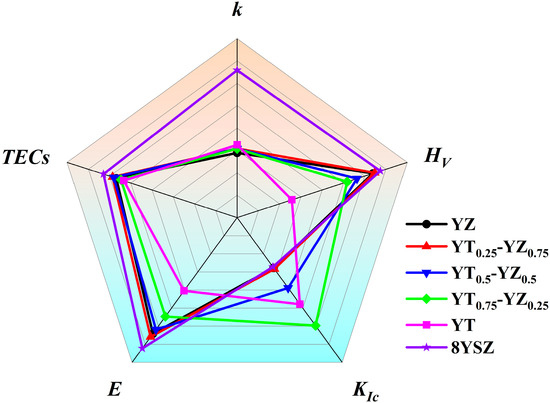
Figure 12.
Radar chart comparing the mechanical and thermal properties of YTx–YZ1−x (x = 0, 0.25, 0.5, 0.75, 1) composite ceramics and the state-of-the-art TBC material 8YSZ.
5. Conclusions
In this work, to synergistically optimize the mechanical and thermal properties of YTaO4 ceramics, a series of YT1−x–YZx composite ceramics were prepared by introducing defective fluorite-structured Y2Zr2O7 as the second phase into the YTaO4 matrix. Compared to the pure-phase YTaO4 ceramic, the Vickers hardness of YT1−x–YZx (x = 0.25, 0.5, 0.75) composite ceramics are significantly enhanced (9.1~11.3 GPa), which are 2~2.5 times higher than that of YTaO4 (4.5 GPa). Specifically, YT0.75–YZ0.25 exhibits the maximum fracture toughness (3.7 ± 0.5 MPa·m1/2) among all the specimens, which is 23% higher than that of YTaO4 (3.0 ± 0.23 MPa·m1/2) and 118% higher than that of Y2Zr2O7 (1.73 ± 0.28 MPa·m1/2). The enhancement of mechanical properties is attributed to the synergistic effects of the intrinsic strengthening of the second phase, as well as the residual stress and grain refinement caused by the introduction of the second phase. For the thermal properties, YT1−x–YZx composite ceramics exhibit excellent thermal stability at a high temperature and their thermal expansion coefficients at 1673 K are in the range of 10.3–11.0 × 10⁻⁶ K⁻1, which is also higher than that of YTaO4 (10.0 × 10⁻⁶ K−1). In addition, due to the low intrinsic thermal conductivity of the introduced second phase and the interface thermal resistance of the dual phases, YT1−x–YZx (x = 0.25, 0.5 and 0.75) composite ceramics show reduced thermal conductivity (1.54 W·m⁻1·K⁻1 at 1173 K) when compared to the single-phase YTaO4 (1.63 W·m⁻1·K⁻1 at 1173 K). In brief, among these composite ceramics, YT0.75–YZ0.25 composite ceramics exhibit the optimal comprehensive performance, including enhanced hardness (9.06 GPa), the highest toughness (3.7 ± 0.5 MPa·m1/2), a relatively high thermal expansion coefficient (10.3 × 10⁻⁶ K⁻1 at 1673 K) and reduced thermal conductivity (1.54 W·m⁻1·K⁻1 at 1173 K), which is considered as the optimal material to use for thermal barrier coating applications.
In summary, this work provides a simple but effective method to optimize the mechanical and thermal properties of rare-earth tantalate ceramics by introducing the Y2Zr2O7 phase. The combination of enhanced hardness, fracture toughness, a high thermal expansion coefficient as well as reduced thermal conductivity of the composite ceramics prove that this method is expected to overcome the intrinsic defects of rare-earth tantalates for thermal barrier coatings applications.
Author Contributions
Conceptualization, Z.Z.; methodology, Z.Z.; software, Z.Z. and Z.R.; validation, Z.Z. and Z.R.; formal analysis, Z.Z. and Z.R.; investigation, Z.R.; resources, Z.Z. and J.F.; data curation, Z.R.; writing—original draft preparation, Z.R.; writing—review and editing, Z.Z. and J.F.; visualization, Z.Z.; supervision, J.F.; project administration, Z.Z.; funding acquisition, Z.Z. All authors have read and agreed to the published version of the manuscript.
Funding
The authors gratefully acknowledge the financial support from Yunnan Fundamental Research Projects under grant No. 202201BE070001-008, Yunnan Major Scientific and Technological Projects No. 202302AG050010, National Natural Science Foundation of China under grant No. 52302065, National Key Research and Development Program of China under grant No. 2023YFB3711200 and the Yunnan Fundamental Research Projects under grant No. 202201AU070142.
Data Availability Statement
The original contributions presented in this study are included in the article. Further inquiries can be directed to the corresponding authors.
Conflicts of Interest
The authors declare no conflict of interest.
References
- Padture, N.P.; Gell, M.; Jordan, E.H. Thermal Barrier Coatings for Gas-Turbine Engine Applications. Science 2002, 296, 280–284. [Google Scholar] [CrossRef] [PubMed]
- Meier, S.M.; Gupta, D.K.; Sheffler, K.D. Ceramic thermal barrier coatings for commercial gas turbine engines. JOM 1991, 43, 50–53. [Google Scholar] [CrossRef]
- Liu, B.; Liu, Y.C.; Zhu, C.H.; Xiang, H.M.; Chen, H.F.; Sun, L.C.; Gao, Y.F.; Zhou, Y.C. Advances on strategies for searching for next generation thermal barrier coating materials. J. Mater. Sci. Technol. 2019, 35, 833–851. [Google Scholar] [CrossRef]
- Cao, X.Q.; Vassen, R.; Stoever, D.J. Ceramic materials for thermal barrier coatings. J. Eur. Ceram. Soc. 2004, 24, 1–10. [Google Scholar] [CrossRef]
- Deijkers, J.A.; Wadley, H.N.G. A duplex bond coat approach to environmental barrier coating systems. Acta Mater. 2021, 217, 117167. [Google Scholar] [CrossRef]
- Wei, Z.Y.; Meng, G.H.; Chen, L.; Li, G.R.; Liu, M.J.; Zhang, W.X.; Zhao, L.N.; Zhang, Q.; Zhang, X.D.; Wan, C.L.; et al. Progress in ceramic materials and structure design toward advanced thermal barrier coatings. J. Adv. Ceram. 2022, 11, 985–1068. [Google Scholar] [CrossRef]
- Chen, L.; Li, B.; Feng, J. Rare-earth tantalates for next-generation thermal barrier coatings. Prog. Mater. Sci. 2024, 144, 101265. [Google Scholar] [CrossRef]
- Liu, B.; Zhao, J.L.; Liu, Y.C.; Xi, J.Q.; Li, Q.; Xiang, H.M.; Zhou, Y.C. Application of high-throughput first-principles calculations in ceramic innovation. J. Mater. Sci. Technol. 2021, 88, 143–157. [Google Scholar] [CrossRef]
- Winter, M.R.; Clarke, D.R. Oxide Materials with Low Thermal Conductivity. J. Am. Ceram. Soc. 2007, 90, 533–540. [Google Scholar] [CrossRef]
- Luo, C.; Li, C.; Cao, K.; Li, J.B.; Luo, J.H.; Zhang, Q.H.; Zhou, Q.Q.; Zhang, F.; Gu, L.; Yang, L.; et al. Ferroelastic domain identification and toughening mechanism for yttrium tantalate–zirconium oxide. J. Mater. Sci. Technol. 2022, 127, 78–88. [Google Scholar] [CrossRef]
- Vaßen, R.; Mack, D.E.; Tandler, M.; Sohn, Y.J.; Sebold, D.; Guillon, O. Unique performance of thermal barrier coatings made of yttria-stabilized zirconia at extreme temperatures (>1500 °C). J. Am. Ceram. Soc. 2021, 104, 463–471. [Google Scholar] [CrossRef]
- Virkar, A.V.; Matsumoto, R.L.K. Ferroelastic Domain Switching as a Toughening Mechanism in Tetragonal Zirconia. J. Am. Ceram. Soc. 1986, 69, C-224–C-226. [Google Scholar] [CrossRef]
- Clarke, D.R.; Levi, C.G. Materials Design for the Next Generation Thermal Barrier Coatings. Annu. Rev. Mater. Res. 2003, 33, 383–417. [Google Scholar] [CrossRef]
- Hu, J.H.; Gu, C.; Li, J.Y.; Li, C.; Feng, J.; Jiang, Y.H. Microstructure and oxidation behavior of the Y/Ta/Hf co-doped AlCoCrFeNi high-entropy alloys in air at 1100 °C. Corros. Sci. 2023, 212, 110930. [Google Scholar] [CrossRef]
- Chen, L.; Hu, M.Y.; Wu, P.; Feng, J. Thermal expansion performance and intrinsic lattice thermal conductivity of ferroelastic RETaO4 ceramics. J. Am. Ceram. Soc. 2019, 102, 4809–4821. [Google Scholar] [CrossRef]
- Limarga, A.M.; Clarke, D.R. The grain size and temperature dependence of the thermal conductivity of polycrystalline, tetragonal yttria-stabilized zirconia. Appl. Phys. Lett. 2011, 98, 211906. [Google Scholar] [CrossRef]
- Wallace, J.S.; Ilavsky, J. Elastic modulus measurements in plasma sprayed deposits. J. Therm. Spray Technol. 1998, 7, 521–526. [Google Scholar] [CrossRef]
- Ren, X.; Pan, W. Mechanical Properties of High-Temperature-Degraded Yttria-Stabilized Zirconia. Acta Mater. 2014, 69, 397–406. [Google Scholar] [CrossRef]
- Slifka, A.J.; Filla, B.J.; Phelps, J.M.; Bancke, G.; Berndt, C.C. Thermal Conductivity of a Zirconia Thermal Barrier Coating. J. Therm. Spray Technol. 1998, 7, 43–46. [Google Scholar] [CrossRef]
- Brandon, J.R.; Taylor, R. Phase stability of zirconia-based thermal barrier coatings part I. Zirconia-yttria alloys. Surf. Coat. Technol. 1991, 46, 75–90. [Google Scholar] [CrossRef]
- Zhao, Z.F.; Ruan, Z.Y.; Li, R.; Yan, S.X.; Sun, X.L.; Liu, C.; Zhang, D.; Xu, B.; Ren, Z.Y.; Wang, M.; et al. High entropy pyrochlore (La0.3Gd0.3Ca0.4)2(Ti0.2Zr0.2Hf0.2Nb0.2Ta0.2)2O7 ceramic with amorphous-like thermal conductivity for environmental/thermal barrier coating applications. J. Mater. Sci. Technol. 2024, 205, 315–326. [Google Scholar] [CrossRef]
- Shian, S.; Sarin, P.; Gurak, M.; Baram, M.; Kriven, W.M.; Clarke, D.R. The tetragonal–monoclinic, ferroelastic transformation in yttrium tantalate and effect of zirconia alloying. Acta Mater. 2014, 69, 196–202. [Google Scholar] [CrossRef]
- Li, B.S.; Cherng, J.S.; Bowman, K.J.; Chen, I.W. Domain Switching as a Toughening Mechanism in Tetragonal Zirconia. J. Am. Ceram. Soc. 1988, 71, C-362–C-364. [Google Scholar] [CrossRef]
- Wang, J.; Zhou, Y.; Chong, X.Y.; Zhou, R.; Feng, J. Microstructure and thermal properties of a promising thermal barrier coating: YTaO4. Ceram. Int. 2016, 42, 13876–13881. [Google Scholar] [CrossRef]
- Wu, P.; Hu, M.Y.; Chen, L.; Chen, W.; Chong, X.Y.; Gu, H.; Feng, J. Investigation on microstructures and thermo-physical properties of ferroelastic (Y1-xDyx)TaO4 ceramics. Materialia 2018, 4, 478–486. [Google Scholar] [CrossRef]
- Li, J.Y.; Dai, H.; Zhong, X.H.; Zhang, Y.F.; Ma, X.F.; Meng, J.; Cao, X.Q. Lanthanum zirconate ceramic toughened by BaTiO3 secondary phase. J. Alloys Compd. 2008, 452, 406–409. [Google Scholar] [CrossRef]
- Wang, Y.F.; Xiao, P. The phase stability and toughening effect of 3Y-TZP dispersed in the lanthanum zirconate ceramics. Mater. Sci. Eng. A 2014, 604, 34–39. [Google Scholar] [CrossRef]
- Li, J.Y.; Dai, H.; Zhong, X.H.; Zhang, Y.F.; Ma, X.F.; Meng, J.; Cao, X.Q. Effect of the addition of YAG (Y3Al5O12) nanopowder on the mechanical properties of lanthanum zirconate. Mater. Sci. Eng. A 2007, 460–461, 504–508. [Google Scholar] [CrossRef]
- Han, J.; Wang, Y.F.; Liu, R.J.; Cao, Y.B. Lanthanum zirconate ceramic toughened by ferroelastic domain switching of LaAlO3. Ceram. Int. 2018, 44, 15954–15958. [Google Scholar] [CrossRef]
- Zhang, Z.J.; Sun, J.; Liu, G.H.; Han, Y.; Liu, W.; Li, Y.; Wang, W.; Liu, X.Y.; Zhang, P.; Pan, W.; et al. High toughness and CMAS resistance of REAlO3/RE2Zr2O7 (RE = La, Nd, Sm, Eu, Gd, and Dy) composites with eutectic composition for thermal barrier coatings. J. Adv. Ceram. 2024, 13, 800–809. [Google Scholar] [CrossRef]
- Wang, J.K.; Chen, L.; Zhang, L.Y.; Gan, M.D.; Li, B.H.; Feng, J. Y1/6Yb5/6TaO4/8YSZ composite ceramics with enhanced mechanical and thermal properties. J. Am. Ceram. Soc. 2024, 107, 3895–3909. [Google Scholar] [CrossRef]
- Krautkrämer, J.; Krautkrämer, H. Measuring Methods Using Ultrasound. In Ultrasonic Testing of Materials; Grabendörfer, W., Niklas, L., Frielinghaus, R., Rath, W., Schlemm, H., Schlengermann, U., Eds.; Springer: Berlin/Heidelberg, Germany, 1977. [Google Scholar]
- Rice, R.W. Comparison of stress concentration versus minimum solid area based mechanical property-porosity relations. J. Mater. Sci. 1993, 28, 2187–2190. [Google Scholar] [CrossRef]
- Evans, A.G.; Charles, E.A. Fracture Toughness Determinations by Indentation. J. Am. Ceram. Soc. 1976, 59, 371–372. [Google Scholar] [CrossRef]
- Limarga, A.M.; Shian, S.; Leckie, R.M.; Levi, C.G.; Clarke, D.R. Thermal conductivity of single- and multi-phase compositions in the ZrO2–Y2O3–Ta2O5 system. J. Eur. Ceram. Soc. 2014, 34, 3085–3094. [Google Scholar] [CrossRef]
- Taya, M.; Hayashi, L.S.; Kobayashi, A.S.; Yoon, H.S. Toughening of a Particulate-Reinforced Ceramic-Matrix Composite by Thermal Residual Stress. J. Am. Ceram. Soc. 1990, 73, 1382–1391. [Google Scholar] [CrossRef]
- Eshelby, J.D. The determination of the elastic field of an ellipsoidal inclusion, and related problems. Proc. R. Soc. Lond. Ser. A Math. Phys. Sci. 1957, 241, 376–396. [Google Scholar]
- Parker, W.J.; Jenkins, R.J.; Butler, C.P.; Abbott, G.L. Flash Method of Determining Thermal Diffusivity, Heat Capacity, and Thermal Conductivity. J. Appl. Phys. 1961, 32, 1679–1684. [Google Scholar] [CrossRef]
- Leitner, J.; Voňka, P.; Sedmidubský, D.; Svoboda, P. Application of Neumann–Kopp rule for the estimation of heat capacity of mixed oxides. Thermochim. Acta 2010, 497, 7–13. [Google Scholar] [CrossRef]
- Lehmann, H.; Pitzer, D.; Pracht, G.; Vassen, R.; Stöver, D. Thermal Conductivity and Thermal Expansion Coefficients of the Lanthanum Rare-Earth-Element Zirconate System. J. Am. Ceram. Soc. 2003, 86, 1338–1344. [Google Scholar] [CrossRef]
- Shannon, R.D. Revised effective ionic radii and systematic studies of interatomic distances in halides and chalcogenides. Acta Crystallogr. A 1976, 32, 751–767. [Google Scholar] [CrossRef]
- Smith, C.S. Phases and Interfaces: Interpretation of Microstructures. Met. Technol. 1948, 175, 15–51. [Google Scholar]
- Hall, E.O. The Deformation and Ageing of Mild Steel: III Discussion of Results. Proc. Phys. Soc. Sect. B 1951, 64, 747. [Google Scholar] [CrossRef]
- Petch, N.J. The Cleavage Strength of Polycrystals. J. Iron. Steel Inst. 1953, 174, 25–28. [Google Scholar]
- Jiang, B.; Fang, M.H.; Huang, Z.H.; Liu, Y.G.; Peng, P.; Zhang, J. Mechanical and thermal properties of LaMgAl11O19. Mater. Res. Bull. 2010, 45, 1506–1508. [Google Scholar] [CrossRef]
- Vassen, R.; Kerkho, G.; Stoever, D. Development of a micromechanical life prediction model for plasma sprayed thermal barrier coatings. Mater. Sci. Eng. A 2001, 303, 100–109. [Google Scholar] [CrossRef]
- Song, D.W.; Song, T.; Paik, U.; Lyu, G.L.; Jung, Y.G.; Jeon, H.B.; Oh, Y.S. Glass-like thermal conductivity in mass-disordered high-entropy (Y,Yb)2(Ti, Zr, Hf)2O7 for thermal barrier material. Mater. Des. 2021, 210, 110059. [Google Scholar] [CrossRef]
- Sun, Z.Q.; Zhou, Y.C.; Wang, J.Y.; Li, M.S. Thermal Properties and Thermal Shock Resistance of γ-Y2Si2O7. J. Am. Ceram. Soc. 2010, 91, 2623–2629. [Google Scholar] [CrossRef]
- Wang, Y.F.; Fujinami, K.; Zhang, R.Z.; Wan, C.L.; Wang, N.; Ba, Y.S.; Koumoto, K. Interfacial Thermal Resistance and Thermal Conductivity in Nanograined SrTiO3. Appl. Phys. Express 2010, 3, 031101. [Google Scholar] [CrossRef]
- Chen, L.; Wang, J.K.; Li, B.H.; Luo, K.R.; Feng, J. Simultaneous manipulations of thermal expansion and conductivity in symbiotic ScTaO4/SmTaO4 composites via multiscale effects. J. Adv. Ceram. 2023, 12, 1625–1640. [Google Scholar] [CrossRef]
- Nagaraju, N.; Annamalai, A.R. An investigation of phase stability, thermal conductivity and fracture toughness of 8YSZ-La2O3 ceramics. Mater. Res. Express 2019, 6, 076560. [Google Scholar] [CrossRef]
- Chen, Y.; Zhang, R.; Zhang, G.; Jiang, P.Y.; Song, J.; Chu, X.W. Toughening Mechanism of Thermal Barrier Coatings. Int. J. Thermophys. 2021, 42, 69. [Google Scholar] [CrossRef]
- Mani, A.; Aubert, P.; Mercier, F.; Khodja, H.; Berthier, C.; Houdy, P. Effects of residual stress on the mechanical and structural properties of TiC thin films grown by RF sputtering. Surf. Coat. Technol. 2005, 194, 190–195. [Google Scholar] [CrossRef]
- Evans, A.G.; Heuer, A.H.; Porter, D.L. The fracture toughness of ceramics. In Advances in Research on the Strength and Fracture of Materials; Taplin, D.M.R., Ed.; Elsevier: Pergamon, Turkey, 1978; pp. 529–556. [Google Scholar]
- Cutler, R.A.; Virkar, A.V. The effect of binder thickness and residual stresses on the fracture toughness of cemented carbides. J. Mater. Sci. 1985, 20, 3557–3573. [Google Scholar] [CrossRef]
- Guo, F.A.; Ji, V.; Francois, M.; Zhang, Y.G. Effect of internal stresses on the fracture toughness of a TiAl-based alloy with duplex microstructures. Acta Mater. 2003, 51, 5349–5358. [Google Scholar] [CrossRef]
- Salvati, E. Residual stress as a fracture toughening mechanism: A Phase-Field study on a brittle material. Theor. Appl. Fract. Mech. 2021, 114, 103021. [Google Scholar] [CrossRef]
Disclaimer/Publisher’s Note: The statements, opinions and data contained in all publications are solely those of the individual author(s) and contributor(s) and not of MDPI and/or the editor(s). MDPI and/or the editor(s) disclaim responsibility for any injury to people or property resulting from any ideas, methods, instructions or products referred to in the content. |
© 2025 by the authors. Licensee MDPI, Basel, Switzerland. This article is an open access article distributed under the terms and conditions of the Creative Commons Attribution (CC BY) license (https://creativecommons.org/licenses/by/4.0/).