1. Introduction
Stealth technology encompasses a range of techniques and technologies aimed at making a ship difficult to detect and identify by enemy detection systems. The ship signature consists in any measurable disturbance that the presence of the ship causes in the surrounding environment. Signatures allow for the detection and identification of the ship using a detection system or sensor. There are different types of ship signatures: acoustic, optical, infrared, radar, and magnetic.
Most metallic structures are mainly made of ferromagnetic materials, causing them to disturb the earth’s magnetic field and producing a magnetic signature [
1]. In addition to the earth’s magnetic field, non-negligible magnetic signature contributions also arise from magnetic fields of electric origin, for instance those caused by eddy current, corrosion currents, and currents flowing in the internal circuits.
A ship’s magnetic signature impacts both navigation safety and the health of the marine ecosystem. Reducing this signature is essential for minimising the risks associated with navigation and protecting marine biodiversity.
Magnetic signatures are significant for military applications due to devices capable of detecting changes in the magnetic field, thereby signalling the presence of ships [
2].
In order to reduce the magnetic signature of the materials forming the hull of a ship, the process of degaussing, which consists in the reduction or cancellation of the ship’s magnetic field by applying an opposing field, is employed [
3]. Degaussing systems, such as degaussing coils, are installed on board ships in various configurations to counteract or compensate for the ship’s magnetic field [
3]. Several studies have designed new degaussing systems [
4]. Kim et al. proposed an efficient re-demagnetization technique, which is used when degaussing coils are out of service [
5]. The use of metallic metamaterials is not intended as an alternative method of degaussing systems, but they can be used as complementary to this method.
The influence of the earth’s magnetic field on the ship magnetic signature was evaluated by on-field measurement campaign [
6]. Tarnawski et al. [
7] developed a new approach to analyse the error in determining the geographical position on the quality of magnetic signatures, taking into account the passages of ships in different directions. Finite element method (FEM) was applied for the evaluation of the magnetic signature of ships in the earth’s magnetic field at various geographical locations [
8,
9,
10]. Lucas and Richards [
11] proposed a new technique for evaluating the magnetic signature of ships. This model simplifies the handling of the signature and the separation of permanent and induced magnetic signatures. Zivieri et al. [
12] investigated the static magnetic signature of a ship propulsor system.
The fundamental parameters for reducing ship signatures are twofold: shape and material. The proper choice of materials plays a crucial role in the stealth design of a ship. An interesting solution is the use of metamaterials.
Aluminium alloys are lightweight and non-magnetic metallic materials, but they are highly conductive, and eddy currents can raise their magnetic signature [
2]. Magnetic signatures can be detected by means of transportable underwater systems (such as an Unmanned Underwater Vehicle (UUV) [
13], Autonomous Underwater Vehicle (AUV) [
14], Remotely Operated Vehicle (ROV) [
15]) or aircraft systems (such as an Unmanned Aerial Vehicle (UAV) [
16]).
Crashworthy and lightweight structures are widely used for applications in the aerospace, maritime, offshore, train, and automotive industries, as reported in the literature [
17,
18,
19,
20,
21,
22,
23]. Weight reduction and the use of sustainable materials are primary concerns for shipbuilding. The use of aluminium honeycomb sandwiches, which combine low density with high energy absorption properties, presents an interesting solution to address these issues for marine structures [
19,
24]. The limitations of honeycomb sandwich panels are related to high manufacturing costs and to the issue of obtaining complex non-flat shapes [
25,
26]. Many studies evaluated the mechanical performance of honeycomb panels made of steel [
27,
28,
29] or aluminium [
19,
24,
30] subjected to static and dynamic impact tests. Steel honeycomb panels are generally manufactured through different techniques: by brazing in a vacuum furnace [
31] or by 3D printing Selective Laser Melting (SLM) technique [
28], thus ensuring the manufacturing consistency of these types of structures.
The aim of this study is to investigate the induced magnetism due to the earth’s magnetic field in ferromagnetic honeycomb sandwiches with steel and aluminium skins by means of a combined numerical analysis based on FEM and a Theoretical Model (TM). Therefore, magnetic signatures originating from eddy currents in aluminium skins due to the high conductivity of aluminium were not taken into account in the analysis. The current investigation will be developed in the next step of the research activity by employing the honeycomb sandwiches as the main components of a ship’s hull, by determining all the sources of the magnetic signature, including the eddy current source, and by comparing the theoretical results with ad hoc measurements.
The main novelty of this work is that it suggests an analysis based on the employment of metallic metamaterials with the form of honeycomb sandwiches for ship structures to reduce the induced magnetic signature, as well as its suggestion that honeycomb panels with aluminium skins are suitable for this kind of analysis. In addition, the TM is based on an empirical formula for induced magnetic flux density, which includes the shielding effect of metallic skins, and its results are compared to those of numerical simulations based on FEM, which confirm the FEM simulation results. Different types of structures are compared to evaluate the combined effect of materials and geometry on the magnetic signature.
The finite element results and the theoretical predictions indicate that the use of metamaterial structures consisting of honeycomb sandwich panels with a steel core and aluminium skins, produces a significant reduction in a ship’s induced magnetic signature compared to the one magnetic signature of a steel panel with the same bending stiffness.
2. Materials and Methods
Finite element analyses (FEA) were performed for the evaluation and the comparison of the magnetic signatures induced by the earth’s magnetic field on different types of panels made of aluminium (non-magnetic) and steel (ferromagnetic) materials.
The following configurations were investigated:
- -
Steel honeycomb sandwich panel;
- -
Honeycomb sandwich panel with a steel core and aluminium skins;
- -
Steel panel with the same bending stiffness of the steel honeycomb sandwich panel.
A magnetostatic 3D numerical model was developed by means of Altair Flux 2022.3 software of the Altair
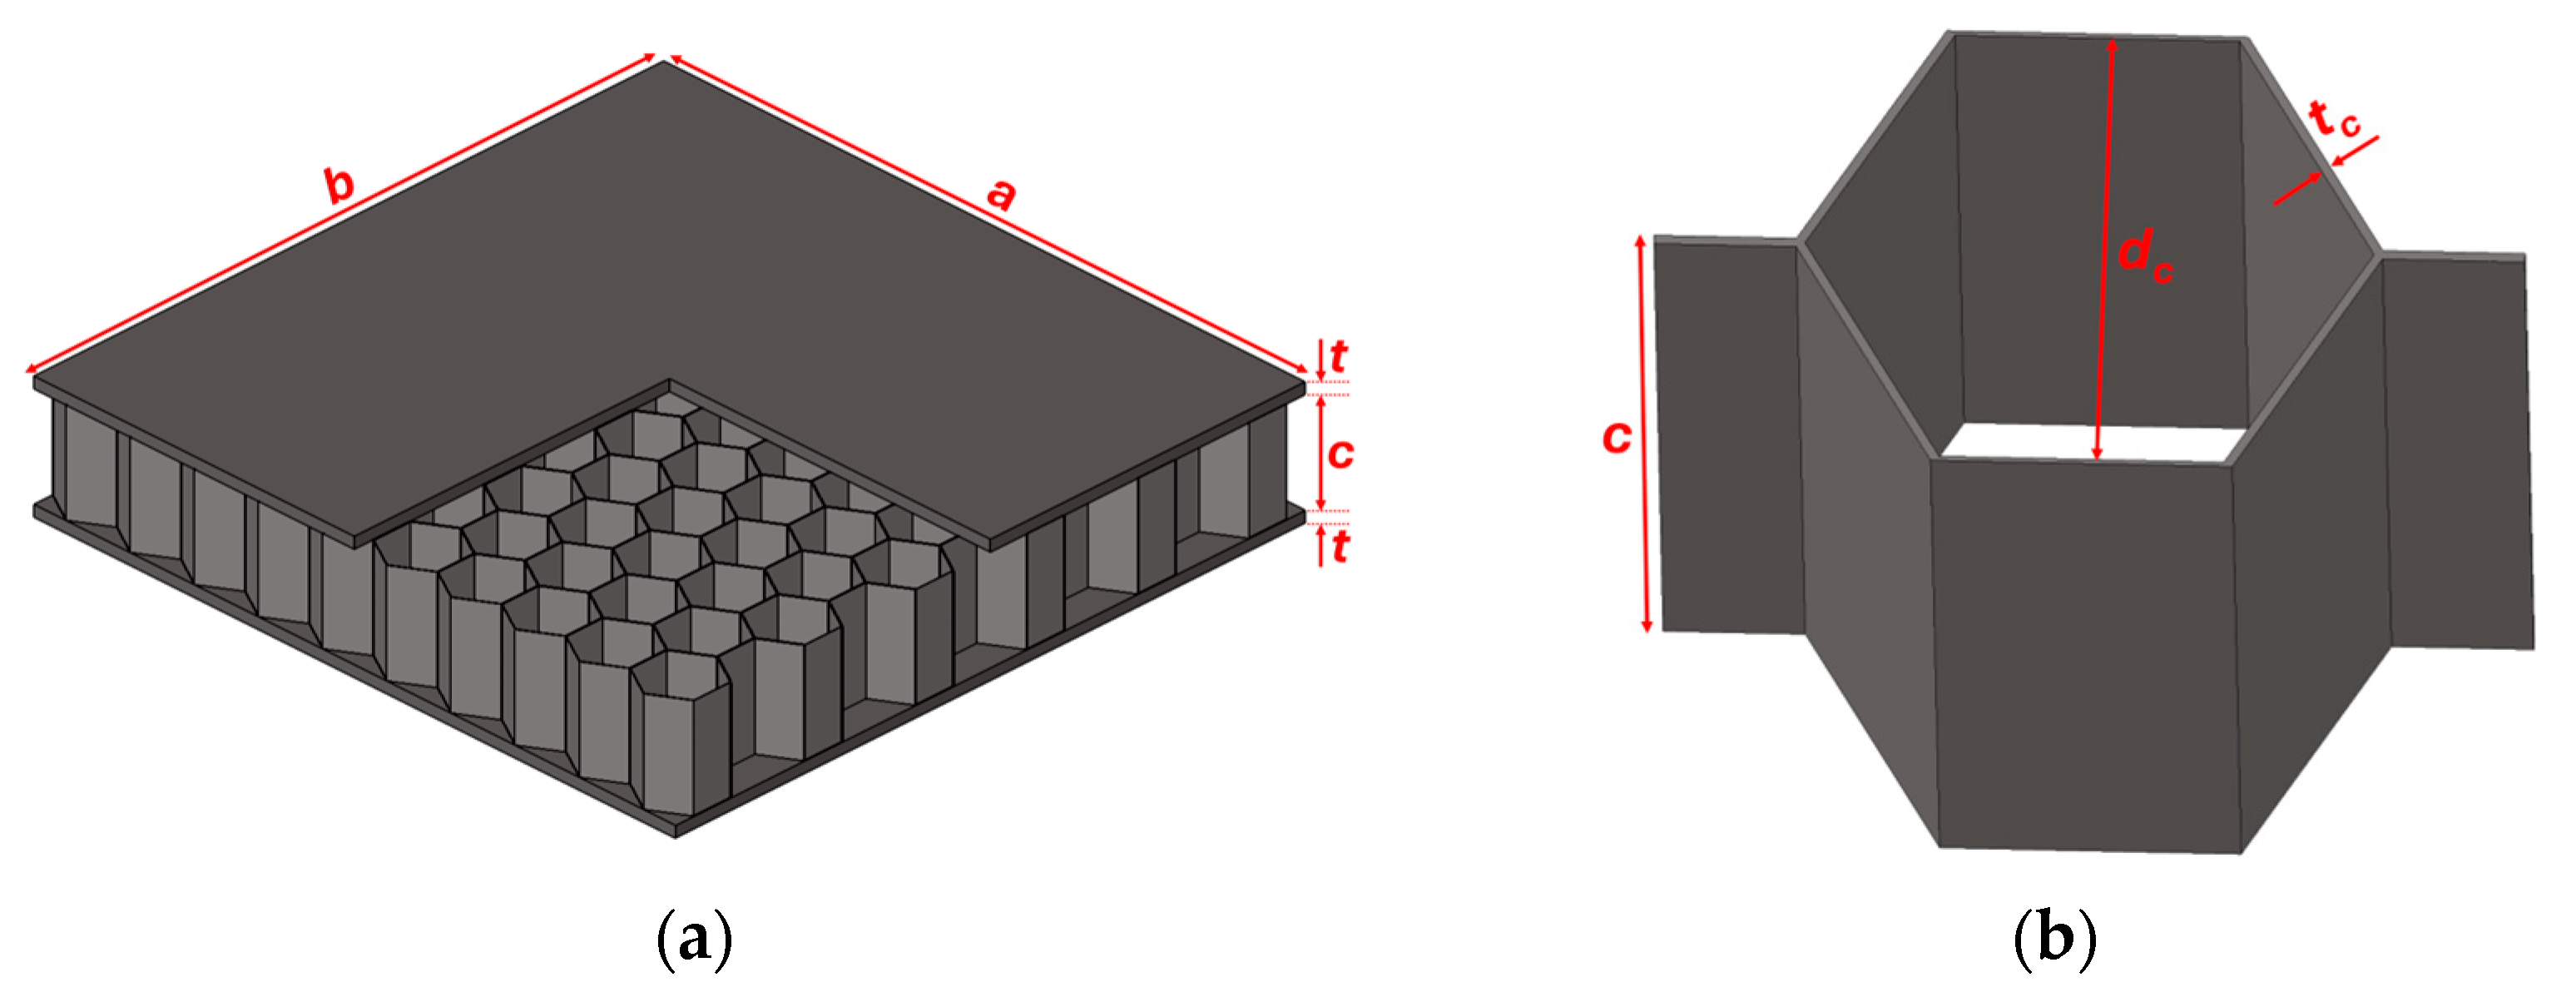
® 2022.3 (Altair Engineering, Troy, MI, USA) software package. A non-linear analysis was carried out and the sover convergence of the non-linear system was reached by means of the Newton–Raphson algorithm. The honeycomb panel was generated in HyperMesh 2022.3 software (Altair Engineering, Troy, MI, USA), with the dimensions reported in
Table 1, referring to
Figure 1.
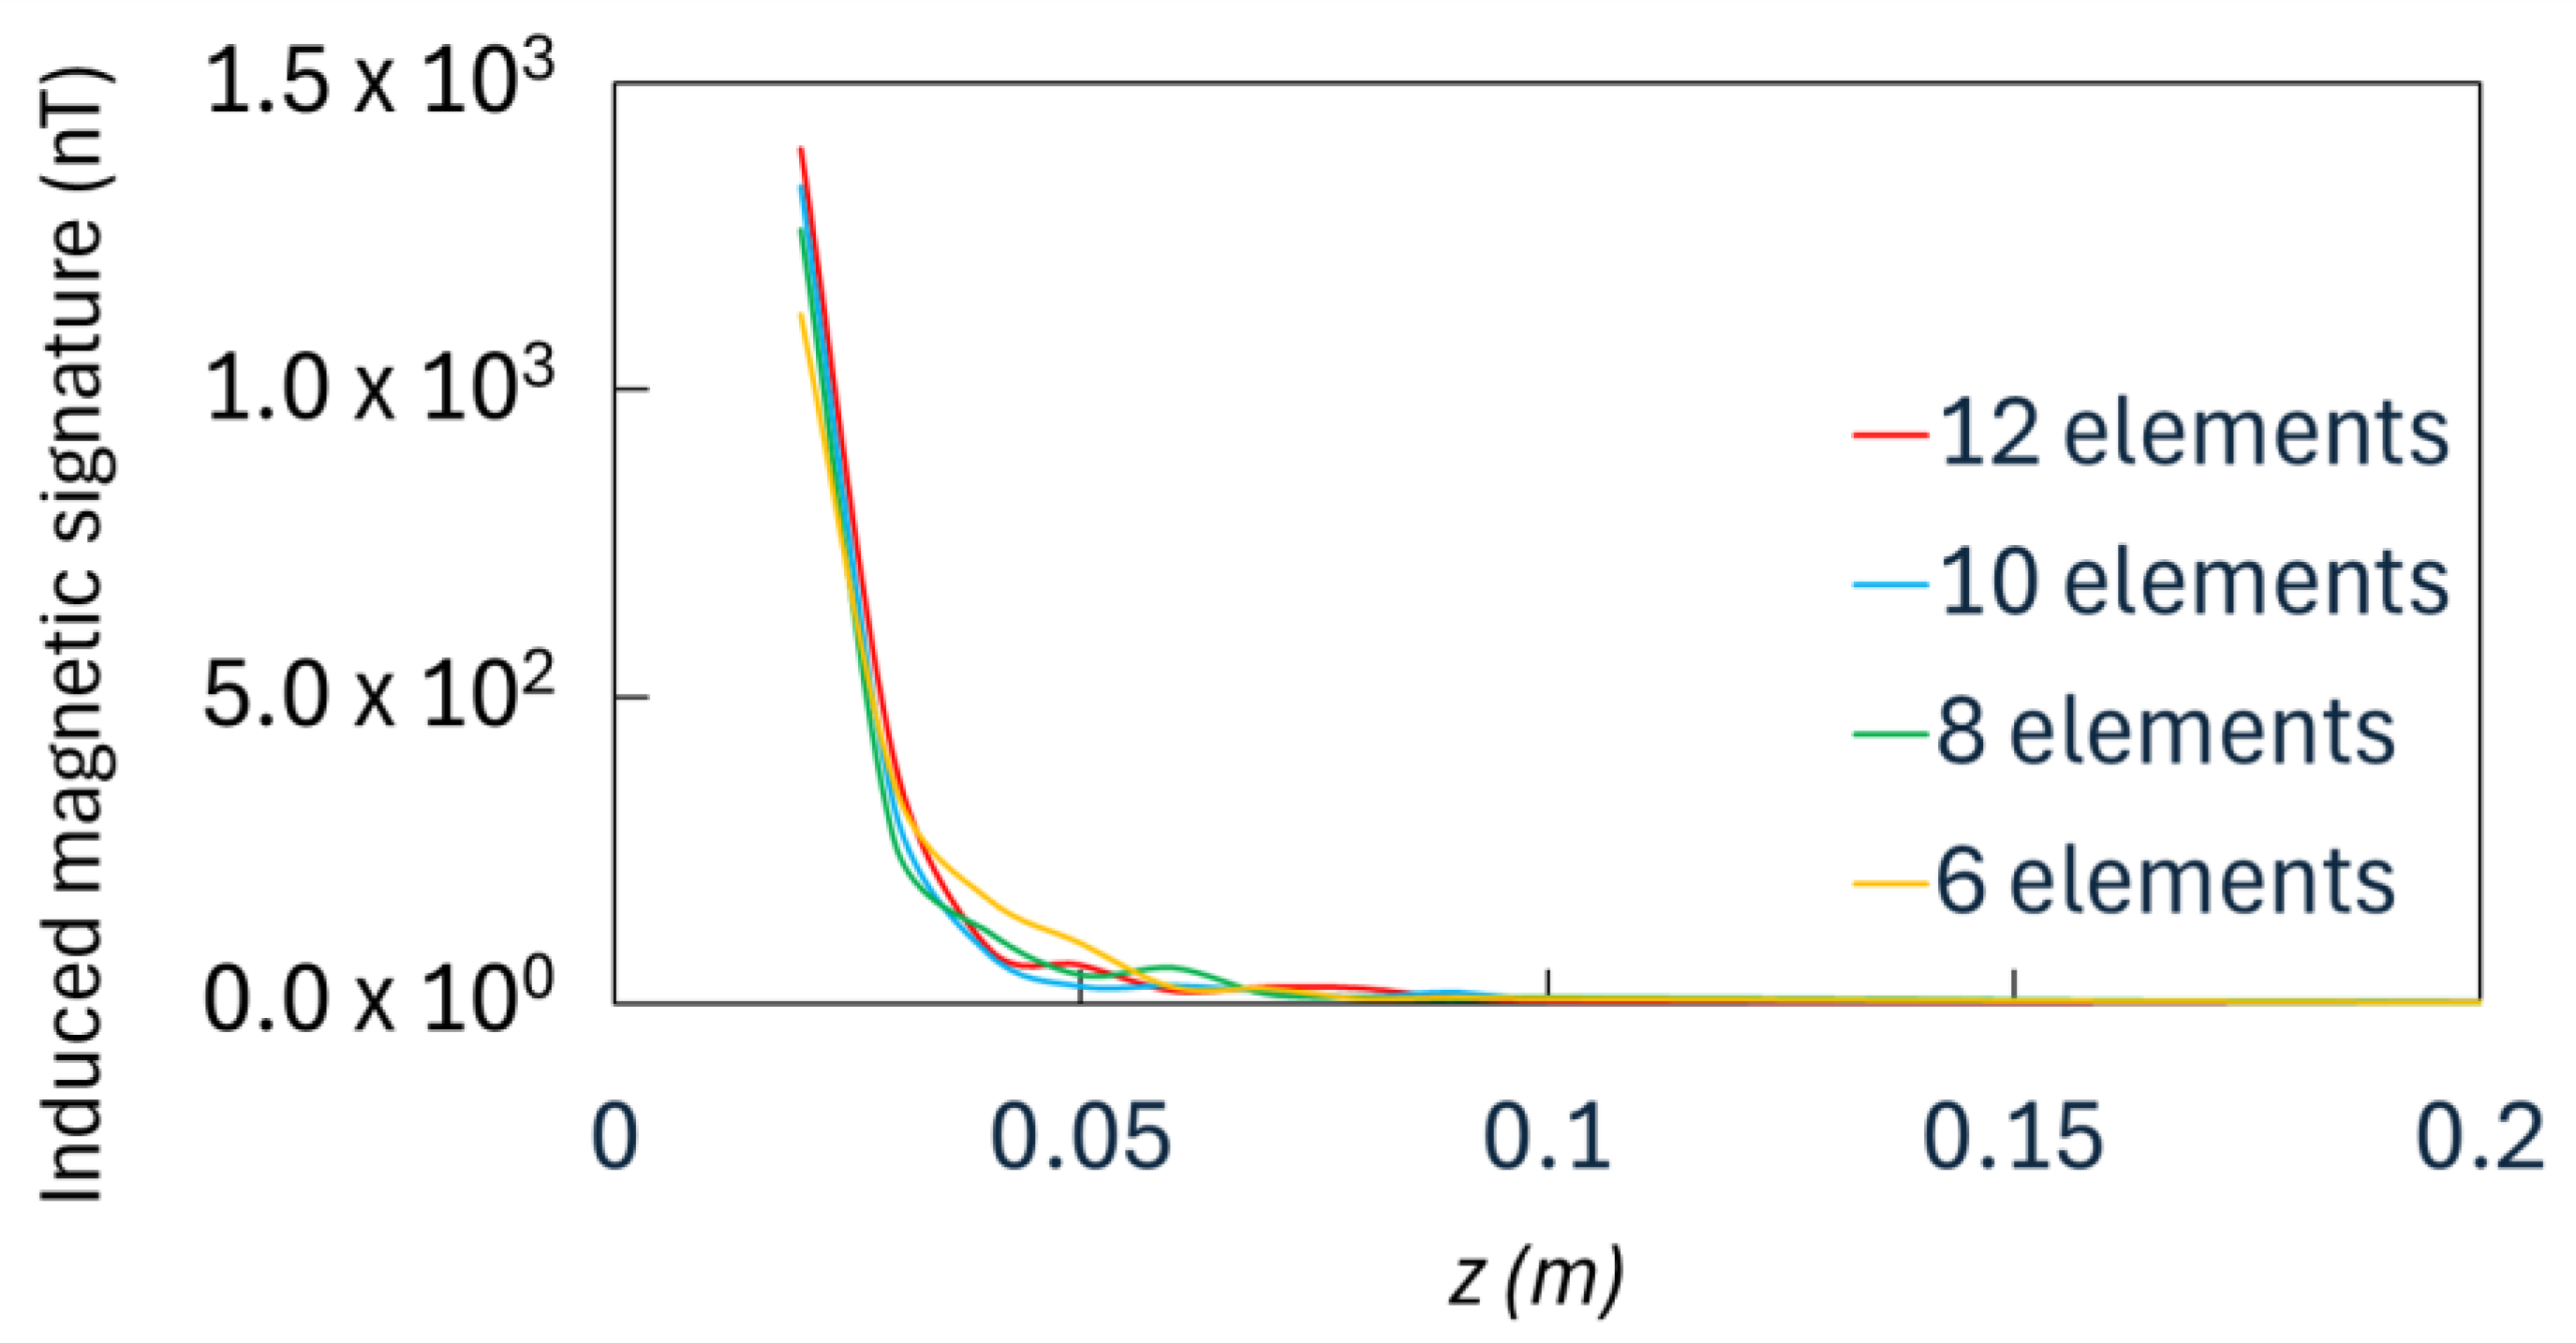
A mesh sensitivity study was conducted to determine the mesh independency. The results of four different mesh sizes based on the number of elements on each cell’s edge were compared. Four analyses were carried out on the SHS with 12, 10, 8 and 6 elements on each cell’s edge, and the results are reported in
Figure 2.
The minimum percentage difference to obtain an acceptable mesh size was considered to be 10%. The percentage difference between the models with 6 and 8 elements is 11.08%; thus, the mesh with 6 elements was discarded. The percentage difference between the models with 8 and 10 elements is 5.34%; moreover, a further analysis with 12 elements was conducted, and the percentage difference between the models with 8 and 12 elements is 9.42%, lower than the minimum accepted difference of 10%; therefore, the mesh with 8 elements was selected. The mesh with 8 elements on each cell’s edge corresponds to a mesh size of 0.4 mm; the mesh size was then refined in the different parts of the structure, taking into account the honeycomb’s thicknesses with reference to
Figure 1. The mesh dimension was refined on foil thickness t
c. Two elements were placed after performing a mesh quality check to ensure the best element quality possible in the current zone. A mesh quality check was also performed on the core thickness c, and 10 elements were placed along this dimension. Node continuity was guaranteed between the core mesh and skin mesh; therefore, the skins were meshed with the same element size of the core, equal to 0.4 mm.
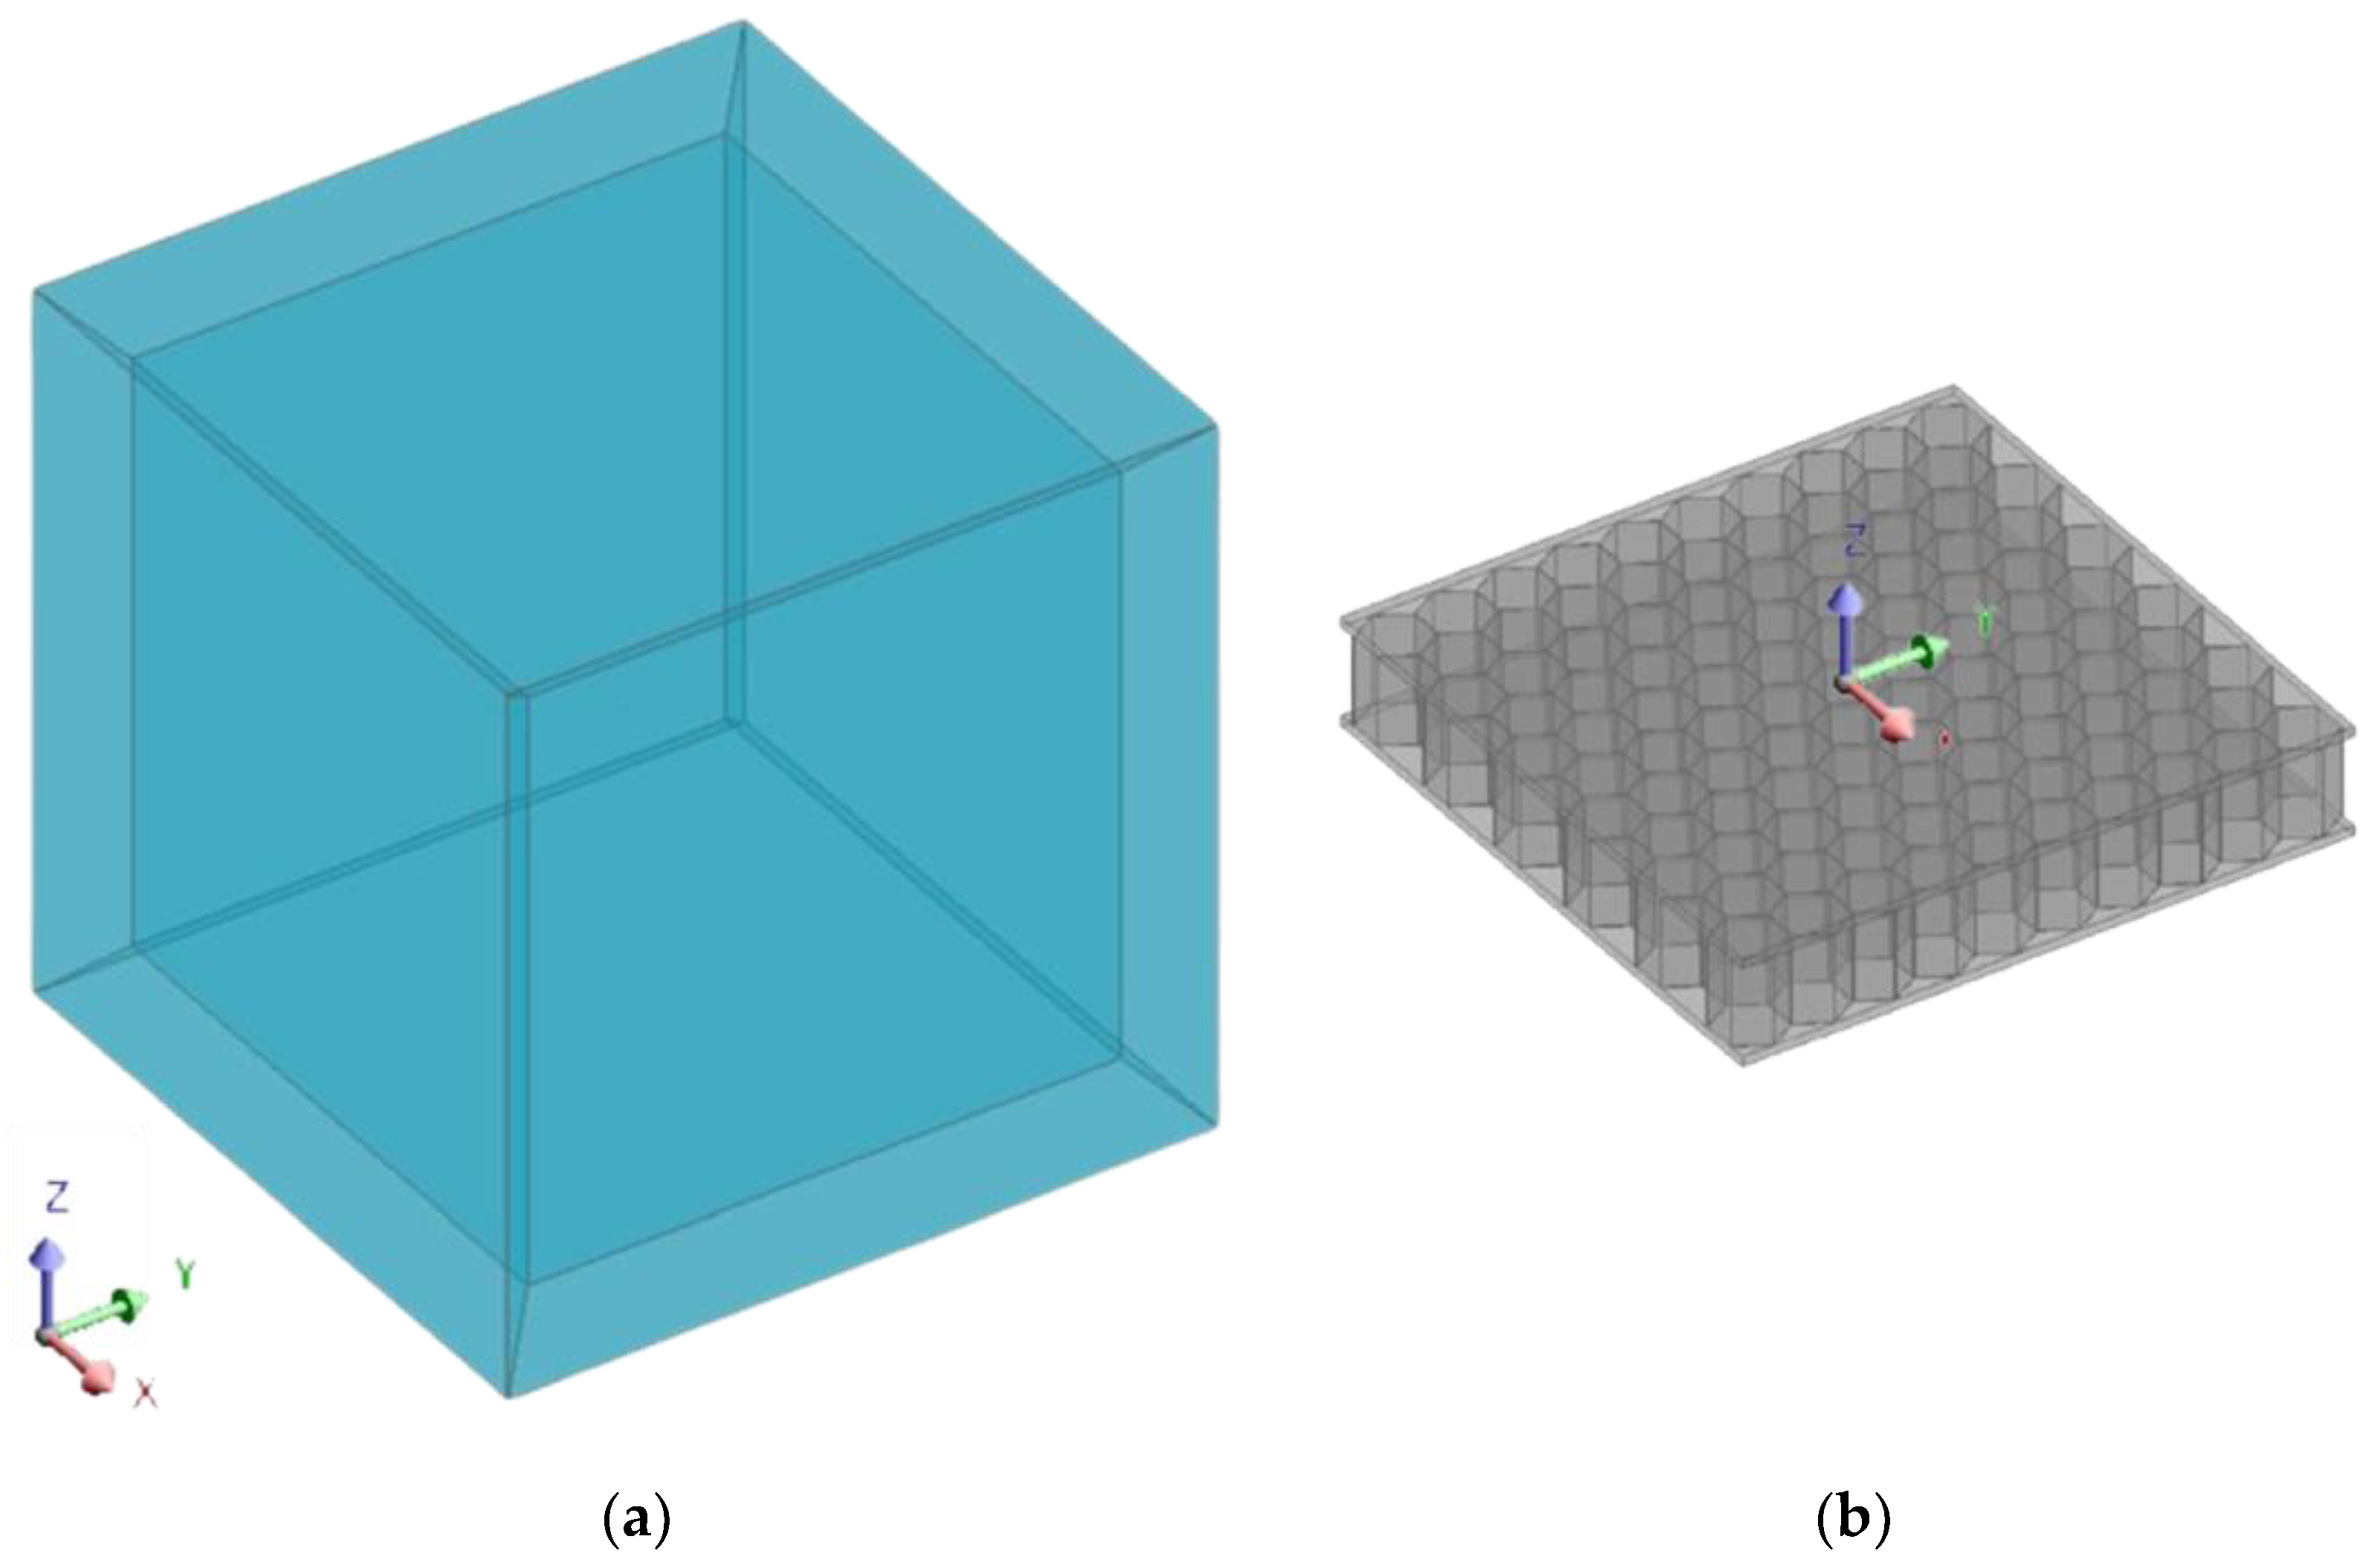
Boundary conditions were applied by placing the honeycomb panel within a domain simulating the earth’s magnetic field and represented by a box with a 120,000 mm external edge length and 10,000 mm thickness, as shown in
Figure 3a, to evaluate the induced magnetic signature distribution in the surrounding environment due to the presence of the honeycomb panel in the earth’s magnetic field.
The coordinate origin was placed on the central part of the top skin, as shown in
Figure 3b, to equalise the coordinate system with that of the theoretical model (TM).
The x- and z-components of the earth’s magnetic field summarised in
Table 2 are those which correspond to a typical location placed in northern Europe. This choice was arbitrary but well justified by the aim of this study: the determination of the induced magnetic signature on small-size honeycomb panels resulting from a typical earth-induced magnetic field experienced by ships in Europe. Considering that the induced magnetic signature is proportional to the volume of the ferromagnetic system and that small-size panels with a volume of 10
−3 m
3 at most were investigated in this study, variation with geographical location and with time experienced by the earth’s magnetic field would not impact the results. In addition, the intensity of the earth’s magnetic flux density chosen for the analysis corresponds to a northward heading of the honeycomb panel [
32]. The components of the earth’s magnetic flux density are reported in
Table 2. The magnetic dipole moment components
mx and
mz induced by the earth’s magnetic field and evaluated in the theoretical model were used as input data in the FE model.
The relative magnetic permeabilities
μr of carbon steel [
33] and aluminium [
34] are reported in
Table 3.
The bending stiffness
D of the steel honeycomb sandwich panel under three-point bending load was evaluated according to the following equation [
19]:
where
Ef is the Young’s modulus of the skins,
Ec is the Young’s modulus of the core,
b is the beam width,
t is the skin thickness,
c indicates the core thickness, and
d is the distance between the centroid axis of the face-sheets. Then, we evaluated the thickness
tp of a steel panel with the same bending stiffness
D =
Es I, where
Es is the Young’s modulus of the steel and
I is the moment of inertia of the panel (
I =
b tp3/12). The obtained value of the steel panel thickness is equal to 8.5 mm.
A simplified theoretical model was developed for the different configurations in order to determine the induced magnetic flux density in the external region, the region outside the honeycomb system. For all configurations considered, the origin of the (
x,
y,
z) reference system was placed at the centre of the top face (see
Figure 3b), and the analysis of the magnetic signature was performed along the vertical axis perpendicular to the honeycomb panel and for negative values of the
z-coordinate. For all the investigated configurations, the far-field dipolar approximation was reasonably applied to determine the induced magnetic signature in the outer region.
As the first configuration, we considered the steel ferromagnetic plate, the BS, to have a volume
VSteel = a
bc1, where a is the length,
b the width, and
c1 the equivalent thickness, equivalent to the honeycomb periodic structure. The far-field behaviour of the magnetic flux density induced by the earth’s magnetic field takes the well-known point dipole magnetic form [
35]
and represents the induced magnetic signature. Here,
μ0 is the vacuum permeability,
r is the radial distance,
m = (
mx,
my,
mz) is the induced magnetic moment, and
is the unit vector along the
r direction in a polar spherical reference frame. The earth’s magnetic field has both the
z- and the
x-components, namely,
He = (
He x, 0,
He z) with
He =
Be/
μ0 and, as a result, the induced magnetic moment is given by
m = (
mx, 0,
mz), with
my = 0 being the components of
m assumed proportional to the corresponding components of the earth’s magnetic field different from zero, the
x and
z components, respectively (see
Table 2). The induced magnetic flux density turns out to be [
35]
passing from spherical to cartesian coordinates by setting
r = √
x2+
y2+
z2.
The analysis was carried out along the
z direction perpendicular to the system. Therefore, setting
x =
y = 0 yields
The magnitude of the induced magnetic flux density along
z is
Equation (5) expresses the induced magnetic signature of a steel ferromagnetic plate along the z direction.
To determine the two components of the induced magnetic moment, let us resort to a phenomenological approach based on magnetic polarizability. In anisotropic media, magnetic polarizability is a rank two tensor or a 3 × 3 matrix
αij. However, the off-diagonal components
αij (
i ≠
j) of magnetic polarizability in the systems studied can be considered negligible if compared to diagonal ones, and the equivalent longitudinal and transverse induced magnetic dipole moment components
mx and
mz are assumed to be proportional to the corresponding
x- and
z-components of the earth’s magnetic field. Therefore,
mx and
mz can be expressed in the following simple form [
35]:
with
αii =
βi VSteel (
i =
x,
z), the diagonal components of the magnetic polarizability proportional to
VSteel of the equivalent ferromagnetic plate, and
βi coefficients depending on the shape and on the aspect ratio of the ferromagnetic object. For ferromagnetic cylindrical objects, such as the hull of a ship or submarine, which can be modelled as circular cylinders, the coefficient
βi depends on the aspect ratio, defined as the length/beam ratio. This rule was extended to the ferromagnetic panels studied in this work.
The second configuration investigated was a hybrid sandwich panel, with a steel honeycomb core, the SHS, and aluminium skins, the ASHS. The analogy with the magnetic shielding used to reduce noise in a magnetic equipment was made to take into account the effect on the magnetic flux density of the skins. In the case of a cubic shielding box, the thickness
t and the length
D of the shield are important factors in optimising the shielding properties. The empirical formula expressing the shielding factor
S can be written in the form [
36]:
It can be noted that S strictly depends on the relative magnetic permeability of the material employed and, at a fixed geometry, it dramatically increases as the relative magnetic permeability of ferromagnetic materials (e.g., steel) increases. It becomes huge when using mu-metal nickel alloys and iron alloys, which exhibit relative magnetic permeabilities of thousands, as shielding ferromagnetic materials. Therefore, when S >> 1, there is perfect shielding, and when S→0, there is no shielding.
Here, we used the definition given in Equation (8) to describe the shielding effect of the skins. The shielding effect was also extended to a non-magnetic material such as aluminium. In order to do that, its dependence was introduced by including an exponential term (1 −
e−2S) in the induced magnetic flux density of Equation (4) and Equation (5), with the exponent 2
S including the simultaneous effect of both the upper and the lower skin, each contributing via
e−S, as if one considered the effect of a upper skin of double thickness 2
t. The shielding factor
S depends on the magnetic properties via
μr and on the geometric properties by means of the aspect ratio
t/
D. The term (1 −
e−2S) represents the fraction of the induced magnetic flux density passing through the skins—in other words, the shielded magnetic flux density. The exponential term takes into account the effectiveness of the material in shielding the flux of the earth’s magnetic field, even though in this framework, the meaning of
S is opposite to the usual meaning that
S has in the magnetic shielding technique. The employment of aluminium skins shields
Be almost completely (
S→0, perfect shielding), dramatically decreasing the induced magnetic signature, while that of steel leads to almost no shielding (
S→1, no shielding). The steel core of the honeycomb panel can be regarded as an effective medium characterised by an effective induced magnetic dipole moment
meff, with components
mx eff and
mz eff defined as
where the coefficient
η =
Vhoneycomb/
VSteel (
η < 1), with
Vhoneycomb being the volume filled by steel in the honeycomb core (excluding the skins). To calculate
Vhoneycomb, first, it is necessary to calculate the volume of the hexagonal prismatic cell, which forms the basis of the honeycomb structure
Vh = Ahc, with
Ah = 3
la being the area of the hexagon (
h indicates the hexagonal cell),
l = 2
a√3/3 the hexagonal side,
a the apothem, and with
c being the height of the hexagonal prism corresponding to the core thickness. To find the volume filled by steel constituting the walls of the hexagonal cells, let us consider the inner hexagonal prism filled by air, with a volume of
V1h = A1hc, where
A1h = 3
l1a1 is the area of the inner hexagon,
l1= 2
a1 √3/3 the inner hexagonal side, and
a1 the apothem. Therefore, the volume filled by steel in the honeycomb structure is calculated as a volume difference, viz.,
Vhoneycomb = (
Vh −
V1h)
N, and, in explicit form, it is expressed as
where
N is the number of hexagonal prismatic cells contained in the honeycomb core. Taking into account Equation (11), the coefficient
η, which quantifies the effective properties, reads
According to the effective description, the steel magnetic moment characterising the walls of the honeycomb structure is assumed to also be distributed in the hollow cells filled by air, resulting in an effective ferromagnetic medium. In turn, the shielded and induced magnetic flux density representing the induced magnetic signature of the honeycomb sandwich can be written in the following form:
where the subscript “sh” denotes shielded.
The empirical formula (1 − e−2S) depending on the shielding factor S was conceived for the solid portion of the honeycomb sandwiches represented by the honeycomb skins. Therefore, the shielding effect was not directly applied to the open-cell structures, but it was supposed that the earth’s magnetic flux density would be shielded by the solid structure that covers the honeycomb core. The honeycomb core experiences the shielded and induced magnetic flux density, which depends on the nature of the metal employed for the skin, either aluminium or steel.
The magnitude of the induced and shielded magnetic flux density takes the following form:
Equation (14) expresses the induced magnetic signature of the honeycomb sandwich. For aluminium skin
S→0, so that the term (1 −
e−2S) ≈ 2
S and
Bsh(
z) can be approximately expressed as
showing a linear dependence on
S of
Bsh(
z).
In turn,
mx eff =
αxx He x η and
mz eff =
αzz He z η, yielding
showing the linear dependence on
Vhoneycomb.
3. Results and Discussion
In this section, the results obtained according to the FEM numerical analysis and to the TM are presented, and the agreement between the two approaches is discussed. The induced magnetic signatures calculated for different types of honeycomb panels were compared to those of the equivalent steel plates to estimate the influence of the open-cell structure on the magnetic response. Specifically, two cases were investigated:
- -
Case (1): the induced magnetic signature, generated by different panels with lateral dimensions of 60 mm × 60 mm, was investigated using both FEM and the TM;
- -
Case (2): the induced magnetic signature, generated by different panels with lateral dimensions of 600 mm × 600 mm, was studied using the TM.
The
x- and
z-components of the earth’s magnetic field, determined from
Table 2, are
He x = 15.92 A/m and
He z = −35.81 A/m, respectively. For the panel in case (1), the systems investigated are (a) BS; (b) SHS with steel skins with a relative magnetic permeability
μr = 100; (c) ASHS with aluminium skins with a relative magnetic permeability
μr = 1. In both honeycomb panels, the skins have a thickness
t = 1 mm and
D = 60 mm, as those of BS. For the panel of case (2), the investigated configurations are (a) BS; (b) SHS; (c) ASHS.
Firstly, case (1) is presented. The aspect ratio is 60/8.5 ≈ 7:1, so it is close to the length/beam aspect ratio 10:1 of the hull of a ship modelled as a cylindrical object, so that
βx = 1.06 and
βz = 1.94 [
35]. For the BS 60 mm × 60 mm × 8.5 mm investigated (case 1(a)), it is
VSteel = 3.06 × 10
−5 m
3. Therefore,
mx ≈ 51.64 × 10
−5 A m
2 and
mz ≈ −212.60 × 10
−5 A m
2. For cases 1(b) and 1(c), represented by SHS and ASHS, respectively, it is
Vhoneycomb = 1.25 × 10
−6 m
3, calculated by using Equation (11), setting
a = 3.06 × 10
−3 m,
a1 = 3 × 10
−3 mm, and
N = 110 so that
η = 0.041 determined via Equation (12). In particular, for 1(b),
SSteel = 1.33 and for 1(c),
SAl = 1.33 × 10
−2, calculated ·according to Equation (8), yielding (1 −
e−2S Steel) = 0.93 and (1 −
e−2S Al) = 0.026, respectively. This means that, while the ferromagnetic steel has almost no shielding effect, reducing the induced magnetic signature by only 7%, the non-magnetic aluminium shields the earth’s magnetic flux density almost completely, with only less than 2% of the induced magnetic signature passing through the two skins.
In this respect, it is well known that the relative magnetic permeability of ferromagnetic materials also has a frequency dependence [
37]. However, this effect would lead to a small change in relative magnetic permeability, which, in turn, would very slightly affect the shielding effect. Note, indeed, that, even by supposing a 150% increase in relative magnetic permeability with decreasing frequency due to its frequency dependence, the shielding effect of carbon steel would vary by only about 7%; therefore, it would not cause a significant change in the results [
38].
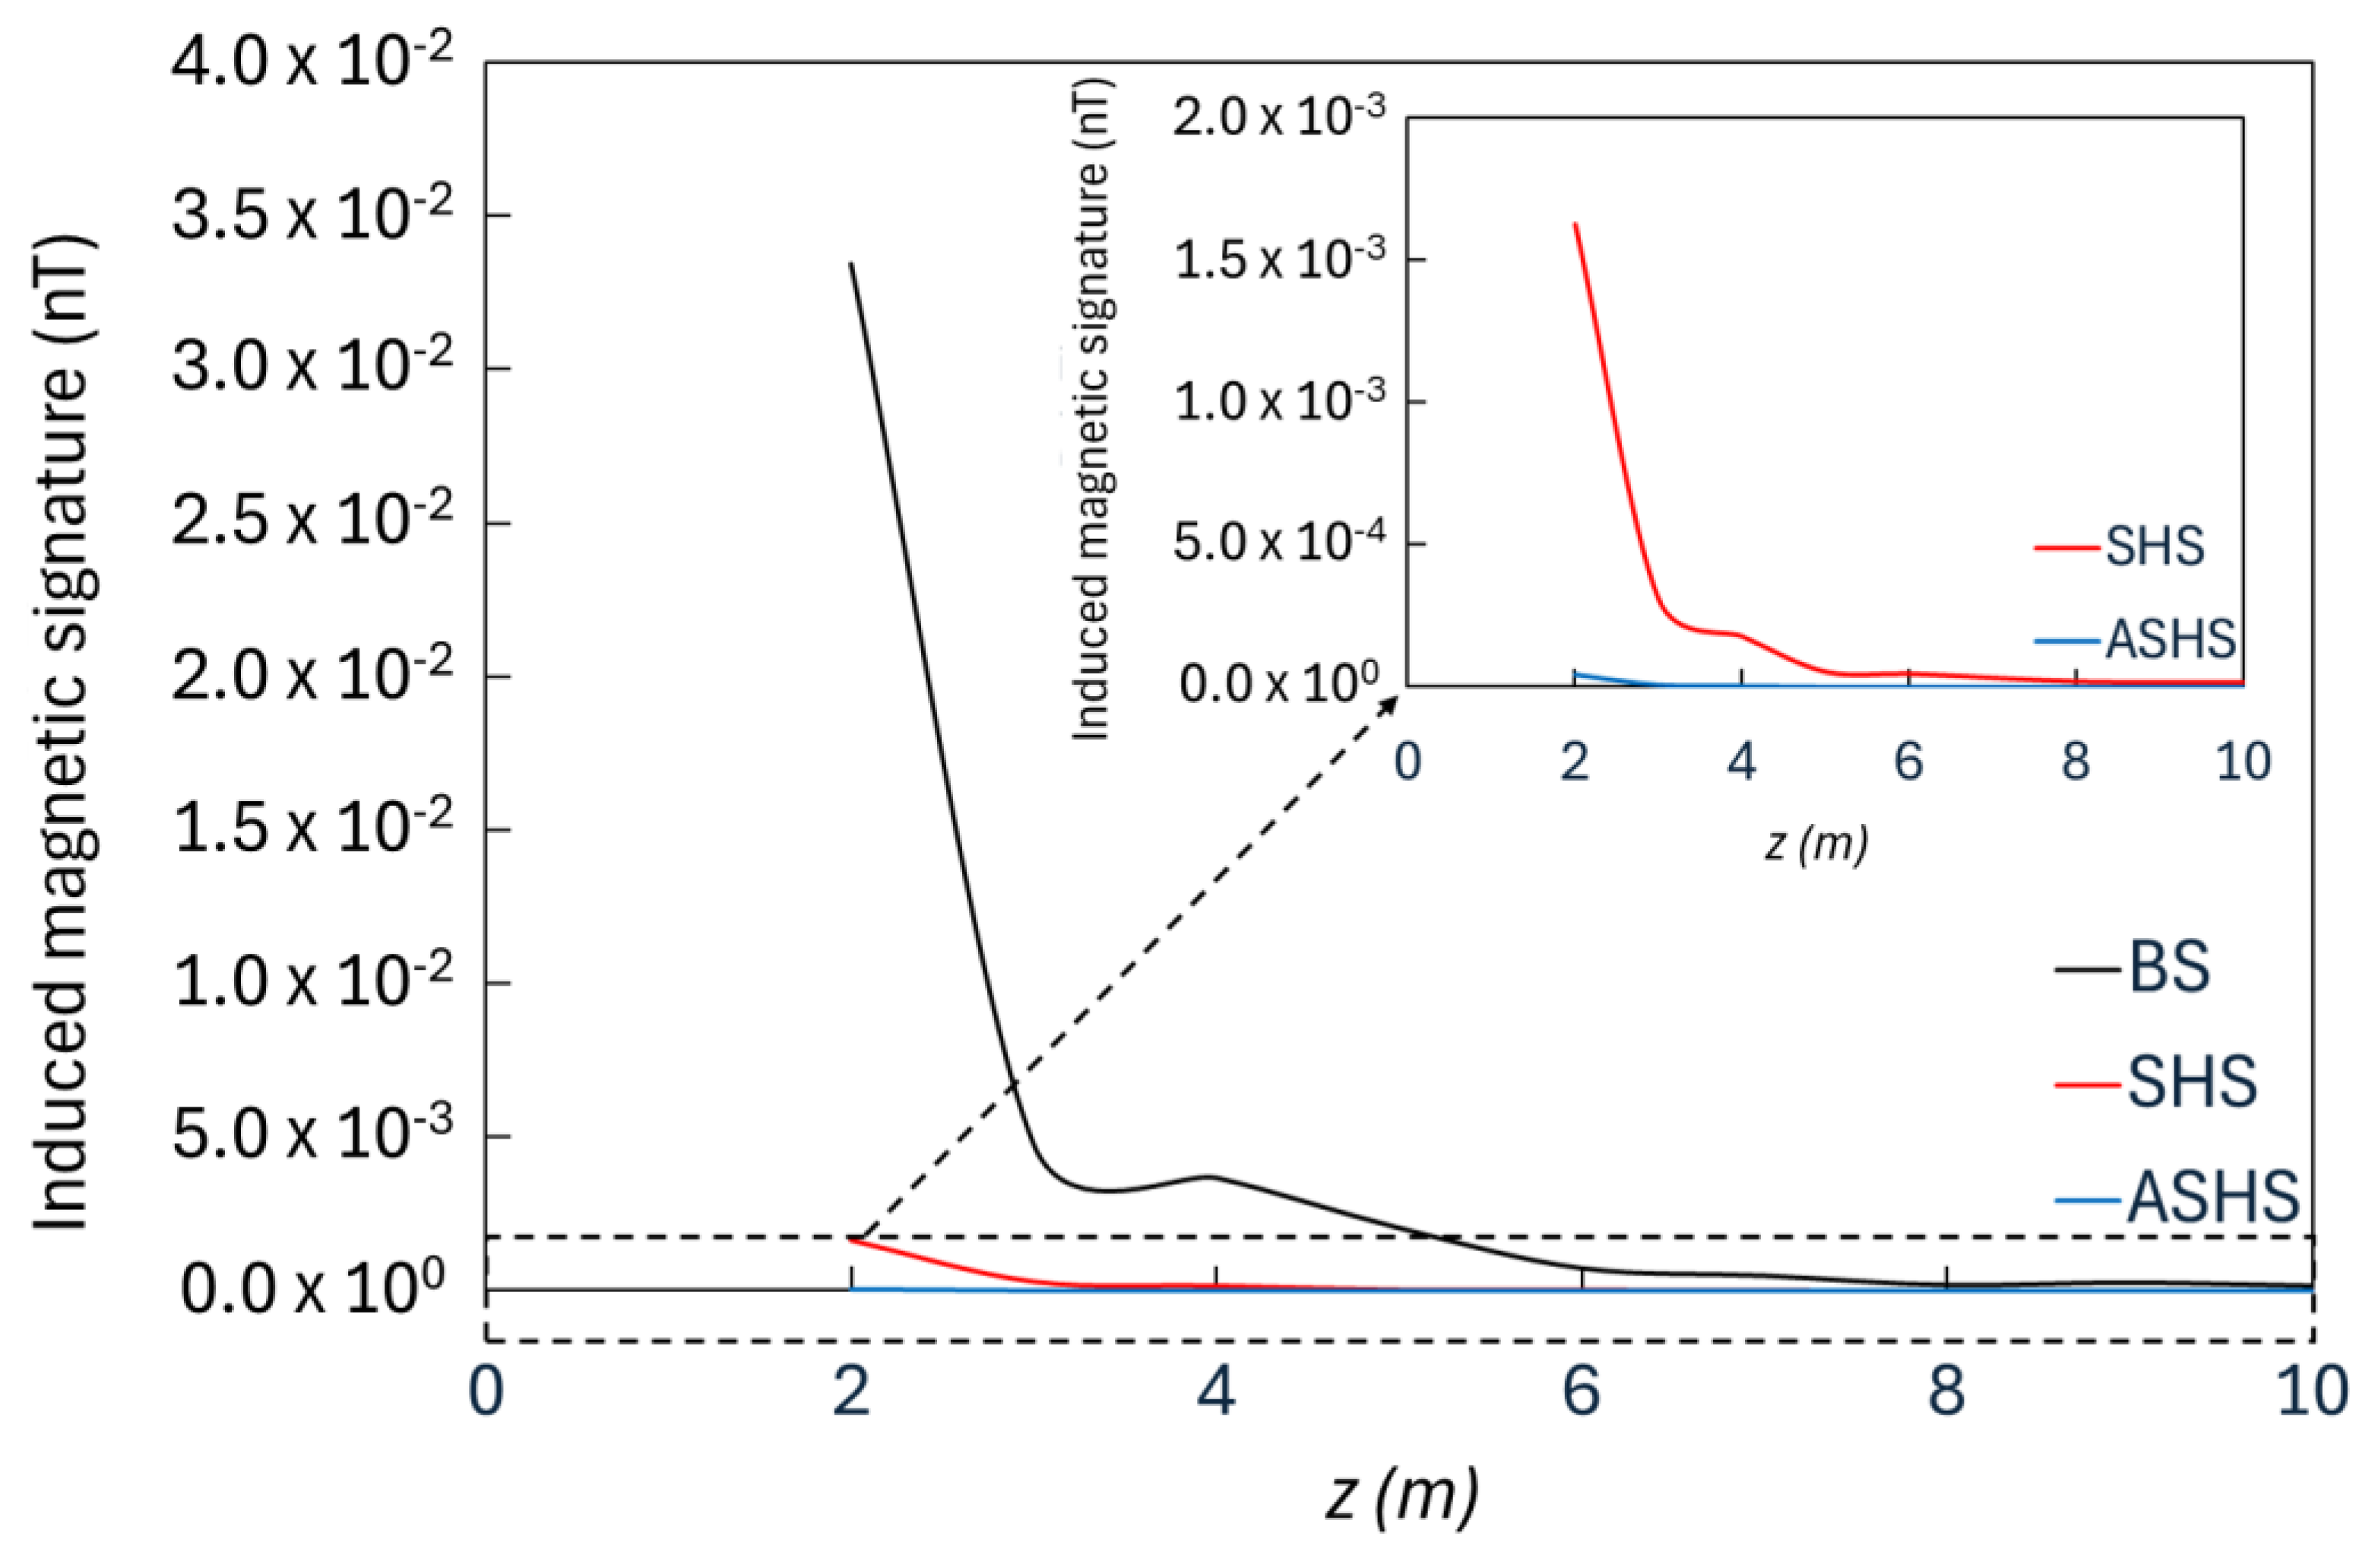
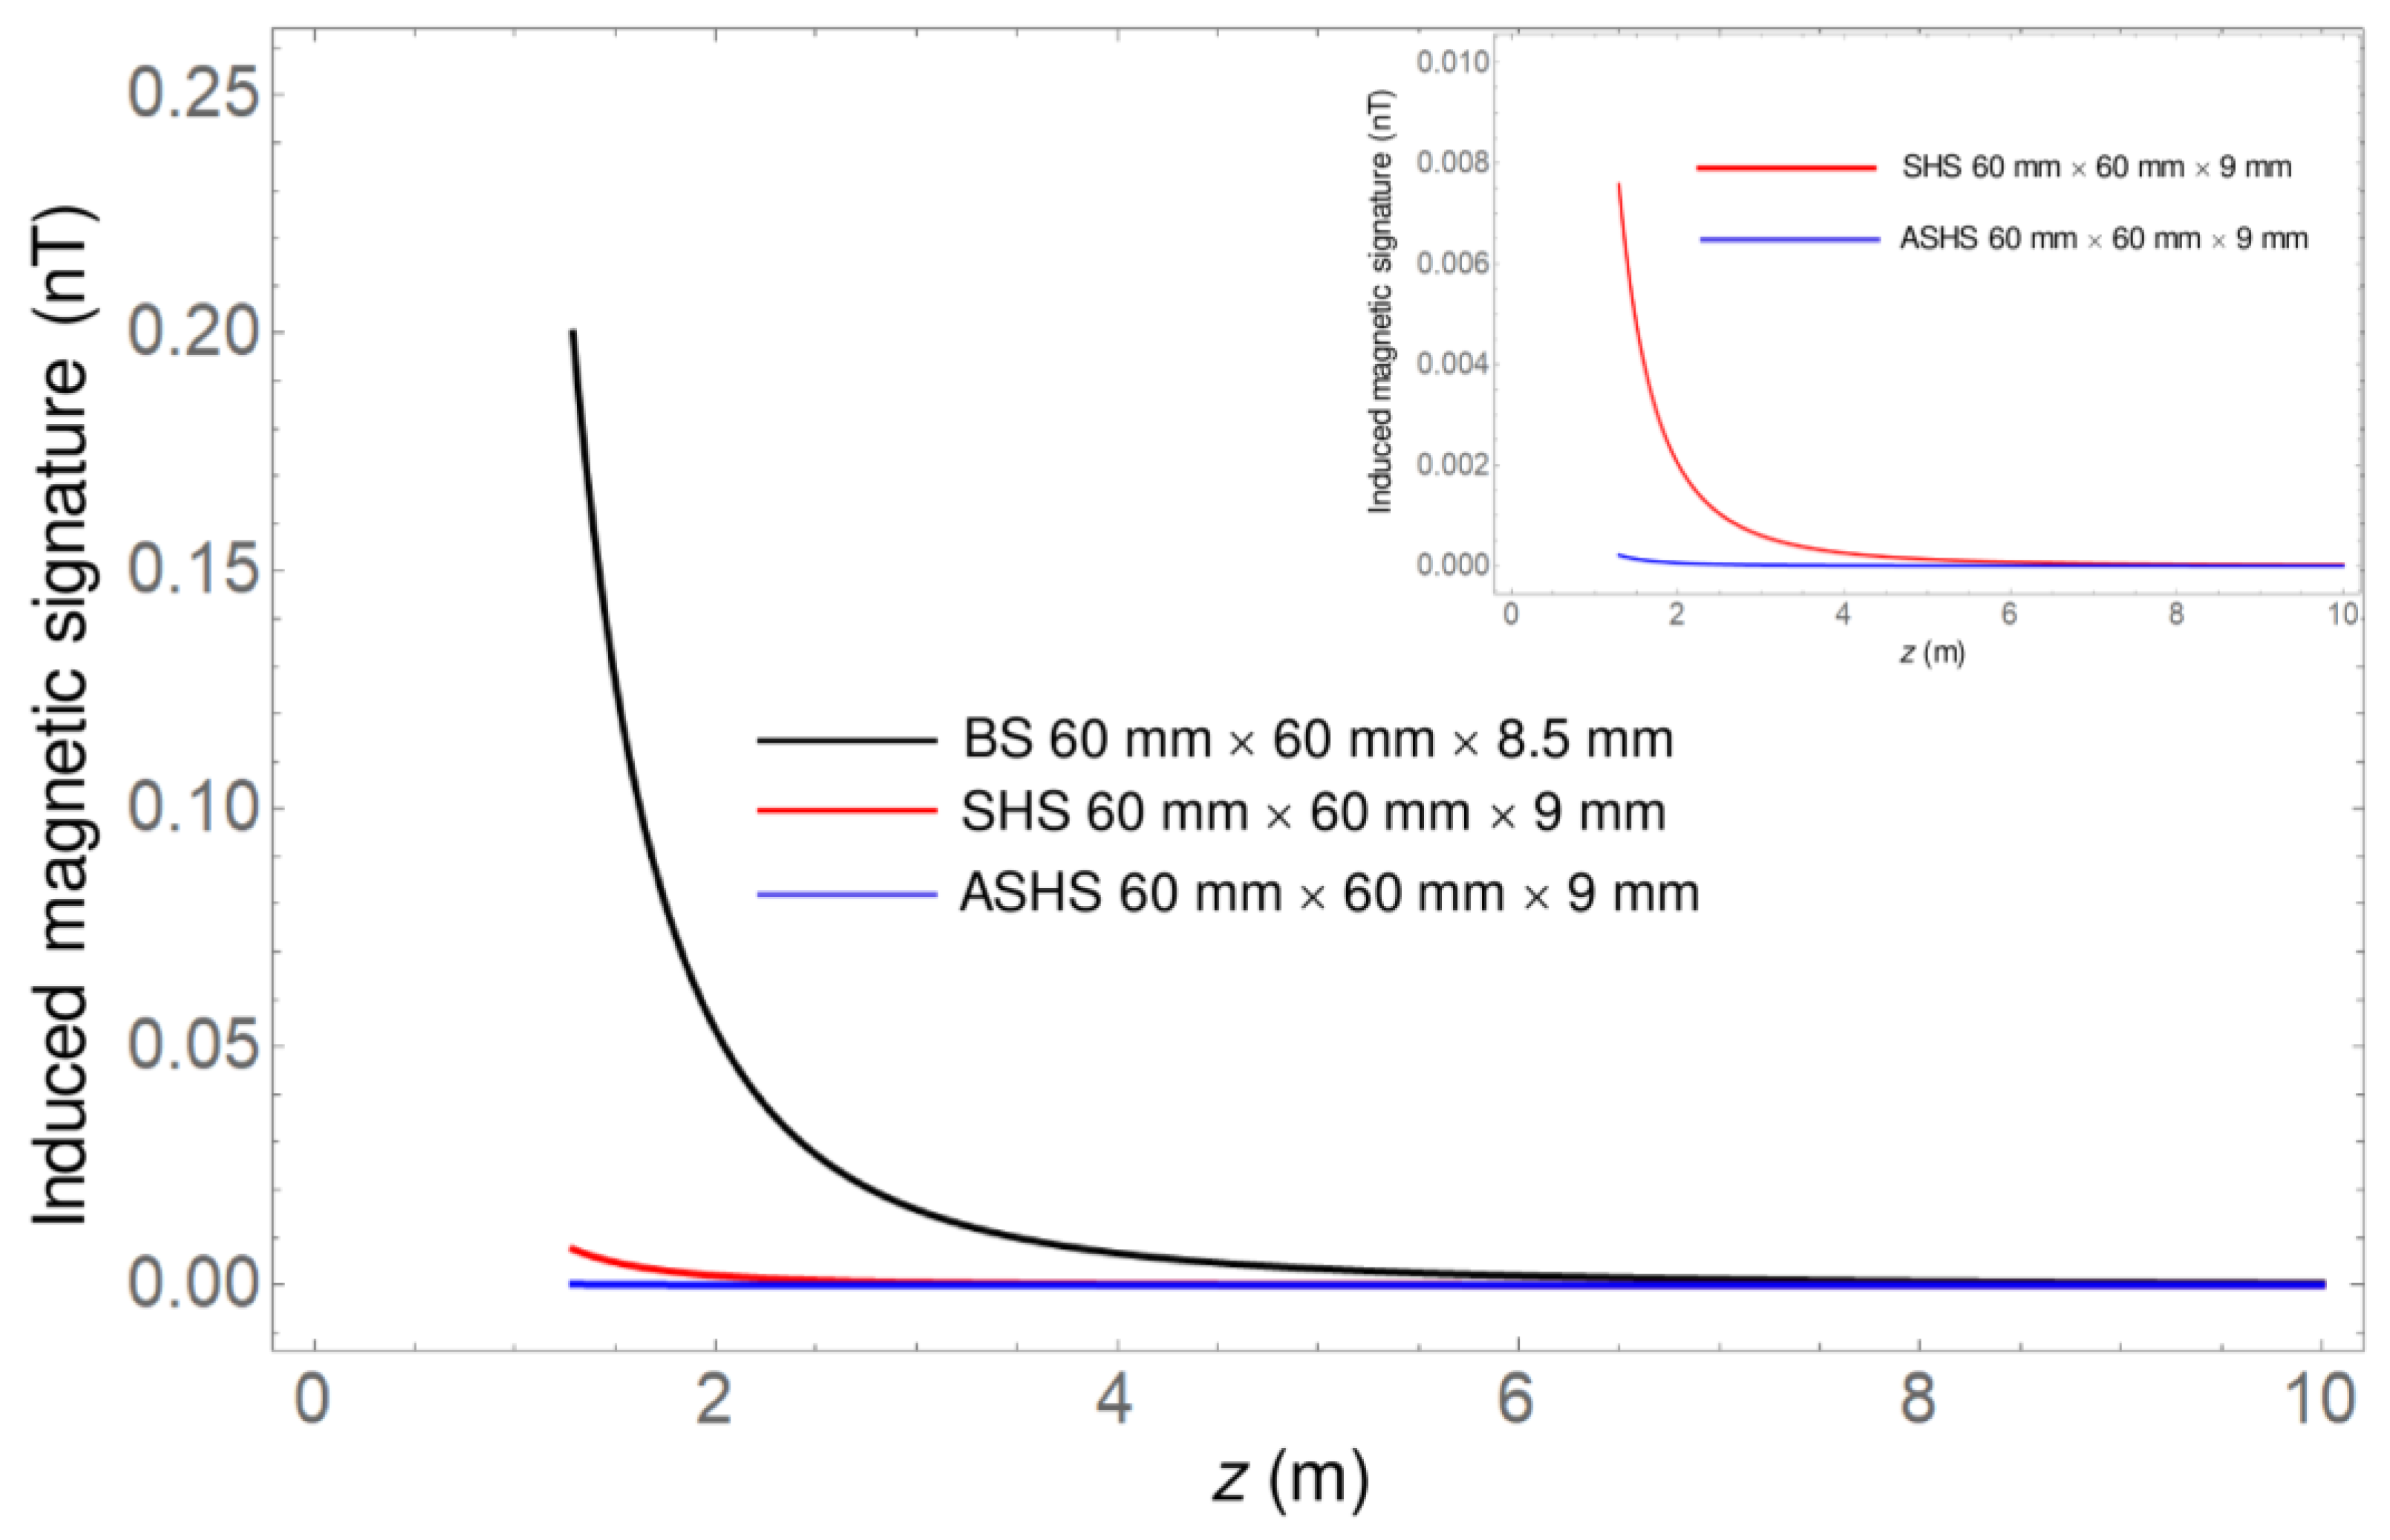
The trend of the induced magnetic signature was evaluated through a path along
z-axis from the top skin of the honeycomb and passing on its centreline, up to a distance of 10 m from the panel along a negative z-direction. The results are shown in
Figure 4 for the FEM and in
Figure 5 for the TM.
As the dipolar approximation is valid for distances greater than the average size of the system, a distance larger than 0.1 m was considered the minimum, and the magnetic flux density was evaluated. Both FEM and TM results are in accordance; therefore, the same considerations can be applied. It was observed that the induced magnetic signature strongly diminishes with increasing z and becomes negligible at a few metres, showing a dramatic downshift in the honeycomb systems due to the combined effect of the skins and to the presence of air in the honeycomb panel compared to the equivalent steel plate. In the inset, it can be noted that the asymptotic merging and vanishing of the induced magnetic signature curves for the two honeycomb panels occurs at z ≈ 5 m. Finally, it is evident that there is a strong reduction in the honeycomb panel with aluminium skins compared to the honeycomb panel with steel skins. The use of the SHS in place of the BS leads to a reduction of 96.2% in the induced magnetic signature according to the TM and of 95.3% according to the FEM. The induced magnetic signature can be further reduced with the application of the ASHS in place of the BS, with a reduction of 99.9% for both FEM and TM. A comparison between the results of the ASHS and those of the SHS allows us to assert that the ASHS reduces the induced magnetic signature by 97.2% according to the TM and 97.3% according to the FEM.
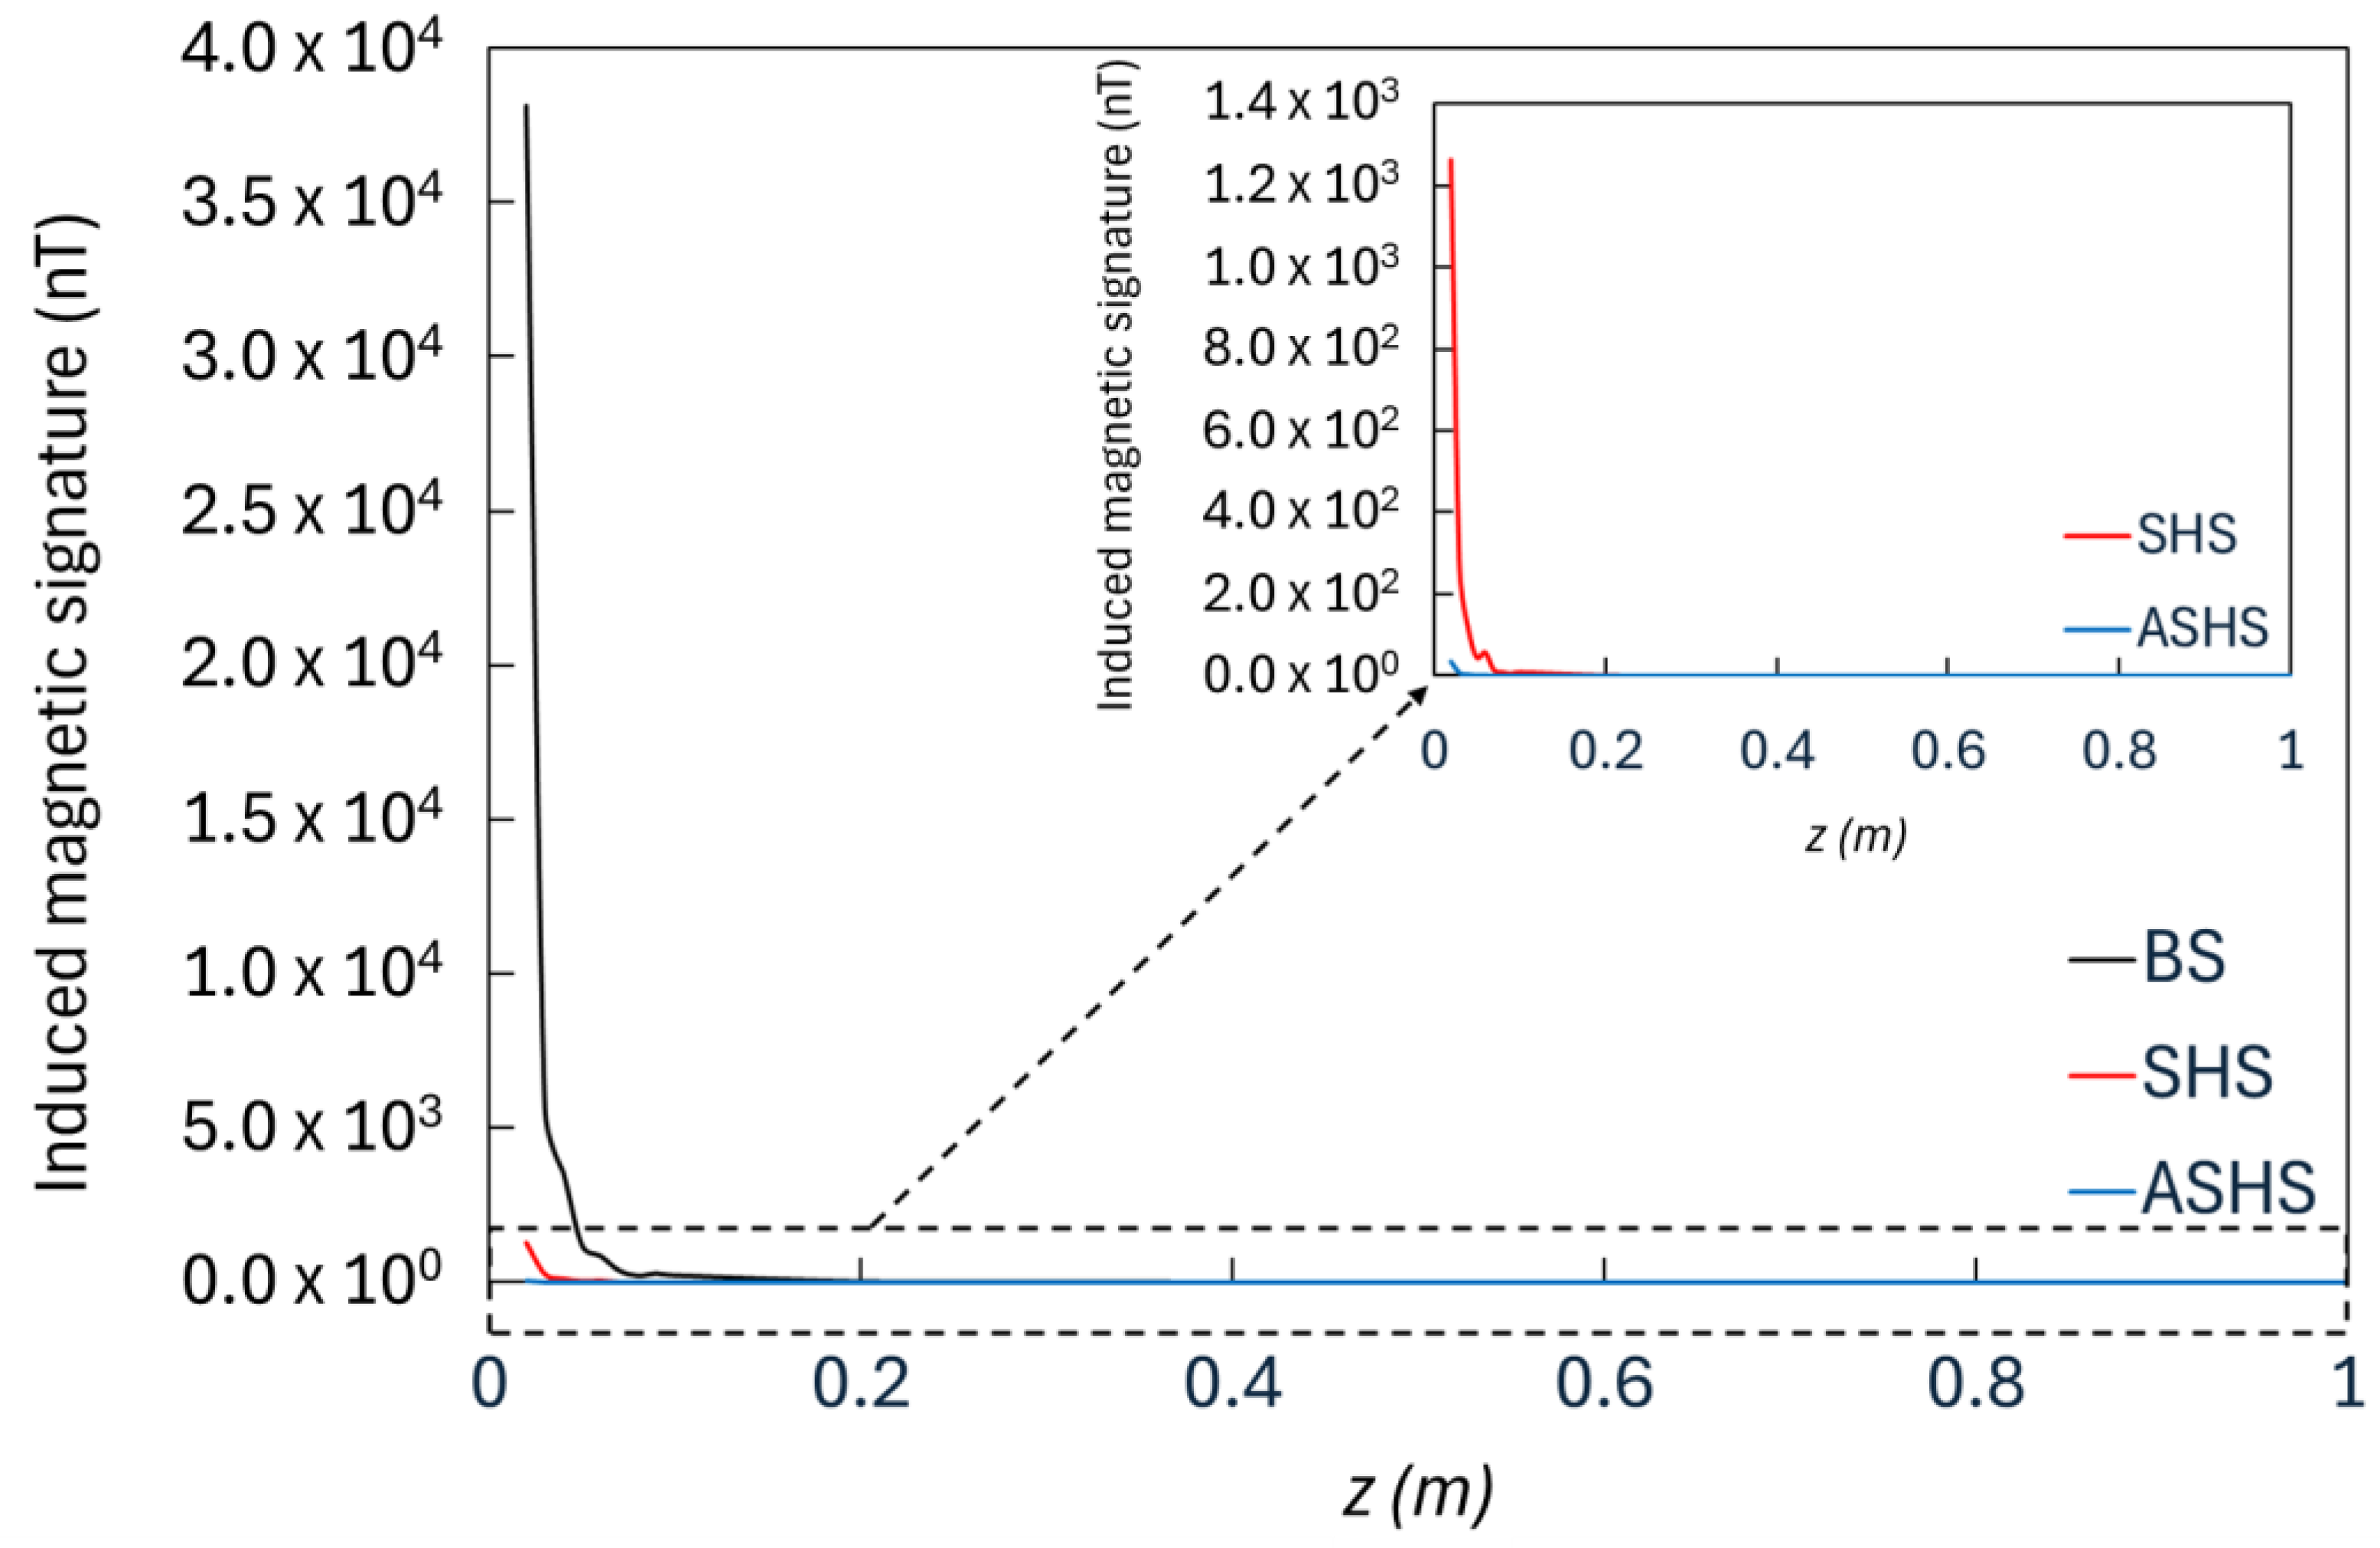
This effect is more noticeable looking at
Figure 6 for the FEM and
Figure 7 for the TM, where the same comparison is shown for a restricted range of distances till
z = 1 m. The dramatic decrease in the induced magnetic signature in the honeycomb panels already occurs for distances much shorter than
z = 1 m, and the shielding effect of aluminium is also evident for these small distances.
Secondly, case (2) is presented. For case 2(a), represented by the equivalent steel plate, it is VSteel = 3.06 × 10⁻³ m3. For the aspect ratio 600/8.5 ≈ 70:1 βx ≈ 1 and βz ≈ 2, so that mx ≈ 48.72 × 10⁻³ A m2 and mz ≈ − 219.16 × 10⁻³ A m2.
For cases 2(b) and 2(c), it is Vhoneycomb = 1.25 × 10⁻⁴ m3 via Equation (11) setting N = 11,000, so that, as for cases 1(b) and 1(c), η = 0.041, calculated by means of Equation (12). In particular, for 2(b), SSteel = 0.13, and for 1c), SAl = 1.33 × 10⁻³, yielding (1 − e−2S Steel) = 0.23 and (1 − e−2Sal) = 0.0027, respectively. Instead, for the honeycomb panels, it is mx eff ≈ 1.99 × 10⁻³ A m2 and mz eff ≈ − 8.93 × 10⁻³ A m2. In particular, for 1(b), SSteel = 0.13, and for 1(c), SAl = 1.33 × 10⁻³, yielding (1 − e−2S Steel) = 0.23 and (1 − e−2S Al) = 0.0027, respectively.
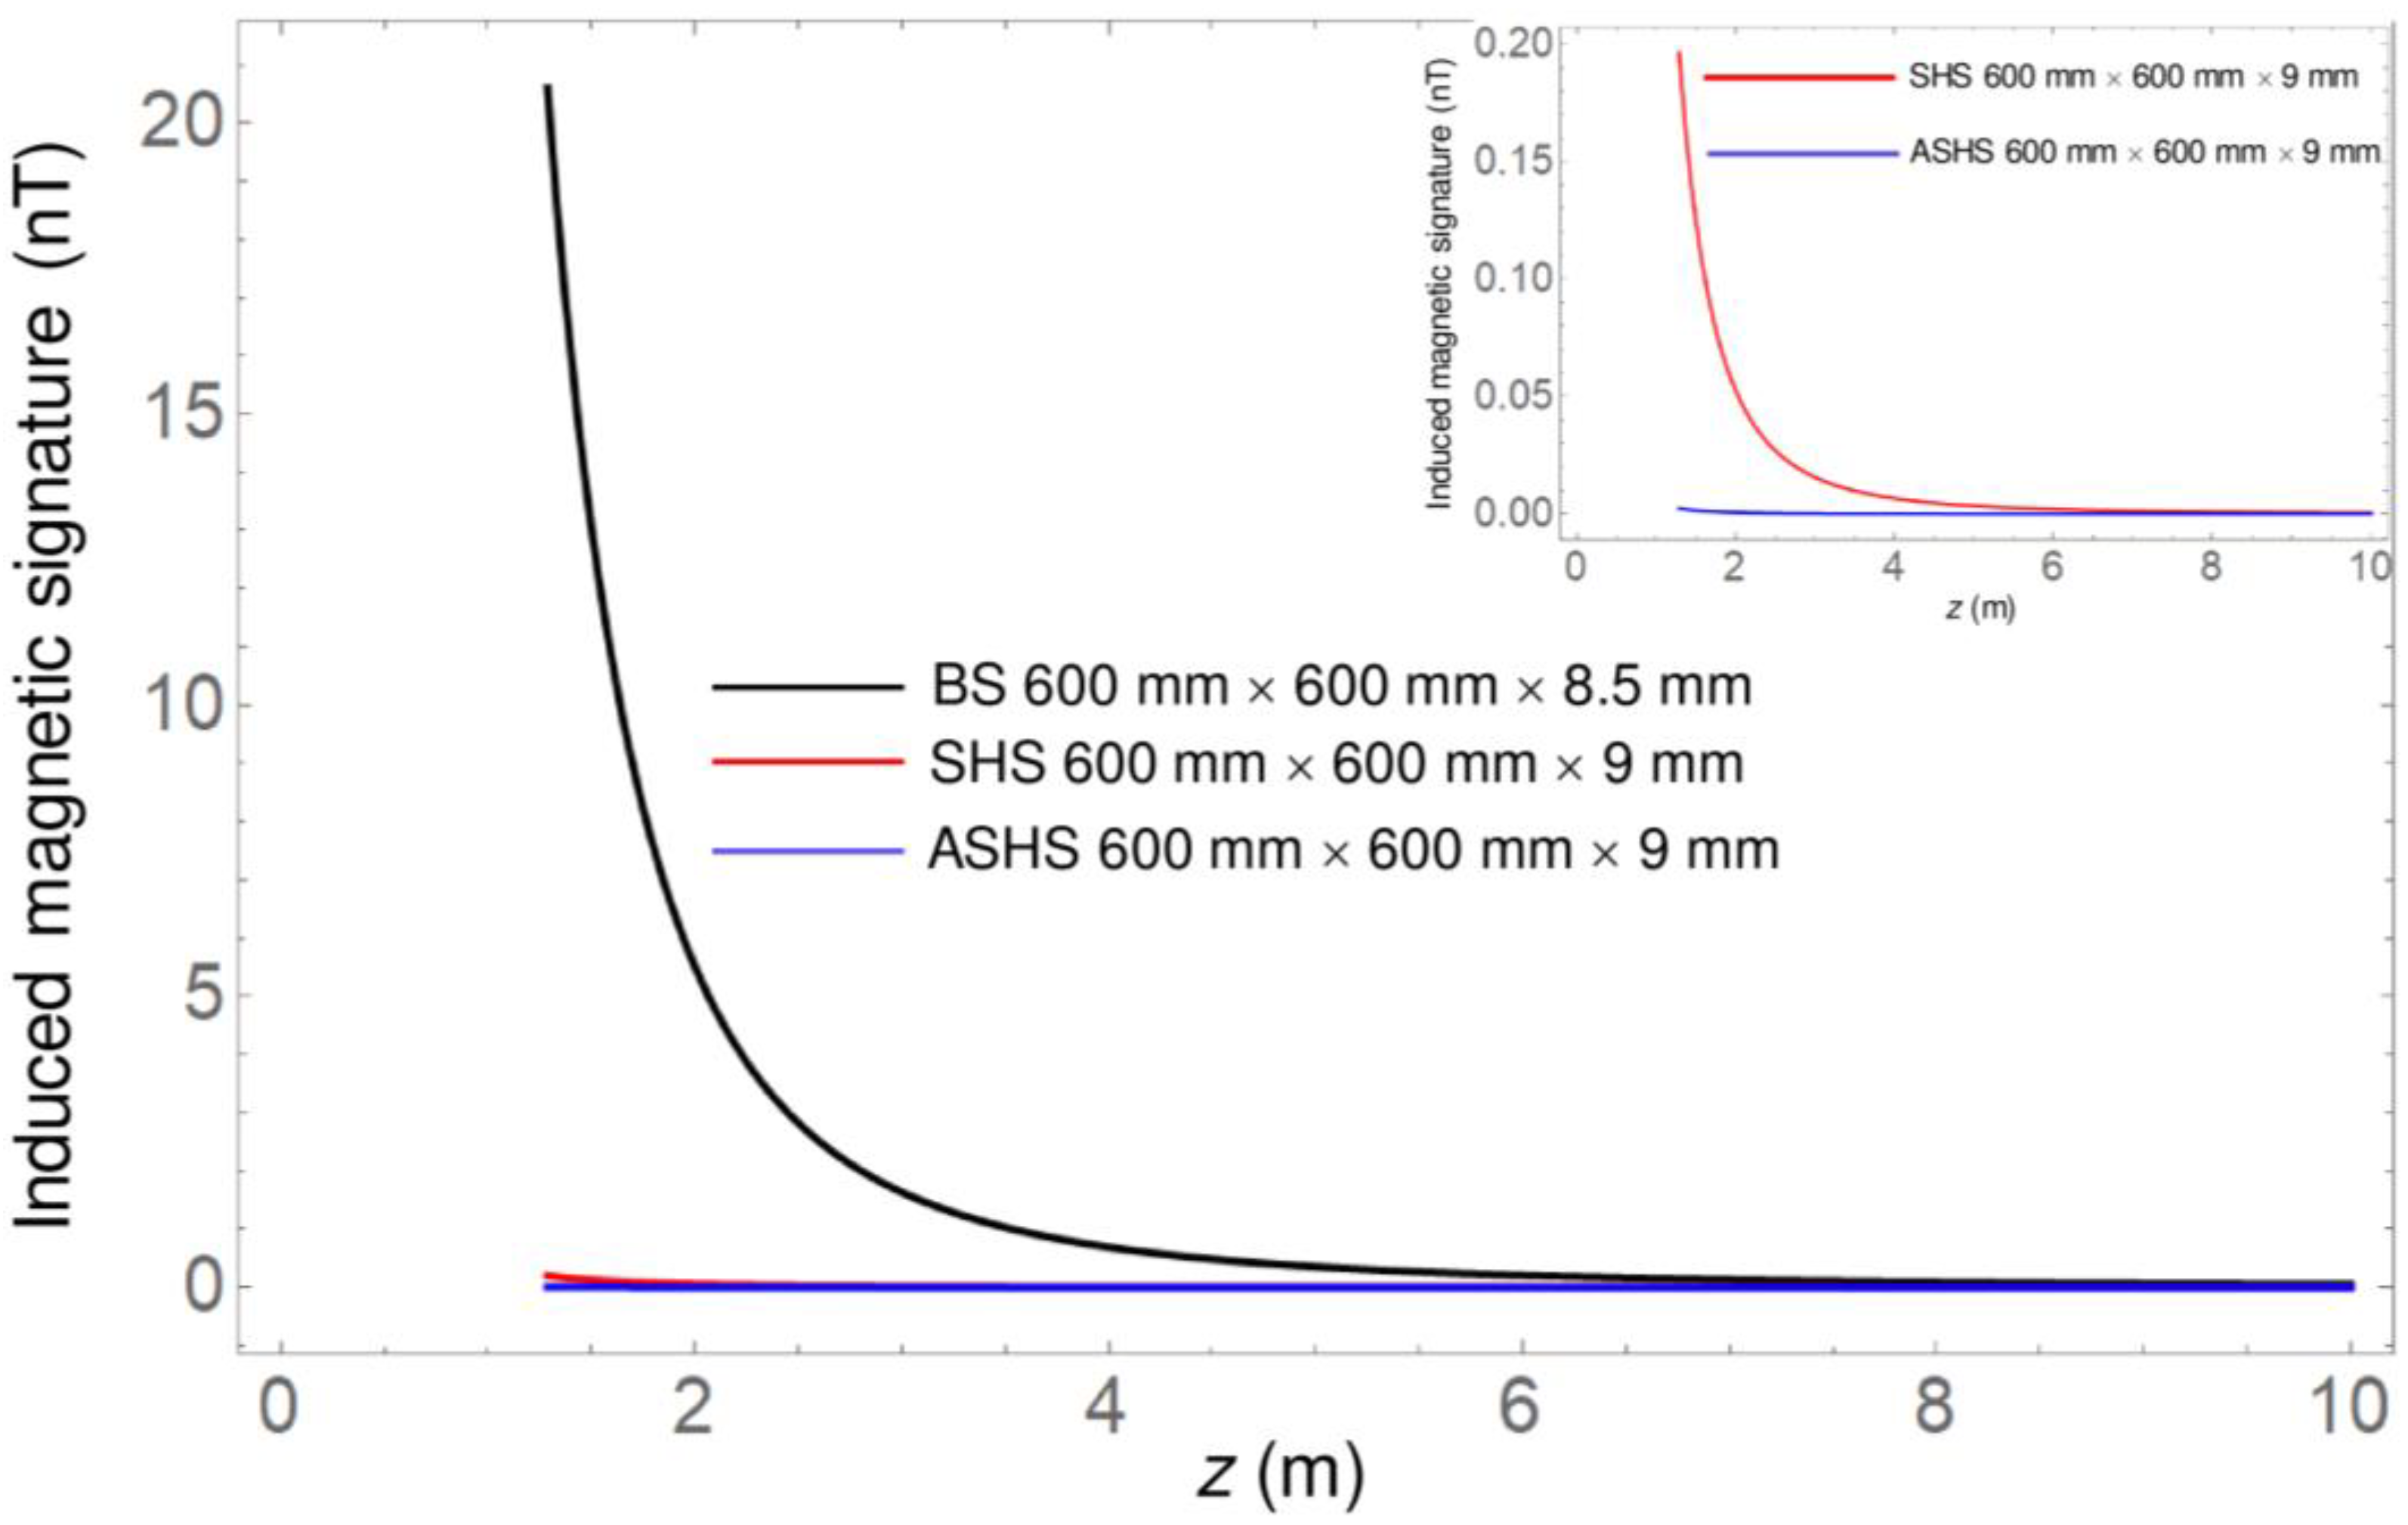
The comparison of the induced magnetic signature for the 600 mm × 600 mm × 8.5 mm BS with the corresponding 600 mm × 600 mm × 9 mm SHS and ASHS for distances
z till
z = 10 m is displayed in
Figure 8. The behaviour of the induced magnetic signature for all systems is very similar to the one shown by the 60 mm × 60 mm systems, and similar conclusions can be drawn, but it can be noticed that it is about two orders of magnitude larger at all distances. This effect is attributed to the volumes of the panels which are 10
2 times greater than the corresponding volumes of the 60 mm × 60 mm panels. In addition, there is also a different effect of the shielding term due to the different shielding factors compared to the ones in case (1).
The remarkable induced magnetic signature for small distances is more evident in
Figure 9, which shows the comparison till
z = 1 m, especially for the steel plate. Also, in this case, the induced magnetic signatures of the two honeycomb panels merge together and vanish at
z ≈ 0.5 m, and at small distances, the magnetic signature of the SHS is significant but two orders of magnitude lower than the induced magnetic signature of the BS.
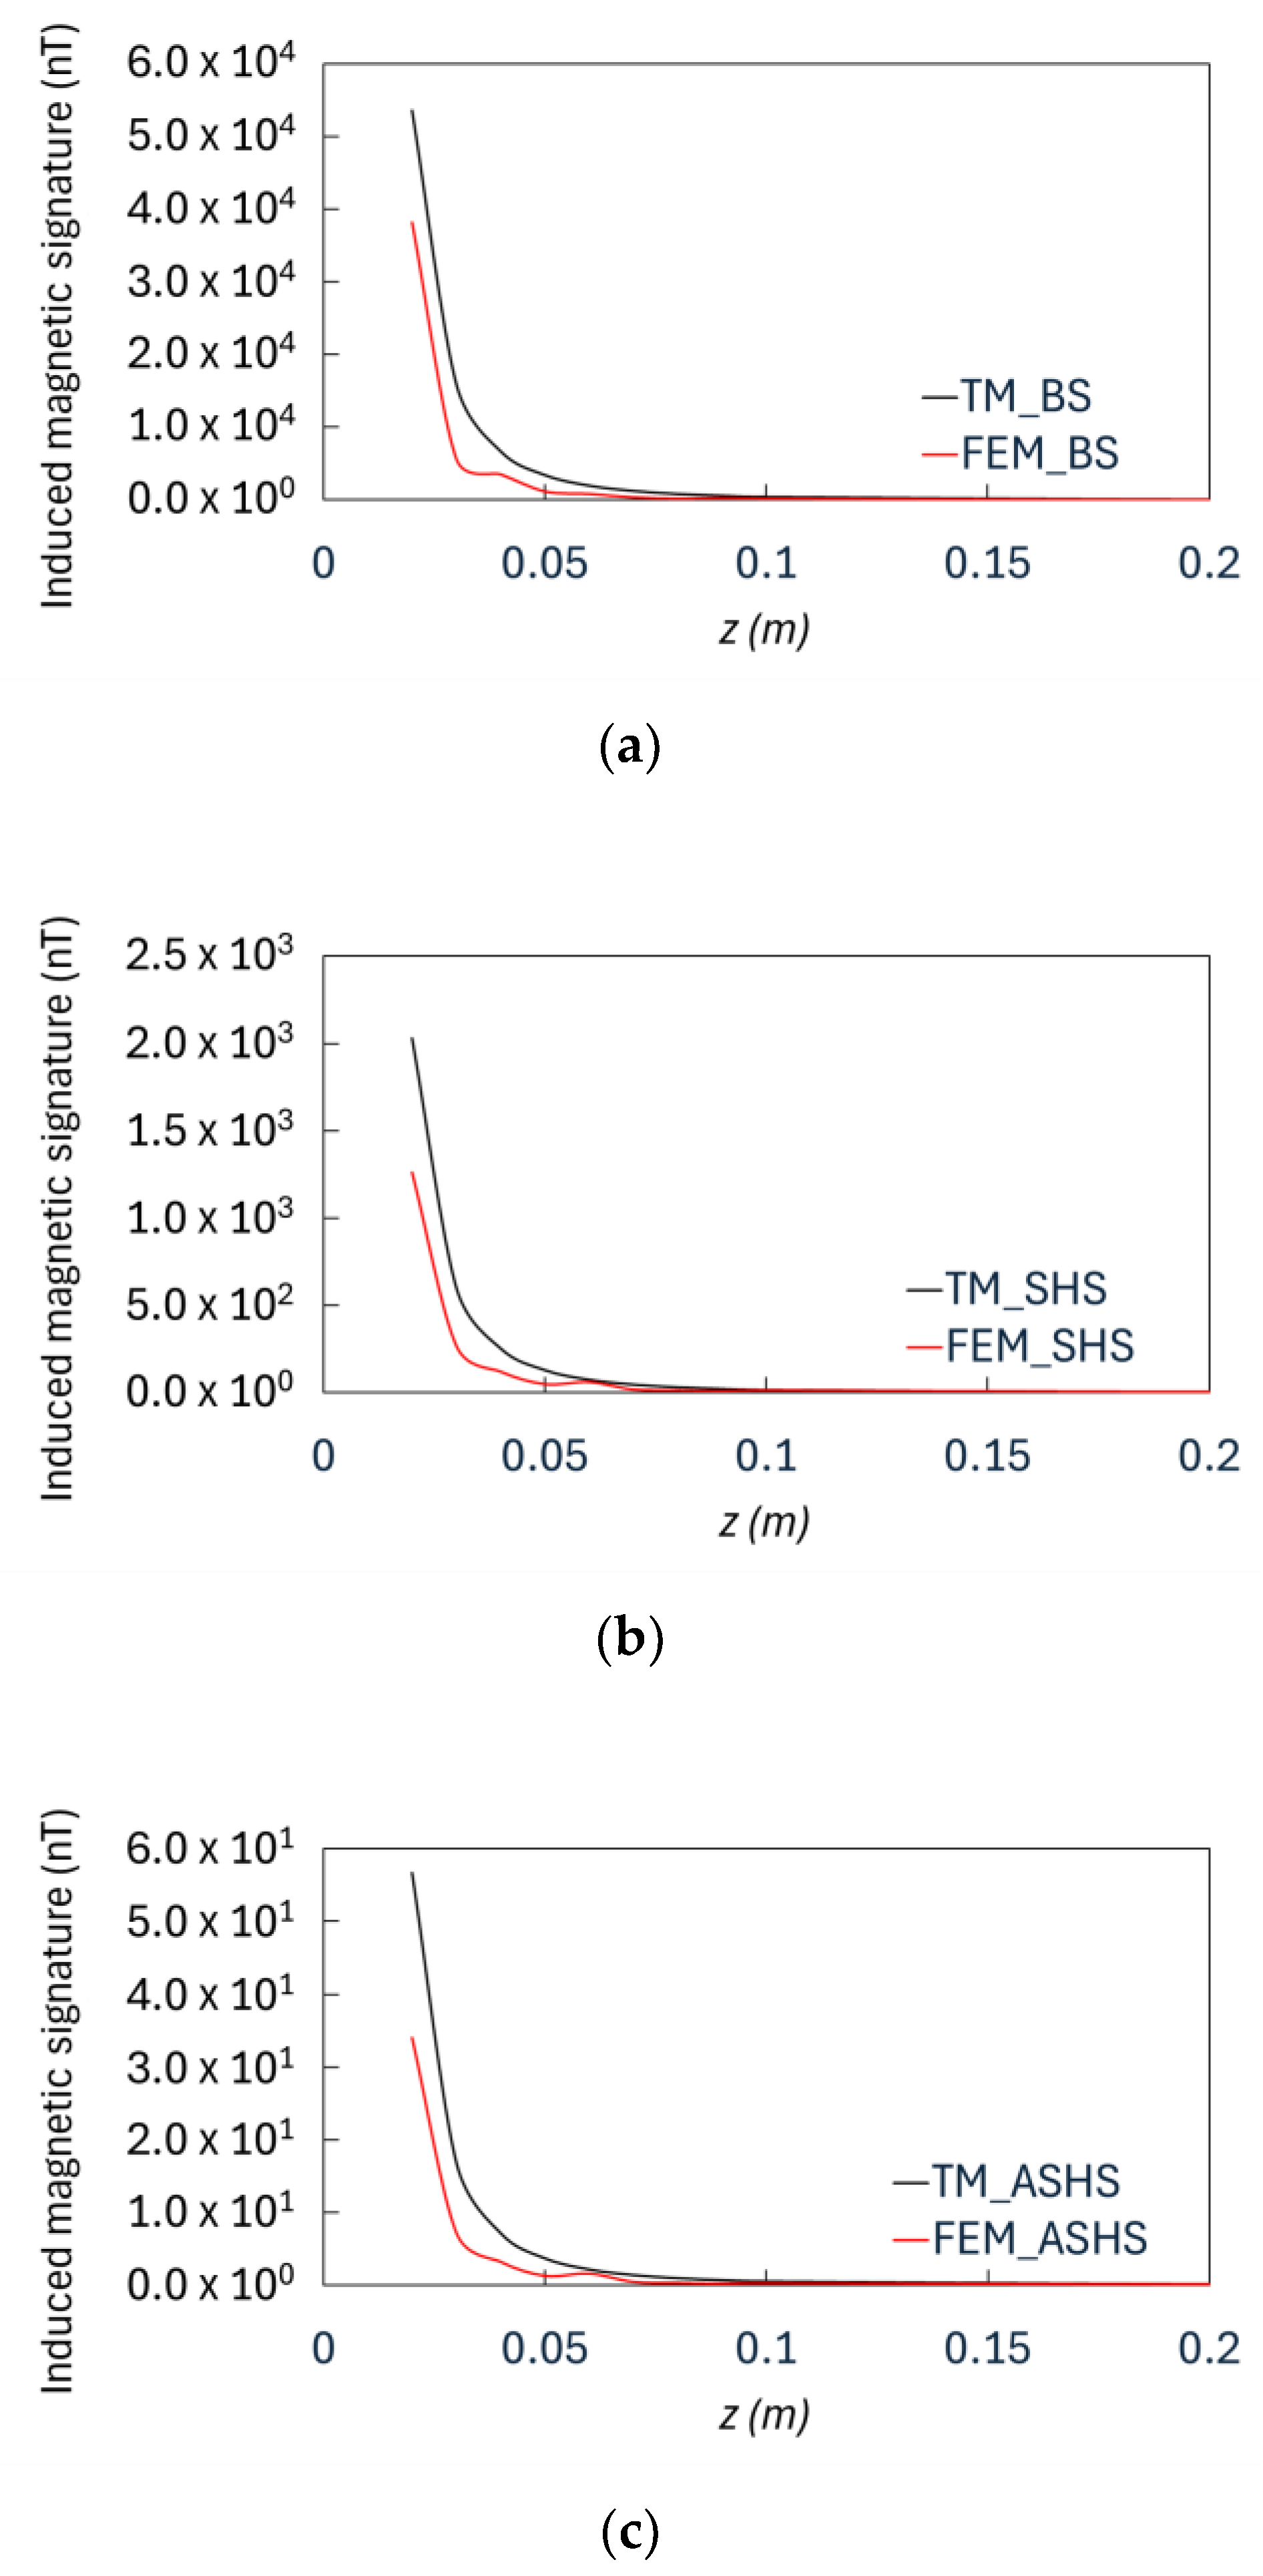
For a deeper understanding of the results, a comparison between FEM- and TM-calculated magnetic responses was performed, as shown in
Figure 10a for the BS, in
Figure 10b for the SHS, and in
Figure 10c for the ASHS.
The curves show good accuracy between the two presented models, which present the same trend for all the three considered configurations and can be represented by the following formula:
Equation (18) describes the curve behaviour of the investigated panels in the form of a power law function, and its coefficients
C and
n can be calculated as reported in
Table 4. It can be noted that the FEM simulations reproduce the inverse cubic dipolar trend of the TM rather accurately.
