Article

Numerical and Experimental Study of Packed Bed Heat Transfer on the Preheating of Manganese Ore with Air up to 600 °C

by
Sifiso Nation Sambo
1,*,
Lina Hockaday
2,
Tumisang Seodigeng
3 and
Quinn Gareth Reynolds
1,4
1
Pyrometallurgy, MINTEK, Private Bag X3015, Randburg 2125, South Africa
2
Curtin University, Bentley 6102, Australia
3
Vaal University of Technology, Vanderbijlpark 1911, South Africa
4
Stellenbosch University, Matieland 7602, South Africa
*
Author to whom correspondence should be addressed.
Metals 2025, 15(3), 269; https://doi.org/10.3390/met15030269
Submission received: 5 February 2025 / Revised: 26 February 2025 / Accepted: 27 February 2025 / Published: 28 February 2025

Abstract

:
This work studies heat transport in the fluid–solid interface of a packed bed to demonstrate the feasibility of preheating lumpy manganese ores to 600 °C with air at 750 °C. Preheated manganese ores aim to reduce furnace energy consumption during smelting in submerged arc furnaces to produce manganese ferroalloys. The preheating process was experimentally studied in a pilot-scale shaft-type column. The air was heated to 750 °C and used as a heat transfer fluid to heat a packed bed of manganese ore from room temperature to 600 °C. A one-dimensional three-phase (manganese ore, air, and the column wall) numerical model was developed to simulate the preheating process. The energy balance of the three phases was carried across a finite volume using the volume averaging technique. Numerical schemes were applied, and non-dimensional parameters were introduced before applying numerical techniques to solve the systems of linear equations. Python NumPy and SciPy modules were used for the computation of the packed bed temperature fields. Temperature data from the preheating tests were used for model validation. The model prediction of the transfer process agreed with experimental results to least square errors of less than 25 °C. Data from experimental measurements confirmed the feasibility of using air as the transfer fluid in the preheating of manganese ore. Detailed temperature field data generated from the model can be used for the sizing of manganese ore preheating units and the implementation of control protocols for the preheating process.

1. Introduction

High-temperature metallurgical unit operations require a vast understanding of heat transfer. Understanding heat transport in pyrometallurgical processes is important to ensure energy containment for ease of process control, quality assurance, and the prevention of damage to equipment and injuries to people. This process often involves handling granular materials in packing, especially during pretreatment stages and smelting. Pretreatment and smelting unit design takes advantage of the high surface area-to-volume ratio provided by packed beds [1,2].
Preheating is one of the pretreatment processes that is widely used, where energy is used to only drive off volatiles from furnace feed materials. Some pretreatment processes further reduce the amount of excess oxygen in the ore feed and are referred to as pre-reduction. Both preheating and pre-reduction aim to reduce smelting energy requirements. Some smelting operations require the pretreatment of raw materials to solve problems of particle size distribution due to furnace feed requirements [3,4]. Agglomeration and or sintering are examples of these pretreatment processes.
This work develops a numerical model of heat transfer to study interfacial heat transport in a packed bed of manganese ore, where air is used as a heat transfer fluid. The use of a thermal energy transfer fluid during the preheating of Mn ores has not been reported in the literature. However, enough efforts have been made to study the impact of preheating Mn ores before the smelting process. A 12% mass loss was reported by [5] after preheating Mn ore just above 500 °C to drive off volatiles. Preheating at temperatures above 700 °C decomposes carbonaceous species [5,6]. The green process initiative has seen growing interest in studies on the pre-reduction of Mn ores with hydrogen with the aim of reducing smelting energy requirements and CO2 emissions [7,8].
Heat transfer in packed beds comes with problems of fluid flow, pressure drop, and transport characteristics of flow. The authors of [9,10,11] studied the effect of the confining wall on the transport characteristics. Heat transport equations are generally solved by integrating over elementary volumes, which are representative of the fluid and solid phases within a packed bed. However, energy transfer results from complex microscopic transport phenomena at the pore level [12].
The microscopic process interactions can be represented by integrated quantities and appropriate constitutive equations to provide an effective basis for the analysis of transport phenomena across packed beds [2,13]. This method is referred to as the volume averaging technique and is widely used [13,14] to study transport processes in packed beds. The resulting models are often accurate and valid, with simple assumptions such as homogeneity, axisymmetric property distribution, and simplifications from the use of effective transport parameters. For systems where pore-level transport information is critical, a multiscale approach can be taken to obtain transport parameters such as permeability and the Forchheimer coefficient [14,15].
Structural packing arrangement is the defining component of the fluid–solid transfer medium and significantly affects both local pore-level microscopic and macroscopic characteristics of flow [16]. As a result, the packed bed fluid flow characteristics such as the void fraction, particle size and shape, and the packed bed aspect ratio are the defining factors in the transfer process, rather than the thermo-physical properties of the bed.
This work develops a three-phase (air, Mn ore, and the wall) numerical model to study heat transport in a packed bed where air is used as the heat transfer fluid. The interaction between the three phases is facilitated by a source term from the transfer fluid phase and a sink term from the solid phase of the packed bed and the wall. The model is validated with data from experimentally measured temperature fields from the three phases. This extends the scope of numerical models from the widely studied regular packed beds of spherical particles to randomly packed beds of lumpy mineral ore particles.
The feasibility of preheating manganese resources with air is studied and its success will allow the introduction of concentrated solar power energy (CSP) in mineral processing. Preheating Mn ore to 600 °C before smelting can reduce furnace energy requirements by 20% [17]. Progress made in particle receiver technology suggests that it is possible to use air as a heat transfer fluid for high-temperature (>800 °C) systems [18,19].

2. Materials and Methods

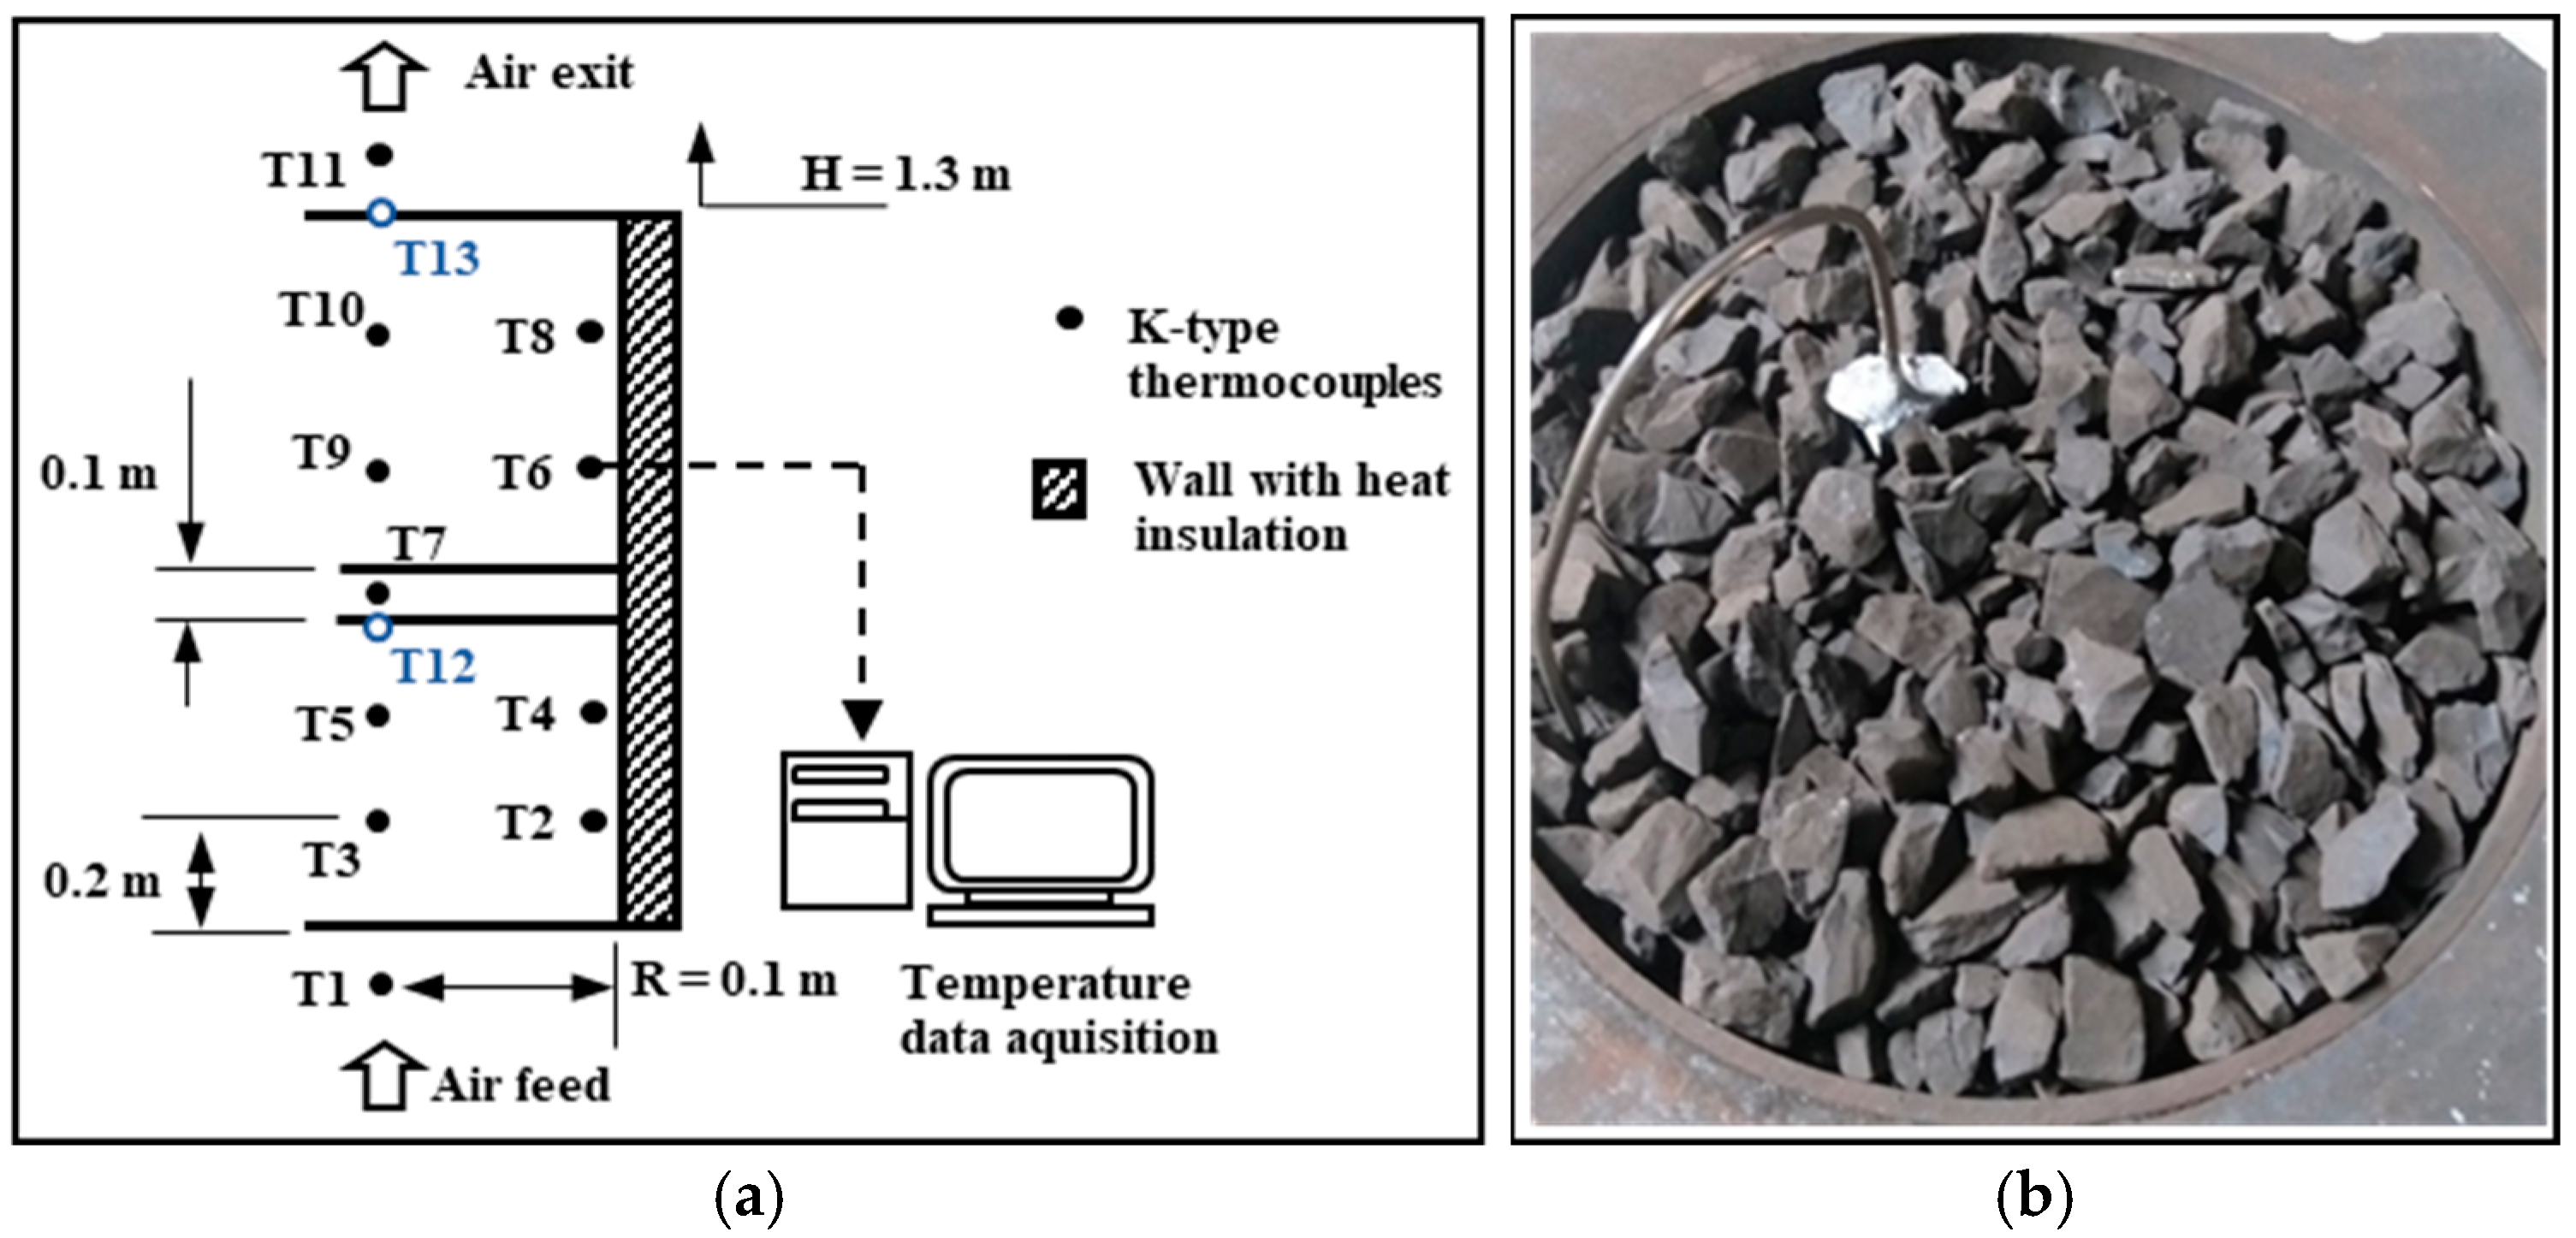
2.1. Experimental Set-Up

A cylindrical column with a height of 1300 mm and a diameter of 207 mm was used for the preheating tests. Mn ore of +6–20 mm was randomly packed in the column. The column was equipped with K-type thermocouples that were arranged as depicted in Figure 1a. Temperature measurements were taken at the centre of the bed and towards the wall at 200 mm equidistant in the axial direction. The fluid feed and exit temperature were measured by T1 and T11, respectively. T7 was placed at an empty segment between the lower and upper sections of the column. T12 and T13 were measured at the core of a 20 mm diameter Mn ore particle to keep track of intra-particle temperatures at the upper points of the two segments, as shown in Figure 1b. Temperature data were monitored and recorded through a DeltaV system.
A 30 kW air heater was used to produce feed air up to 750 °C at 2.5 bar. Fluid flow was varied from 1000 to 1600 Nl/min across 4 tests. The encompassing wall was made up of 4.5 mm thick mild steel with 6 mm ceramic fibre paper insulation on the inside. The outside of the shell was insulated with two layers of 50 mm and 1260 °C rated fibre blankets. A 3 mm stainless steel sheet covered the outer surface of the column.

2.2. One-Dimensional Three-Phase Model

A one-dimensional three-phase model was considered by introducing the solid phase, fluid phase, and the encompassing wall energy equations. The one-dimensional model assumes negligible internal thermal gradients in the solids   ( B i 0.1 ) . The solid phase is considered a homogeneous porous medium. A plug flow is assumed in the fluid phase, and radial temperature gradients are neglected. The three phase’s energy equations are linked by a convective term, owing to negligible diffusion compared to convection. The fluid, solid, and wall phase energy equations are given by Equations (1)–(3) respectively.
ε ρ c p f T f t + ε ρ c p f   u T f x x λ e f f , f T f x = h s f A s T s T f + h w , i n t A w , i n t T w T f
1 ε ρ c p s T s t = x λ e f f , s T s x + h s f A s T f T s
ρ c p w T w t = x λ w T w x + h w , i n t A w , i n t T f T w + h w , e x t A w , e x t T T w
The energy equations were discretized into control volumes ( N ) in the spatial direction ( x ) by applying the explicit forward difference scheme in time and the upwind difference scheme in space. The numerical discretization Fourier ( F O , N ) , Stranton   ( S t N ) , and the restrictive Courent–Frendrich–Lewy ( C o ) numbers were introduced to form non-dimensional linear equations. The Crank Nicholson scheme was applied to the linear equations to explicitly define the phase’s field temperatures as functions of neighbouring node temperatures.
The equations were re-arranged to the linear metrics form   ( A x = b ) . The field temperatures were computed from the updated co-efficient by applying the Gauss–Seidel iterative method. The final form of the linear equation for the fluid, solid, and wall phases is given by Equations (4)–(6), respectively. The Neumann boundary condition was applied at both ends of the packed bed. The NumPy library [20] of the Python programming language was used for the computation of the temperature field. Fluid feed temperature values from experiments were used to simulate the transfer process for ease of validation.
T f , n 1 i + 1 F O , N , f C o ε 2 ε + T f , n i + 1 1 + C o 2 F O , N , f   ε + S t N , f s   C o   2 ε + S t N , f w   C o   2 ε + T f , n + 1 i + 1   F O , N , f   2 ε =   T f , n 1 i C o ε F O , N , f 2 ε + T f , n + 1 i F O , N , f   2 ε + T s , n i   S t N , f s   C o   ε + T w , n i S t N , f w   C o   ε + T f , n i 1 C o 2 + F O , N , f   ε S t N , f s   C o   2 ε S t N , f w   C o   2 ε  
T s , n 1 i + 1 F O , N , s 2 1 ε + T s , n i + 1 1 + F O , N , s 1 ε + S t N , f s   C o   2 1 ε + T s , n + 1 i + 1 F O , N , s 2 1 ε = T s , n i 1 F O , N , s 1 ε S t N , f s   C o   2 1 ε + T s , n + 1 i F O , N , s 2 1 ε + T s , n 1 i F O , N , s 2 1 ε + T f , n i S t N , f s   C o   1 ε
T w , n 1 i + 1 F O , N , w 2 + T w , n i + 1 1 + F O , N , w + S t N , f w , i n t C o i n t   2 + S t N , f w , e x t C o e x t   2 + T w , n + 1 i + 1 F O , N , w 2 = T w , n 1 i F O , N , w 2 + T w , n + 1 i F O , N , w 2 + T w , n i 1 F O , N , w S t N , f w , i n t C o i n t   2 S t N , f w , e x t C o e x t   2 + T f , n i S t N , f w , i n t C o i n t + T , n i ( S t N , f w , e x t C o e x t )

2.3. Packed Bed Characterization and Materials Transport Properties

A 1200 mm height (L) and 207 mm diameter (D) packed bed of Mn ore was considered. The bed was randomly packed with lumpy Mn ore with +6–20 mm diameter   ( d p ) . The mean particle diameter ( d p ) was evaluated using a method described in [21] and was found to be 11.14 mm. The bed porosity was considered uniform across the radial and axial directions ( D / d p = 18.6 ) , as suggested in [22]. The bed void fraction was evaluated using a fluid displacement method and found to be 0.48.
Mn ore heat capacity ( C p s ) and thermal diffusivity ( α s ) were evaluated using a laser flash method. An LFA-457 Micro-flash was used, and properties were evaluated at 100 °C increments, from 100 to 800 °C. Thermal conductivity ( λ s ) was calculated using Equation (7). Thermal expansion of the Mn Ore up to 600°C is below 1% as reported in [23]. Therefore, a constant density ( ρ s = 3560   k g / m 3 ) was used. Air temperature dependent thermal conductivity ( λ f ) , density ( ρ f ) , heat capacity ( C p f ) , and viscosity ( μ f ) were adopted from the literature [24,25]. Transport properties of the wall were taken as the weighted average of the constituent materials. The thermal conductivity ( λ w ) , and heat capacity ( C p w ) of the wall were considered as weighted average values of the wall’s constituent materials at different temperatures. However, the wall density ( ρ w ) was constant at 731   k g / m 3 .
λ s   T = α s T C p s T ρ s
The solids phase and the wall transport properties were translated into sixth-order polynomial functions of temperature. Values of C p s and λ s were evaluated at temperatures with 0.9978 and 0.9988   R 2 values, respectively. Values of C p w and λ w were evaluated at temperatures with 0.9976 and 0.9978   R 2 values, respectively; see Table 1. Values of λ f ,   C p f ,   μ f , and ρ f were computed using the equations presented in Table 2.

2.4. Heat Transfer Coefficients

The Gunn correlation for the fluid–solid heat transfer coefficient ( h s f ) developed for rock-type packing is employed in this work. The correlation is applicable in packed beds of 0.35 < ε < 1 and particle Reynolds numbers up to 10 5 [25]. The fluid–solid heat transfer coefficient was calculated by computing the Nusselt number ( N u , p ) as a function of the particle’s Reynolds number ( R e p ) and the Prandtl number ( P r ) . The correlation for N u , p and h s f   was calculated from Equations (8) and (9), respectively
N u , p = 7 10 ε + 5 ε 2 1 + 0.7 R e p 0.2 P r 1 3 + 1.33 2.4 ε + 1.2 ε 2 R e p 0.7 P r 1 3
N u , p = h s f d p , e q λ s
The internal fluid–wall heat transfer coefficient ( h w f ) was evaluated using an empirical correlation developed for packed beds of rocks [24] given by Equation (10). The external wall heat transfer coefficient was computed from a widely used [24,25] empirical correlation for vertical walls with ambient air cooling. All the coefficients were updated as functions of temperature in all time steps during the computation of the transfer process.
h w f = λ f d p 1 1.5 D d p 1.5 + p r 1 3   R e , 0 0.59

2.5. Consideration of Radiative Heat Transfer

Convection is the dominant mode of heat transfer. However, radiation becomes relevant at temperatures above 200 °C [26] and an effective thermal conductivity ( λ e f f ) that sums up all the contributing heat diffusion processes must be considered. An effective radiation term ( λ e f f R ) was computed using the Sih and Barlow (1995) correlation for packed beds of rock [26]. The base surface of unit cells was considered to be black bodies and a representative emissivity for rocky materials ( ϵ s = 0.85 ) was used [27]. The solid phase contact point’s effective thermal conductivity ( λ e f f C ) was computed from Equation (11) [28]. The effective thermal conductivity combines λ e f f R and λ e f f C through a factor ( f = 0.01 ) as presented by Equation (12). A method for the evaluation of f is discussed in [26].
λ e f f C = ε λ f   + 1 ε λ s 1
λ e f f , s = ( 1 ε ) λ s + f λ s + λ e f f R + λ e f f C

2.6. Heat Transfer Efficiency

The net energy input to the testing column was calculated using Equation (13). Energy transferred to the packed section was calculated using Equation (14). The energy absorbed by the mass of the encompassing wall was calculated using Equation (15). The difference between the net energy input and the transferred energy and the energy absorbed by the wall was used to quantify the energy lost to the environment through the wall exterior. The transfer efficiency of the packed column was quantified using Equation (16). The calculated preheating process efficiency was not inclusive of the transfer fluid pumping energy requirements.
E N e t I n p u t t = E I n p u t t E O u t f l o w t :   t = t 0 t m t ˙ ρ f , t T f ,   1 t T r e f t = t 0 t m t ˙ ρ f , t T f ,   N + 1 t T r e f
E t r a n s f e r e d t = t = t 0 t n = 1 N A s   z [ ρ s , t   C p s , t   1 ε T s ,   n t T r e f + ρ f , t   C p f , t   ε T f ,   n t T r e f   ] n = 1 N A s z [ ρ s , t 0   C p s ,   t 0   1 ε T s ,   n t 0 T r e f + ρ f , t 0   C p f , t 0   ε T f ,   n t 0 T r e f   ]
E w a l l = t = t 0 t n = 1 N A w z ρ w C p w T w , n t T r e f
η t r a n s f e r = E t r a n s f e r e d t E N e t I n p u t t × 100

3. Results

3.1. Experimental Results

Recorded data from experiments showing the progress of the preheating tests from the lowest and highest flow rates (1000 Nl/min and 1600 Nl/min) is presented in Figure 2. The preheating temperature of 600 °C was achieved across the whole packed bed after 200 minutes and 150 min for tests run with 1000 Nl/min and 1600 Nl/min, respectively. Radial temperature gradients of up to 120 °C were recorded from experimental tests. However, this is a result of poor fluid distribution from the feed cone rather than porosity distribution. This is further confirmed by the higher temperatures in the middle of the packed bed, rather than at the periphery, as would be a result of fluid channelling. A comparison of particle core temperature and the fluid temperature from the same axial points (T7 and T12, and T11 and T13) is presented in Figure 3. The core particle temperatures lack the air temperature with about 10 °C during the dynamic transfer stage and catch up as the transfer approaches equilibrium.
A least square error of repeat tests conducted at 1200 Nl/min was calculated at each temperature point of the column to assess the reproducibility of the results. The reproducibility of the experimental results is presented in Figure 4. The feed air temperature was consistent for four repeats of each set of tests. The variation in temperature measured increased over the column height. This is due to increased variation in the fluid flow paths because the bed was randomly packed. The overall temperature variation on the repeated tests was less than 15 °C. This confirmed that the methods used for the experimental design were suitable for the experiments. The reproducibility of the results with low-temperature variations suggests that the preheating of Mn ore with air to 600 °C before smelting is feasible.

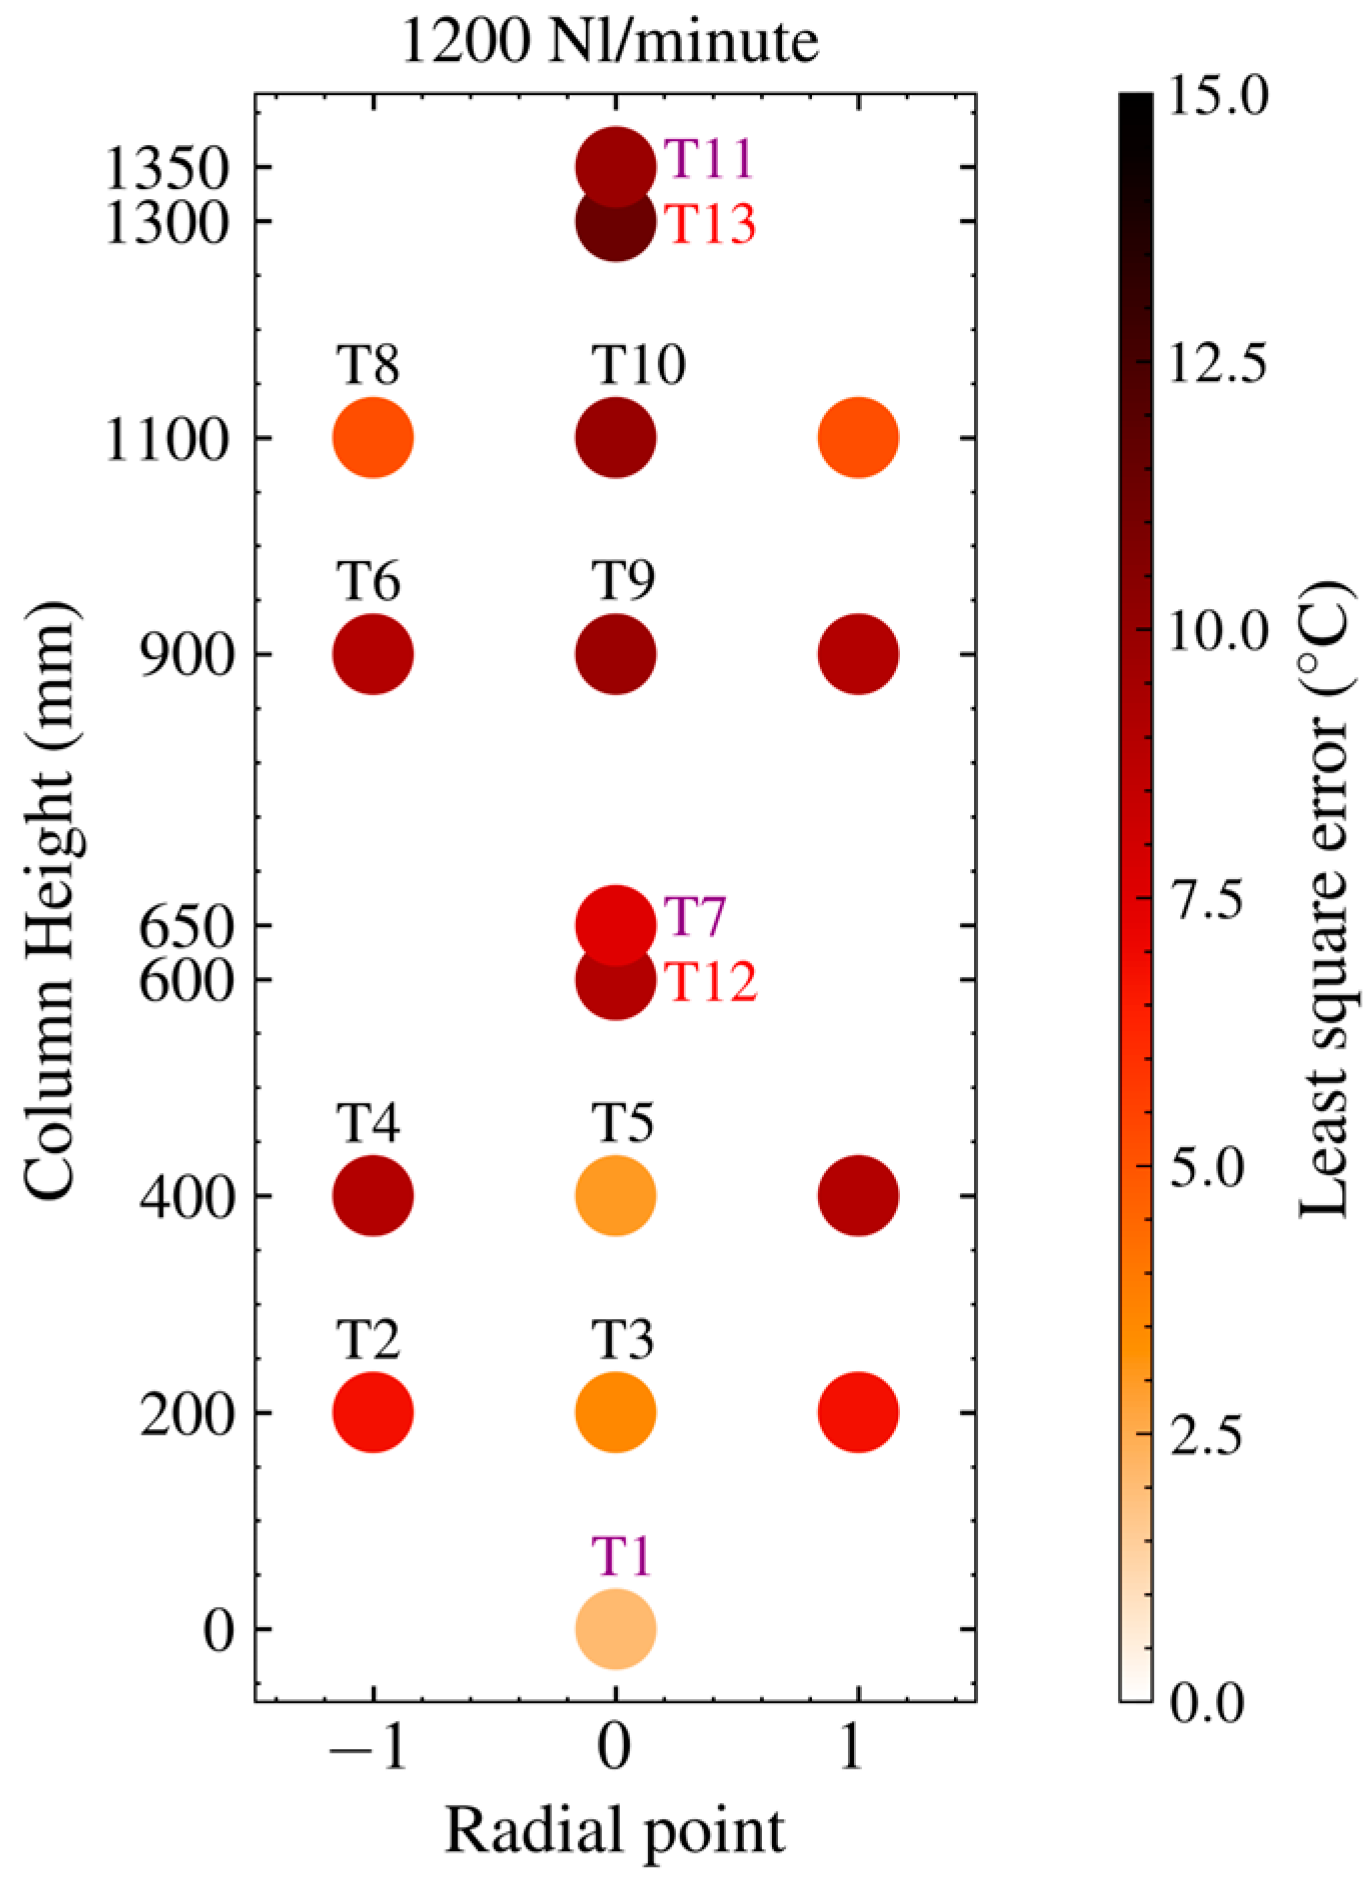
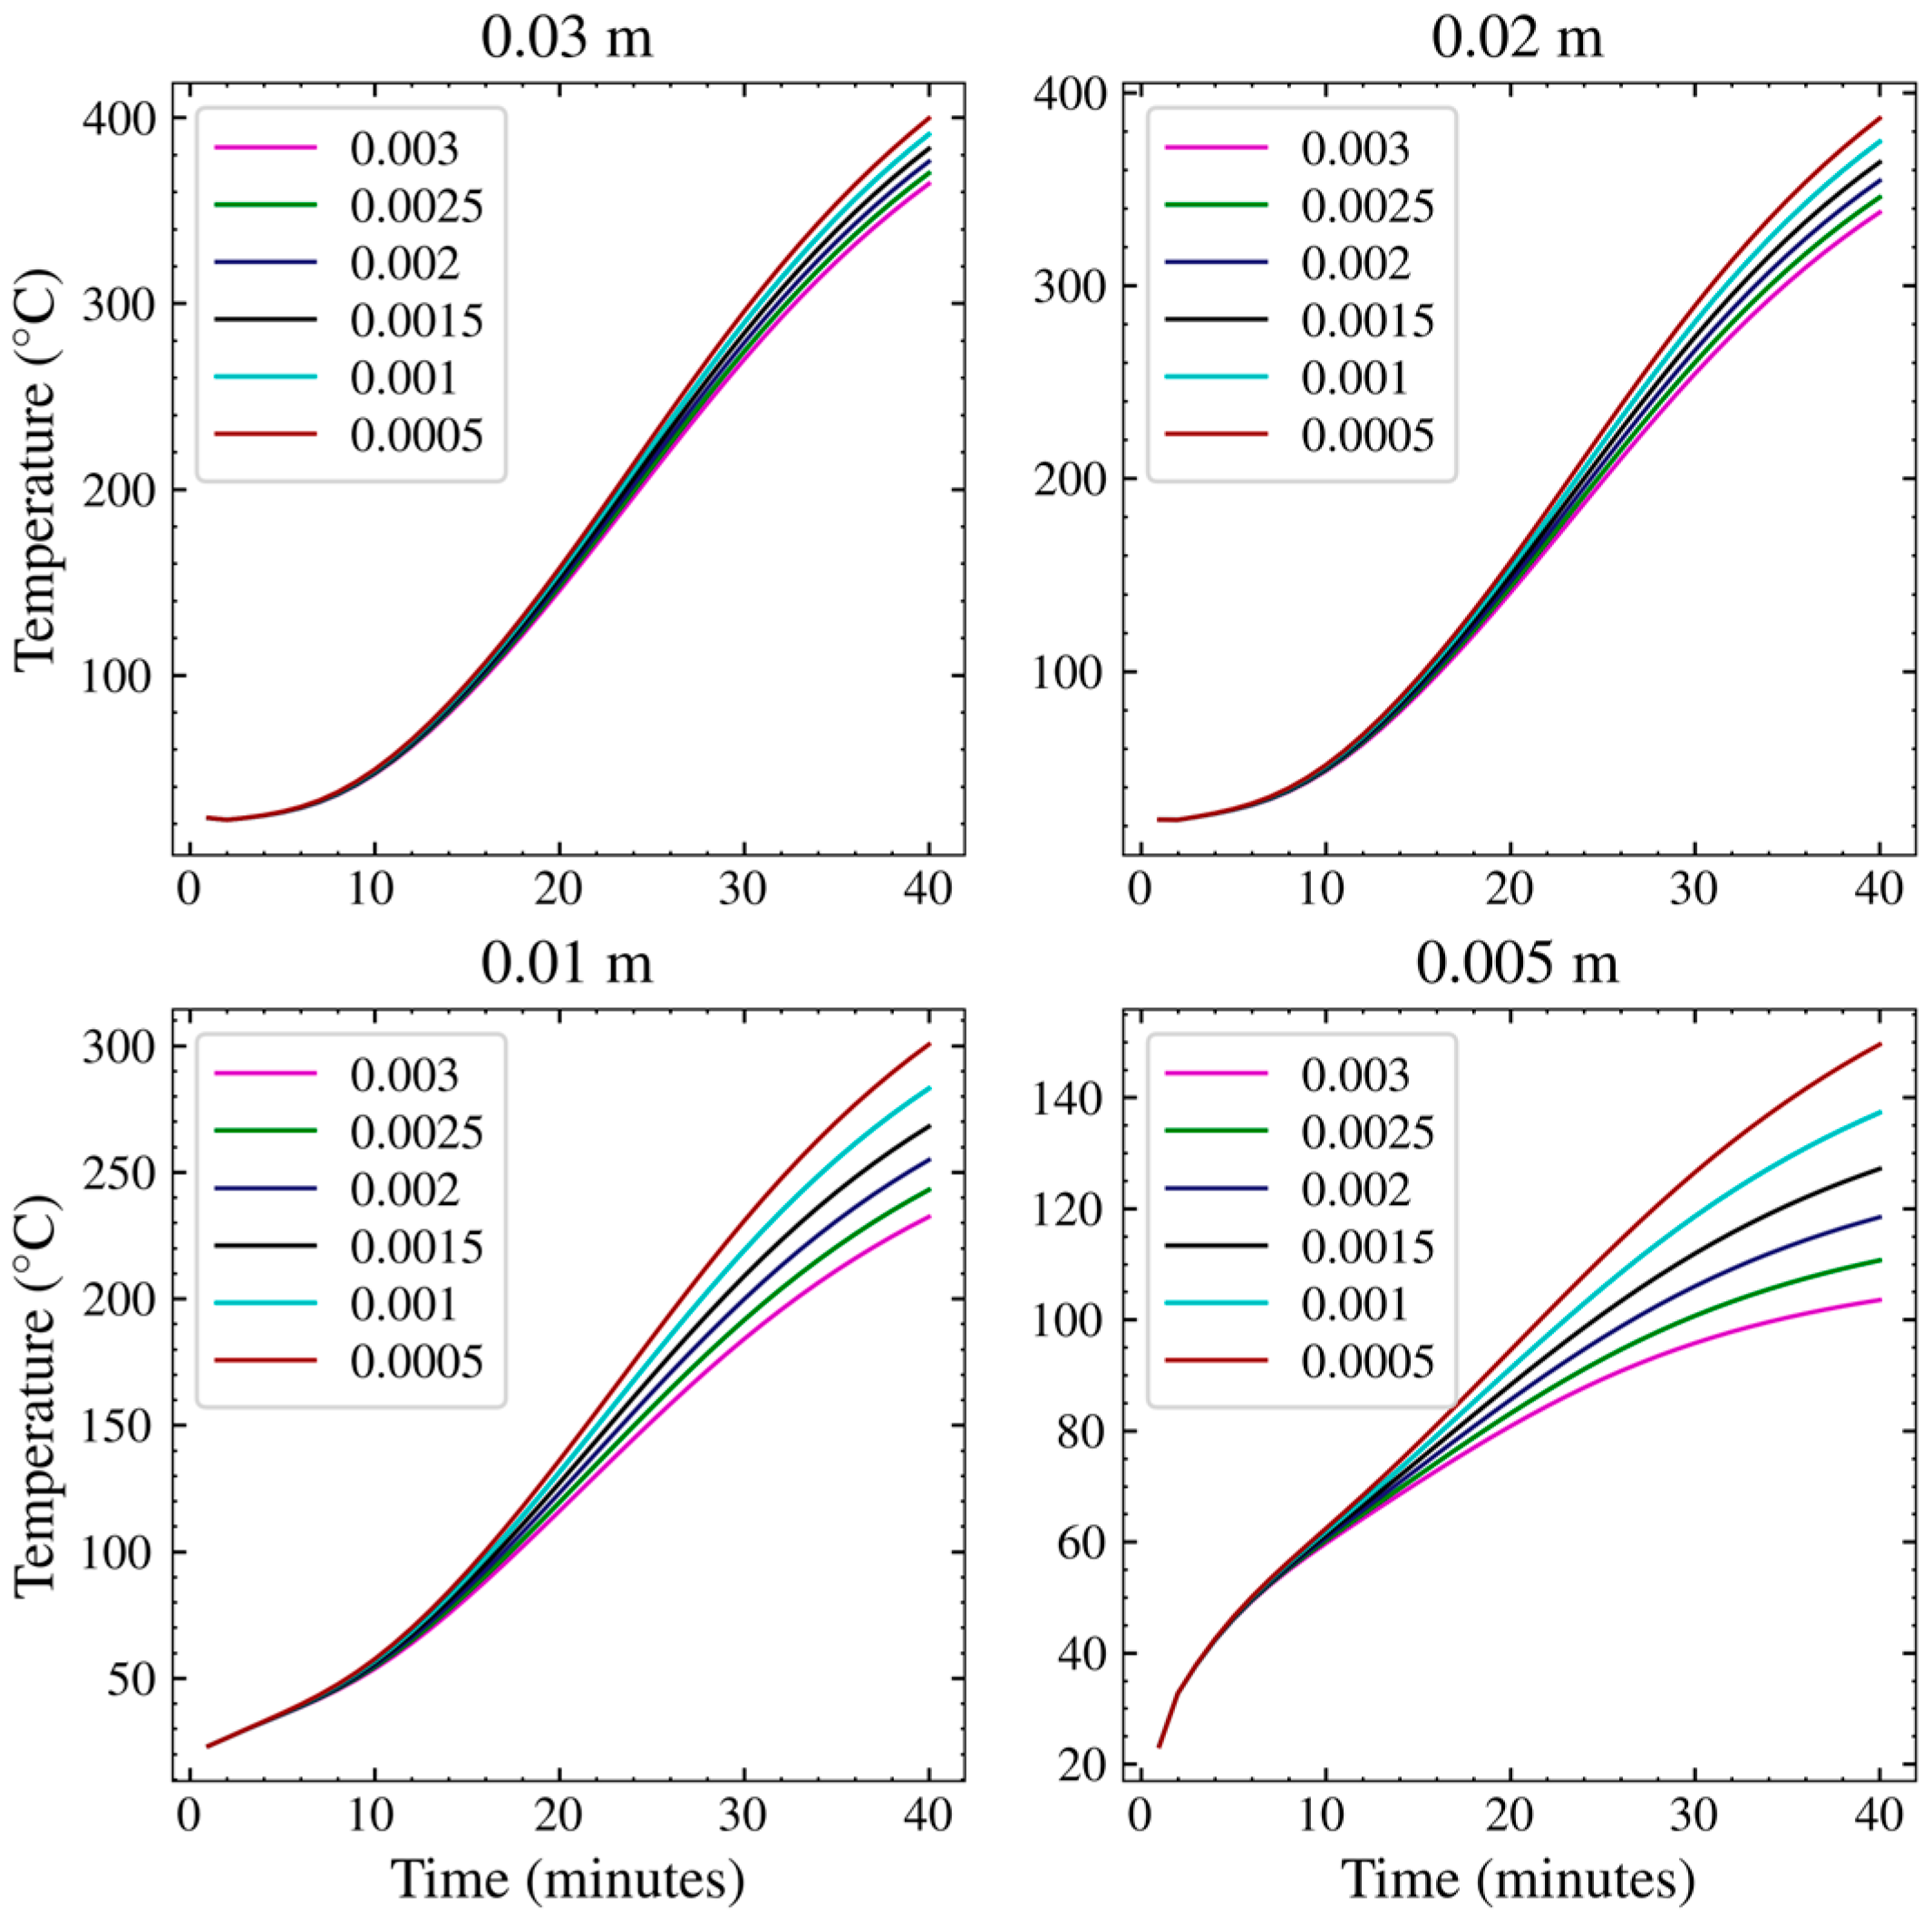
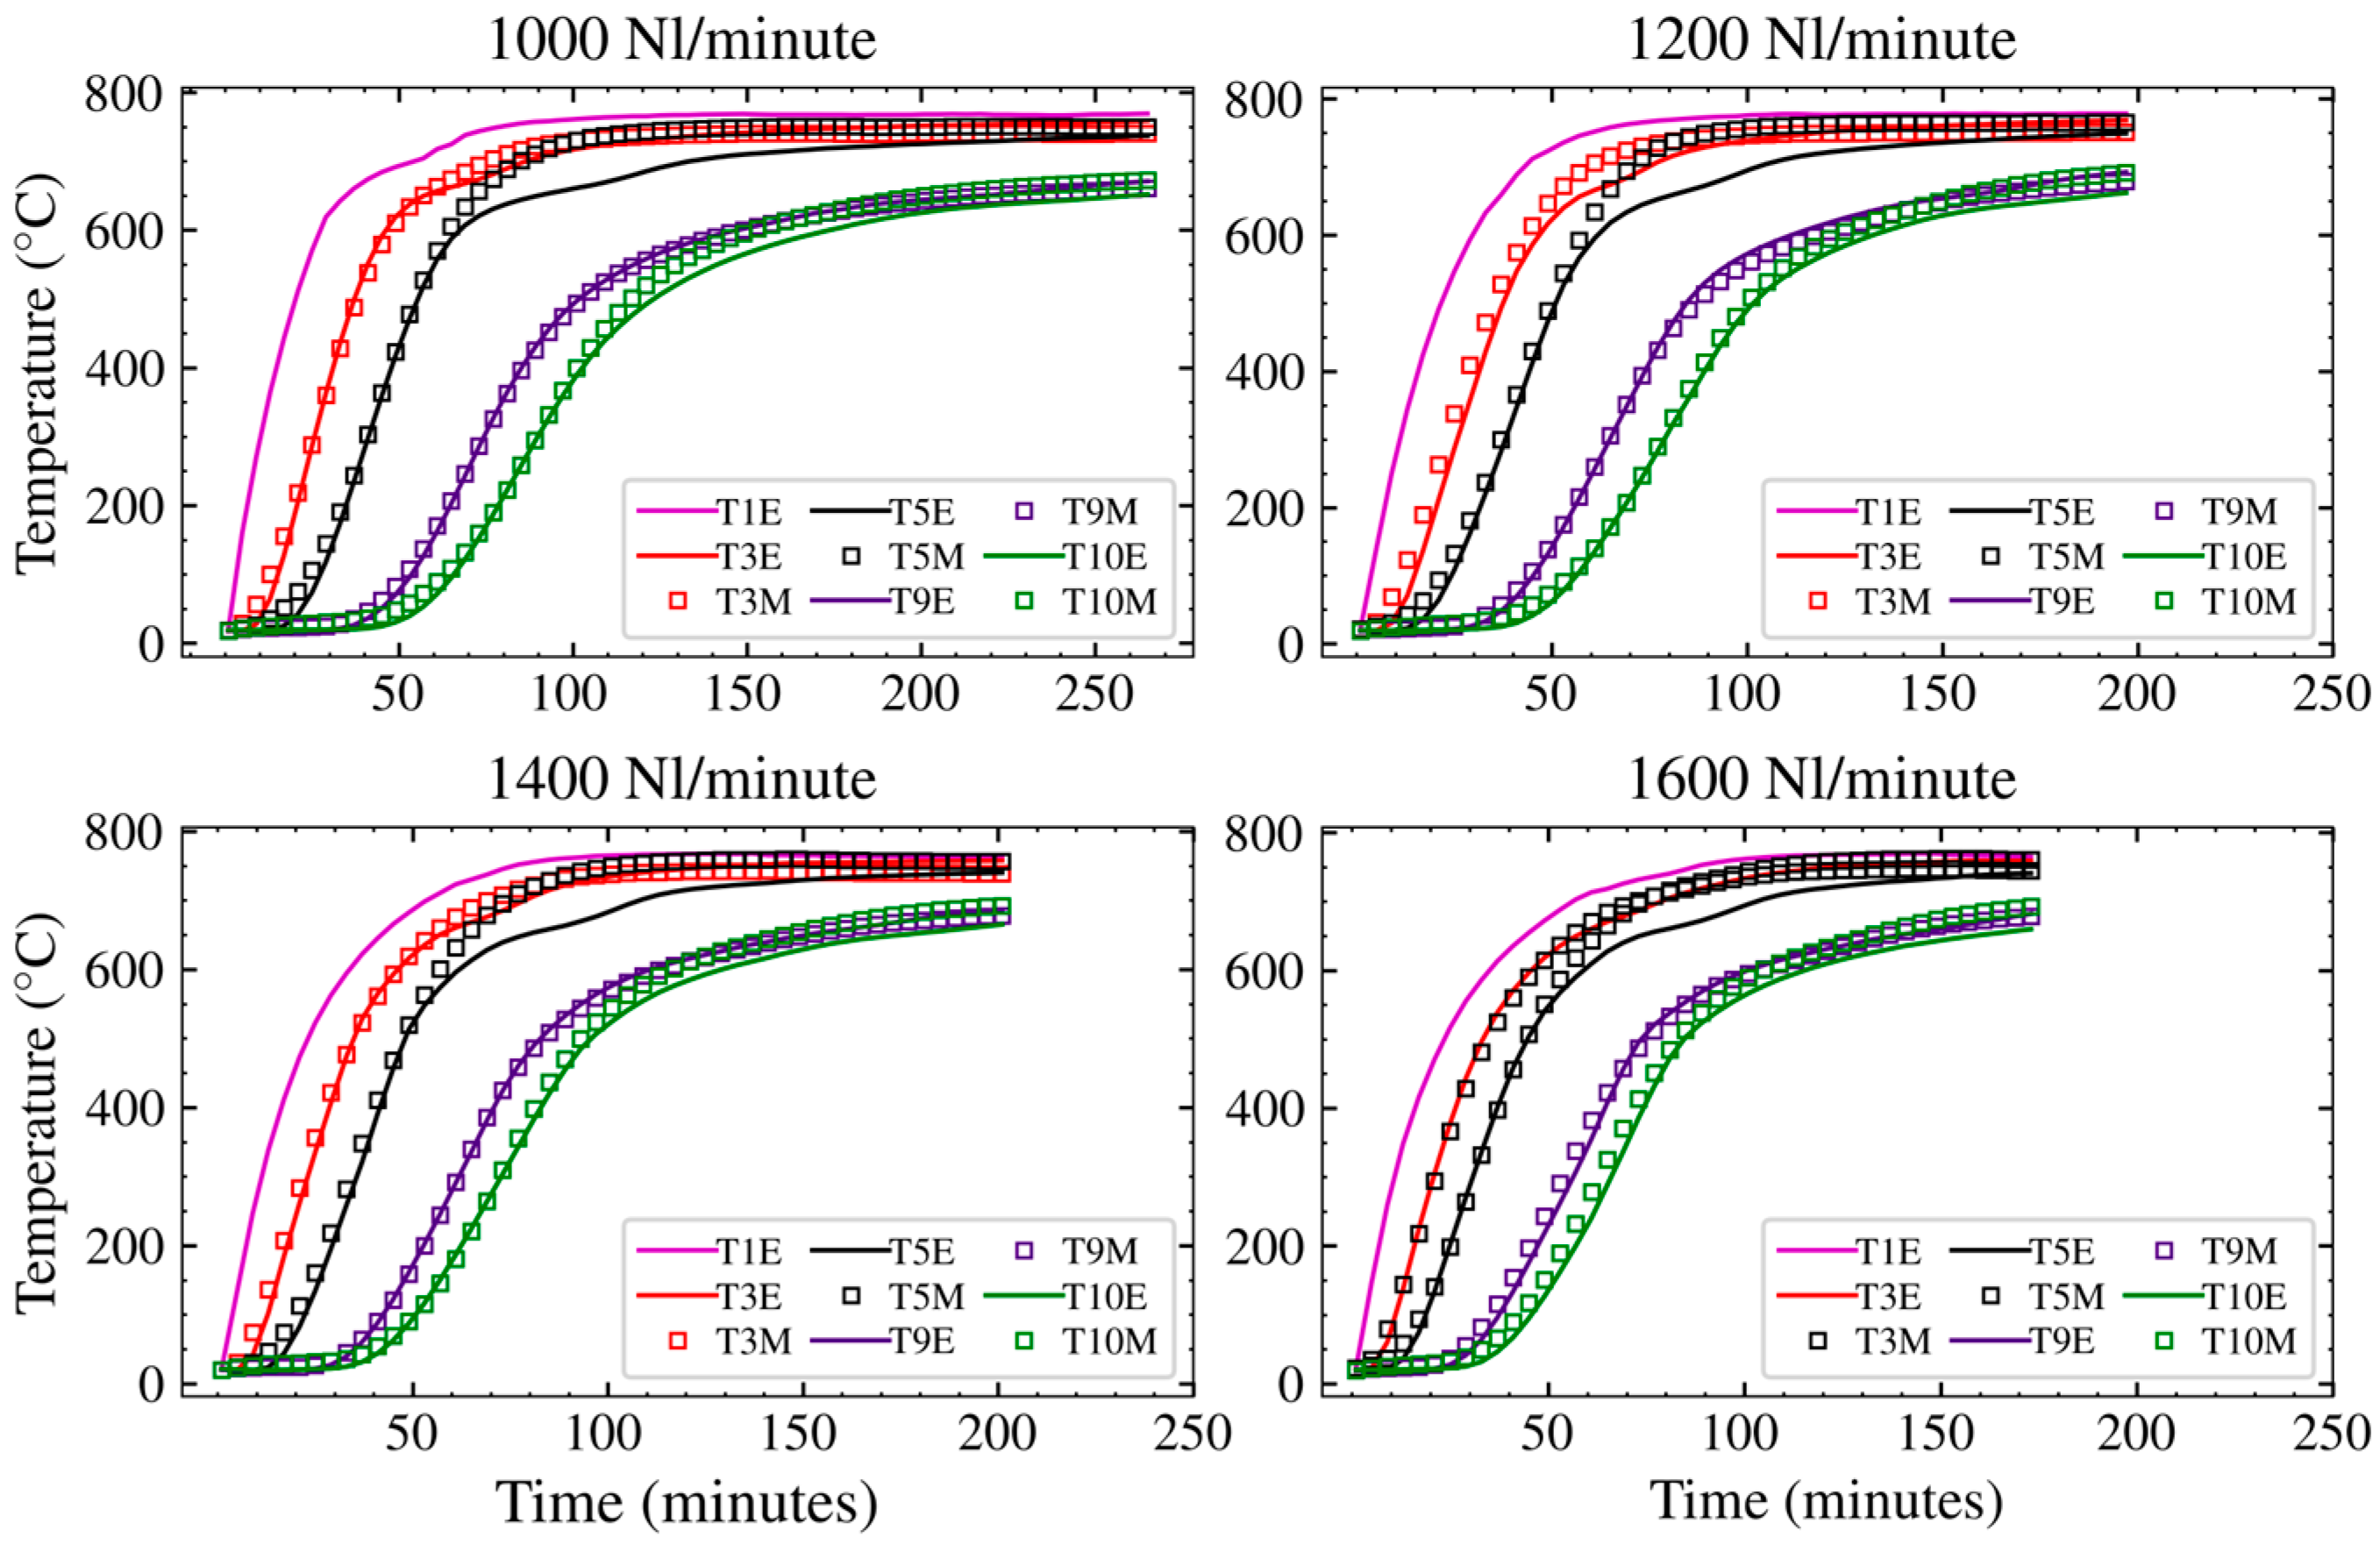
3.2. Grid Dependence and Model Verification
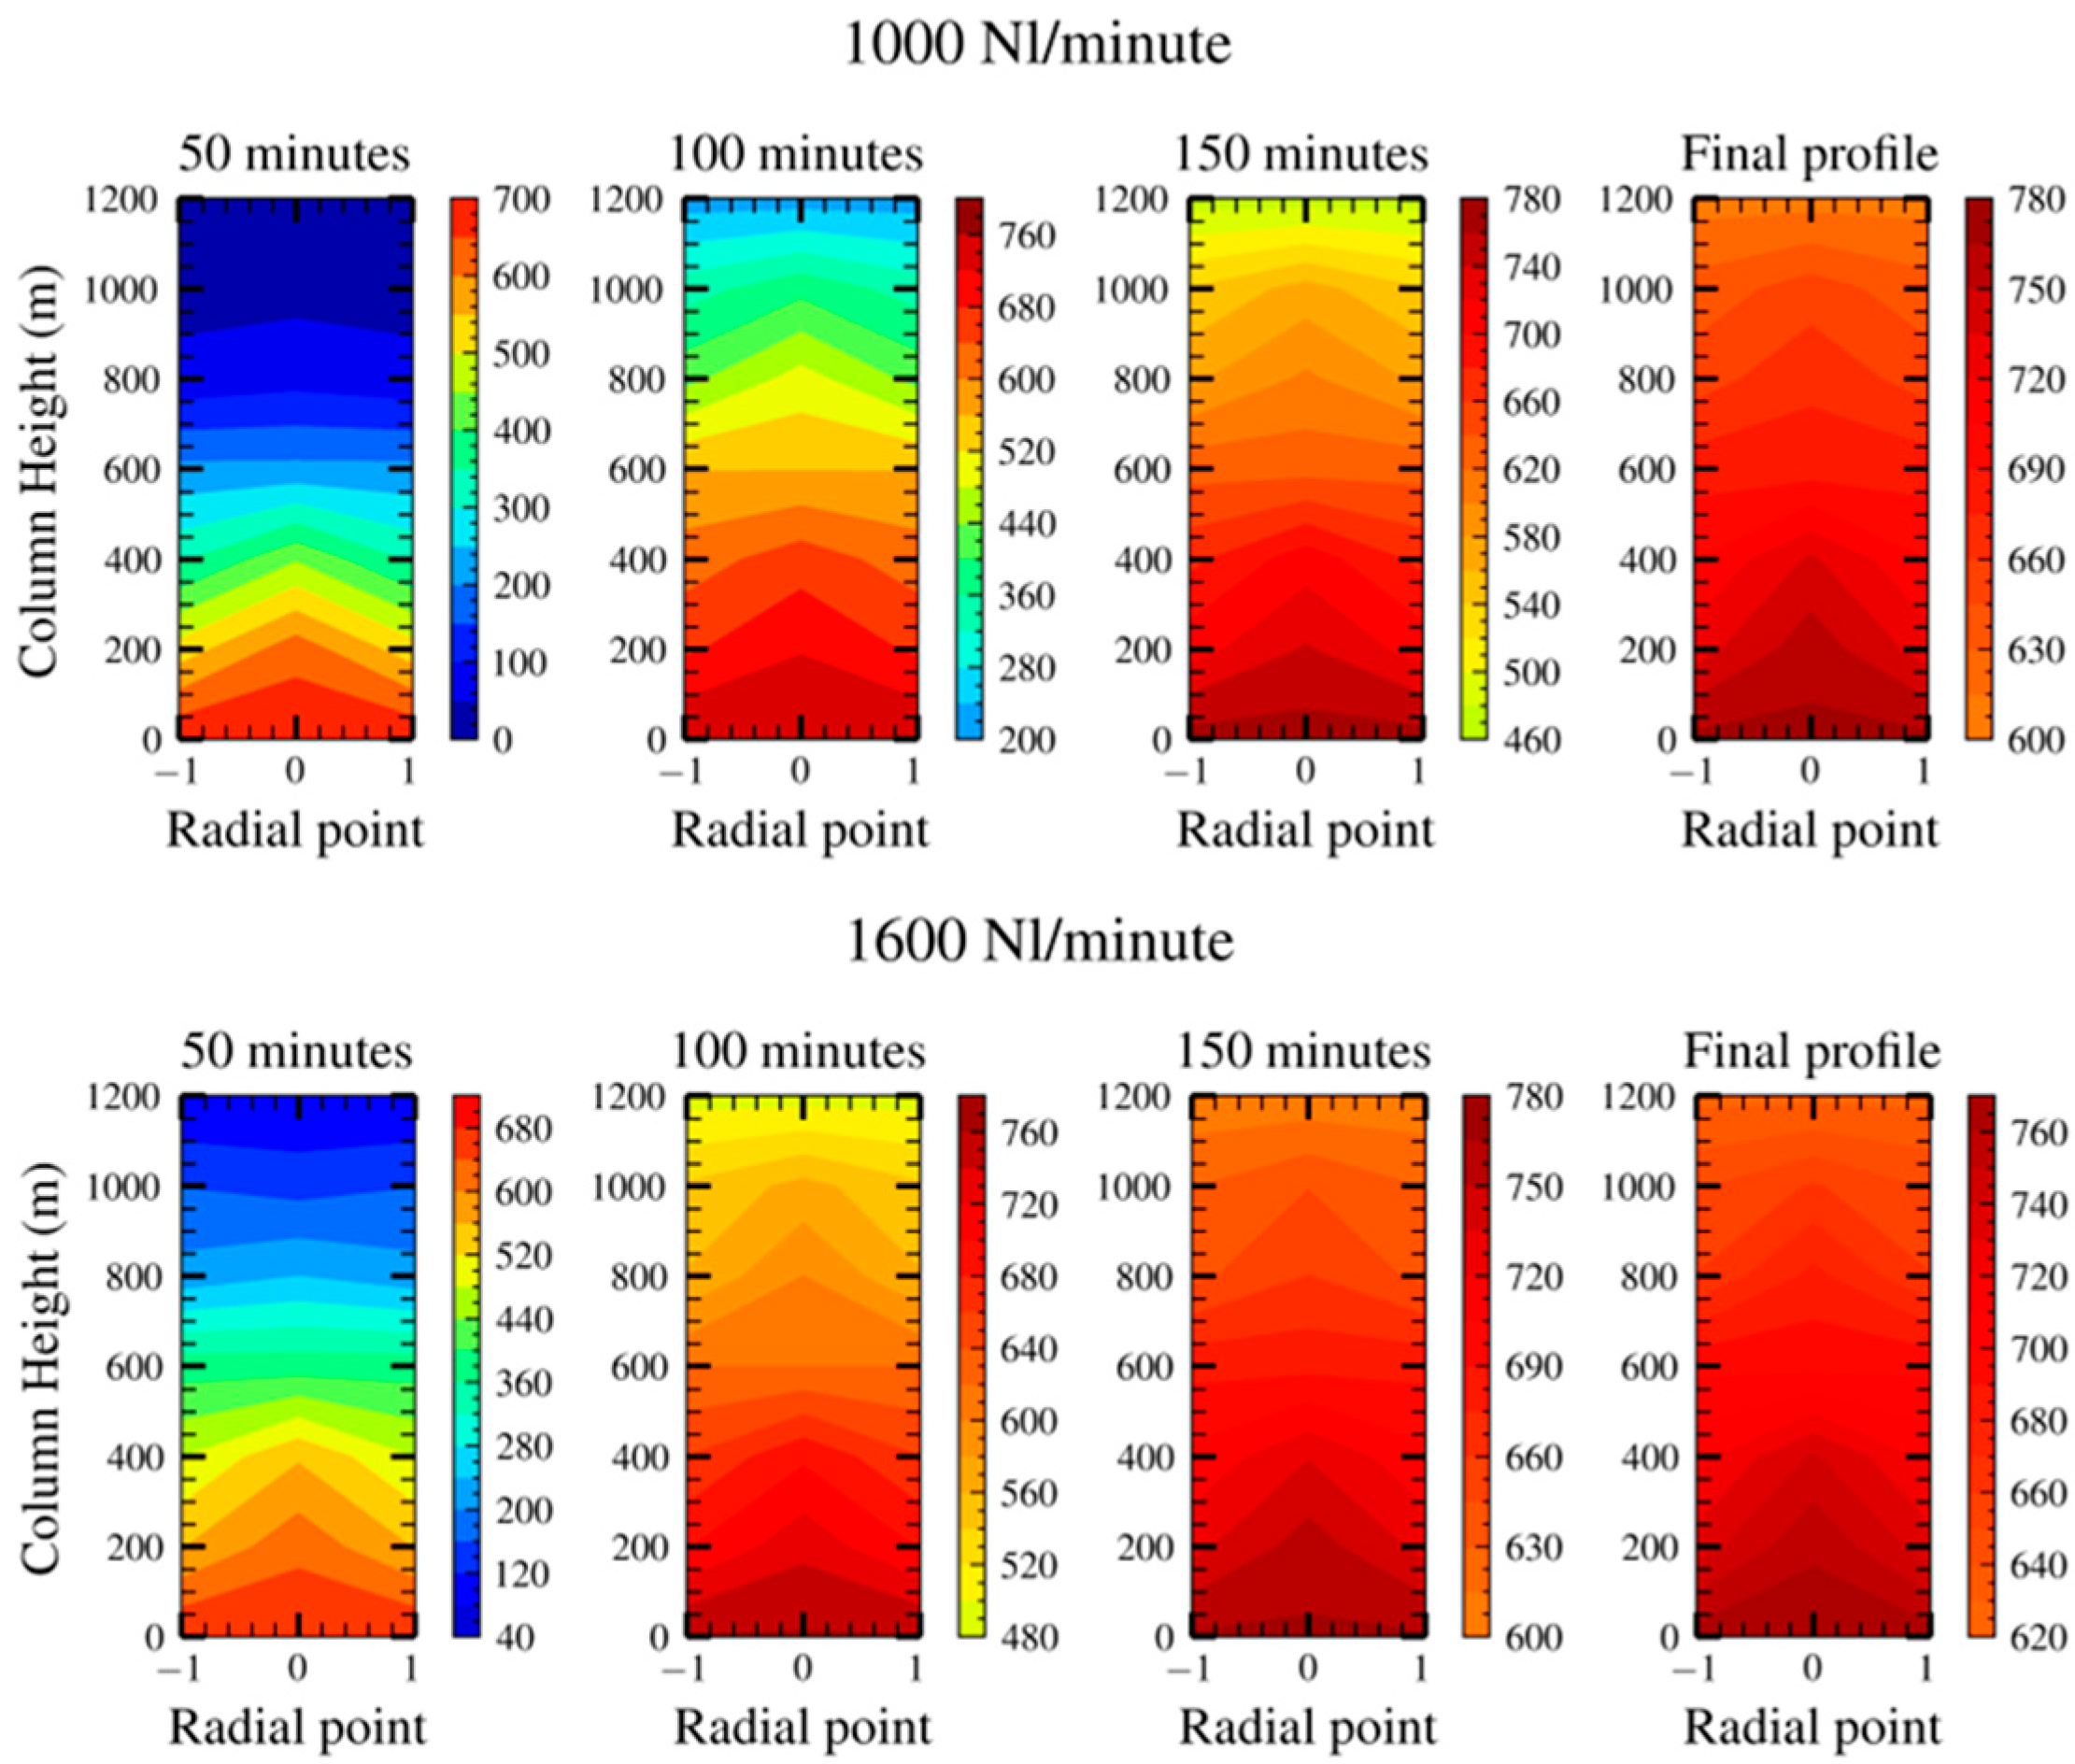
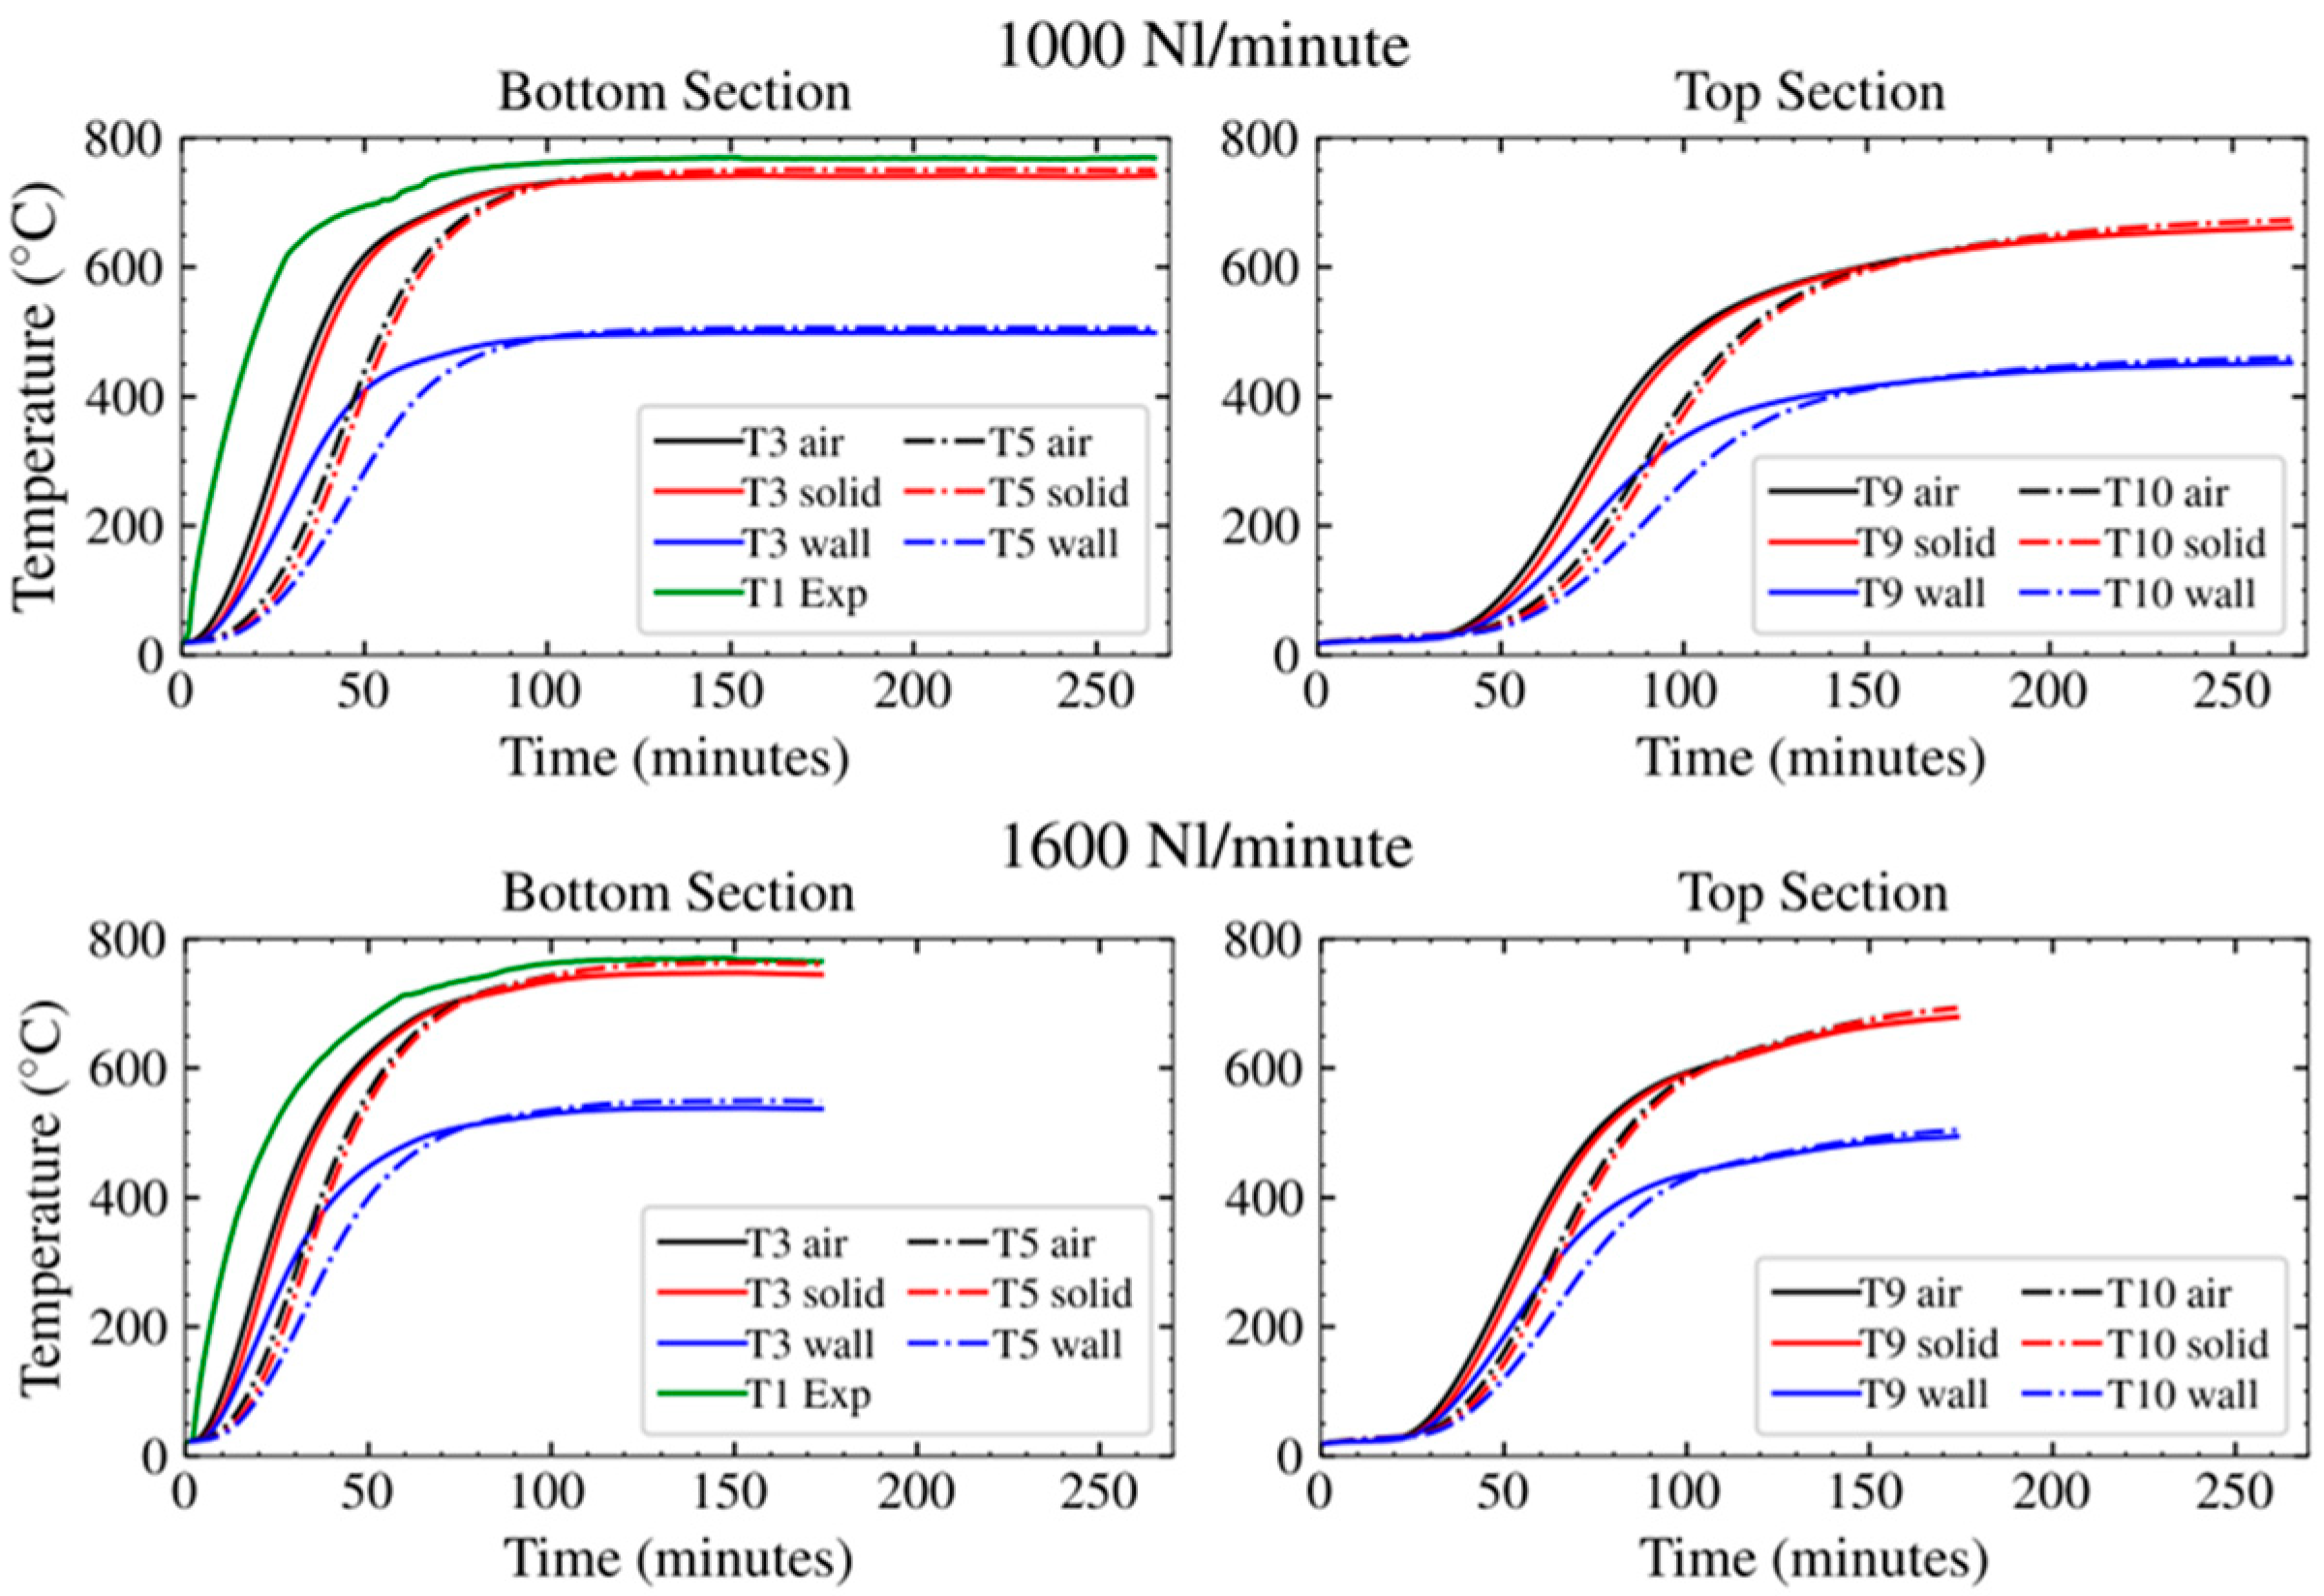
The model’s solution was evaluated for its correctness and its dependence on the grid size and computation time step. The restrictive Fredrich Lewy Number (Courent number ( C o = u t / x ) ) was used to initially set the grid size and the computation time step to ensure numerical stability. This was done by ensuring that the Courent number remains below unity ( C o 1 ) across the extremes of the operating temperatures and fluid flow rates. The 1600 Nl/min fluid flow rate was used for this activity to cover the highest linear fluid velocity. The grid spacing was varied at 0.005, 0.01, 0.02, and 0.03 m and the time step was varied at 0.001, 0.0015, 0.002, 0.0025, 0.003, and 0.005 seconds and paired with each grid size. This evaluation was performed for the first 200 mm segment (T3) and the first 40 min of processing time due to high computational costs. The results of the grid dependence study are presented in Figure 5.
The results suggest that a finer time step is required for the finer grid spacing. This becomes evident with the grid spacing of 0.01 m, where the model output moves away from the real solution as the time steps become higher than 0.0005 s. A highly grid-independent solution can be obtained by reducing the time step below 0.0005 s with a grid size of 0.02 m or 0.03 m. However, this was not feasible due to the computational expense and large numbers of simulations required to be run. The grid spacing of 0.02 m and a time step of 0.00032 was therefore used for the rest of this work.
Data from grid dependence evaluation were used to compare the model prediction against the expected trend from experimental work. The model output had the same trend as the experimental data. However, the model temperature values were some 100 °C higher than the temperatures recorded from experiments. This was expected to be the case as the heat transfer coefficients were not deduced from experimental data reduction equations but computed from empirical correlations. Model assumptions and numerical errors can also contribute to the mismatch between the model output and recorded data from the experiment.
A sensitivity study was carried out on the non-dimensional parameters derived from empirical correlations. A correlation strength of 0.91 was found between the model output and the solid-phase Stanton number. A sensible response was further obtained when a correction factor was applied to the non-dimensional Nusselt number. A correction factor of 0.5 was obtained by fitting the Nusselt number with values from 0.1 to 1 at intervals of 0.1. The correction factor was applied to Equation (8) and the corrected Nusselt number was used for the simulation of the transfer process.

3.3. Model Output

The average axial temperature from the wall and the centre of the packing was used to compare the temperature data produced by the model. The temperature comparison between model (M) and experiments (E) is presented in Figure 6. The least-square deviation of model temperatures from temperatures recorded from experiments was found to be <25 °C. This indicates good agreement given the high-temperature range of the system, suggesting that the model can be used to predict the preheating of Mn ore across a wide range of fluid flow rates and preheating temperatures.
The model predicted a small temperature difference of 10–20 °C between the Mn ore surface temperature and the fluid temperature during the transient stage of the transfer process. The predicted wall temperature reaches an average temperature of 500 °C during the equilibrium state. The transfer efficiency can be improved by a good shell design that minimizes loss of energy through the wall. Minor convergent errors can be observed when the transfer process reaches equilibrium. This can be solved by changing computation parameters through a control algorithm that estimates convergence errors and keeps them within some pre-set limit. This is, however, dependent on the availability of computational resources. The fluid, solid, and wall temperatures predicted by the model for the bottom and top sections of the column are presented in Figure 7.
An equal amount of energy was absorbed by the packed bed at the end of all tests. This also confirms the similar equilibrium temperature profiles from all the experiments. The energy absorbed by the wall reaches a maximum of about 5 MJ. The transfer efficiency reduces once equilibrium transfer is achieved. This is caused by the loss of energy to the environment. The energy balance and the transfer efficiency are presented in Figure 8.

4. Discussion

The experimental results presented in this work cover both the higher (1600 Nl/min) and the lower (1000 Nl/min) flowrates, and tests run with flowrates between the two flowrates produced similar results, except the changing hold-up time required to preheat the whole bed of Mn ore to 600 °C. The experimental design was tested for reliability through the reproducibility tests. The resulting maximum variation of 15 °C between the repeats is satisfactory given the scale of the experimental set-up, operating temperature, particle size distributions, and the randomness of the packing. The low-temperature difference between core particle temperature and fluid temperature confirms that the intra-particle heat transfer resistance is small and allows the use of exit air temperature to confirm preheating progress.
Radial temperature gradients cannot be attributed to radial porosity variations towards the wall due to the high packed bed to particle diameter (D/dp = 19) [16]. However, this indicates improper distribution of fluid at the entry point. Improper distribution of fluid at the entry of packed beds is normally avoided by implementing a calming section below the packed bed [29,30]. Heat loss to the environment through the wall also increases the radial bed temperature gradients. Therefore, the recorded radial temperature gradients stem from the experimental design rather than some heat transfer phenomena.
The calculated Biot number of the 20 mm Mn ore particles was high ( B i > 0.1 ) and indicated that diffusion plays some role in the transfer process [31]. However, insight into the intra-particle temperature gradients was also drawn from experimental results and the assumption of negligible intra-particle temperature gradients was made. The fitted Nusselt number used in this work suggests that some material-specific correlation needs to be established. However, this will require more experimental work because heat transfer parameters cannot be deduced using data reduction equations from non-homogeneous models [26].
Thermal diffusion played a minor role in the transfer process due to the high void fraction of the packed bed ( ε = 0.48 ) . This also resulted in no significant increase in the packed bed’s effective thermal conductivity when radiative heat transfer was considered. Thermal diffusion is expected to play a significant role when solid-to-fluid thermal conductivity values are below 1000 [26]. However, this cannot be expected in this system due to the inability of air to absorb radiation. The Mn ore effective thermal conductivity reduced to about 0.6 W / ( m · K ) at temperatures above 600 °C. This is comparable to studies on several packed beds of rocks conducted by [27], where all the effective thermal conductivities were reduced below 1 W / ( m · K ) at temperatures above 600 °C.
The reported wall temperatures are close to the Mn ore preheating temperature of 600 °C and indicate poor heat transfer efficiency. However, the transfer efficiency of 75–80% is acceptable given the poor insulation on the preheating column. The increase in energy lost to the environment during equilibrium transfer can be eliminated by operating a continuous flow preheating process.

5. Conclusions

The feasibility of preheating Mn ores with air to 600 °C was confirmed. The maximum least square errors of 15 °C from repeatability studies suggest that the experimental methods used were suitable for studying the transfer system. Intra-particle temperature gradients were insignificant, and air temperature can be used to predict solid-phase temperature across the packed bed. The experimental results show that the one-dimensional model lacks information on radial temperature distribution, which is important in ensuring that the entire packing materials meet preheating temperature requirements.
The packed bed effective heat transfer coefficient has shown that radiation and conduction heat transfer between particles do not have a significant influence on the transfer process. The transport process depends on convection heat transfer, and future work should use current data to derive a process-specific correlation for the heat transfer coefficient. The accuracy of the wall-phase temperature prediction was not confirmed, and further experimental work with wall temperature measurements is required to provide validation data. There was good agreement between experimentally measured temperature data and model predictions with maximum least square errors of 25 °C. Therefore, the model can be used to simulate and predict heat transfer in packed beds of lumpy mineral ores for a high-temperature fluid–solid heat transfer system.

Author Contributions

Conceptualization: L.H. and Q.G.R.; methodology: L.H. and S.N.S.; validation and formal analysis: S.N.S. and Q.G.R.; investigation and original draft: S.N.S. and T.S.; writing—review and editing: Q.G.R.; supervision: T.S. All authors have read and agreed to the published version of the manuscript.

Funding

This paper is published with permission from Mintek under PDR-24016/Mangsolair.

Data Availability Statement

The data presented in this study are available on request from the corresponding author due to large data sets.

Conflicts of Interest

Authors Sifiso N. Sambo and Quinn G. Reynolds were employed by the company MINTEK. The remaining authors declare that the research was conducted in the absence of any commercial or financial relationships that could be construed as a potential conflict of interest. The authors declare that this study received funding from Mintek. The funder was not involved in the study design, collection, analysis, interpretation of data, the writing of this article or the decision to submit it for publication.

Abbreviations

α s Thermal diffusivity of the solid packed bed materials ( m 2 / s )
AsSurface area to volume ratio of a packed bed ( 1 / m )
A w Surface area to volume ratio the packed bed encompassing column ( 1 / m )
B i Dimensionless Biot number
c p Specific heat capacity ( J / k g · K )
C o Dimensionless restrictive Fredrich Lewy Number (Courent number)
d p , e q Equivalent particle diameter ( m )
d p Mean particle diameter (m)
DColumn diameter (m)
H Packing height ( m )
h s f Heat transfer coefficient at the solid-fluid interphase ( W / m 2 · K )
h w Heat transfer coefficient at the wall-fluid interphase ( W / m 2 · K )
N u Dimensionless Nusselt number
P r Dimensionless Prandtl number
R Column radius ( m )
R e p Dimensionless Reynolds number
S t N Stanton number (numerical discretization)
T f Fluid temperature ( K )
T s Solid temperature ( K )
T w Wall temperature ( K )
T Fluid ambient temperature ( K )
λ Thermal conductivity ( W / m · K )
μ f Dynamic fluid viscosity ( k g / m · s )
ρ Density ( k g / m 3 )
ε Bed average porosity
z Discretization length (m)
η t r a n s f e r Heat transfer efficiency of the transfer system

References

  1. Bale, S.; Tiwari, S.S.; Nandakumar, K.; Joshi, J.B. Effect of Schmidt number and D/d ratio on mass transfer through gas-solid and liquid-solid packed beds: Direct numerical simulations. Powder Technol. 2019, 354, 529–539. [Google Scholar] [CrossRef]
  2. Yang, J.; Wang, J.; Bu, S.; Zeng, M.; Wang, Q.; Nakayama, A. Experimental analysis of forced convective heat transfer in novel structured packed beds of particles. Chem. Eng. Sci. 2012, 71, 126–137. [Google Scholar] [CrossRef]
  3. Gordon, Y.; Nell, J.; Yaroshenko, Y. Manganese Ore Thermal Treatment Prior to Smelting. KnE Eng. 2018, 3, 71–86. [Google Scholar] [CrossRef]
  4. Steenkamp, J.D.; Chetty, D.; Singh, A.; Hockaday, S.A.C.; Denton, G.M. From Ore Body to High Temperature Processing of Complex Ores: Manganese—A South African Perspective. JOM 2020, 72, 3422–3435. [Google Scholar] [CrossRef]
  5. Hamuyuni, J.; Saarenmaa, J.; Mäkelä, P.; Pekkala, O.; Binder, C.; Rannantie, S.; Lindgren, M. Pretreatment of Manganese Ore for Improved Energy Efficiency and Smelting Furnace Stability. In Proceedings of the 16th International Ferro-Alloys Congress (INFACON XVI), Trondheim, Norway, 27–29 September 2021. [Google Scholar] [CrossRef]
  6. Julia, N.; Hecquet, A.; Nussbaum, G.; Blancher, S.; Amalric, A. Pre-Heating Manganese Ore in a Pilot-Scale Rotary Kiln. In Proceedings of the 16th International Ferro-Alloys Congress (INFACON XVI), Trondheim, Norway, 27–29 September 2021. [Google Scholar] [CrossRef]
  7. Khama, M.; Reynolds, Q.G.; Xakalashe, B.X.; Sarkar, A.; Safarian, J. Computational reacting flow models for the pre-reduction of lumpy Nchwaning manganese ore with hydrogen. In Proceedings of the Sustainable Pyrometallurgy-Surviving Today and Thriving Tomorrow, Johannesburg, South Africa, 11–14 March 2024. [Google Scholar]
  8. Sarkar, A.; Schanche, T.L.; Wallin, M.; Safarian, J. Evaluating the Reaction Kinetics on the H2 Reduction of a Manganese Ore at Elevated Temperatures. J. Sustain. Metall. 2024, 10, 2085–2103. [Google Scholar] [CrossRef]
  9. Bale, S.; Tiwari, S.; Sathe, M.; Berrouk, A.S.; Nandakumar, K.; Joshi, J. Direct numerical simulation study of end effects and D/d ratio on mass transfer in packed beds. Int. J. Heat Mass Transf. 2018, 127, 234–244. [Google Scholar] [CrossRef]
  10. Çarpinlioğlu, M.Ö.; Özahi, E. A simplified correlation for fixed bed pressure drop. Powder Technol. 2008, 187, 94–101. [Google Scholar] [CrossRef]
  11. Das, S.; Deen, N.G.; Kuipers, J.A.M. A DNS study of flow and heat transfer through slender fixed-bed reactors randomly packed with spherical particles. Chem. Eng. Sci. 2017, 160, 1–19. [Google Scholar] [CrossRef]
  12. Reddy, R.K.; Joshi, J.B. CFD modeling of pressure drop and drag coefficient in fixed and expanded beds. Chem. Eng. Res. Des. 2008, 86, 444–453. [Google Scholar] [CrossRef]
  13. Jiang, P.-X.; Ren, Z.-P. Numerical investigation of forced convection heat transfer in porous media using a thermal non-equilibrium model. Int. J. Heat Fluid Flow 2001, 22, 102–110. [Google Scholar] [CrossRef]
  14. Liu, S.; Ahmadi-Senichault, A.; Pozzobon, V.; Lachaud, J. Multi-scale investigation of heat and momentum transfer in packed-bed TES systems up to 800 K. Appl. Energy 2024, 366, 123285. [Google Scholar] [CrossRef]
  15. Teruel, F.E.; Díaz, L. Calculation of the interfacial heat transfer coefficient in porous media employing numerical simulations. Int. J. Heat Mass Transf. 2013, 60, 406–412. [Google Scholar] [CrossRef]
  16. Van Antwerpen, W.; duToit, C.; Rousseau, P.G. A review of correlations to model the packing structure and effective thermal conductivity in packed beds of mono-sizes spherical particles. Nucl. Eng. Des. 2010, 240, 1803–1818. [Google Scholar] [CrossRef]
  17. Tangstad, M.; Ichihara, K.; Ringdalen, E. Pretreatment unit in ferromanganese production. In Proceedings of the Fourteenth International Ferroalloys Congress, Kiev, Ukraine, 31 May–4 June 2015; p. 8. [Google Scholar]
  18. Sarker, M.R.I.; Saha, M.; Rahman, M.S.; Beg, R.A. Recirculating metallic particles for the efficiency enhancement of concentrated solar receivers. Renew. Energy 2016, 96, 850–862. [Google Scholar] [CrossRef]
  19. Calderón, A.; Palacios, A.; Barreneche, C.; Segarra, M.; Prieto, C.; Rodriguez-Sanchez, A.; Fernández, A.I. High temperature systems using solid particles as TES and HTF material: A review. Appl. Energy 2018, 213, 100–111. [Google Scholar] [CrossRef]
  20. Harris, C.R.; Millman, K.J.; Van Der Walt, S.J.; Gommers, R.; Virtanen, P.; Cournapeau, D.; Wieser, E.; Taylor, J.; Berg, S.; Smith, N.J.; et al. Array programming with NumPy. Nature 2020, 585, 357–362. [Google Scholar] [CrossRef] [PubMed]
  21. Daizo, H.; Octave, L. Fluidisation Engineering, 2nd ed.; Chemical Engineering; Massachusetts Institute of Technology: Cambridge, MA, USA, 1992. [Google Scholar]
  22. Reddy, R.K.; Joshi, J.B. CFD modeling of pressure drop and drag coefficient in fixed beds: Wall effects. Particuology 2010, 8, 37–43. [Google Scholar] [CrossRef]
  23. Ringdalen, E.; Gjøvik, J.E.; Larssen, T.A.; Tangstad, M. Pretreatment of Manganese Ores in Different Gas-Atmospheres—A Method to Reduce Energy Consumption and CO2 Emissions in Mn-Alloy Production. In Proceedings of the 16th International Ferro-Alloys Congress (INFACON XVI), Trondheim, Norway, 27–29 September 2021. [Google Scholar] [CrossRef]
  24. Mertens, N.; Alobaid, F.; Frigge, L.; Epple, B. Dynamic simulation of integrated rock-bed thermocline storage for concentrated solar power. Sol. Energy 2014, 110, 830–842. [Google Scholar] [CrossRef]
  25. Yang, B.; Bai, F.; Wang, Y.; Wang, Z. Study on standby process of an air-based solid packed bed for flexible high-temperature heat storage: Experimental results and modelling. Appl. Energy 2019, 238, 135–146. [Google Scholar] [CrossRef]
  26. Esence, T.; Bruch, A.; Molina, S.; Stutz, B.; Fourmigué, J.-F. A review on experience feedback and numerical modeling of packed-bed thermal energy storage systems. Sol. Energy 2017, 153, 628–654. [Google Scholar] [CrossRef]
  27. Zanganeh, G.; Pedretti, A.; Zavattoni, S.; Barbato, M.; Steinfeld, A. Packed-bed thermal storage for concentrated solar power—Pilot-scale demonstration and industrial-scale design. Sol. Energy 2012, 86, 3084–3098. [Google Scholar] [CrossRef]
  28. Hänchen, M.; Brückner, S.; Steinfeld, A. High-temperature thermal storage using a packed bed of rocks—Heat transfer analysis and experimental validation. Appl. Therm. Eng. 2011, 31, 1798–1806. [Google Scholar] [CrossRef]
  29. Jorge, L.M.D.M.; Jorge, R.M.M.; Giudici, R. Experimental and numerical investigation of dynamic heat transfer parameters in packed bed. Heat Mass Transf. 2010, 46, 1355–1365. [Google Scholar] [CrossRef]
  30. Wang, J.; Yang, J.; Cheng, Z.; Liu, Y.; Chen, Y.; Wang, Q. Experimental and numerical study on pressure drop and heat transfer performance of grille-sphere composite structured packed bed. Appl. Energy 2018, 227, 719–730. [Google Scholar] [CrossRef]
  31. Hernández-Jiménez, F.; Pérez-Álvarez, R.; López-Quesada, G.; García-Gutiérrez, L.M. Effect of Biot number on the thermocline evolution of a packed bed TES system. J. Energy Storage 2025, 110, 115272. [Google Scholar] [CrossRef]
Figure 1. (a) Experimental set-up showing thermocouple arrangement within the packed bed, and (b) core particle temperature measurements.
Metals 15 00269 g001
Figure 2. Packed bed temperature field recorded from the experimental test run with 1000 Nl/min and 1600 Nl/min air flow rates.
Metals 15 00269 g002
Figure 3. Core particle temperature and air temperature measured at the same axial points.
Metals 15 00269 g003
Figure 4. Reproducibility of results from experimental tests.
Metals 15 00269 g004
Figure 5. Temperature profile for different grid spacing and time-step variations.
Metals 15 00269 g005
Figure 6. Fluid-phase temperature from the model output (M) and the recorded data from experiments (E).
Metals 15 00269 g006
Figure 7. Fluid, packed Mn ore, and wall temperatures predicted by the model.
Metals 15 00269 g007
Figure 8. Energy balance and transfer efficiency at all instances of the preheating process.
Metals 15 00269 g008
Table 1. Transport properties of the solid phases (solids and the wall).
A + B T + C T 2 + D T 3 + E T 4 + F T 5 + G T 6 .
UnitsABCDEFG
λ s W / ( m · K ) 1.681.49 × 10−2−1.15 × 10−43.71 × 10−7−5.86 × 10−104.41 × 10⁻¹³−1.25 × 10⁻¹⁶
C p s J / ( k g · K ) 4.95 × 10−25.98−3.18 × 10−27.96 × 10−5−8.77 × 10⁻⁸−2.85 × 10−116.25 × 10⁻¹⁵
λ w W / ( m · K ) 3.671.0 × 10−41.0 × 10⁻⁶−6.0 × 10−92.0 × 10−11−2.0 × 10−141.0 × 10⁻¹⁷
C p w J / ( k g · K ) 6.94 × 10−21.364.555 × 10−3−2.78 × 10−53.735 × 10−8−9.23 × 10⁻¹²−5.59 × 10⁻¹⁵
Table 2. Transport properties of the fluid phases (air).
UnitsABCDFormula
λ f W / ( m · K ) −2.099 × 10−87.64 × 10−52.45 × 10⁻³ A T a i r 2 + B T a i r + C
C p f J / ( k g · K ) −2.993 × 10−74.133 × 10−44.754 × 10−21002 A T a i r 3 + B T a i r 2 + C T a i r + D
μ f k g / ( m · s ) −11.298 × 10−114.417 × 10−81.748 A T a i r 2 + B T a i r + C × 10 5
ρ f k g / m 3 5.198 × 10⁻¹−6.343 × 10−36.964 × 10−1−9.452 × 10⁻⁴ A e x p B T a i r + C e x p D T a i r
Disclaimer/Publisher’s Note: The statements, opinions and data contained in all publications are solely those of the individual author(s) and contributor(s) and not of MDPI and/or the editor(s). MDPI and/or the editor(s) disclaim responsibility for any injury to people or property resulting from any ideas, methods, instructions or products referred to in the content.

