Article

Microstructural Evolution and Tensile Properties of Nb-V-Ti-N Microalloyed Steel with Varying Nitrogen Contents

1
Laboratory of Metastable Materials Science and Technology, Yanshan University, Qinhuangdao 066004, China
2
Technical Center, Tianjin Pipe (Group) Corporation Limited, Tianjin 300301, China
3
School of Materials Science and Engineering, Henan Polytechnic University, Jiaozuo 454000, China
*
Author to whom correspondence should be addressed.
Metals 2025, 15(3), 266; https://doi.org/10.3390/met15030266
Submission received: 8 September 2024 / Revised: 23 January 2025 / Accepted: 18 February 2025 / Published: 28 February 2025
(This article belongs to the Special Issue Microalloying in Ferrous and Non-ferrous Alloys)

Abstract

With the rapid development of long-distance transmission pipelines for oil and natural gas, pipeline steel is continuously evolving towards higher pressure, larger diameter, and thicker wall thickness. Many extensive studies and research have been conducted on X70 pipeline steel produced through traditional processing routes. This study focuses on Nb-V-Ti-N microalloyed steel with different nitrogen contents, systematically investigating the variations in microstructure and tensile properties after quenching and tempering processes. The results indicate that after quenching treatment, when the nitrogen content of the tested steel is 0.0020 wt%, its primary microstructure consists of granular bainitic ferrite (GBF), acicular ferrite (AF), and residual M/A (martensite/austenite) components. As the nitrogen content increases, the contents of acicular ferrite and M/A constituents gradually rise, while granular bainitic ferrite correspondingly decreases. After tempering treatment, the microstructure of the tested steel transforms into granular bainitic ferrite, acicular ferrite, and carbonitrides. Notably, with the elevation of nitrogen content, the number of high-angle grain boundaries in the microstructure significantly increases. Meanwhile, the mean equivalent diameter (MED) defined by the misorientation angle (MTA) ranging from 2 to 15° and the dislocation density (ρ) exhibit an overall decreasing trend. Both of these factors contribute significantly to yield strength, resulting in a gradual increase in yield strength (YS) as the nitrogen content rises. Additionally, the study finds that as the nitrogen content increases, the size of precipitated particles continuously enlarges, and their proportion in the microstructure gradually increases. This discovery provides important theoretical basis and practical guidance for further optimizing the microstructure and mechanical properties of X70 pipeline steel.

1. Introduction

X70 pipeline steel represents a pivotal material in constructing high-pressure pipelines for oil and gas transportation. Its microstructure evolution and mechanical properties have profound implications for performance and safety. The development of pipeline steel with exceptional strength, toughness, and weldability remains a long-term research focus within the field of materials science and engineering. Among various alloying elements, nitrogen (N) has garnered significant attention as an additive in pipeline steel due to its potential to enhance mechanical properties without substantially compromising weldability [1,2,3].
Previous studies have emphasized the significant influence of elemental nitrogen on the microstructure of low carbon steel. Zhang et al. [4] reported that increasing nitrogen content from 30 ppm to 165 ppm leads to a transformation in the microstructure of low-carbon vanadium microalloyed steel, resulting in the formation of a mixture of granular bainite ferrite (GBF), acicular ferrite, and martensite/austenite (M/A) components. This transformation is attributed to the nitrogen induced austenite stabilization and delayed ferrite transformation process [5]. In addition, it was found that nitrogen promotes the precipitation of vanadium-rich fine particles, enhances precipitation strengthening, and helps to improve yield strength and tensile strength [6].
Nitrogen has also been shown to affect the formation and properties of M/A components, which significantly affects the mechanical properties of steel. Chen et al. [7] investigated the role of nitrogen in controlling the M/A component in low-carbon Mo-V-N steel and observed that an increase in nitrogen content during the gamma →α+γ transformation process led to a decrease in carbon diffusion and an increase in nitrogen enrichment within the M/A component. This modification of the internal structure of M/A improves toughness and strain hardening ability [7].
In addition, the isothermal transformation temperature has been identified as another key factor affecting the microstructure evolution and mechanical properties of pipeline steel. Shi et al. [8] studied the effect of isothermal temperature on the microstructure and mechanical properties of low-carbon V-N-Ti steel, and observed that a decrease in isothermal temperature leads to refinement of the microstructure and an increase in AF and M/a component fractions. This refinement is accompanied by an increase in the yield strength and toughness of steel [8].
The tensile properties of pipeline steel are inherently related to its microstructure. GBF, AF, and M/A components each have unique mechanical properties and contribute differently to the overall strength, ductility, and toughness of steel. The yield strength (YS) and ultimate tensile strength (UTS) of pipeline steel are mainly influenced by factors such as grain size, dislocation density, and precipitation strengthening [9]. On the other hand, strain hardening behavior is influenced by the presence and distribution of hard phases such as M/A composition, which can act as obstacles to dislocation motion and enhance work hardening during deformation [10].
With the increase in nitrogen content, the austenite content in duplex steel significantly increases [11]. Under higher cooling rate conditions, the temperature at which ferrite transformation begins in the experimental steel decreases [12]. Under continuous cooling conditions, experimental steels with different nitrogen contents obtained a mixed microstructure of ferrite, pearlite, and bainite after continuous cooling [13]. Simultaneously increasing carbon or nitrogen appropriately can accelerate the precipitation of carbides [14,15]. This study aims to systematically investigate the effect of nitrogen content on the microstructure evolution and tensile properties of typical pipeline steels. Through the use of advanced characterization techniques and mechanical testing, this study aims to gain a deeper understanding of the mechanism by which nitrogen optimizes the microstructure and mechanical properties of pipeline steel to improve its performance.

2. Materials and Methods

Different nitrogen-content low-carbon microalloyed steels are melted in an 80 kg vacuum furnace and hot-rolled to produce 20 mm thick plates. Table 1 presents the actual chemical composition of all five types of steel, labeled as 20 N steel, 50 N steel, 60 N steel, 85 N steel, and 120 N steel, respectively.
Samples with varying nitrogen contents were maintained at 950 °C for 30 min, subsequently undergoing a quenching treatment. In order to control the cooling rate, the quenching liquid was obtained by configuring multiple inorganic substances. Following this, the quenched samples were subjected to a high-temperature tempering process (950 °C for 70 min). To examine the sample’s microstructure, observations were made using both a metallographic microscope (Olympus BX51M, Olympus, Tokyo, Japan) and a scanning electron microscope (Hitachi SU-5000, Ibaraki, Japan). Prior to observation, the samples were polished with sandpaper and mechanically, and then etched with a 4% nitric acid alcohol solution. For the characterization of the martensitic/austenitic structure, the samples underwent additional polishing steps with sandpaper and mechanical means, followed by etching with picric acid and detergent solution at a temperature range of 45 °C to 65 °C. Utilizing Image Pro Plus™ software (Image Pro Plus6.0), the sizes of at least 200 martensite/austenite particles were measured across five or more fields of view, and their average size was calculated using the intercept method. A cylindrical specimen, with dimensions of 6 mm in diameter and 80 mm in length, was cut along the longitudinal axis of the tested steel, and its axial expansion was measured using a sensor attached to a DIL expansion meter. The tangent method was applied to the thermal expansion curve to identify the phase transition points during thermal cycling. The microstructural features of precipitated ferrite and M-A constituents in thin film samples with differing nitrogen contents were analyzed using a JEM-2010 (Japan Electronics, Tokyo, Japan) high-resolution transmission electron microscope (TEM). These thin film samples, with dimensions of 10 × 10 × 4 mm, were initially polished with sandpaper to a thickness of 70–80 μm, followed by the use of a punching machine to extract a 3 mm diameter circular piece. Electropolishing was then conducted in a mixture of 7% perchloric acid and glacial acetic acid at −10 °C, with a voltage of 30 V and a current ranging from 55 to 65 mA, to obtain the thin film samples. Information regarding particle size, distribution, and the type of precipitated phase was gathered through the observation of replica samples. Image Pro Plus software was employed to conduct statistical analysis on the average particle size and area fraction of the precipitated particles, with a minimum of 500 particles counted. X-ray diffraction analysis was carried out on samples with varying nitrogen contents, using samples sized 10 × 10 × 2 mm3. After stress relief treatment through grinding and polishing (using a solution of 10% perchloric acid and 90% ethanol), the crystal structure and dislocation density were determined using the X-ray Diffractometer (D/Max-2500/PC diffractometer, Rigaku, Tokyo, Japan). The scanning range was set from 40° to 105° (2θ), with a scanning speed of 2°/min. To ascertain effective grain size information, electron backscatter diffraction (EBSD) testing was performed. The polished samples were electropolished using a mixed solution of 10% perchloric acid and 90% ethanol (at a voltage of 25.0 V, a current of 1.00–1.30 mA, and for a duration of 10–20 s). Testing was conducted using the SU5000 scanning electron microscope, with a scanning step size of 0.15 μm. Statistical analysis was performed on the distribution of different experimental orientation differences, and the average equivalent diameter (MED) was calculated. Micro tensile tests were executed on an MTS universal testing machine at a tensile rate of 3 mm/min at room temperature. Two tensile specimens with different nitrogen contents were tested, and their average values were calculated.

3. Results

3.1. Yeild Strength (YS)

The typical tensile strain–stress curve of tempered specimens is shown in Figure 1, and the summary of tensile properties is shown in Table 2. From the table, it can be seen that when the N content increases by 20~120 ppm, the yield strength (YS) increases from 510 to 576 MPa, and the ultimate tensile strength (TS) significantly increases by 605~681 MPa. Correspondingly, the elongation at break (TE) decreased from 16.4 to 15.4. The yield-to-tensile strength ratio (YR) does not vary significantly.

3.2. Microstructure Characterization

Microstructure of the Tested Steel After Quenching Treatment

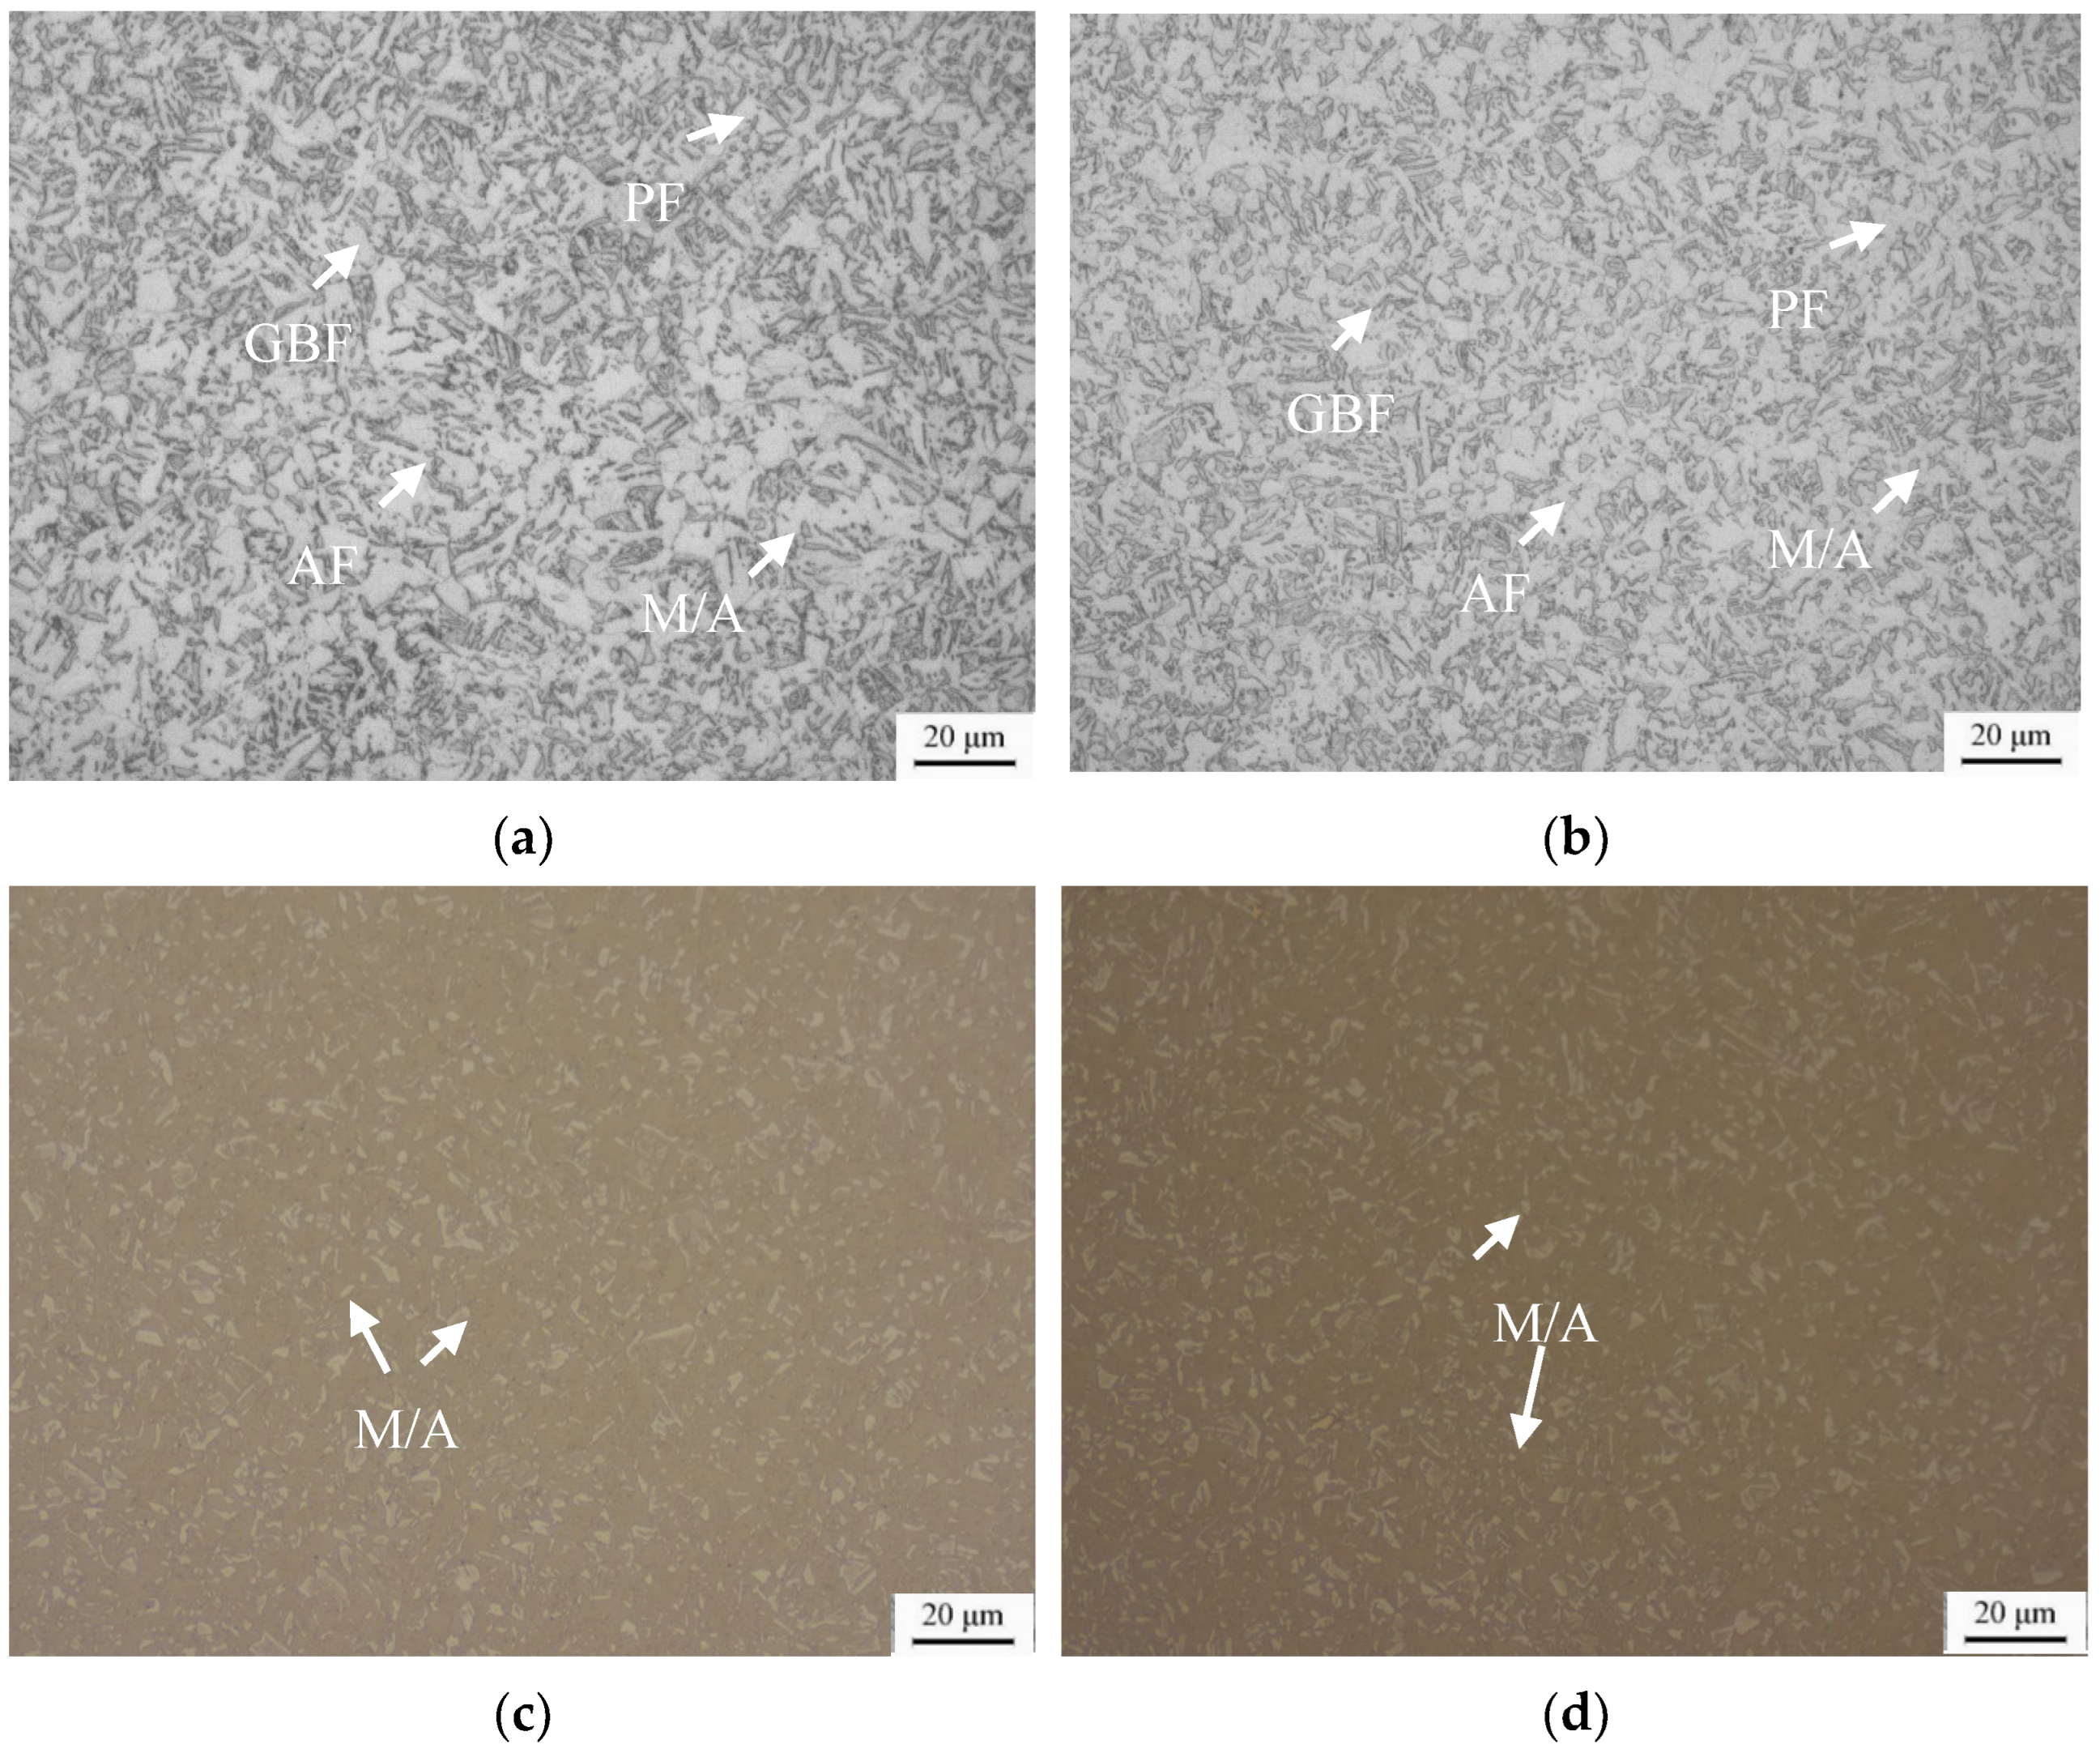
Figure 2 displays the optical micrographs (OMs) of the microstructure and M/A components of typical experimental steels with varying nitrogen contents following quenching treatment. The quantified results of the microstructure characteristics are presented in Table 3. The microstructure post-quenching primarily consists of granular bainite ferrite (GBF), acicular ferrite (AF), polygonal ferrite (PF), and martensite/residual austenite (M/A) components. As the nitrogen content increases, the proportion of AF gradually rises, whereas the content of GBF progressively decreases, as illustrated in Figure 2b. With an elevation in nitrogen content, the area fraction of the M/A component spans from 12.6% to 16.2%, as shown in Table 3.
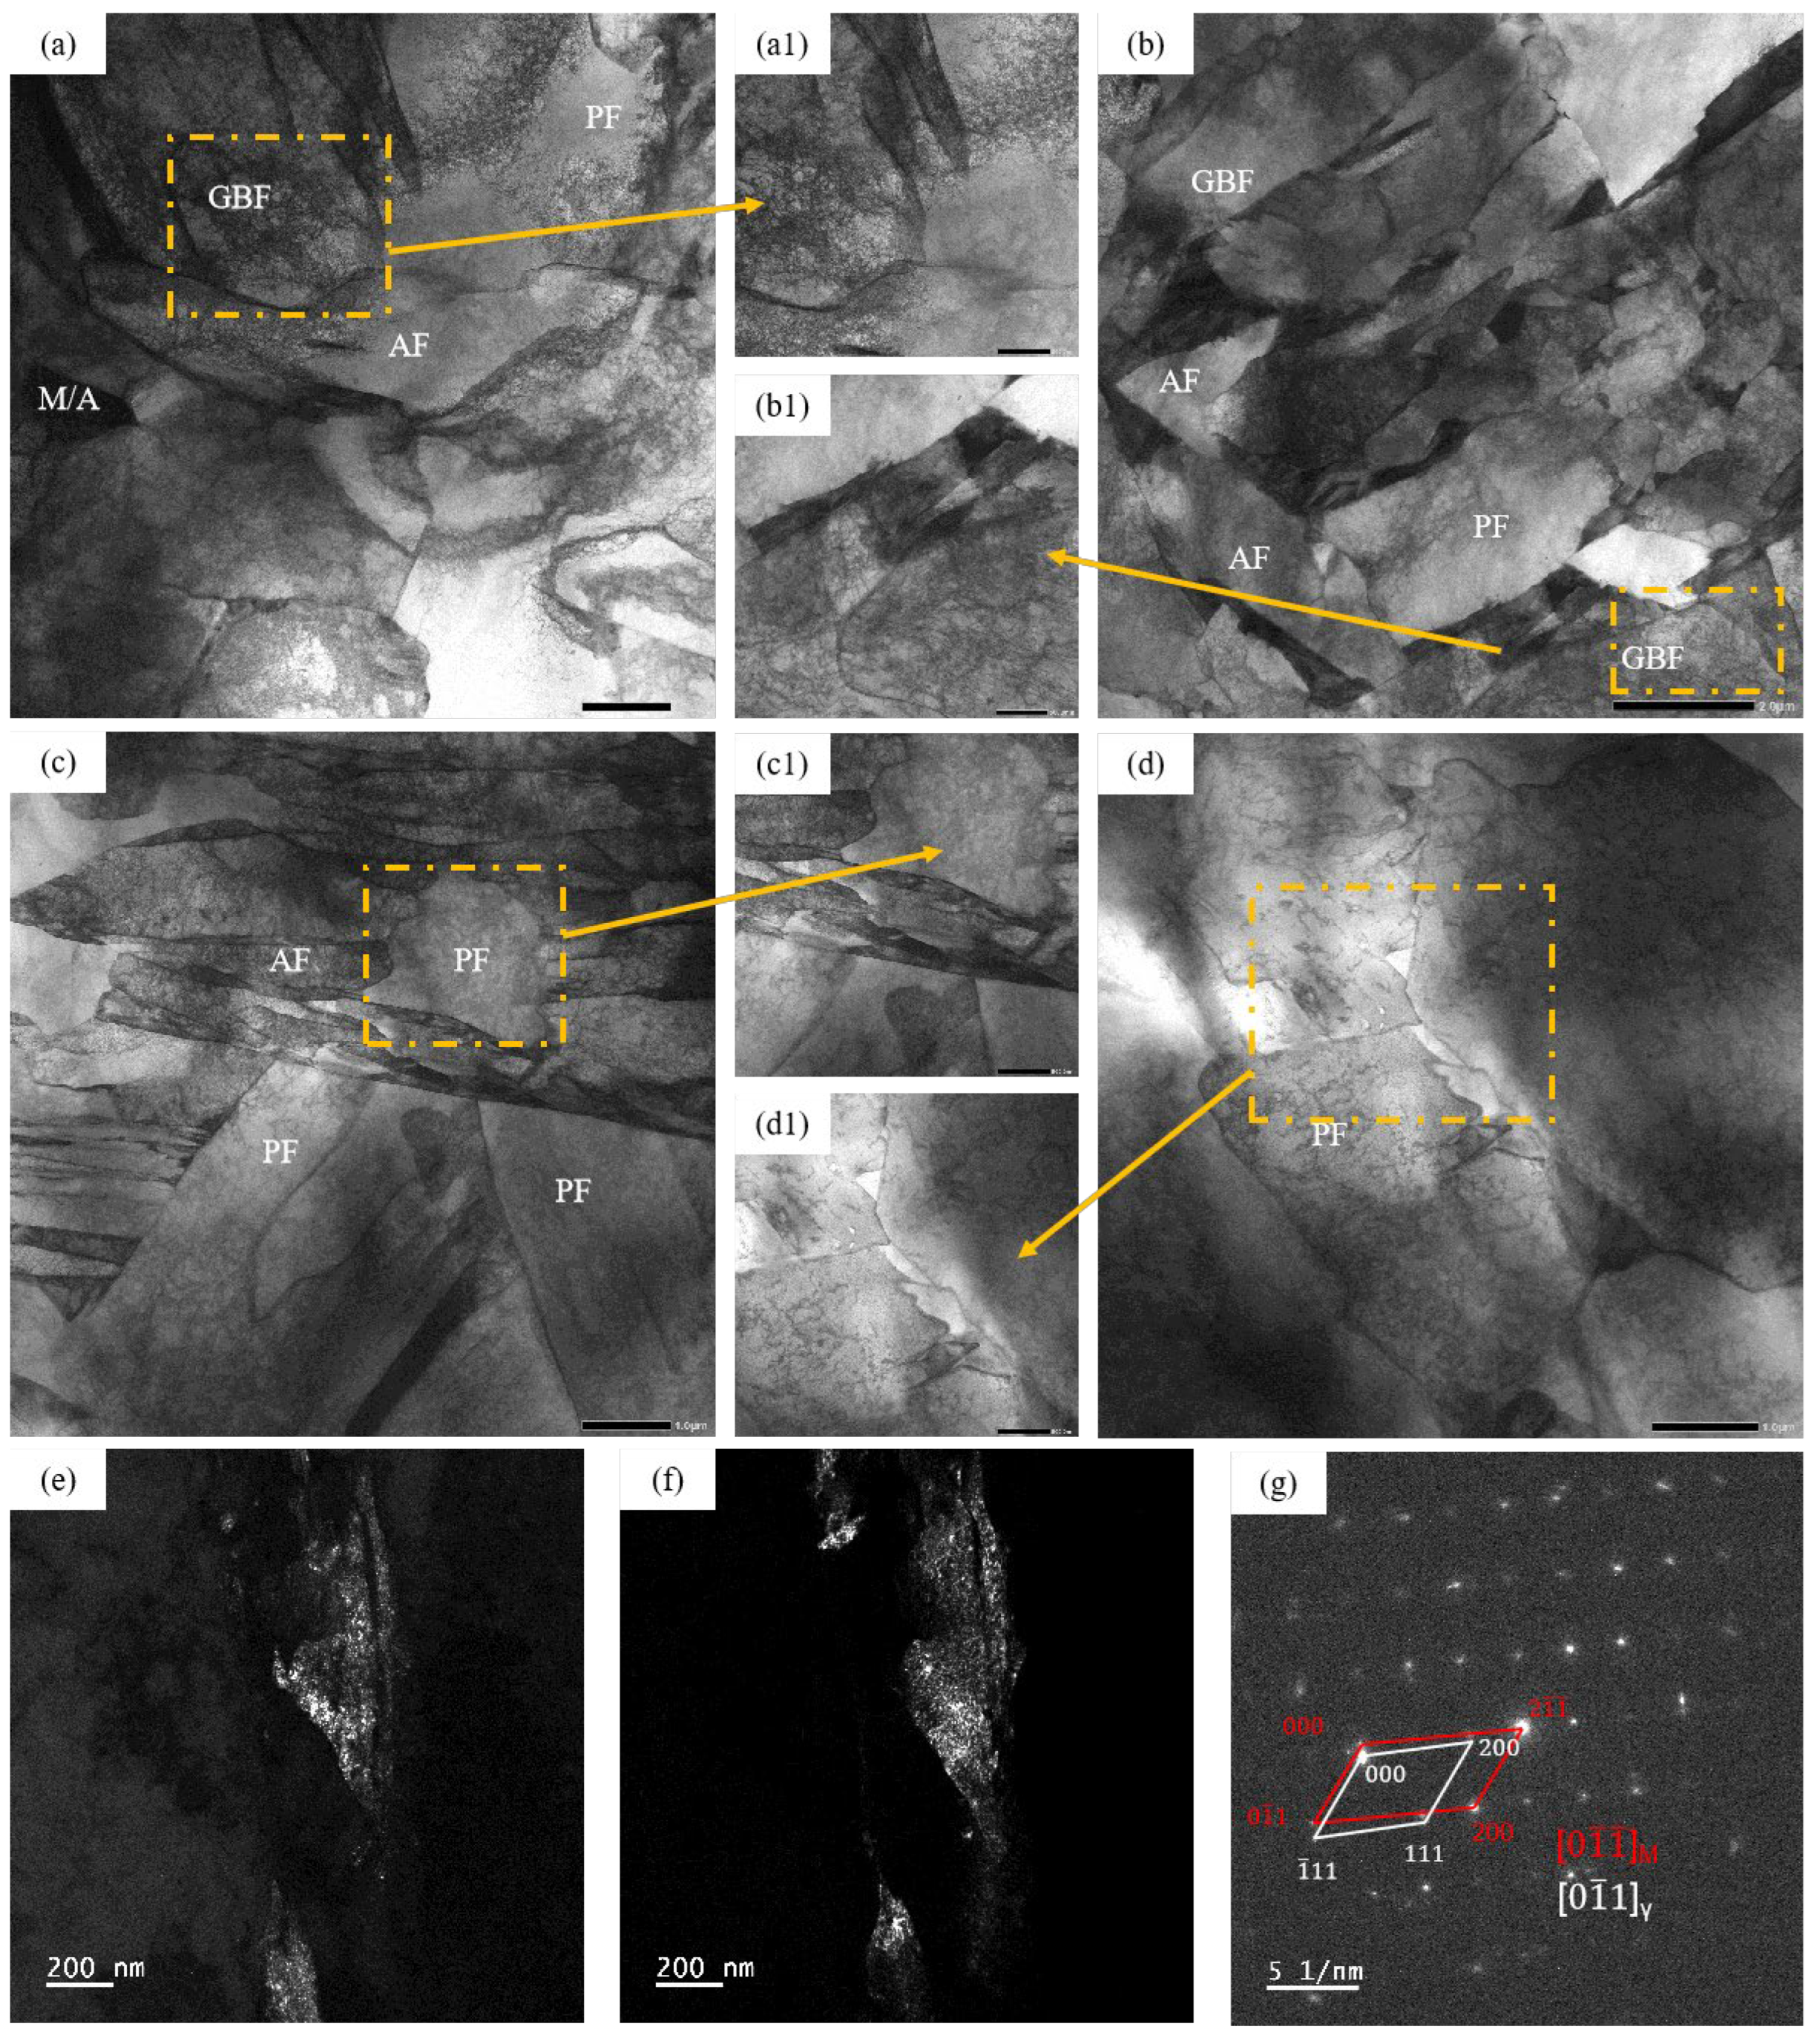
Further characterization of the microstructure following quenching and tempering with varying nitrogen contents was conducted using TEM, as depicted in Figure 3a−c. Optical microscopy (OM) revealed that the test steels, regardless of their nitrogen content, consisted of lath ferrite, acicular ferrite, and massive ferrite. Upon examining the dislocation structure within the ferrite, it was observed that when the nitrogen content was 0.0018 wt%, granular bainite ferrite (a1,b1), polygonal ferrite (c1,d1) and acicular ferrites (AFs) composed of high-density dislocations intersected, forming an interlocking structure. As the nitrogen content increased, some ferrite flat noodle bundles transformed into blocky structures, and AF with relatively low dislocation density gradually increased, as evident in the figure. When the nitrogen content of the test steel rose to 0.0120 wt%, the distribution of dislocation lines within the ferrite became relatively uniform compared to 20 N and 50 N samples (as shown in Figure 3b), although there was still an interlocking acicular ferrite (IGAF) with a denser distribution of internal dislocation lines.
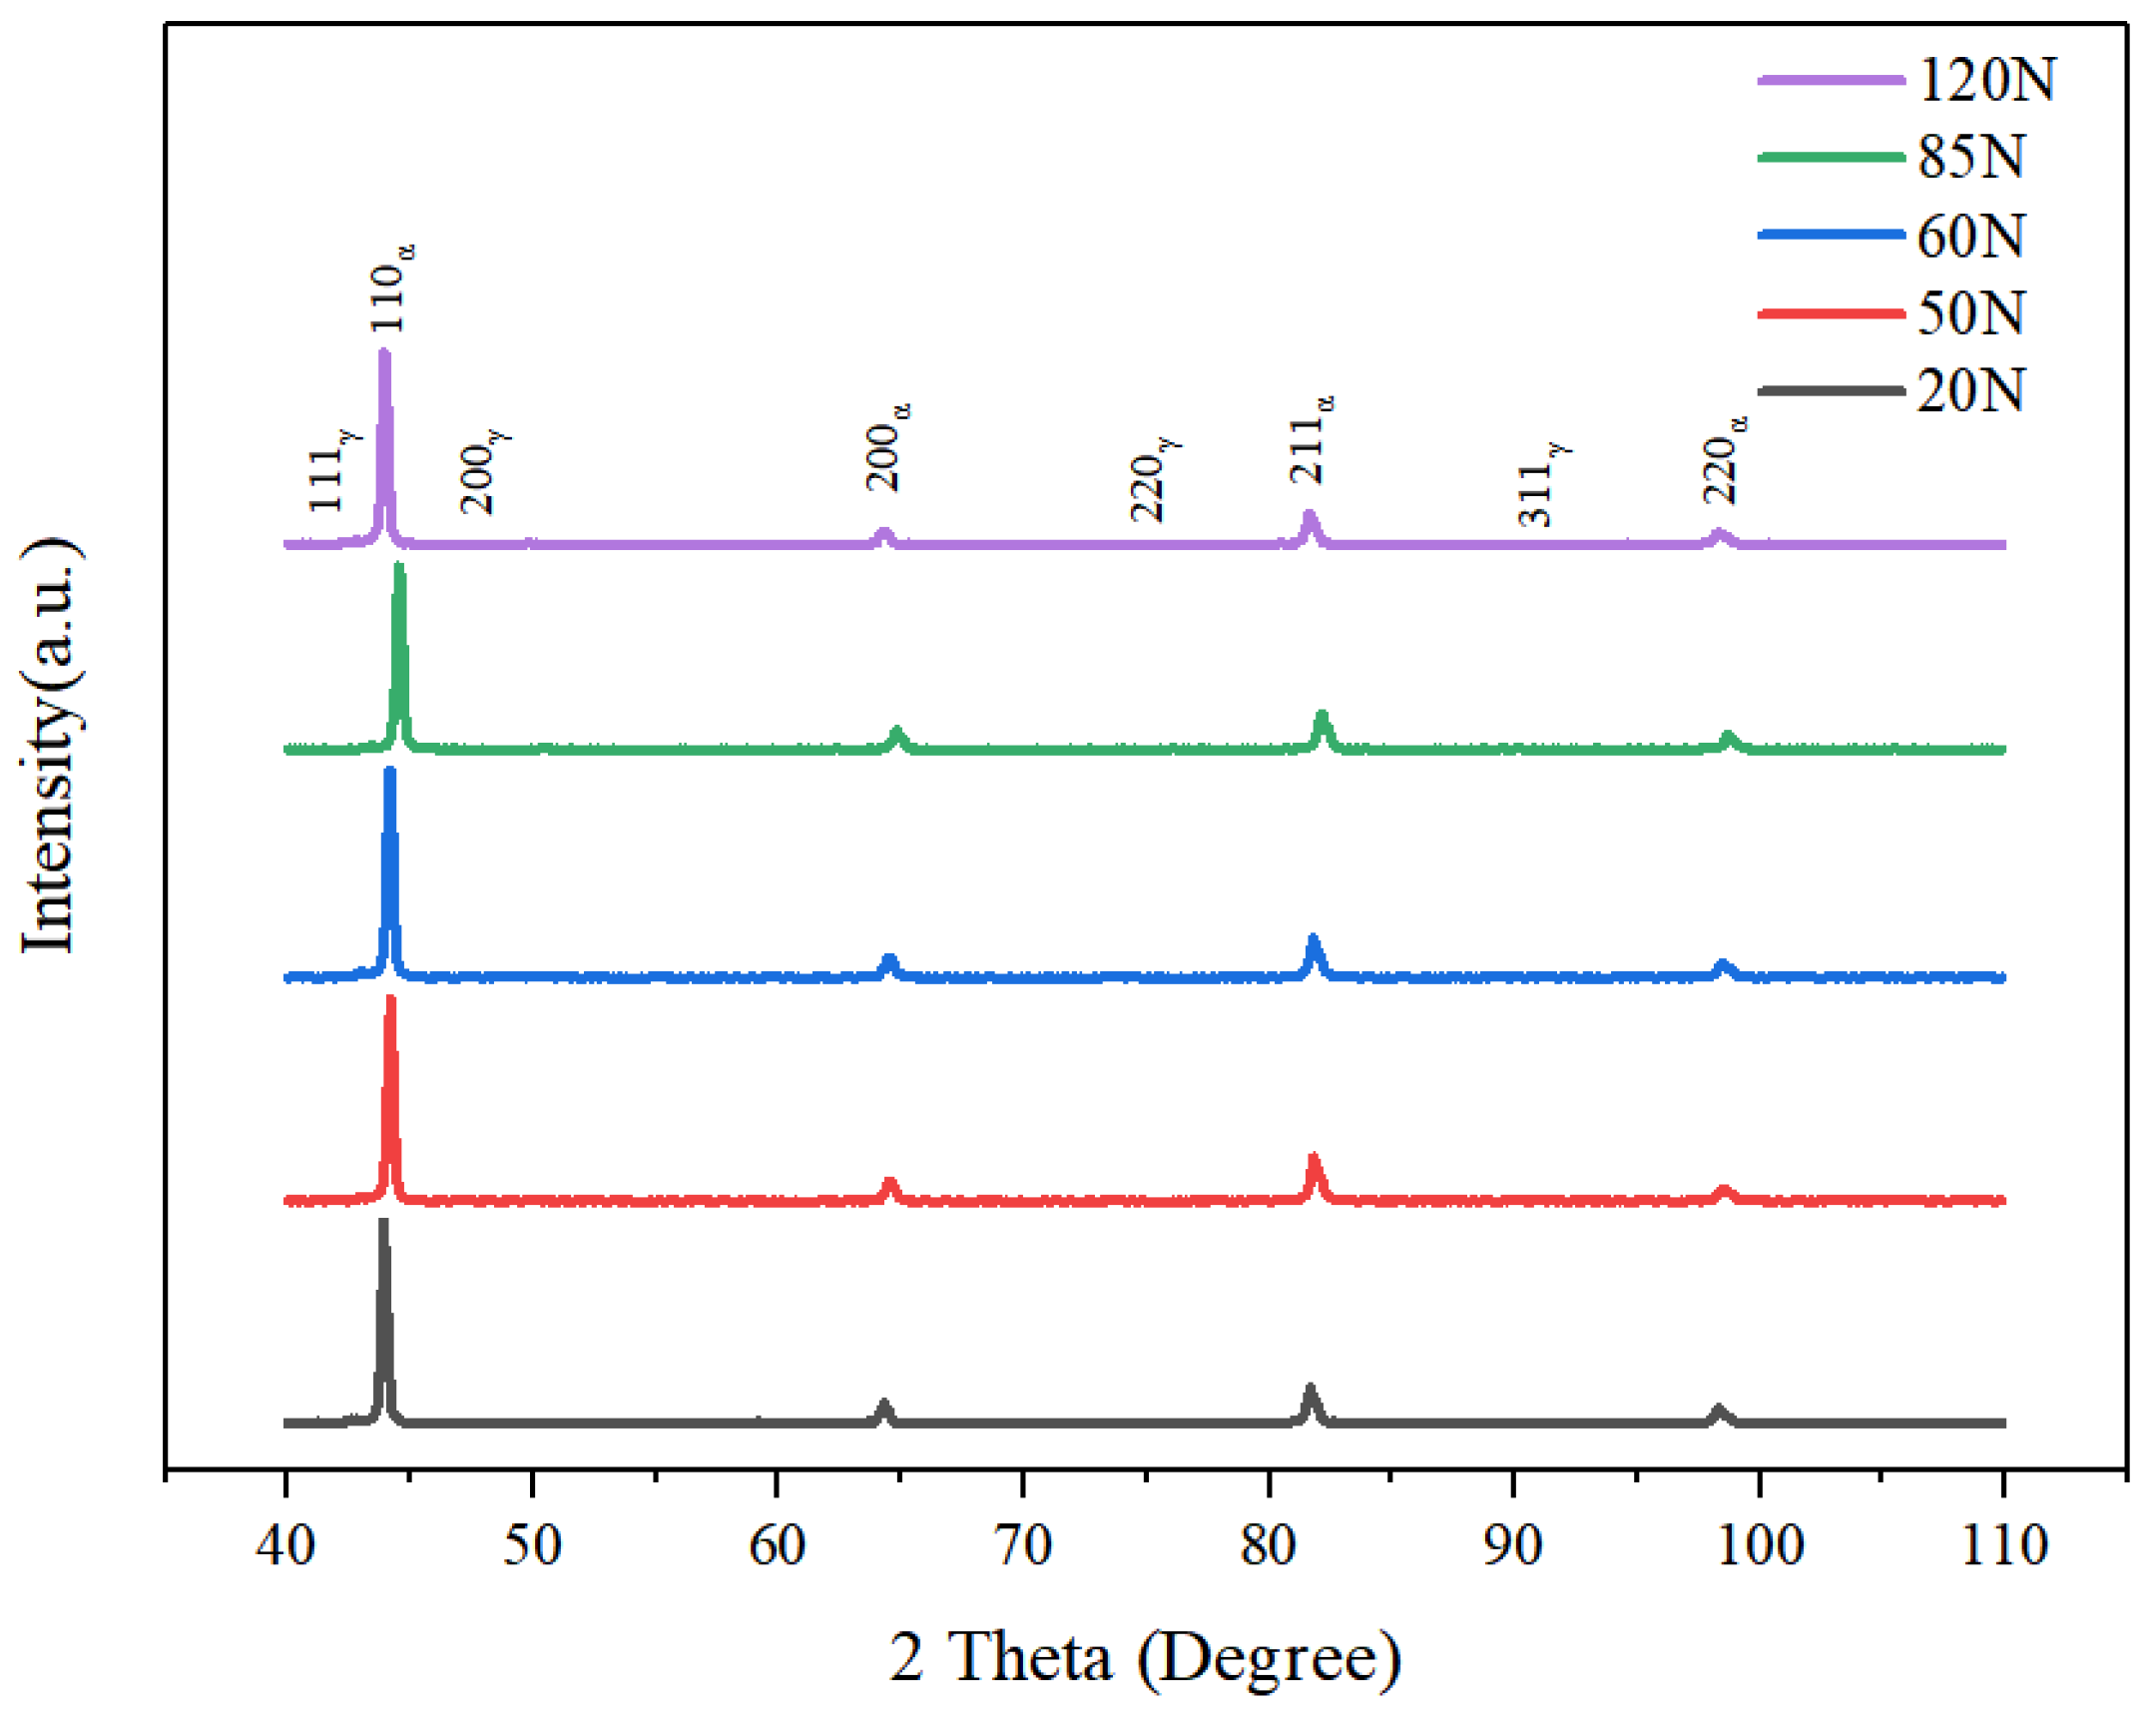
Figure 4 displays the XRD patterns of quenched samples containing varying levels of N content. The figure indicates that the tested steel, after quenching, is primarily composed of ferrite and a minor fraction of residual austenite (<1%). Upon calculation of the dislocation density, it is evident that the dislocation density of the quenched samples exhibits a slight increase as the N content rises.

3.3. Microstructure of the Tested Steel After Quenching and Tempering Treatment

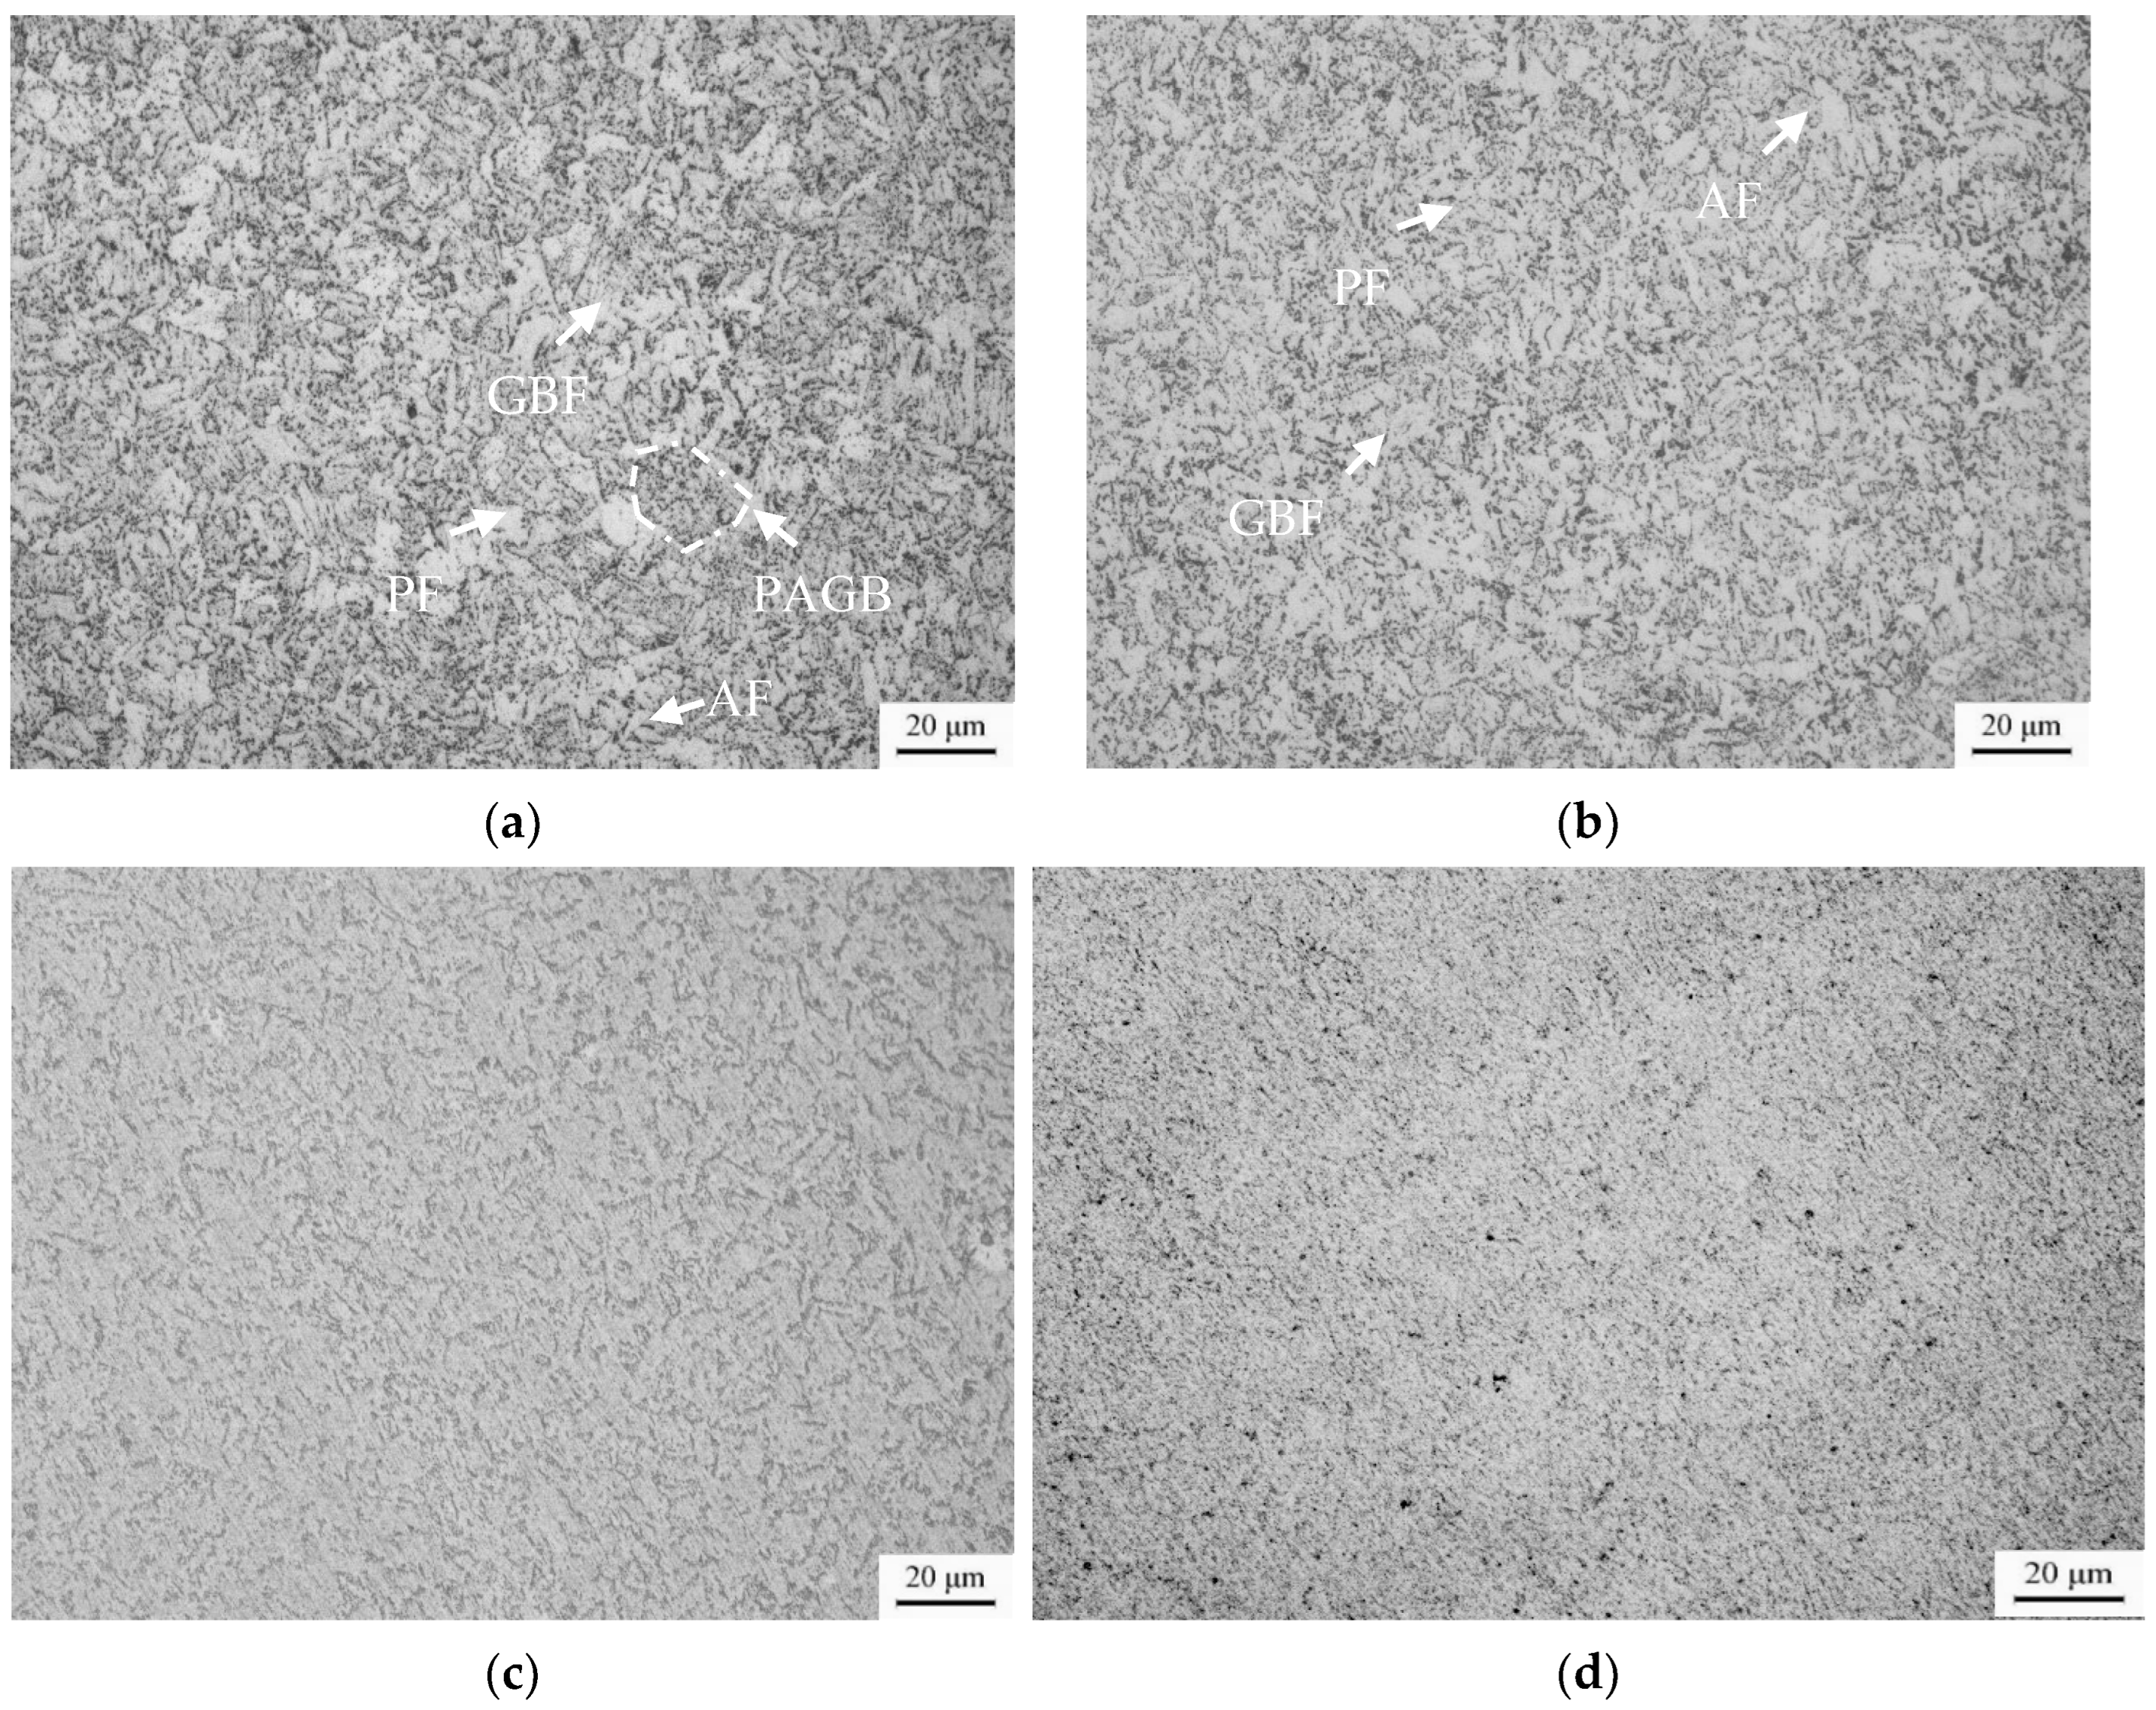
Figure 5 presents the optical micrograph (OM) of the microstructure of typical experimental steels with varying nitrogen contents following quenching and tempering treatment. The quantified results of the microstructure characteristics are provided in the accompanying Table 3. As depicted in Figure 5a,b, the microstructure after quenching and tempering primarily consists of granular bainite ferrite (GBF) acicular ferrite (AF), polygonal ferrite (PF), and precipitated phases. Notably, no discernible M/A component was observed in the microstructure upon picric acid corrosion, indicating that the quenched M/A component had dissolved, as evident in Figure 5c,d.
After undergoing quenching and tempering treatment, the experimental steel designated as 20 N exhibits precipitation specifically at the boundaries of the original austenite grains, acicular ferrite grains, and within the original M/A components. This precipitation behavior is clearly illustrated in Figure 6a. Furthermore, a notable trend is observed: as the nitrogen content in the steel increases, the percentage of the precipitated phase area also increases correspondingly. This relationship between nitrogen content and precipitated phase area is demonstrated through Figure 6a,b.
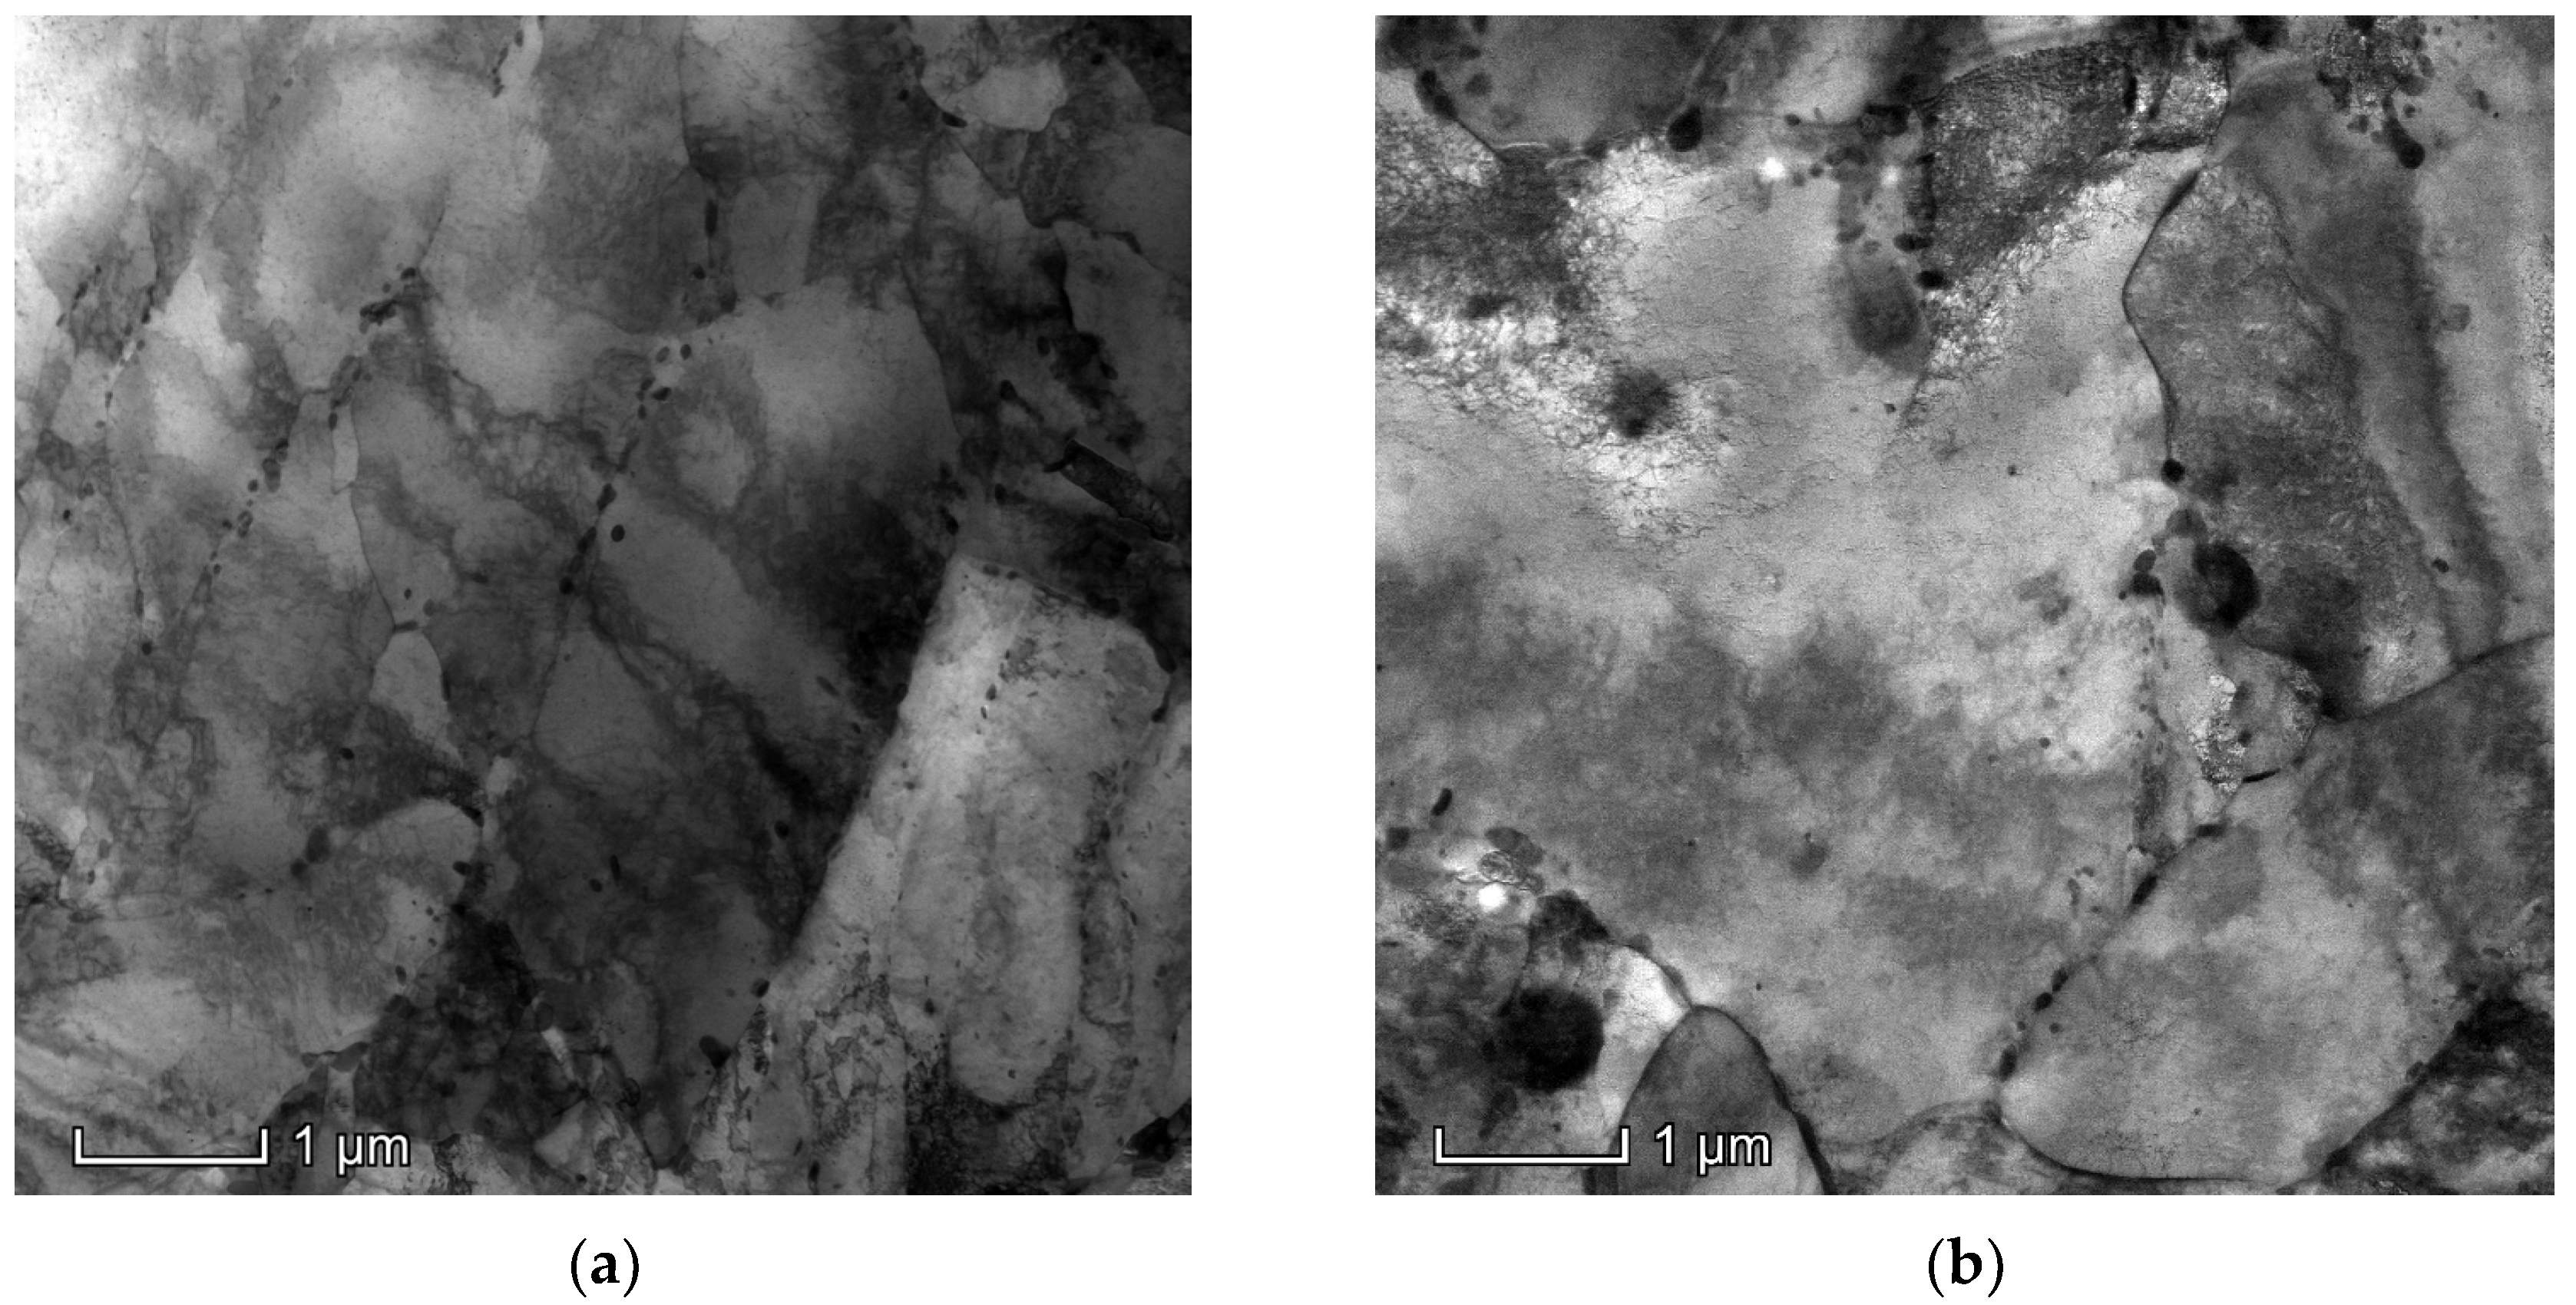
Further microstructural characterization after quenching and tempering with varying nitrogen contents was conducted using TEM, as presented in Figure 7. Following high-temperature tempering, the dislocation density decreased significantly, accompanied by a reduction in dislocation entanglement and delivery. Additionally, subgrain boundaries merged to form larger grains. The M/A component decomposed and vanished, with uniformly distributed precipitated phases emerging at the interfaces, as depicted in Figure 7a. An increase in the nitrogen content led to an augmentation in the percentage of the precipitated phase area, as illustrated in Figure 7b.
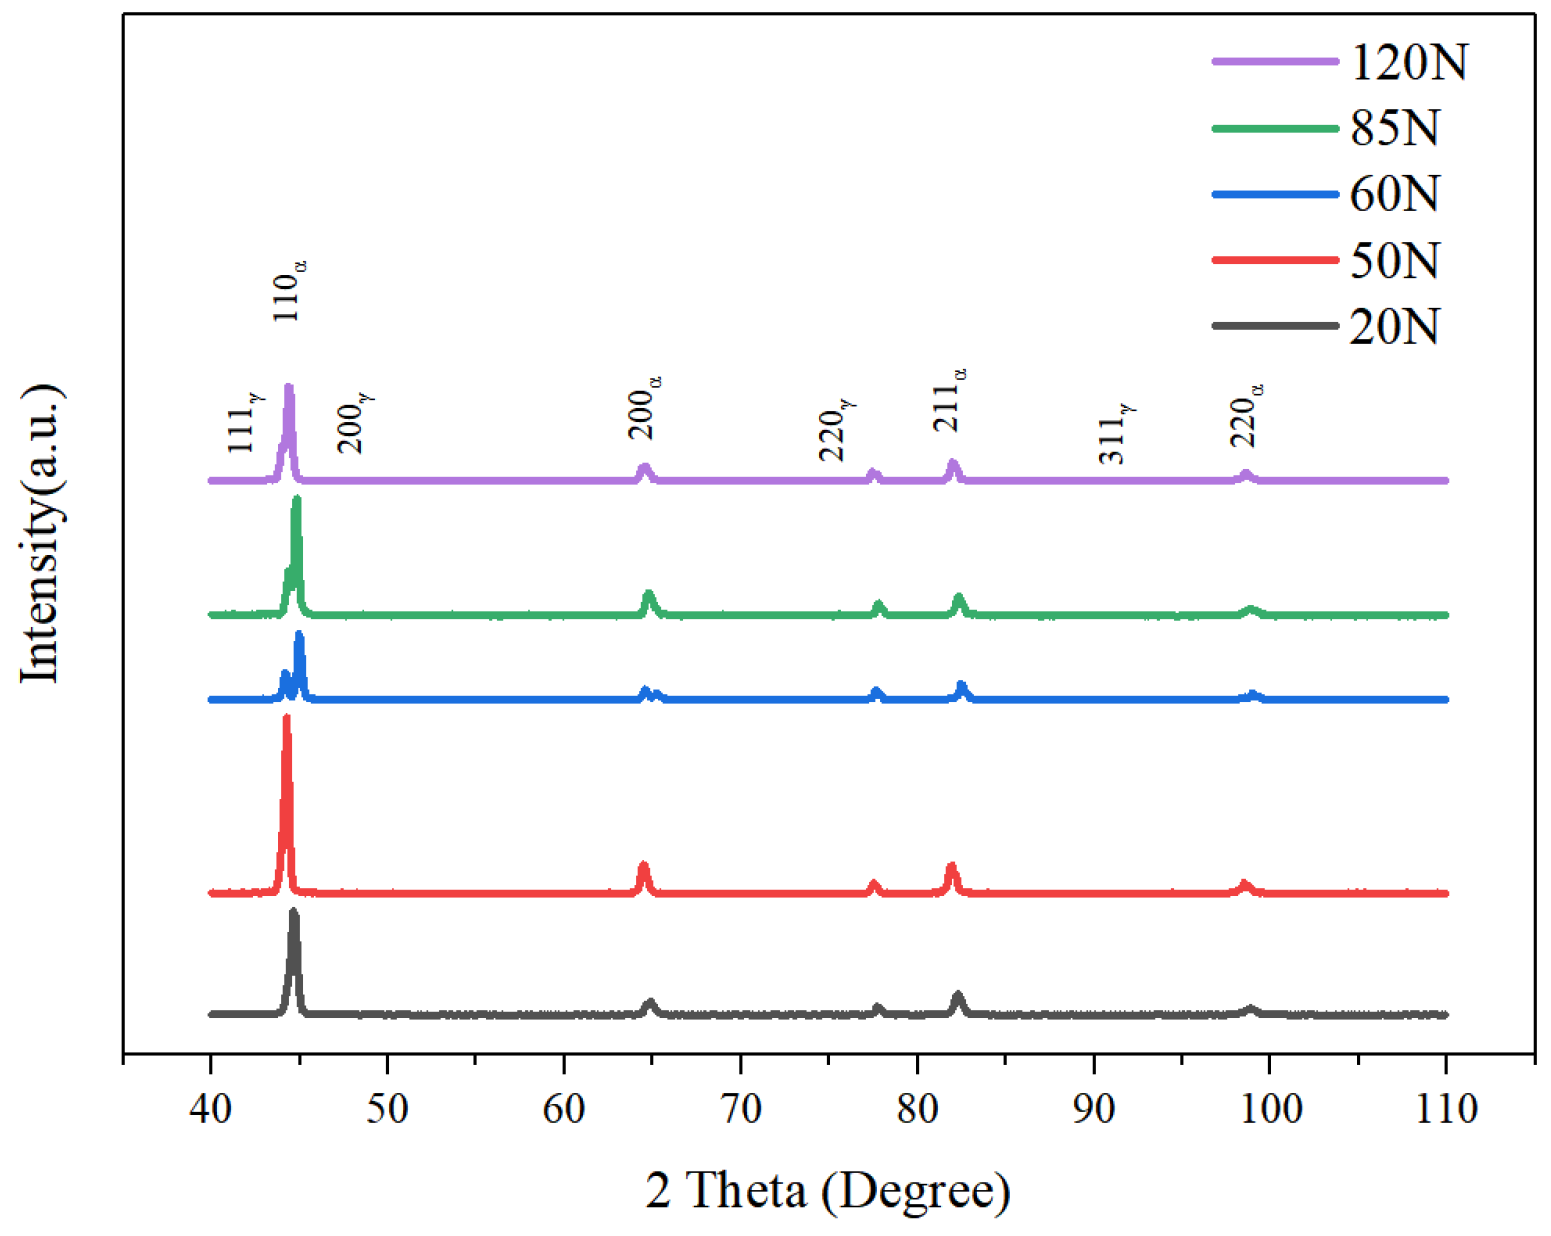
Figure 8 shows the XRD patterns of quenched and tempered samples with different N contents. The XRD patterns reveal that the tested steel is primarily composed of ferrite. For the 60 N, 85 N, 120 N samples, newly emerged diffraction peaks were observed in the proximity of the (110) crystal plane. These peaks are likely indicative of the presence of precipitate phases. Calculation of the dislocation density indicates a slight increase with rising nitrogen content.
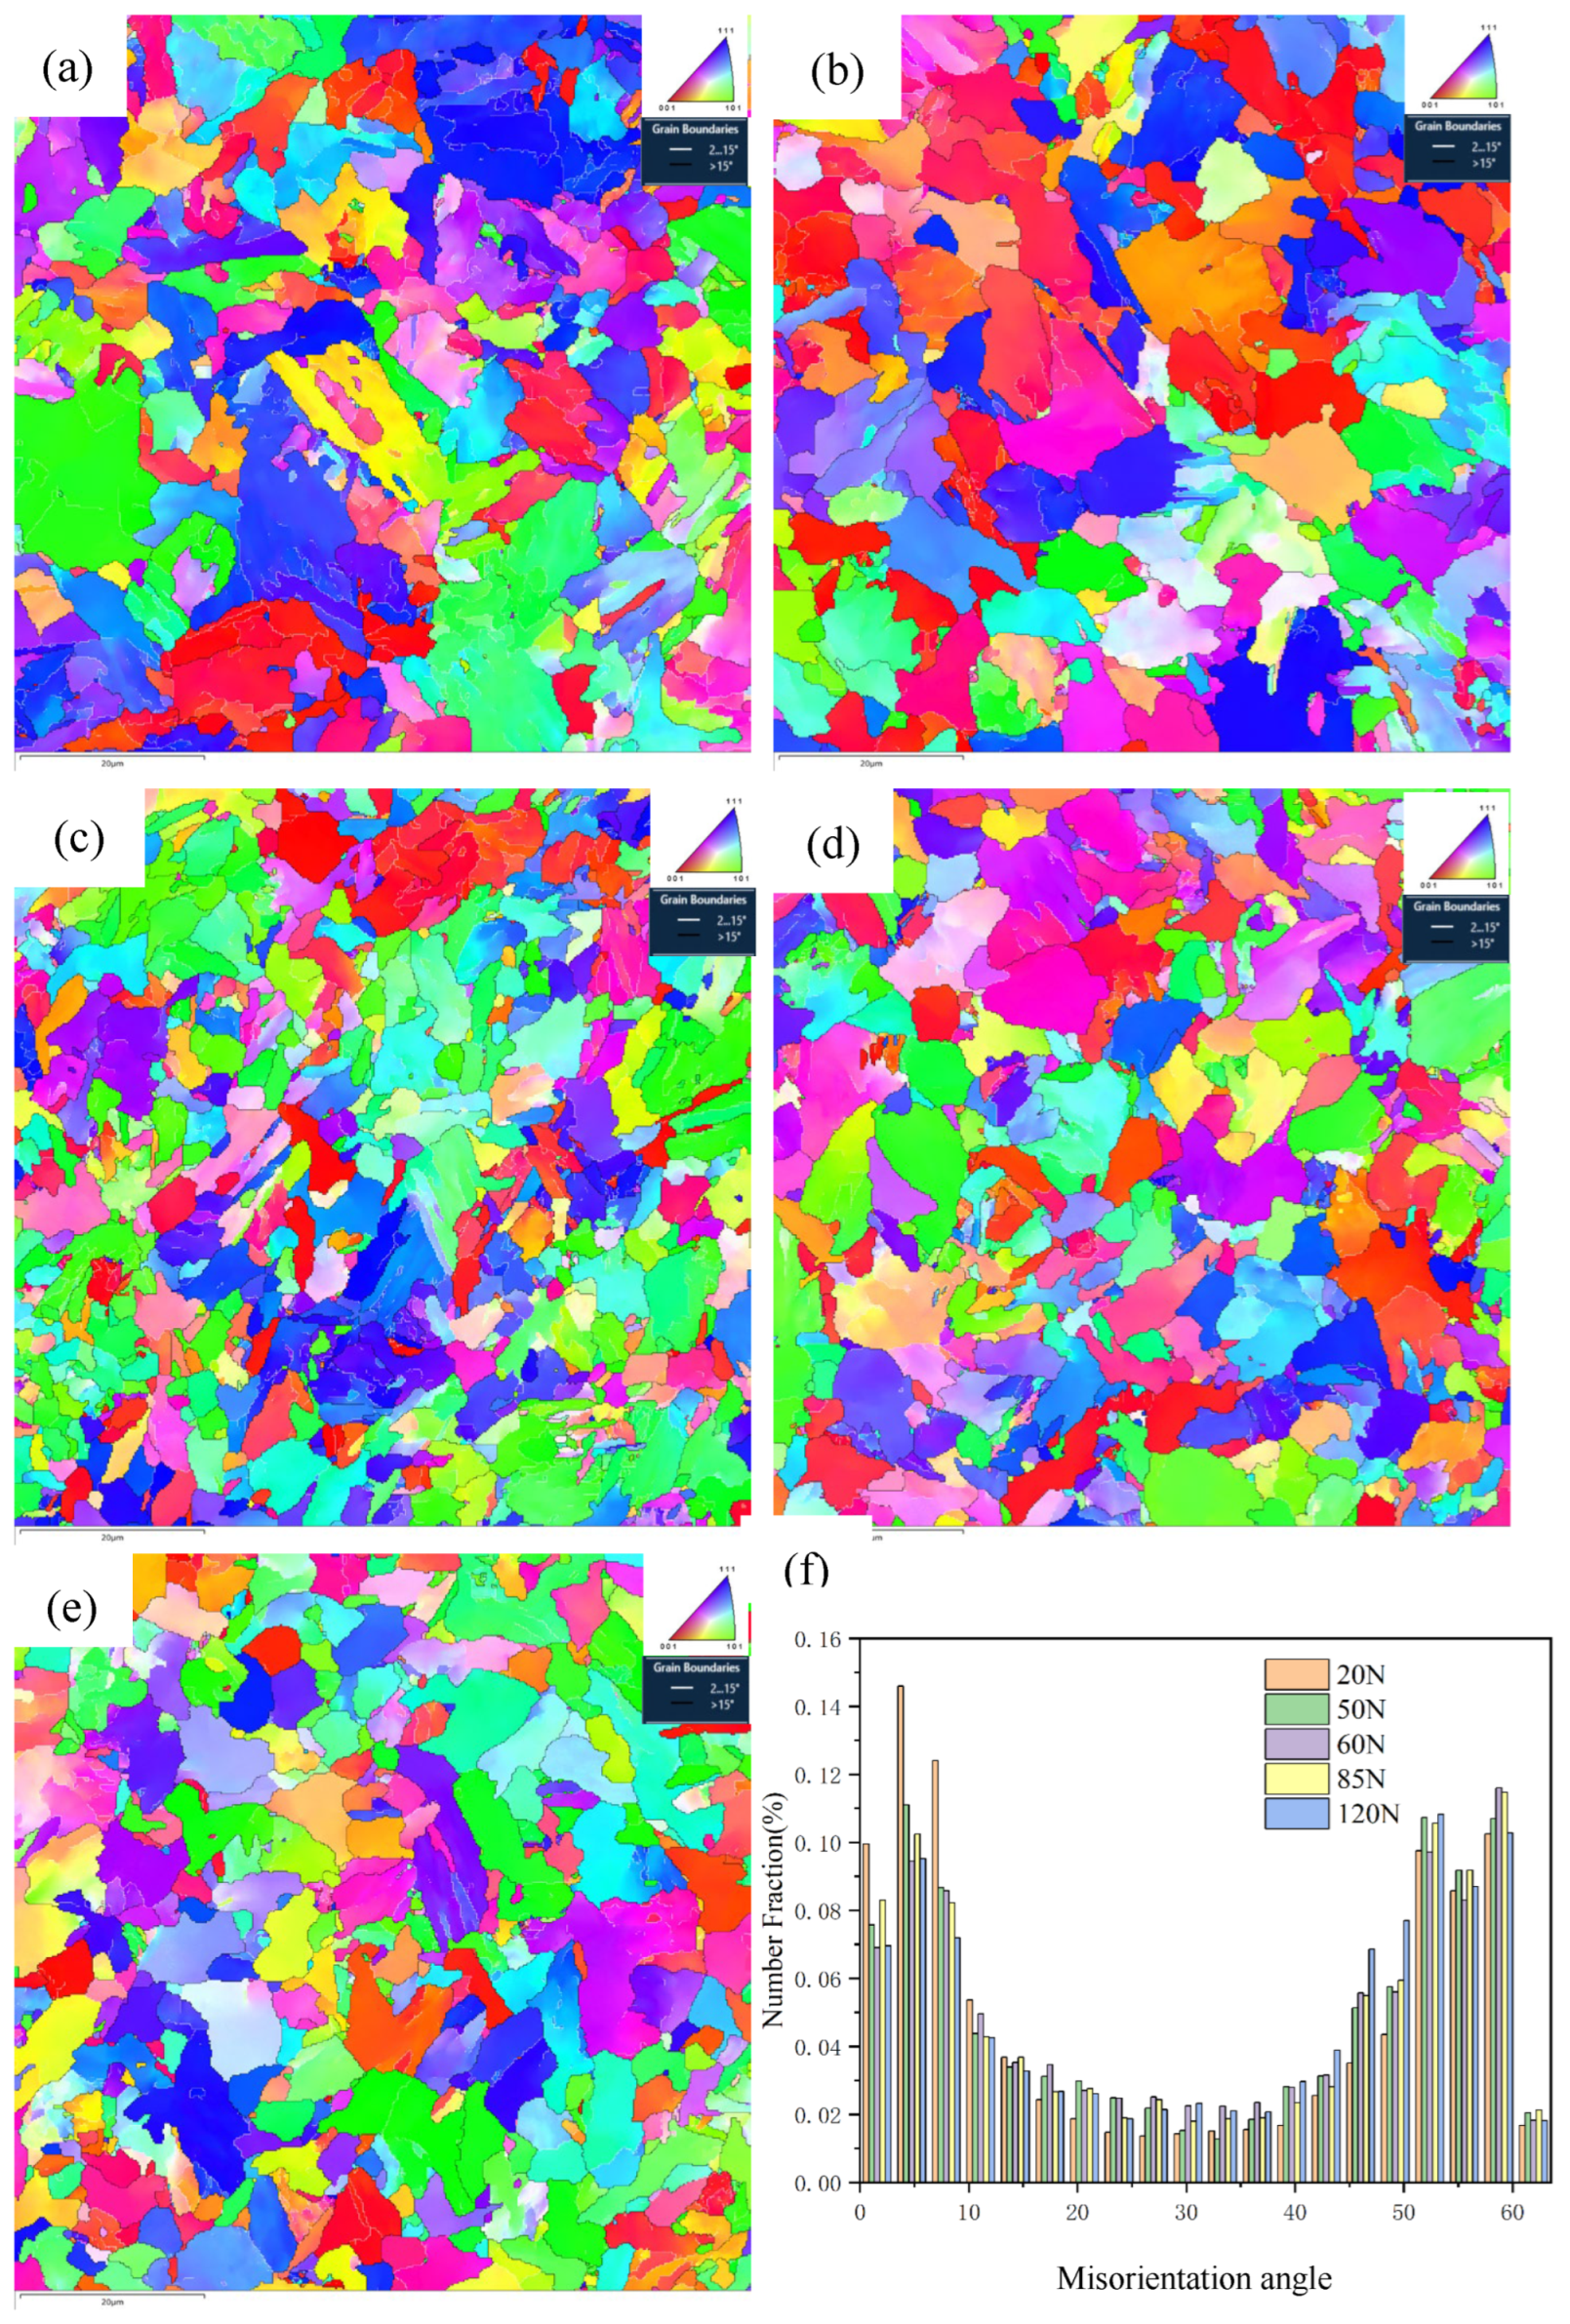
The EBSD images in Figure 9a–e display grain boundaries of varying sizes and angles, where thick and thin lines represent distinct boundary sizes, and different colors signify varying orientation differences (θ). Specifically, the black thick line denotes θ greater than 15°, while the white thin line represents θ between 2 and 15°. Analysis of the orientation difference distribution suggests that, with an increase in nitrogen content after tempering, low-angle grain boundaries gradually decrease, whereas high-angle grain boundaries continue to rise. The proportion of low-angle grain boundaries decreased from 44.3% to 29.8%, as shown in Figure 9f. Furthermore, as the N content increases, the equivalent grain size defined by different orientation angles decreases. Specifically, the equivalent grain size (MED) defined by 2–15° decreases from 5.5 μm to 3.5 μm.

4. Discussion

4.1. Effect of Nitrogen Content on Microstructure Evolution

As depicted in Figure 4 and Figure 5, the microstructure of experimental steels with varying N contents primarily comprises granular bainite ferrite (GBF), acicular ferrite (AF), polygonal ferrite (PF), and martensite/residual austenite (M/A) components. With an increase in nitrogen content, the proportion of granular bainitic ferrite (GBF) decreases, while the contents of AF and M/A exhibit an increase. To elucidate the phase transformation process of the experimental steel, expansion curve tests were performed in Figure 10. As the N content was augmented from 20 ppm to 120 ppm, both the starting temperature (Ar3) and ending temperature (Ar1) of the transformation from austenite to ferrite in the experimental steel were observed to rise. The summary of these results is presented in Table 4. The N element is a potent austenite-stabilizing agent, primarily functioning to retard the transformation of austenite into other phases. It delays the decomposition of austenite during the cooling process, subsequently lowering the transformation temperature (Ar3) from austenite to ferrite (or other phases). This observation contrasts with the focus of this article, which primarily concerns the precipitation of particles within the crystal structure. According to classical nucleation theory, heterogeneous nucleation is more probable than homogeneous nucleation, owing to the lower energy barrier required for heterogeneous nucleation [16,17].
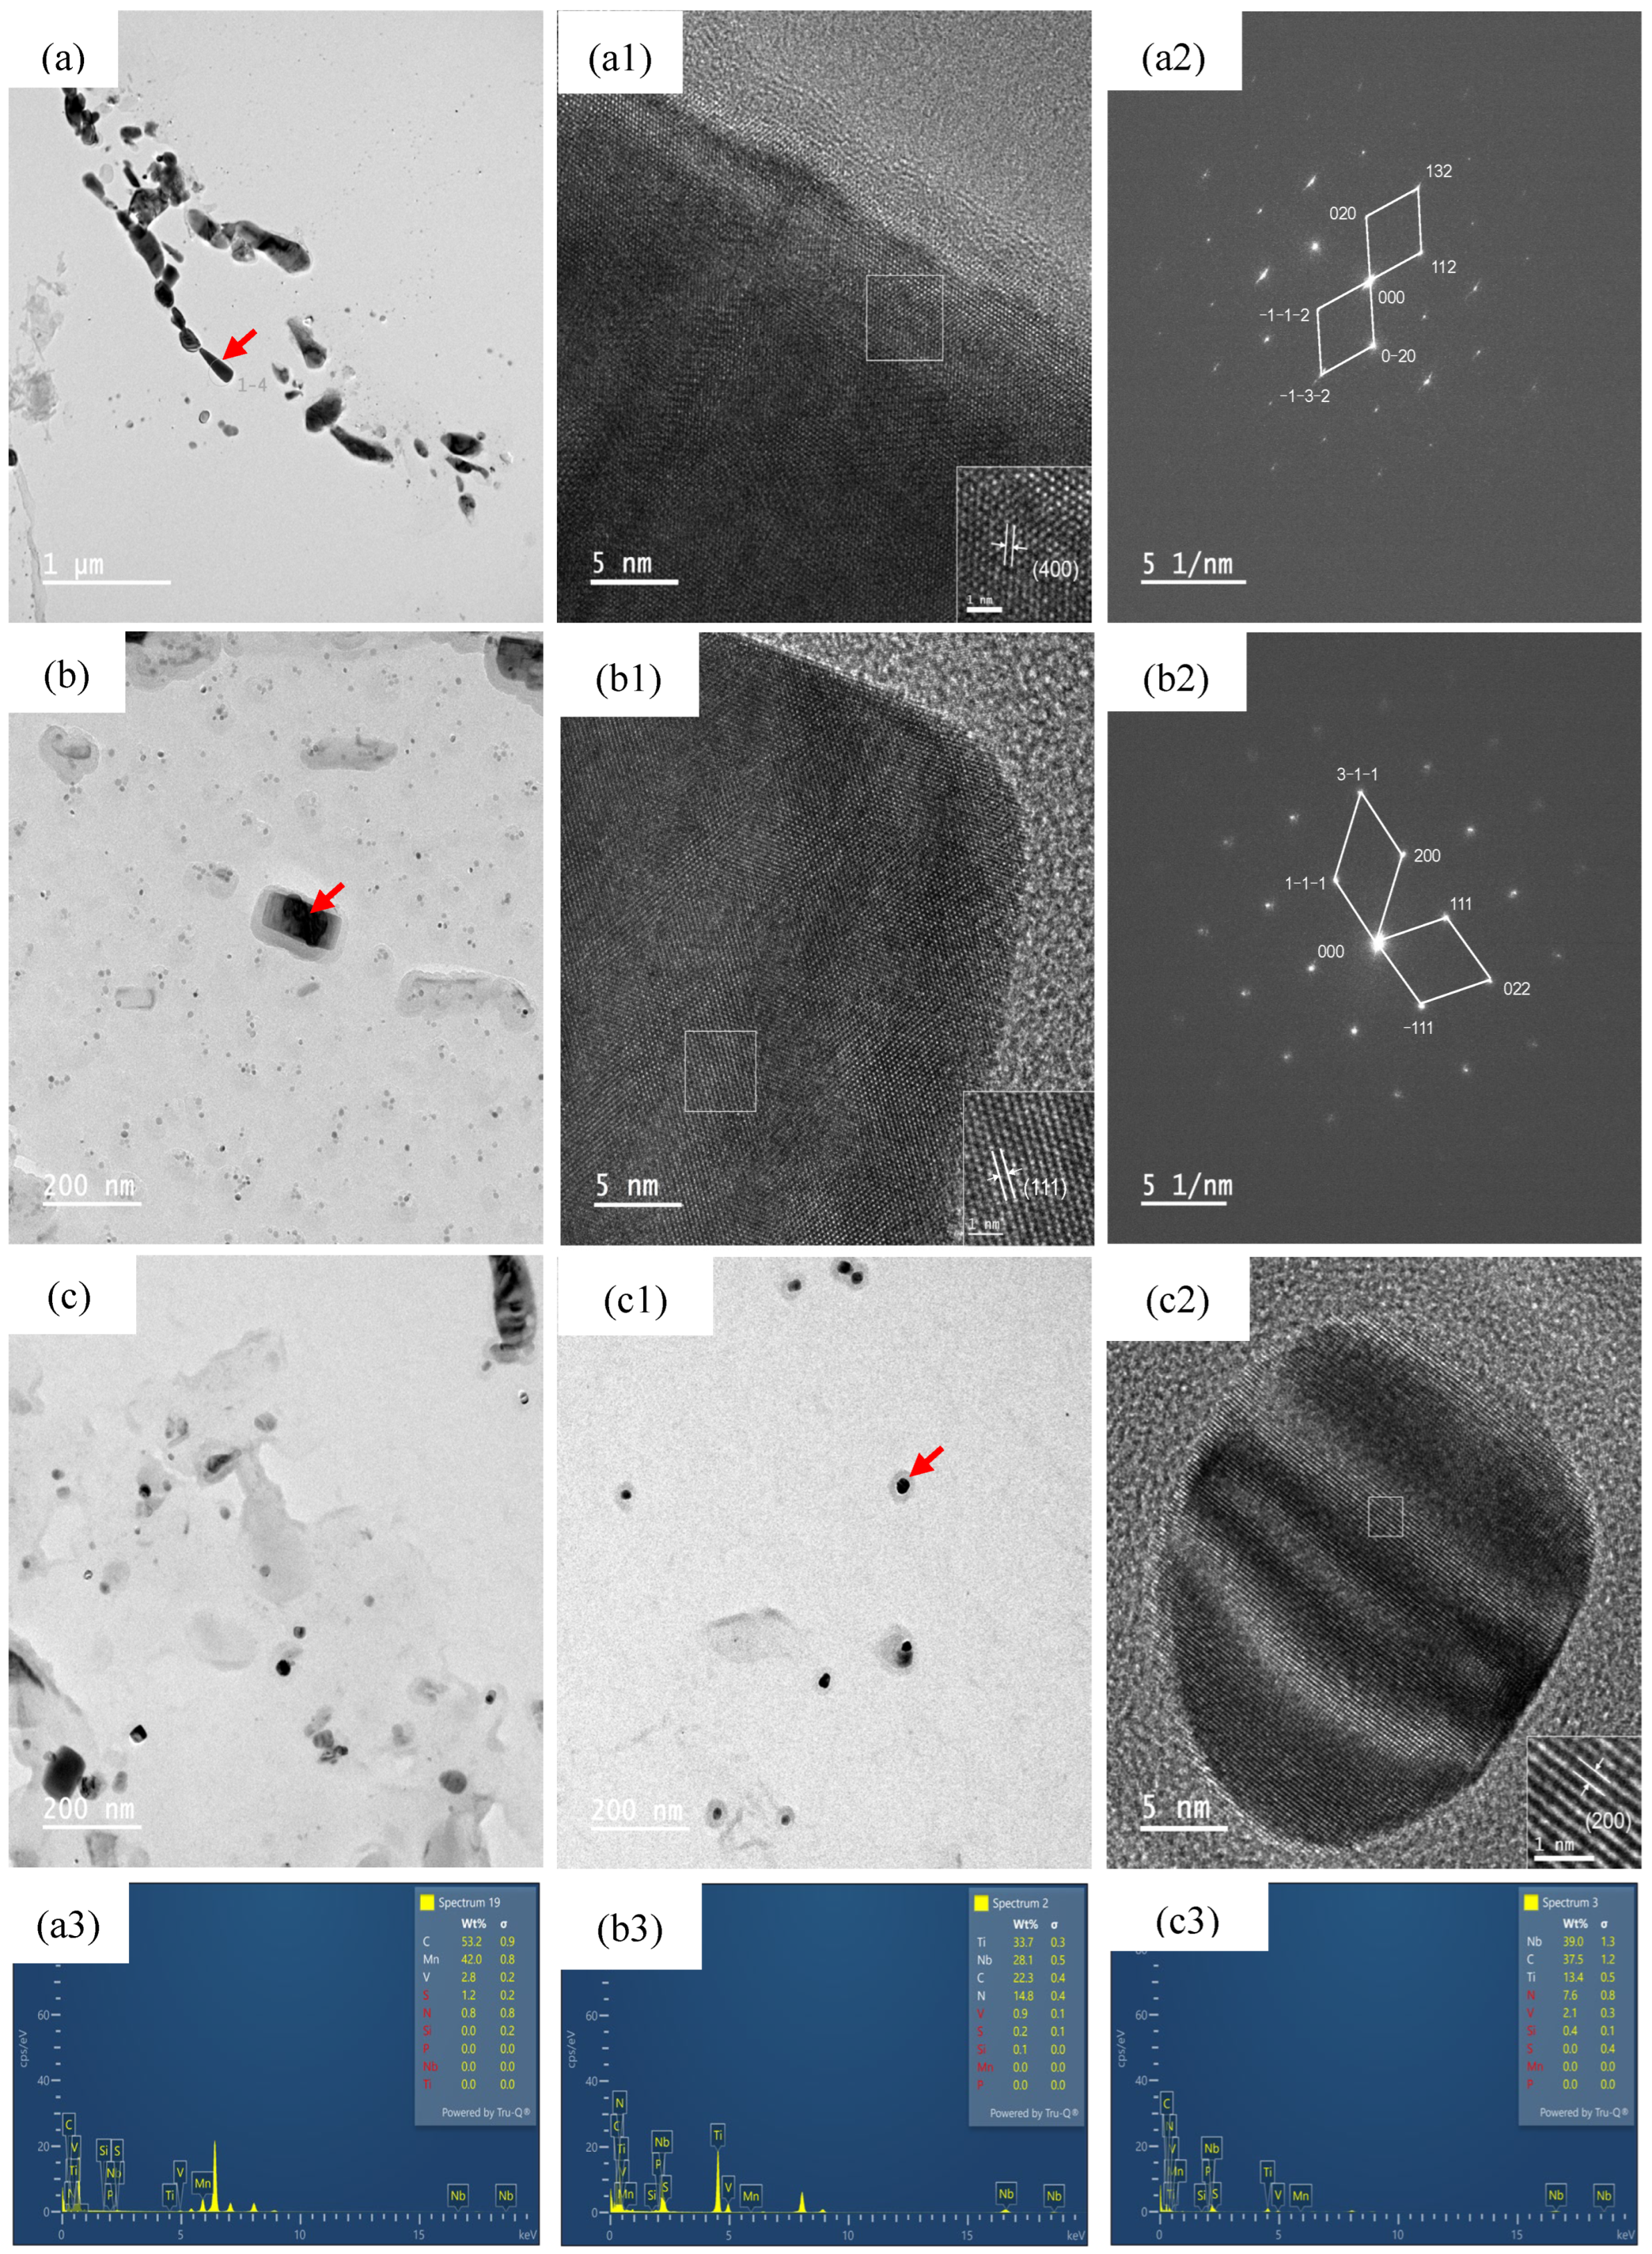
The microstructure of precipitates with different nitrogen contents was further characterized using TEM, as shown in Figure 11a–c. The precipitated phase particles act as nuclei for heterogeneous nucleation in steel, facilitating the formation of ferrite [18]. These particles reduce the energy barrier necessary for ferrite nucleation, enabling ferrite to more easily form around the precipitated phase, which constitutes its thermodynamic foundation [19]. With an increase in nitrogen content, a significant rise in the content of acicular ferrite is observed, primarily associated with the increased number of precipitated particles. As the nitrogen content rises, the precipitation temperature of Ti (C, N) and V (C, N) also increases. Consequently, the number of micro- and nano-scale precipitated particles gradually escalates. Micro-scale (Ti, V) (C, N) or (V, Ti) (C, N) particles can serve as nucleation sites for intragranular acicular ferrite, promoting its nucleation and ultimately elevating the starting transformation temperature (Ar3) from austenite to ferrite.
A large number of micrometer-sized precipitated particles can be observed on the grain boundaries of the original austenite. These include irregularly shaped MnS, approximately elliptical C-rich V(C, N), and a small amount of V-rich (Nb, V)(C, N) particles (Figure 11a,a1,a2,a3), with a size of 0.125 μm, distributed around the grain boundaries. By pinning the original austenite grain boundaries, these particles hinder grain growth and achieve fine grain strengthening. In addition, there are also a small number of square Ti-rich (Nb, V, Ti)(C, N) micron-sized particles distributed on the ferrite matrix, which play a role in precipitation strengthening (Figure 11b,b1,b2,b3). With an increase in nitrogen content, the refinement of primary austenite grains leads to an increase in primary austenite grain boundaries. The grain boundary energy of these primary austenite grain boundaries is relatively high, promoting the nucleation of grain boundary precipitation ferrite (GBPF) on primary austenite grain (PAG) boundaries. At the same time, the increase in effective precipitation particles at the micron level can serve as sites for intragranular acicular ferrite (IGAF) heterogeneous nucleation, thereby promoting ferrite transformation and raising the phase transition point Ar3. As the nitrogen content increases, the amount of carbides decomposed by the martensite/austenite (M/A) component gradually increases, and the distribution of submicron particles on the ferrite matrix becomes more dispersed.
After tempering, a large number of approximately circular NbC-rich (Nb, V, Ti) (C, N) particles with a size range of 5–20 nm can be observed on the ferrite matrix (Figure 11c,c1,c2,c3). These particles, along with a small amount of approximately square TiC-rich (Nb, V, Ti)(C, N) particles that appear with increasing nitrogen content, can hinder dislocation movement and contribute to precipitation strengthening.
From a thermodynamic perspective, when the nitrogen content is the lowest, the phase transition temperature is also the lowest, resulting in the highest degree of phase transition supercooling and a strong nucleation driving force for grain boundary precipitation ferrite (GBF), which promotes its formation in the tissue. As the nitrogen content increases from 20 N to 120 N, the transition temperature Ar3 at the beginning of the phase transition rises from 737 °C to 780 °C, and the degree of supercooling decreases significantly. This allows for more complete diffusion of carbon atoms, which is conducive to the transformation from γ to α. Consequently, with an increase in N element content, the content of acicular ferrite (AF) increases, while the content of granular bainite (GBF) decreases.

4.2. Effect of Nitrogen Content on the Yield Strength

According to Yakubtsov [20], the yield strength of low-carbon bainitic steel after quenching and tempering is influenced by many factors and can be roughly calculated using the following linear formula table:
σt = σ0 + σs + σg + σρ + σp + σM/A
In the formula,
  • σt—yield strength;
  • σ0—lattice strengthening;
  • σs—solid solution strengthening;
  • σg—fine grain strengthening;
  • σρ—dislocation strengthening;
  • σp—precipitation strengthening.
Fine grain strengthening can be quantified using the Hall Petch formula [21], as follows:
σg = σ0 + kHP × d−1/2
In the formula,
  • σg—yield strength;
  • σ0—other enhancements;
  • KHP—correlation coefficient;
  • D—grain size.
The average grain size (MED2° ≤ MTA ≤ 15°) defined by 2~15° is adopted for the grain size d [22]. A straight line is fitted through the relationship between the yield strength and grain size of the experimental steel, as shown in Figure 12. The final strength formula is involves a larger grain size.
Research has shown that there is usually a positive correlation between the yield strength of steel and dislocation density, meaning that the higher the dislocation density, the higher the yield strength. This relationship can be described by some classic theoretical formulas, as shown in Formula (3) [4,23]:
σρ = α × M × G × b × ρ1/2
In the formula,
  • σρ—dislocation strengthening;
  • α—structural constant, taken as 0.15 [4];
  • M—Taylor factor, taken as 2.73 [4];
  • G—shear modulus, taken as 81.6 GPa [4];
  • b—Burgers vector, taken as 0.248 nm;
  • ρ—dislocation density.
These formulas indicate that the yield strength of a material is proportional to the square root of the dislocation density, implying that an increase in dislocation density leads to a corresponding increase in yield strength. The XRD spectra of test steels with different nitrogen contents are presented in Figure 8, while the dislocation density values are listed in Table 3.
As the content of precipitated phase particles increases, the yield strength of steel also increases. This is attributed to the role of precipitated phase particles in hindering dislocation movement within the steel, thereby enhancing its deformation resistance. According to the Ashby–Orowan model, the strengthening effect of second-phase precipitation depends on the volume fraction and size of the second-phase particles. Specifically, under the same volume fraction, smaller precipitated phase particles contribute more significantly to yield strength because they can more effectively hinder dislocation movement, thereby enhancing the yield strength of the steel. Research has demonstrated that the precipitation of high-density (Ti, V)(C, N) in ferrite has a substantial impact on strengthening. Figure 6 and Table 3 confirm the formation of high-density Ti-rich and V-rich particles with an average size of 20–31 nm in the GBF and AF matrix of n-reinforced steel. Consequently, it is essential to consider the strengthening contribution of fine, dispersed precipitates. The expression for precipitation strengthening [20,24] summarizes the quantitative microstructure parameters and all individual strengthening contributions used for strength modeling, as presented in Table 5, respectively.
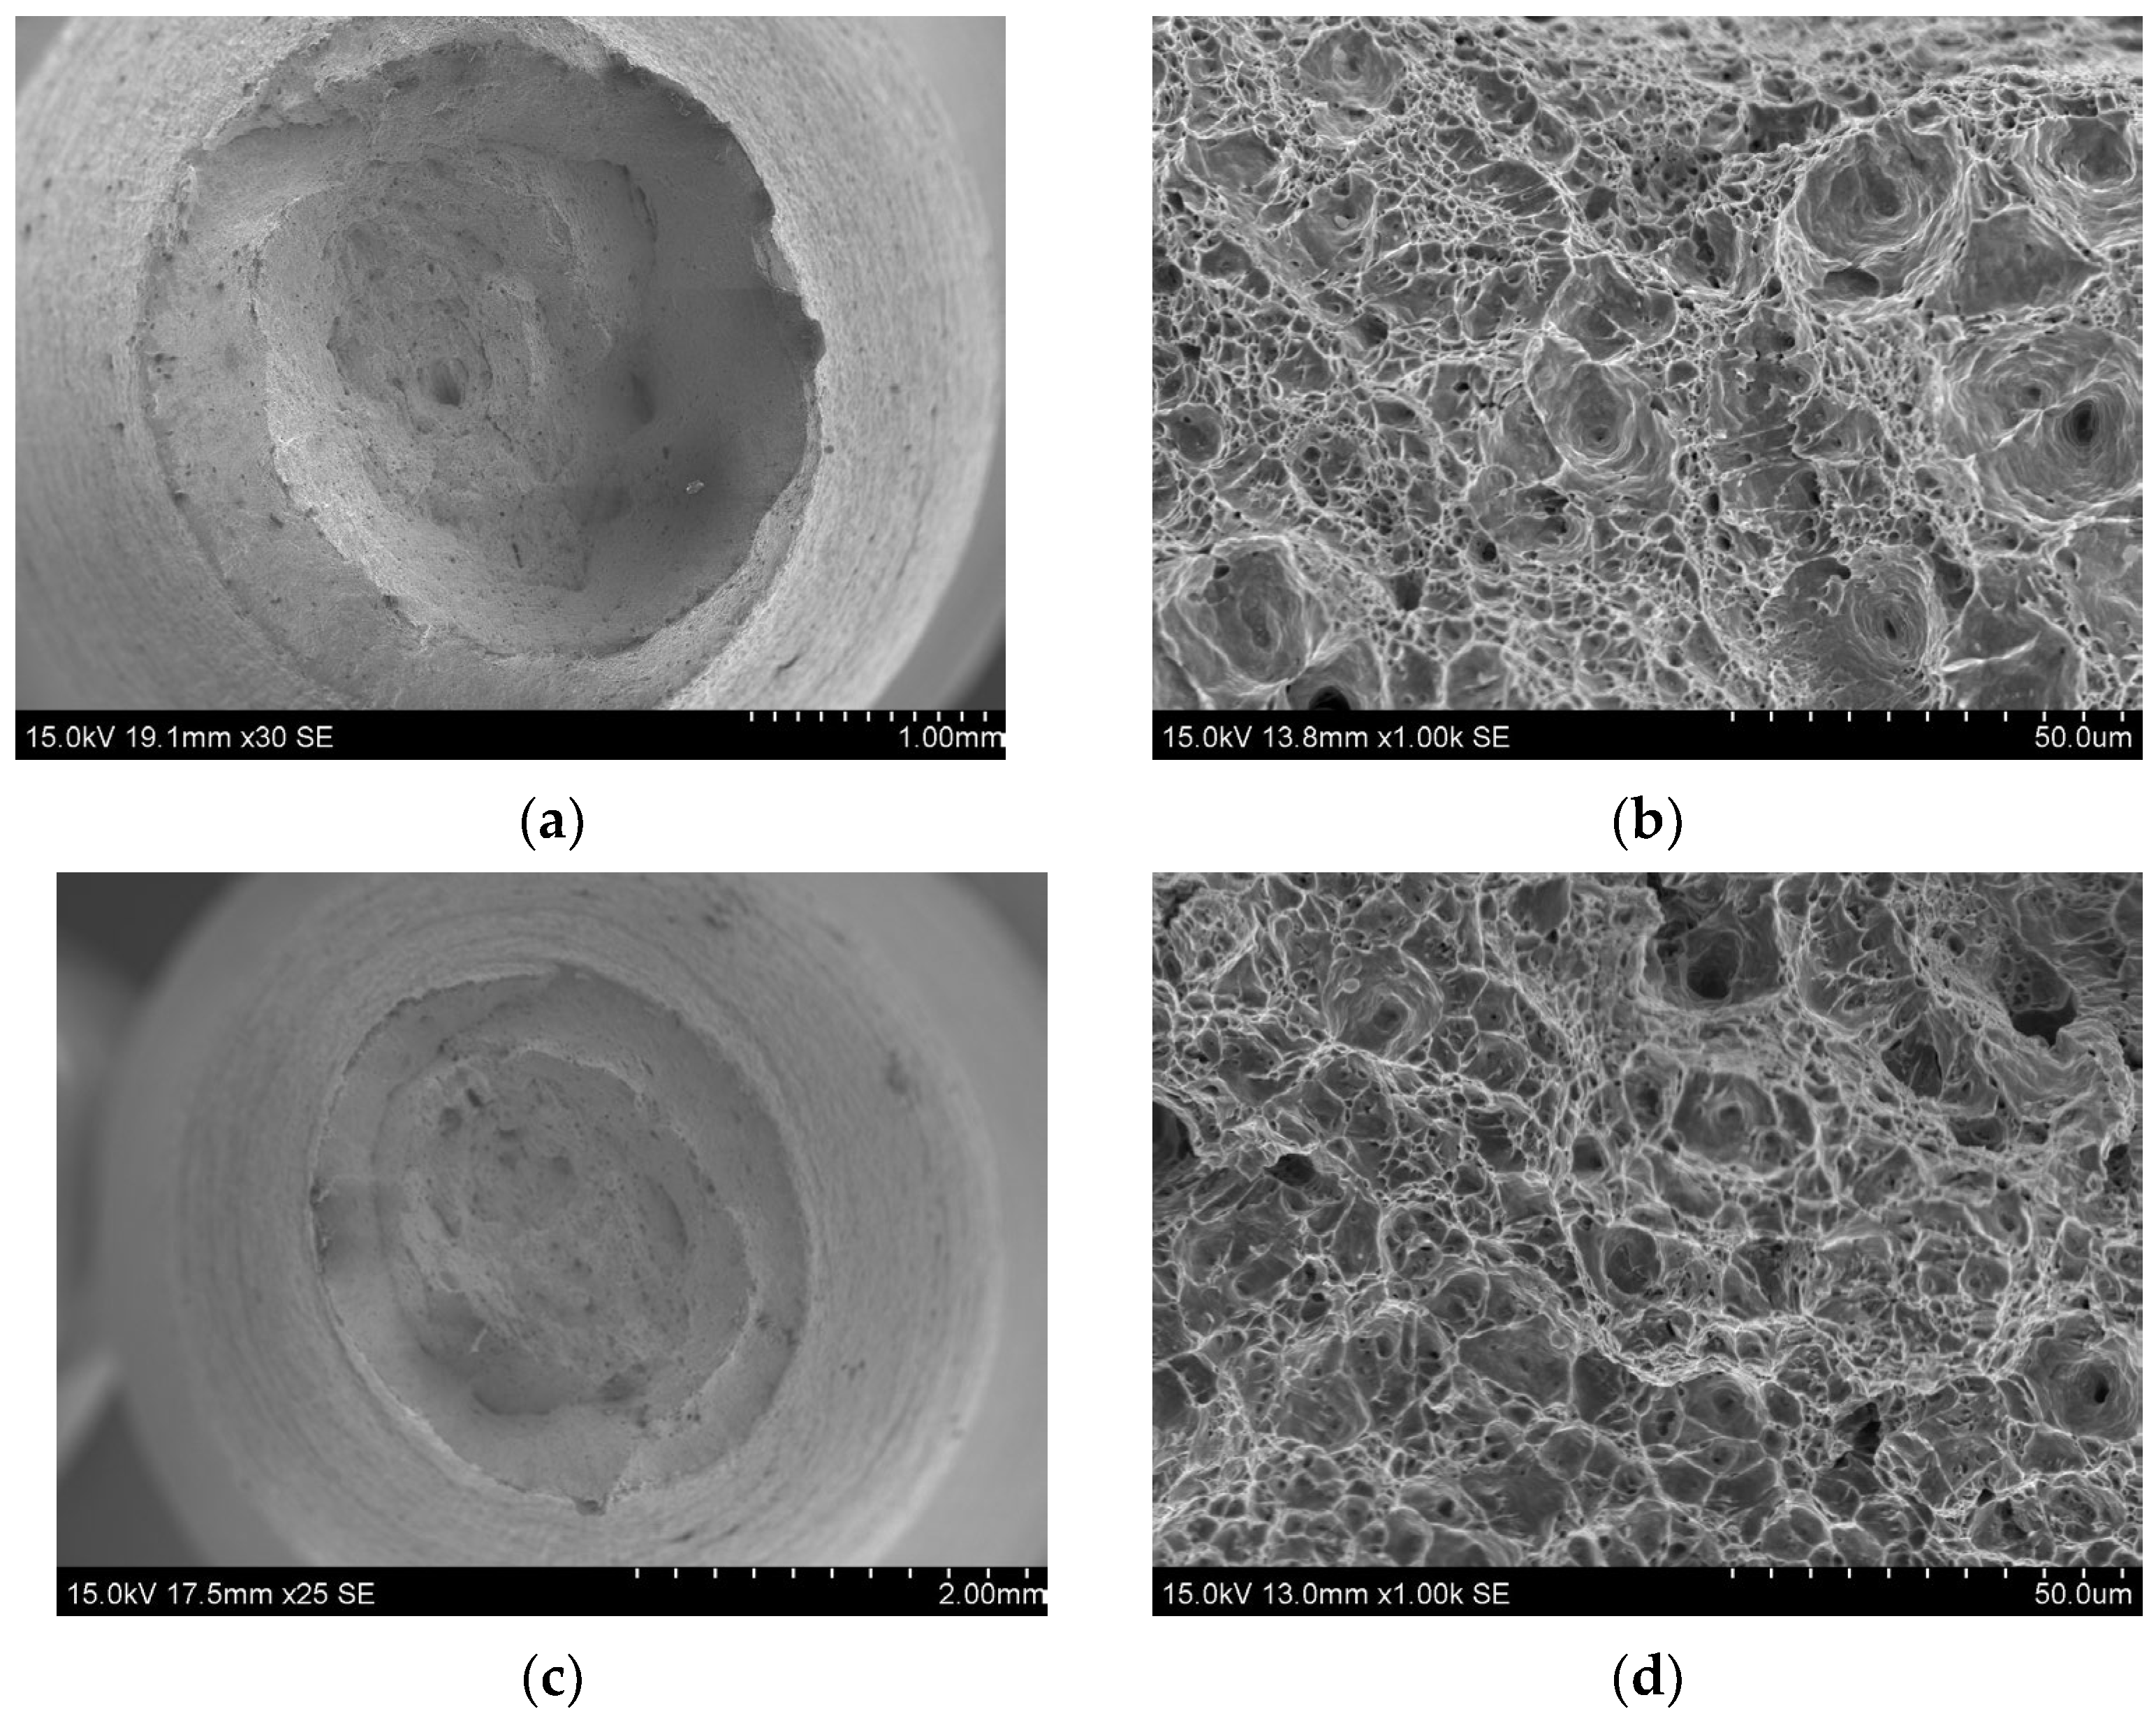
With an increase in nitrogen content, the yield strength of steel continues to improve, primarily due to fine grain strengthening, dislocation strengthening, precipitation strengthening, and other mechanisms. The micro-scale and nano-scale precipitates formed during the quenching and tempering of N-containing steel can effectively pin grain boundaries and refine the microstructure and related substructures, which is mainly manifested as a decrease in AF grain size and an increase in dislocation density. The results indicated that with an increase in nitrogen content, the total yield strength (YS) value increased. The scanning electron micrograph (SEM) of the fracture surface of the tensile specimen is shown in Figure 13. The fracture microstructure of specimens with varying nitrogen (N) content is divided into two parts: fiber zone and shear-lip zone. The fibrous zone of the tensile specimen’s fracture surface is predominantly composed of densely distributed dimple pits, which are direct indicators of plastic deformation. Specifically, when the nitrogen (N) content in the experimental steel reaches 0.002%, the number of dimples within the fibrous zone increases markedly, and their size expands correspondingly. This observation suggests that the experimental steel undergoes a more extensive plastic deformation process prior to fracture. Consequently, specimens containing 0.002% N demonstrate a higher capacity for plastic deformation before fracture, indicating superior plasticity.

5. Conclusions

The present study systematically investigated the influence of varying nitrogen content on the microstructural evolution and tensile properties of Nb-V-Ti-N microalloyed steel following quenching and tempering processes. The investigation led to the formulation of the following key conclusions:
  • The primary microstructure after quenching comprised granular bainitic ferrite (GBF), acicular ferrite (AF), polygonal ferrite (PF), and residual martensite/austenite (M/A) components. As the nitrogen content increased, the content of AF and M/A constituents gradually rose, while that of GBF correspondingly decreased. After tempering, the microstructure transformed into GBF, AF, and carbonitrides. The increase in nitrogen content led to a significant increase in the number of high-angle grain boundaries.
  • With rising nitrogen content, the yield strength (YS) and ultimate tensile strength (UTS) of the steel gradually increased. Specifically, YS increased from 510 MPa to 576 MPa, and UTS from 605 MPa to 681 MPa, as nitrogen content varied from 20 ppm to 120 ppm. However, the elongation at break (TE) slightly decreased from 16.4% to 15.4%. The enhancement in yield strength can be attributed to multiple strengthening mechanisms, including fine grain strengthening, dislocation strengthening, and precipitation strengthening.
  • Nitrogen addition led to the formation of a larger number of micro- and nano-scale precipitated particles, such as (Nb, V, Ti)(C, N), which refined the microstructure and served as nucleation sites for intragranular AF, enhancing the nucleation and growth of ferrite phases.

Author Contributions

Conceptualization, J.L. and K.G.; methodology, H.M. and C.Z.; software, H.M. and J.W.; validation, K.G., J.H. and Q.W.; formal analysis, J.H., C.Z. and T.W.; investigation, J.L.; resources, T.W. and Q.W.; data curation, J.W.; writing—original draft preparation, J.L.; writing—review and editing, K.G.; visualization, H.M. and J.H.; supervision, T.W. and Q.W.; project administration, K.G.; funding acquisition, K.G. All authors have read and agreed to the published version of the manuscript.

Funding

This work was supported by the Education Department Science Research project of Henan under Grant No. 222300420169.

Data Availability Statement

The raw data supporting the conclusions of this article will be made available by the authors on request.

Conflicts of Interest

Author Jiangcheng and Chuanyou Zhang were employed by the company Technical Center, Tianjin Pipe (Group) Corporation Limited. The remaining authors declare that the research was conducted in the absence of any commercial or financial relationships that could be construed as a potential conflict of interest

References

  1. Fang, B.; Hui, W.; Song, H.; Zhang, Y.; Zhao, X.; Xu, L. Hydrogen embrittlement of a V+Nb-microalloyed medium-carbon bolt steel subjected to different tempering temperatures. Int. J. Hydrog. Energy 2024, 81, 458–470. [Google Scholar] [CrossRef]
  2. Xu, G.; Gan, X.; Ma, G.; Luo, F.; Zou, H. The development of Ti-alloyed high strength microalloy steel. Mater. Des. 2010, 31, 2891–2896. [Google Scholar] [CrossRef]
  3. Korchynsky, M. Nitrogen Enhanced Ferritic Microalloyed Steels. In Proceedings of the High Nitrogen Steels International Conference, Jiuzhaigou, China, 29–31 August 2006; pp. 1–12. [Google Scholar]
  4. Zhang, S.; Liu, K.; Chen, H.; Xiao, X.; Qingfeng, W.; Fucheng, Z. Effect of increased N content on microstructure and tensile properties of low-C V-microalloyed steels. Mater. Sci. Eng. A 2016, 651, 951–960. [Google Scholar] [CrossRef]
  5. Staiger, M.P.; Jessop, B.; Hodgson, P.D.; Davies, C.H.J. Effect of nitrogen on formation of martensite-austenite constituent in low carbon steels. ISIJ Int. 1999, 39, 183–190. [Google Scholar] [CrossRef]
  6. Shi, Z.; Yang, C.; Wang, R.; Su, H.; Chai, F.; Chu, J.; Wang, Q. Effect of nitrogen on the microstructures and mechanical properties in simulated CGHAZ of vanadium microalloyed steel varied with different heat inputs. Mater. Sci. Eng. A 2016, 649, 270–281. [Google Scholar] [CrossRef]
  7. Chen, H.; Zhang, S.; Shi, G.; Gao, Y.; Qingfeng, W.; Fucheng, Z. Mechanism of increased N content in controlling the M-A constituent of low-carbon Mo-V-N steel. Mater. Lett. 2017, 189, 136–139. [Google Scholar] [CrossRef]
  8. Shi, G.; Luo, B.; Zhang, S.; Wang, Q.; Qingfeng, W. Microstructural evolution and mechanical properties of a low-carbon V–N–Ti steel processed with varied isothermal temperatures. Mater. Sci. Eng. A 2021, 801, 140396. [Google Scholar] [CrossRef]
  9. Rogachev, S.O.; Nikulin, S.A.; Khatkevich, V.M. Increasing the strength of low-carbon steel after overheating. Mater. Lett. 2024, 377, 137510. [Google Scholar] [CrossRef]
  10. Xiong, Z.; Liu, S.; Wang, X.; Kang, J. The contribution of intragranular acicular ferrite microstructural constituent on impact toughness and impeding crack initiation and propagation in the heat-affected zone (HAZ) of low-carbon steels. Mater. Sci. Eng. A 2015, 636, 117–123. [Google Scholar] [CrossRef]
  11. Choi, J.Y.; Ji, J.H.; Hwang, S.W.; Park, K.T. Effects of nitrogen content on TRIP of Fe–20Cr–5Mn–xN duplex stainless steel. Mater. Sci. Eng. A 2012, 534, 673–680. [Google Scholar] [CrossRef]
  12. Zajac, S.; Siwecki, T.; WB, H.; Lagneborg, R. Strengthening mechanisms in vanadium microalloyed steels intended for long products. ISIJ Int. 1998, 38, 1130–1139. [Google Scholar] [CrossRef]
  13. Zhao, B.; Zhao, T.; Li, G.; Lu, Q. Effect of Nitrogen on Transformation Behaviors and Microstructure of VN Microalloyed Steel. In HSLA Steels 2015 Microalloying 2015 & Offshore Engineering Steels 2015; Springer International Publishing: Cham, Switzerland, 2016; pp. 135–141. [Google Scholar]
  14. Zhang, L.; Kannengiesser, T. Austenite grain growth and microstructure control in simulated heat affected zones of microalloyed HSLA steel. Mater. Sci. Eng. A 2014, 613, 326–333. [Google Scholar] [CrossRef]
  15. Wu, K.M.; Yokomizo, T.; Enomoto, M. Three-dimensional Morphology and Growth Kinetics of Intragranular Ferrite Idiomorphs Formed in Association with Inclusions in an Fe-C-Mn Alloy. ISIJ Int. 2002, 42, 1144–1149. [Google Scholar] [CrossRef]
  16. Park, K.-T.; Hwang, S.W.; Ji, J.H.; Lee, C.H. Inclusions nucleating intragranular polygonal ferrite and acicular ferrite in low alloyed carbon manganese steel welds. Met. Mater. Int. 2011, 17, 349–356. [Google Scholar] [CrossRef]
  17. Fan, H.; Shi, G.; Peng, T.; Wang, Q.; Wang, L.; Wang, Q.; Zhang, F. N-induced microstructure refinement and toughness improvement in thecoarse grain heat-affected zone of a low carbon Mo–V–Ti–B steel subjected to a high heat input welding thermal cycle. Mater. Sci. Eng. A 2021, 824, 141799. [Google Scholar] [CrossRef]
  18. Karmakar, A.; Kundu, S.; Roy, S.; Neogy, S.; Srivastava, D.; Chakrabarti, D. Effect of microalloying elements on austenite grain growth in Nb–Ti and Nb–V steels. Mater. Sci. Technol. 2014, 30, 653–664. [Google Scholar] [CrossRef]
  19. Zhang, J.; Xin, W.; Luo, G.; Wang, R.; Meng, Q.; Xian, S. Effect of welding heat input on microstructural evolution, precipitation behavior and resultant properties of the simulated CGHAZ in high-N V-alloyed steel. Mater. Charact. 2020, 162, 110201. [Google Scholar] [CrossRef]
  20. Hall, E. The Deformation and Ageing of Mild Steel: III Discussion of Results. Proc. Phys. Soc. Sect. B 1951, 64, 747–753. [Google Scholar] [CrossRef]
  21. Yakubtsov, I.; Poruks, P.; Boyd, J. Microstructure and mechanical properties of bainitic low carbon high strength plate steels. Mater. Sci. Eng. A 2008, 480, 109–116. [Google Scholar] [CrossRef]
  22. Kaijalainen, A.J.; Suikkanen, P.P.; Limnell, T.J.; Karjalainen, L.P.; Kömi, J.I.; Porter, D.A. Effect of austenite grain structure on the strength and toughness of direct-quenched martensite. J. Alloys Compd. 2013, 577, S642–S648. [Google Scholar] [CrossRef]
  23. Hughes, D. Microstructure evolution, slip patterns and flow stress. Mater. Sci. Eng. A 2001, 319–321, 46–54. [Google Scholar] [CrossRef]
  24. Wang, G.R.; Lau, T.W.; Weatherly, G.C.; North, T.H. Weld thermal cycles and precipitation effects in Ti-V-containing HSLA steels. Met. Mater. Trans. A 1989, 20, 2093–2100. [Google Scholar] [CrossRef]
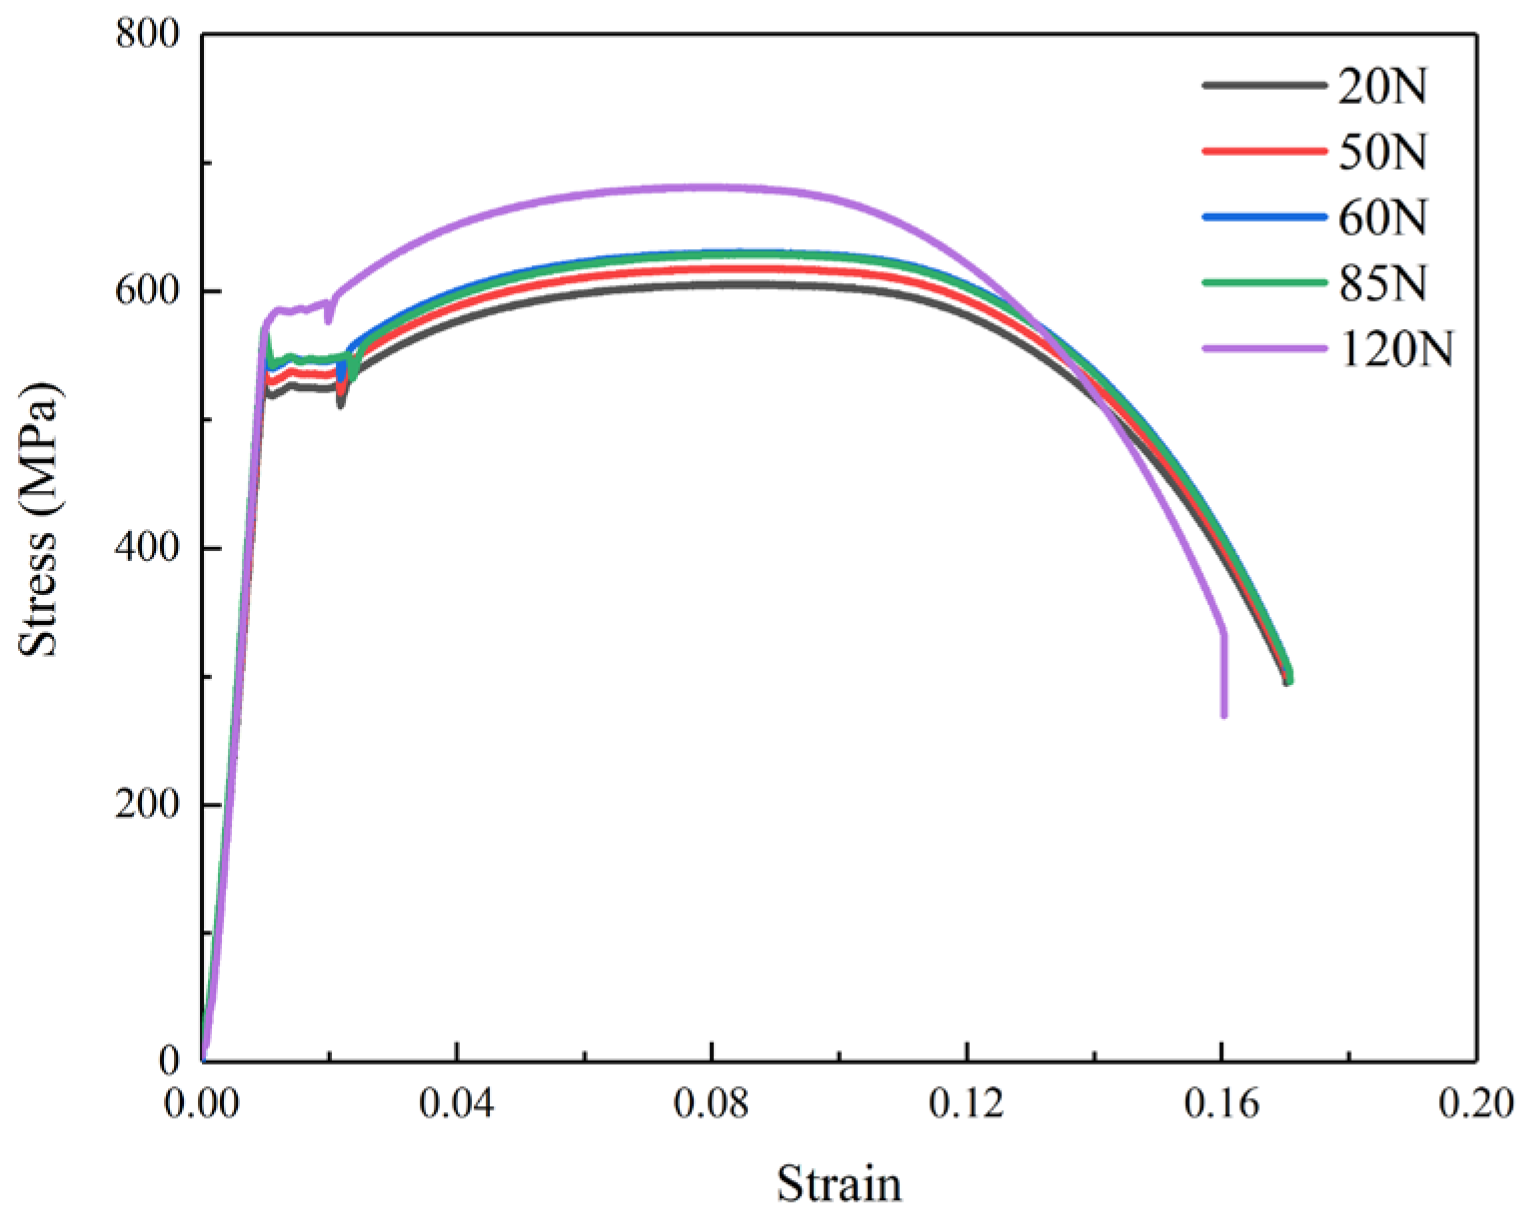
Figure 1. The room temperature tensile strain–stress curve with varying N contents.
Metals 15 00266 g001
Figure 2. Optical microscopy images captured for samples: (a,b) at 30 N; (c,d) at 120 N.
Metals 15 00266 g002
Figure 3. Typical TEM results of samples with different N contents: (a,a1) 20 N, (b,b1) 50 N, and (c,c1) 85 N; (d,d1) 120 N, including (e,f) dark-field image, and (g) selected diffraction pattern.
Metals 15 00266 g003
Figure 4. The XRD patterns of quenched samples with different N contents.
Metals 15 00266 g004
Figure 5. Optical microscopy images captured for samples after quenching and tempering treatment: (a,c) at 20 N; (b,d) at 120 N.
Metals 15 00266 g005
Figure 6. Scanning electron micrograph images captured for samples after quenching and tempering treatment: (a) 20 N; (b) 60 N.
Metals 15 00266 g006
Figure 7. Typical TEM results of samples with different N contents: (a) 20 N; (b) 120 N.
Metals 15 00266 g007
Figure 8. The XRD patterns of quenched and tempered treatment samples with different N contents.
Metals 15 00266 g008
Figure 9. Inverse pole figure images captured for samples after quenching and tempering treatment: (a) 20 N, (b) 50 N, (c) 60 N, (d) 85 N, (e) 120 N; (f) number fraction distribution of boundaries misorientation.
Metals 15 00266 g009
Figure 10. Thermal expansion curve of test steel with different N contents.
Metals 15 00266 g010
Figure 11. TEM images of precipitated particles for samples after quenching and tempering treatment: (a,a1,a2,a3) 20 N, (b,b1,b2,b3) 50 N and (c,c1,c2,c3) 120 N.
Metals 15 00266 g011
Figure 12. A straight line is fitted through the relationship between the yield strength and grain size of the experimental steel.
Metals 15 00266 g012
Figure 13. Typical observations of tensile fracture morphology: (a,b) 20 N; (c,d) 120 N.
Metals 15 00266 g013
Table 1. Chemical compositions of steels with different N contents (wt%).
Steel CMnSiSPMoCrVTiNbNiBN
20 N0.091.190.230.0020.0020.140.130.0430.0120.0270.150.00040.0018
50 N0.081.220.270.0030.0110.160.140.0500.0120.0320.130.00030.0048
60 N0.091.260.230.0030.0090.160.140.0500.0140.0300.130.00040.0059
85 N0.101.240.260.0020.0020.150.160.0480.0100.0310.150.00040.0085
120 N0.101.240.260.0020.0020.150.160.0480.0100.0310.150.00030.0120
Table 2. Summary of tensile properties of steel with different n content tests.
SteelYS/MPaUTS/MPaTE
20 N51060516.4
50 N52161716.4
60 N53163016.4
85 N53262916.5
120 N57668115.4
YS—yield strength; UTS—ultimate tensile strength; TE—total elongation.
Table 3. Summary of microstructure observations and quantifications.
SteelfM/A (%)f2° ≤ θ ≤ 15°
(%)
MED2° ≤ θ ≤ 15°
(μm)
Dp
(nm)
fp (%)ρ (×1014 m−2)
2012.644.35.159.150.68 × 10−42.79
5013.233.74.879.600.80 × 10−42.84
6013.631.84.539.650.86 × 10−42.78
8515.331.34.4210.381.01 × 10−42.48
12016.229.83.3413.691.65 × 10−42.54
fM-A—area fraction of M/A constituent, f2° ≤ θ ≤ 15°—fraction of boundaries, MED2° ≤ θ ≤ 15°—mean equivalent diameter, Dp—mean equivalent diameter of the precipitates, fp—volume fraction of the precipitates; ρ—density of dislocations.
Table 4. Starting temperature Ar3 and ending temperature Ar1 of test steel with different N contents.
SteelAr3/°CAr1/°C
20 N737475
50 N760485
60 N770487
85 N772461
120 N780500
Table 5. Enhanced contributions of various microstructural features.
SteelYS/MPaσg (MED) (MPa)σρ
(MPa)
σp
(MPa)
σ0 + σs
20 N510.89265.60138.529.6277.17
50 N521.32273.12139.5831.177.52
60 N531.74283.19138.1132.2378.21
85 N532.24289.99130.6233.2678.37
120 N576.37328.80131.9735.280.40
Disclaimer/Publisher’s Note: The statements, opinions and data contained in all publications are solely those of the individual author(s) and contributor(s) and not of MDPI and/or the editor(s). MDPI and/or the editor(s) disclaim responsibility for any injury to people or property resulting from any ideas, methods, instructions or products referred to in the content.