Article

Warm and Hot Deformation Behavior of AA6060 Aluminum Alloy

by
Cinzia Menapace
* and
Giovanni Straffelini
Department of Industrial Engineering, University of Trento, Via Sommarive 9, 38123 Trento, Italy
*
Author to whom correspondence should be addressed.
Metals 2025, 15(3), 224; https://doi.org/10.3390/met15030224
Submission received: 8 January 2025 / Revised: 10 February 2025 / Accepted: 13 February 2025 / Published: 20 February 2025

Abstract

The warm and hot deformation behavior of a 6060 aluminum alloy was investigated through compression tests conducted at temperatures ranging from 100 °C to 400 °C (homologous temperature range of 0.41–0.75) and strain rates of 0.001 and 0.1 s−1. The flow stresses were correlated with strain rate and temperature using a hyperbolic sine equation, and the activation energy was calculated for both deformation regimes. The modeling parameters were linked to the active plastic deformation mechanisms: strain hardening in the warm regime and dynamic recrystallization in the hot regime. A strong correlation between the experimental and calculated data was observed when the equation was applied separately to the stresses measured in the warm and hot temperature ranges.

1. Introduction

While hot deformation processes of aluminum alloys are widely used in modern industry and have been studied by scientists, warm deformation has not been extensively investigated. The interest towards warm processes derives from the reduction in flow stress, increase in ductility, reduction in work hardening, and increase in toughness of the alloy when compared with cold working. Moreover, the use of temperatures lower than those involved in hot working make it easier to respect close tolerances and obtain high surface finishing [1]. Lastly, since the temperatures involved in warm deformation are not much higher than those used in cold processes, the investment required to implement cold working to warm working is not very large, leading to this costeffective working method to be put into practical use to manufacture aluminum components.
Al alloys are characterized by hot deformation behavior, showing dynamic softening, which could be ascribed to dynamic recovery (DRV) and dynamic recrystallization (DRX). It is very easy for dynamic recovery (DRV) to occur instead of dynamic recrystallization (DRX) due to the high stacking fault energy (SFE) of these alloys; therefore, this is the main softening mechanism [2,3,4,5,6,7,8,9]. Instead, DRX can occur in some deformation conditions, such as high temperature and low strain rate [10].
Different constitutive equations are proposed in the literature to give a description of the hot deformation processes providing a correlation between important hot working parameters such as temperature, strain rate ε ˙ , and flow stress σ p [11,12,13,14]. Among these, the hyperbolic sine equation proposed by Sellars and McTegart is one of the most commonly used [15]:
A [ sinh α σ p ] n = Z = ε ˙ e x p ( Q R T )
In this equation, Z is the Zener–Hollomon parameter, which combines the effects of temperature and strain rate into a single term, A and n are constants (A is a material constant that depends on the specific material being studied and n is a strain rate sensitivity exponent, indicating how sensitive the flow stress is to changes in strain rate), R is the universal gas constant (8.314 Jmol−1 K−1), and Q is the activation energy of the process (KJ/mol). The activation energy represents the energy required for the deformation process to occur. It is an indication of how much energy is needed to move dislocations or defects in the material during hot deformation. A higher Q means that more energy is needed for deformation to occur at a given temperature. In hot conditions, Q indicates the activation energy of the recrystallization process and the related alloy’s softening. It describes and quantifies the energy necessary to promote the nucleation of new grains with a much lower number of dislocations (i.e., the onset of the DRX process). As reported by different authors [12,13,16,17,18,19], Q depends on different parameters, such as the alloy’s chemical composition and grain size, making the recrystallization process easier in low–alloyed alloys with a lower grain size. The microstructural characteristics of the alloy, like the presence of precipitates instead of a solid solution, also influence the activation energy of hot working. Therefore, the Q of Al alloys varies in a wide range, from 60 to 70 kJ/mol up to values higher than 500 kJ/mol [20,21,22,23,24]. The reason for such a broad range of values lies in several key factors related to the nature of the material, the deformation process, and the specific conditions under which the measurements are taken. The main factors that explain these variations are alloy composition and microstructure, deformation mechanisms, temperature and strain rate, and testing conditions [12,13,16,25]. Aluminum alloys are made up of a variety of alloying elements dissolved in the matrix. They create a solid solution that impedes the movement of dislocations, requiring more energy to deform the material. This can increase the activation energy for hot deformation. The grain size, the presence of precipitates or secondary phases, and the initial dislocation density and other defects can also affect the energy required for deformation [20,21]. The deformation mechanism (e.g., dislocation motion, dynamic recovery, dynamic recrystallization) also plays a significant role in determining the activation energy. In aluminum alloys, at higher temperatures, dynamic recovery and recrystallization can dominate, reducing flow stress and changing the activation energy [19]. At lower temperatures, the material may exhibit more work hardening and strain localization, which can result in different activation energies. Furthermore, the temperature and strain rate during testing influence activation energy. At lower strain rates or higher temperatures, the material may exhibit more diffusional processes (like atomic diffusion), which require less activation energy [19,26,27]. On the other hand, at higher strain rates or lower temperatures, dislocation motion and work hardening mechanisms could dominate, requiring a higher activation energy. Lastly, activation energy can also vary depending on the experimental methods used.
In the present investigation, the application of the model used to describe the hot deformation was extended to the warm regime by checking its suitability also at temperatures lower than the typical hot range temperatures. In the warm range, dynamic recrystallization does not occur; therefore, Q does not describe the energy necessary to induce the recrystallization process but instead represents the energy required for strain hardening. At these temperatures, the alloy in fact undergoes a hardening phenomenon when it is deformed, and Q represents the activation energy for dislocation movements, piling–up, and rearrangement in new cellular structures, typical of high–SFE metals. Since there is limited literature data regarding the activation energy and, in general, the warm compression behavior of AA6060, the aim of the present paper is to provide data on the deformability of a 6060 aluminum alloy on an extended range of temperatures, from 100 °C to 400 °C, covering both warm and hot deformation conditions. Compression testing is selected because it simulates the true hot deformation conditions encountered in various hot working processes, such as forging or extrusion. Furthermore, unlike tensile testing, which is limited to small true strains to avoid necking, compression testing does not have such a constraint when determining flow stress. The flow stress obtained through warm and hot compression has been modeled using Equation (1), generally applied only in hot conditions, but it has been extended here to include the warm temperature range as well. Additionally, deformation behavior parameters, such as the strain hardening exponent (n) and strain rate sensitivity (m), have been calculated, and the microstructural evolution of the alloy has been analyzed. The purpose of this study is to highlight the key differences in behavior across a wide temperature range, from warm to hot deformation conditions. Moreover, this paper investigates the feasibility of applying the same constitutive model across both temperature ranges.

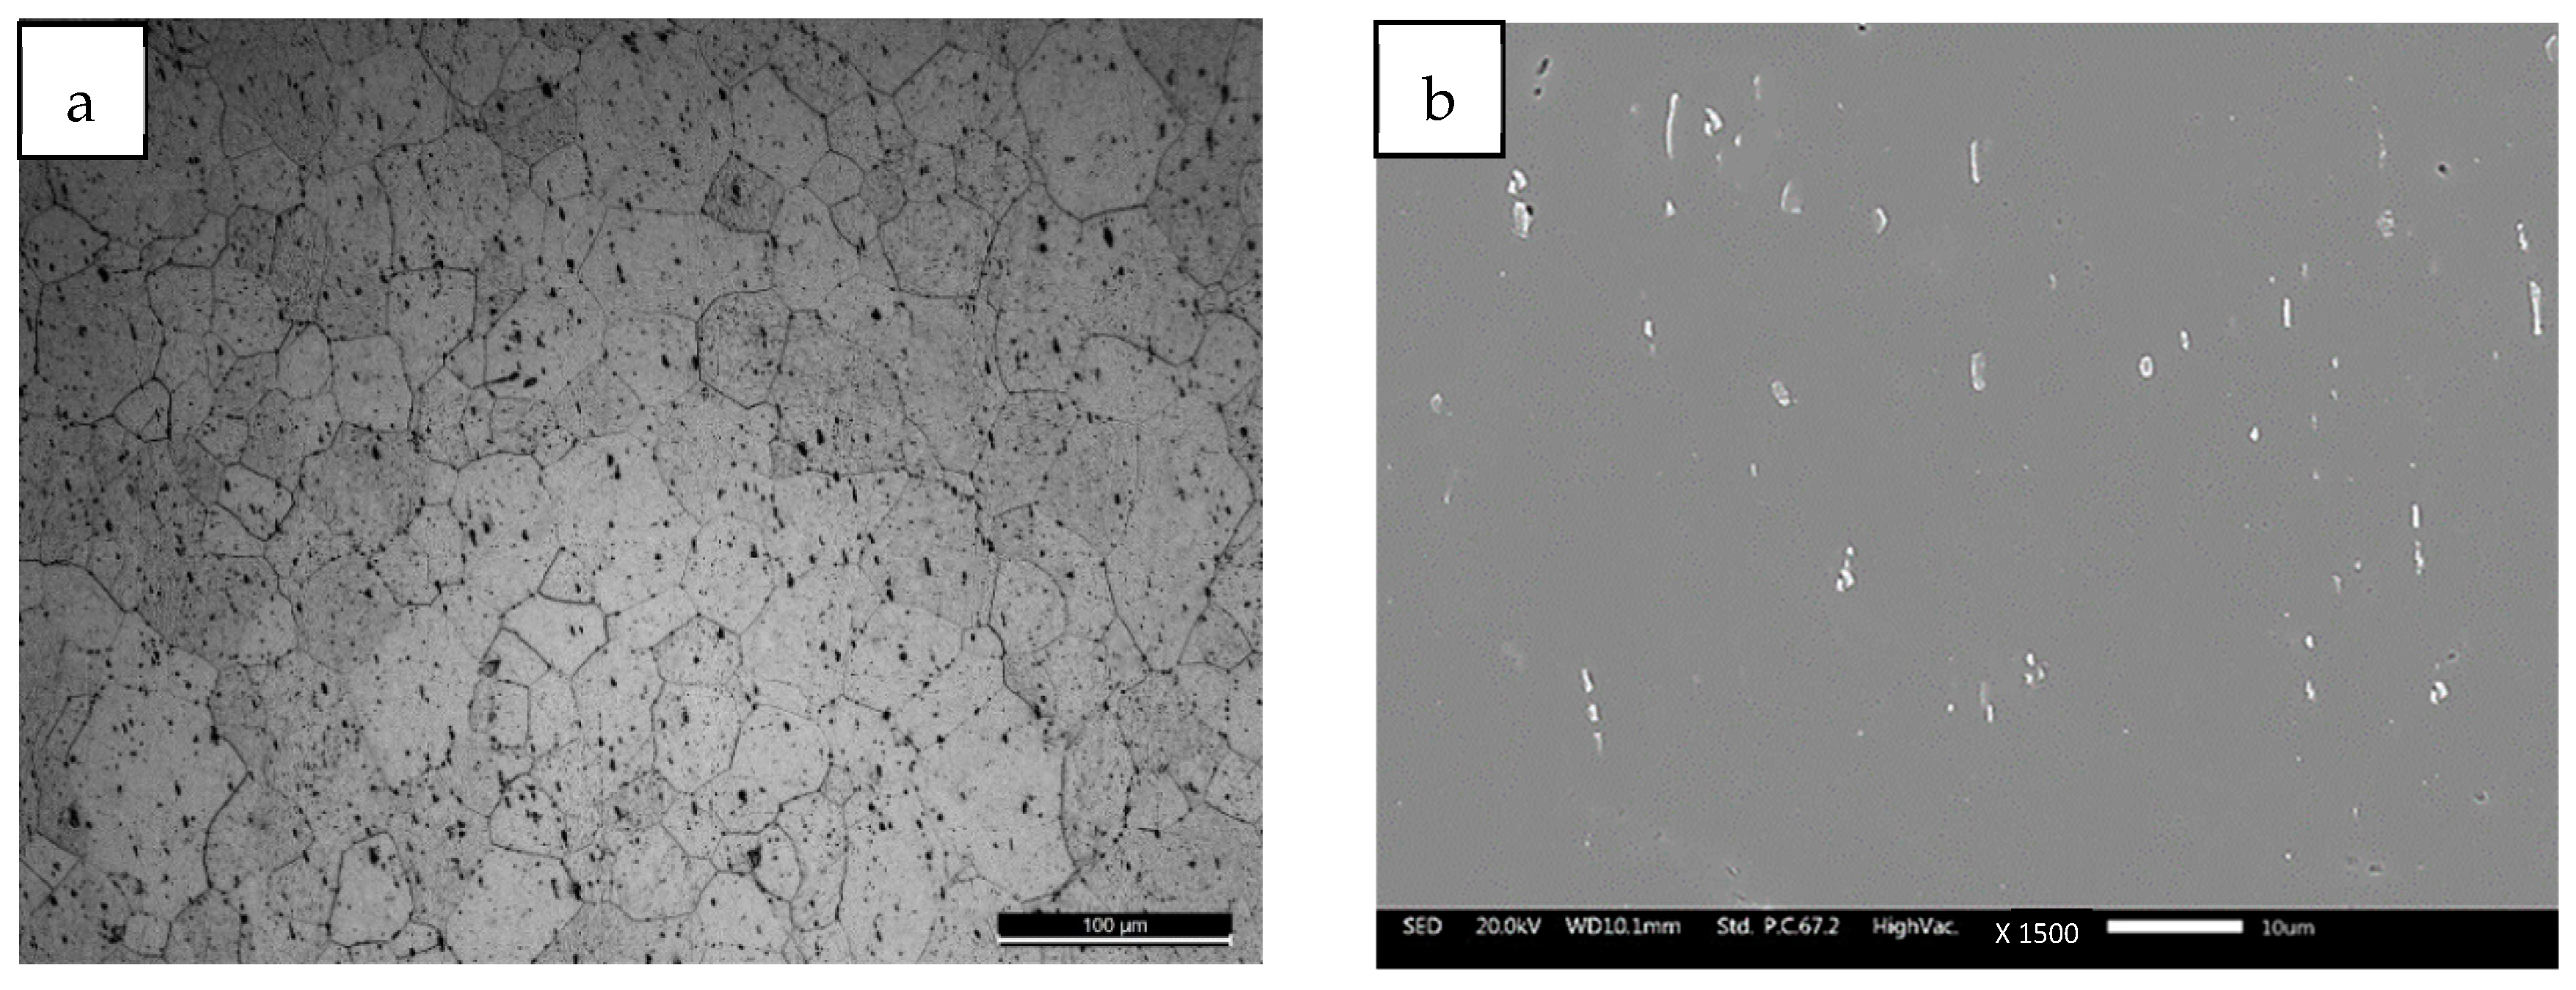
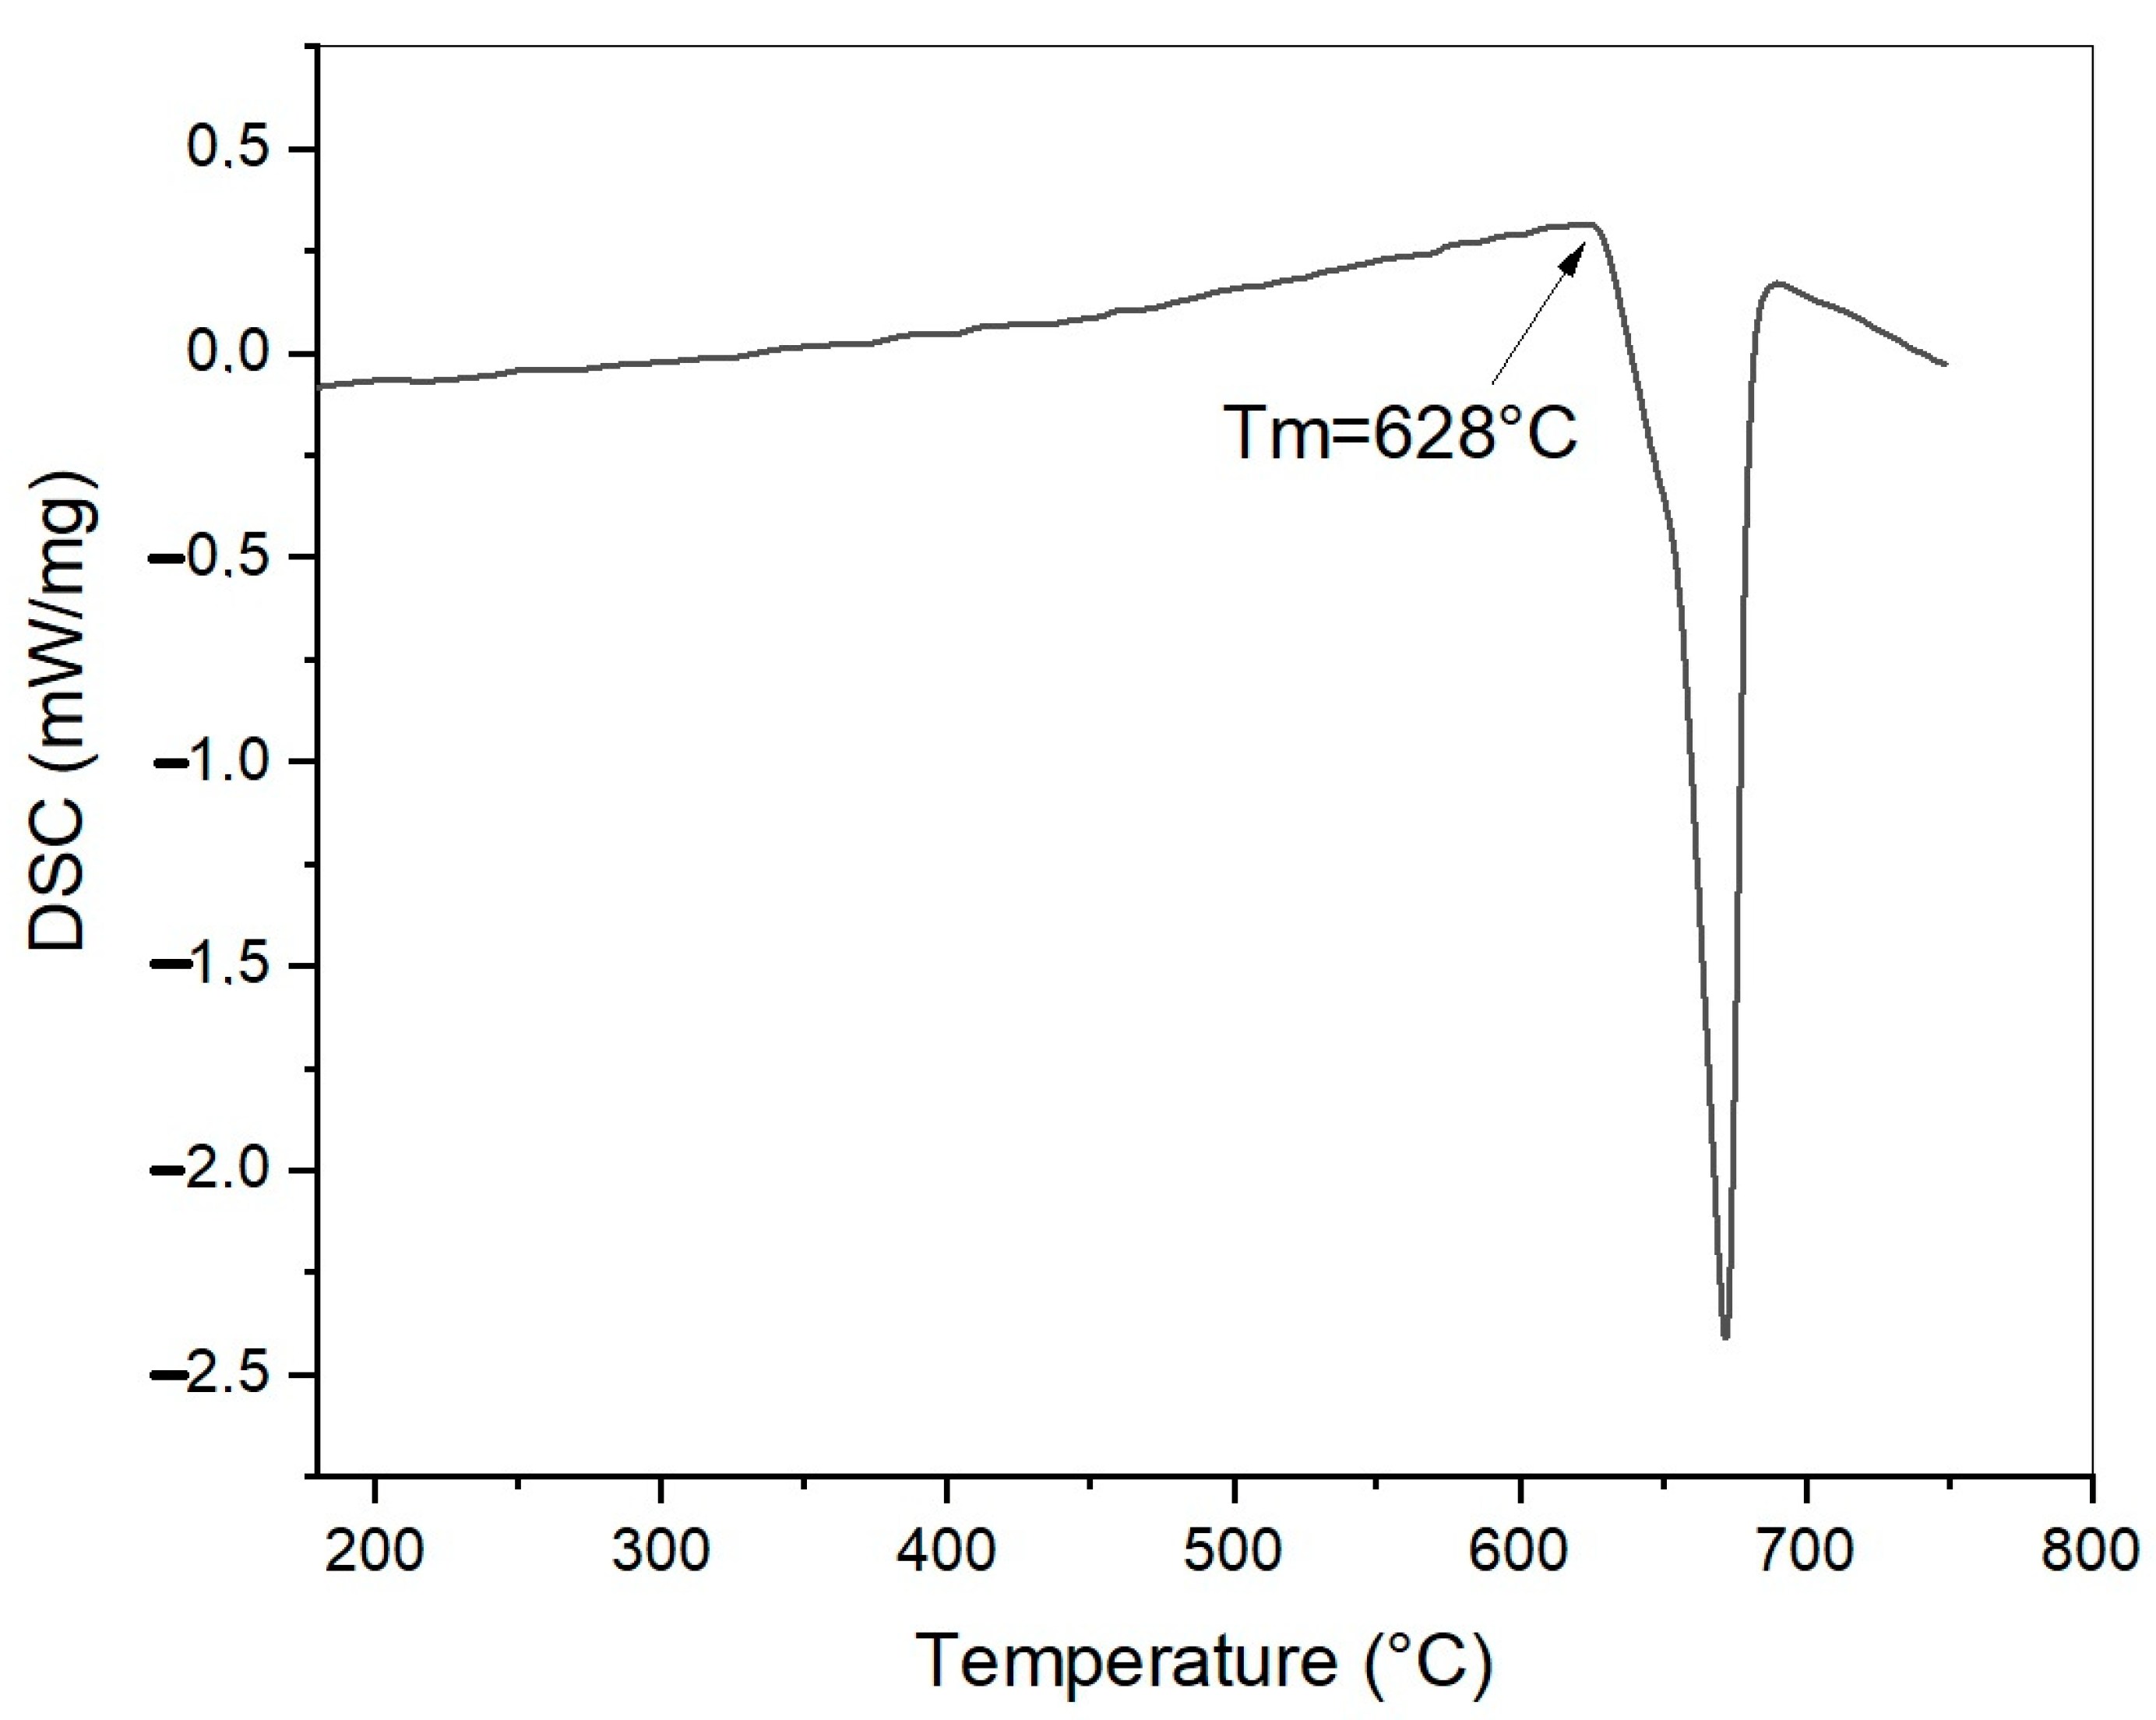
2. Material and Methods

Cylindrical samples (diameter 4.5 mm, height 9 mm) were cut from a commercial extruded bar made of a AA6060 T6 alloy with a hardness of 93 HV1. The microstructure of the alloy investigated by light optical microscopy and scanning electron microscopy (SEM) is shown in Figure 1a (at LOM) and Figure 1b (at SEM). The sample contains a consistent amount of precipitates with a size of 1–8 µm. According to literature data, the Fe– and Si– containing precipitates typically formed in this alloy are rounded α–AlFeSi and plate–like β–AlFeSi intermetallics [28,29].
The melting point of the alloy was detected through differential scanning calorimetry, and it is 628 °C. The DSC (differential scanning calorimetry–STA 409 Luxx Netzsch, (Netzsch Gmbh, Selb, Germany) curve showing the melting peak is reported in Figure 2.
Hot compression tests were carried out in a horizontal dilatometer Bähr 805 A/D equipped with a compression head at two different strain rates (0.1 and 0.001 s−1) and five different temperatures (100 °C, 150 °C, 200 °C, 250 °C, 300 °C, and 400 °C), covering a range of homologous temperature which goes from the warm to the hot working condition for this alloy (from 0.41 to 0.75). The temperatures for hot compression were reached at a heating rate of 1 °C/s and maintained for 2 min to ensure complete homogenization of the sample. Flat disks (0.1 mm thickness and 8 mm diameter) made of 99.95% molybdenum were placed between the specimen and the Al2O3 punches to improve the contact conditions (thermal barrier and friction). The specimens were induction–heated, and their temperature was monitored and controlled using a Platinum: Platinum–Rhodium (Pt:Pt–Rh) thermocouple. A low pressure of 10−4 mbar was used during the tests in order to limit surface oxidation. All tests were carried out up to a maximum true strain of 0.4. After deformation, samples were rapidly cooled down at 10 °C/s with a flux of inert gas in order to “freeze” the microstructure for the following metallographic investigations. The deformed specimens were sectioned parallel to the deformation axis and prepared for metallographic examination after etching with Keller’s reagent (190 mL H2O + 5 mL HNO3 (65%) + 3 mL HCl (32%) + 1 mL HF (40%)). The Vickers hardness measurements were carried out on a Vickers microhardness tester (FM–310, FUTURE–TECH CORP, Kawasaki, Japan). The measurements were taken with 1 kg of load with 10 s of dwell time. A total of 10 measurements were taken for each sample.

3. Results and Discussion

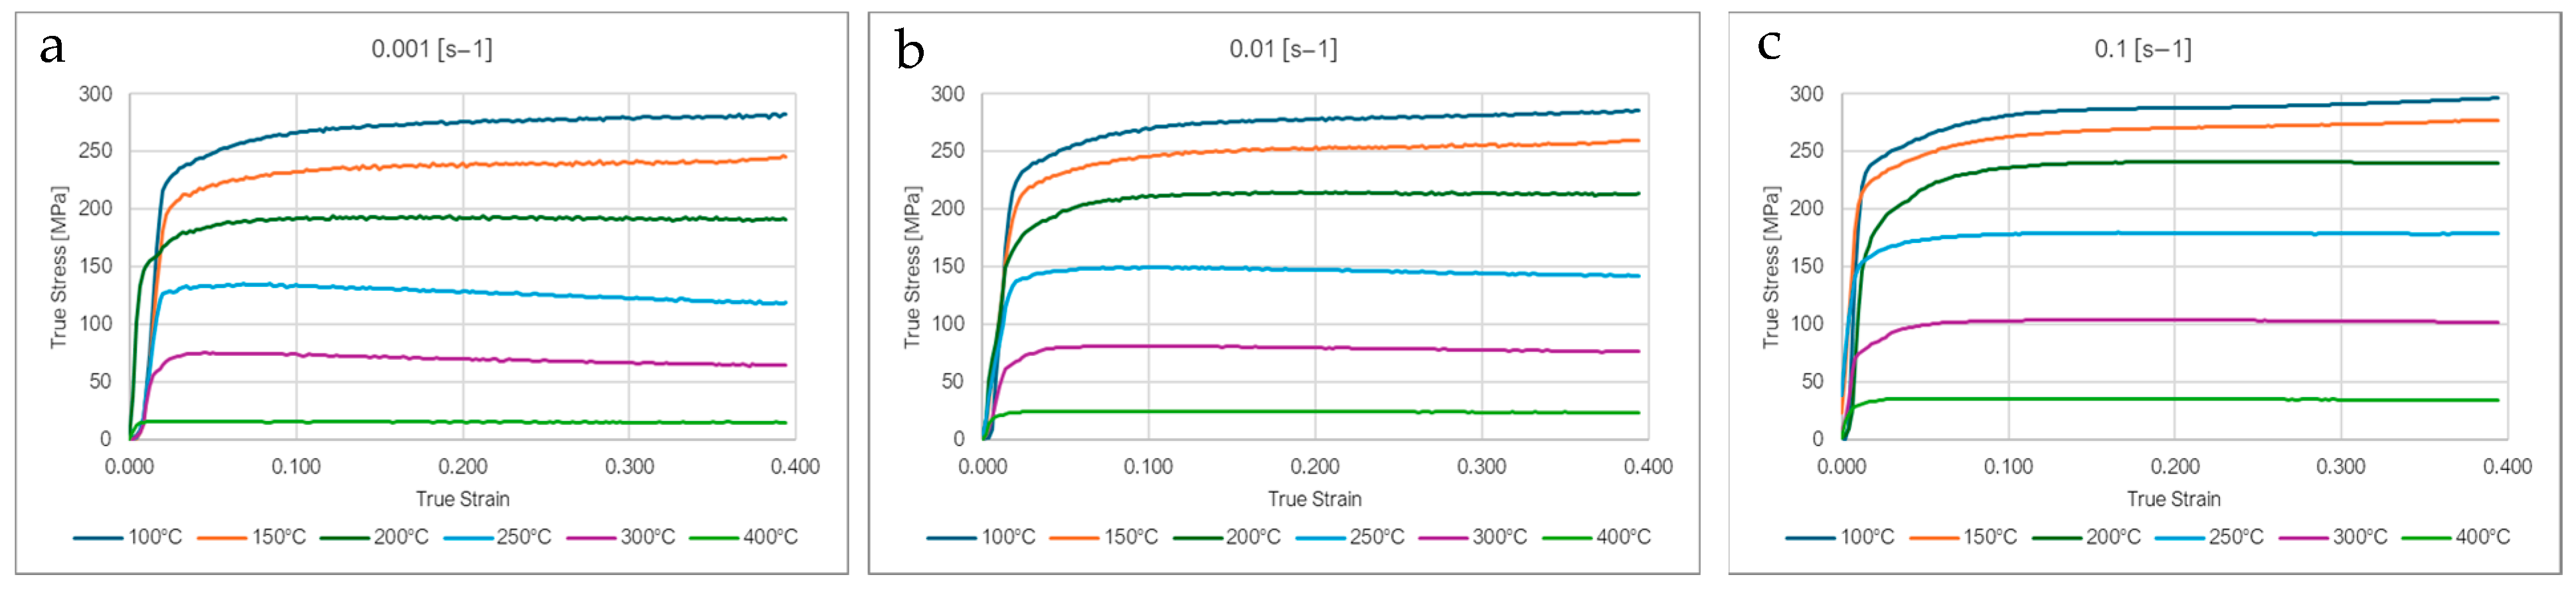
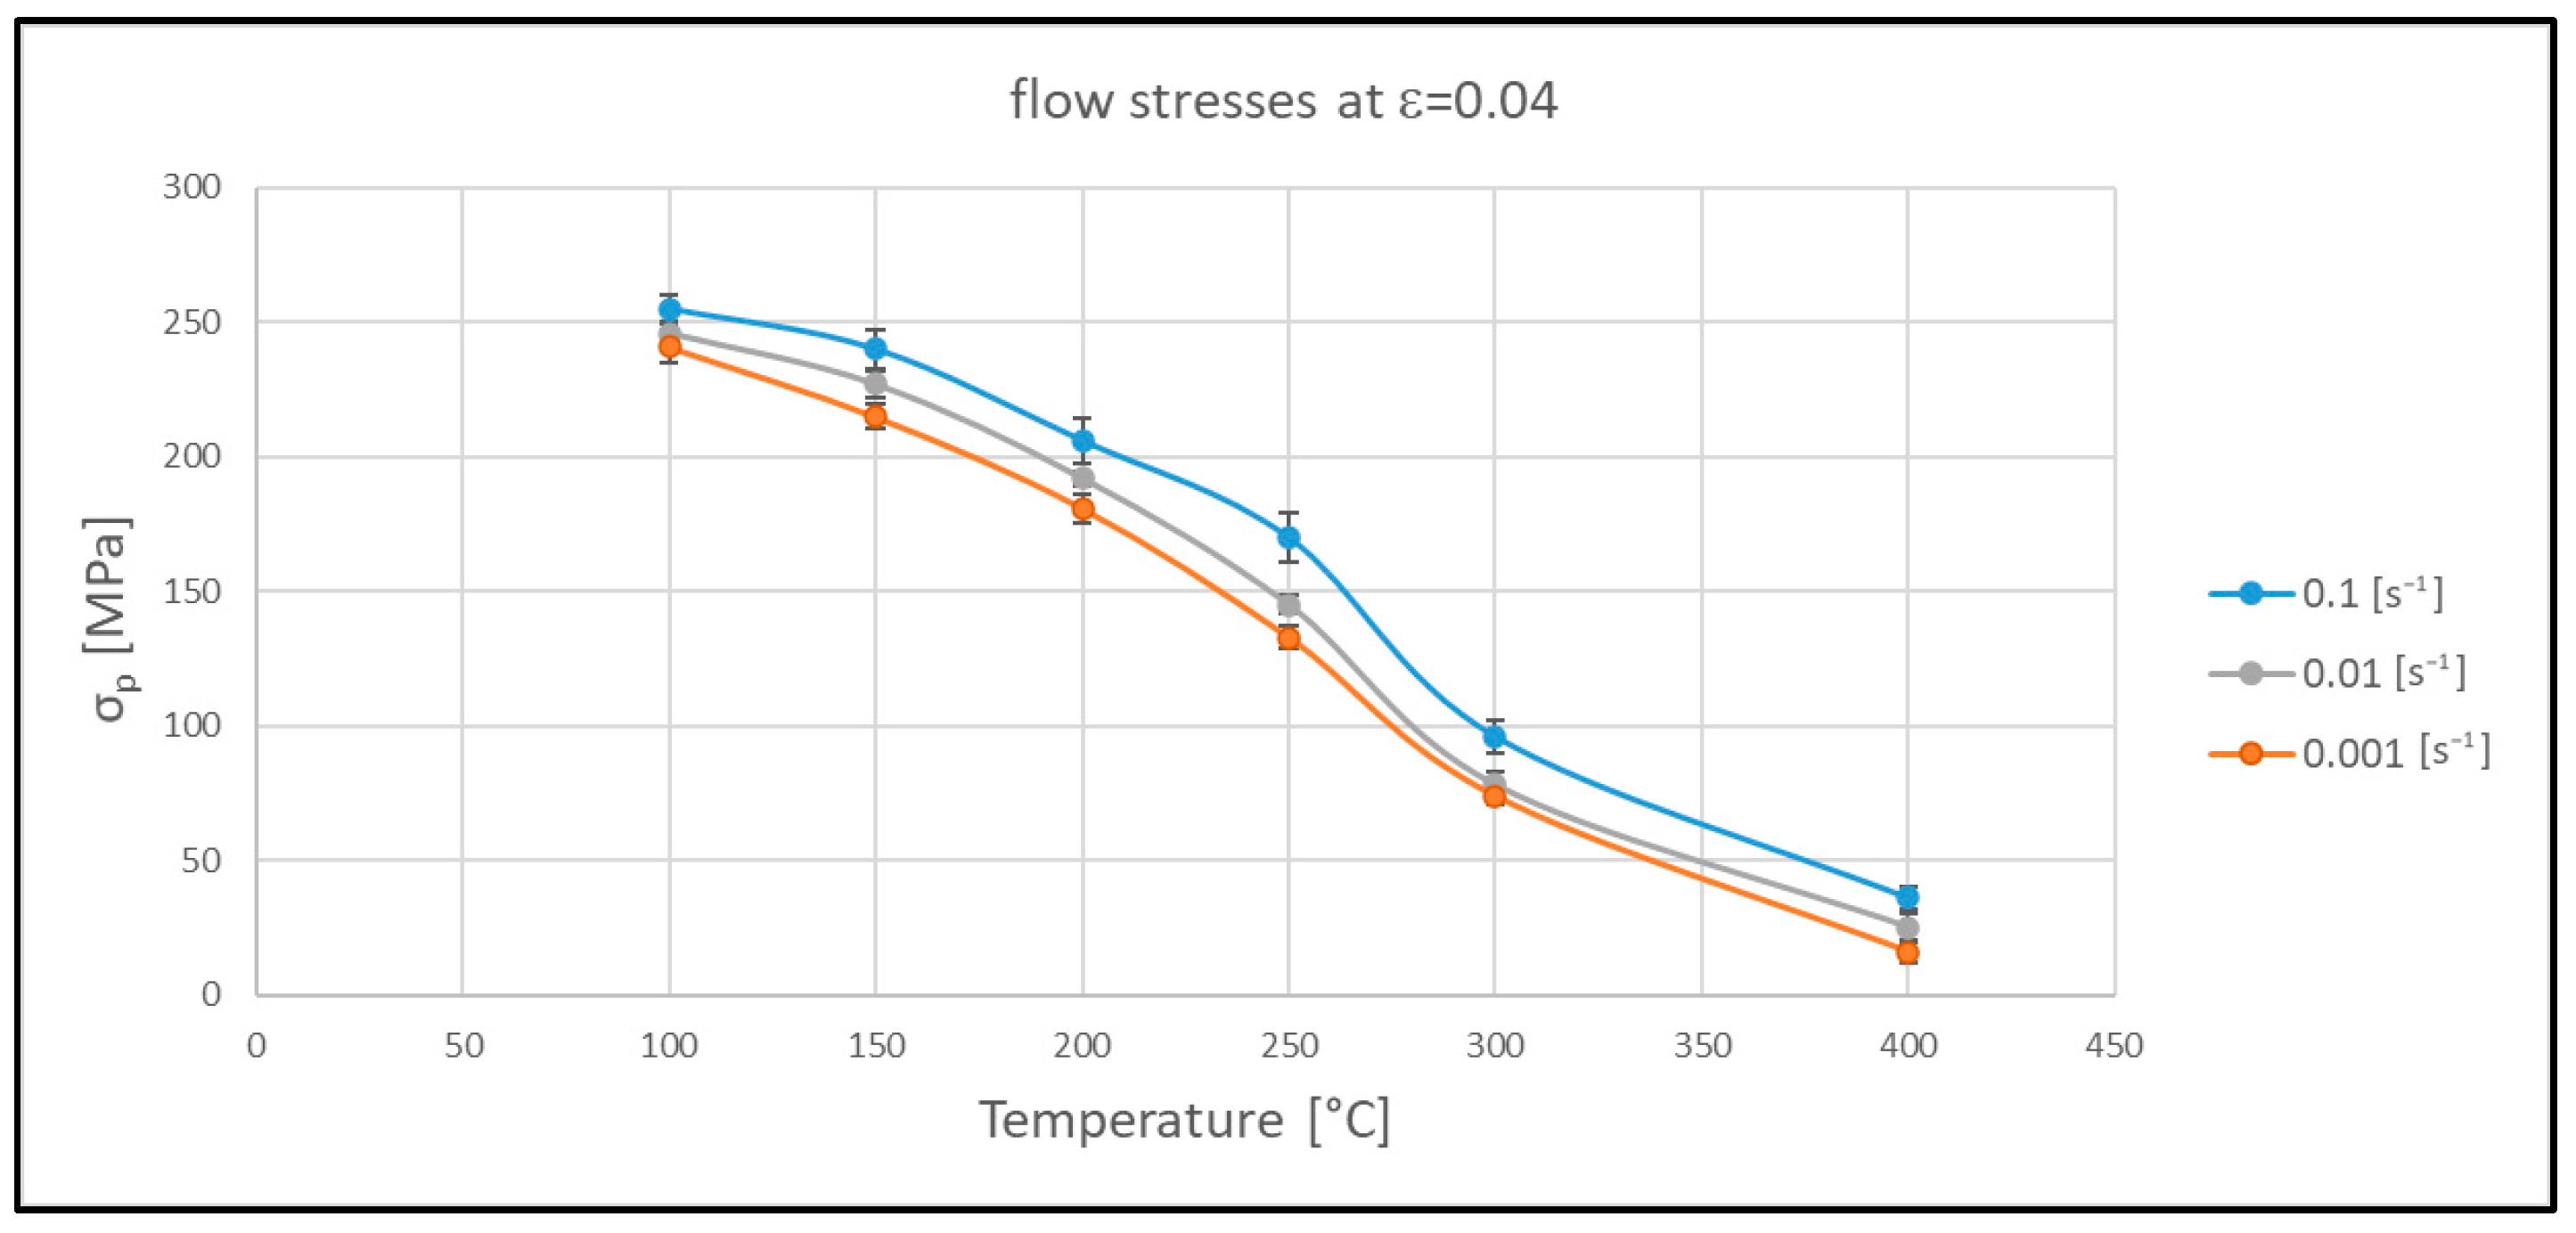
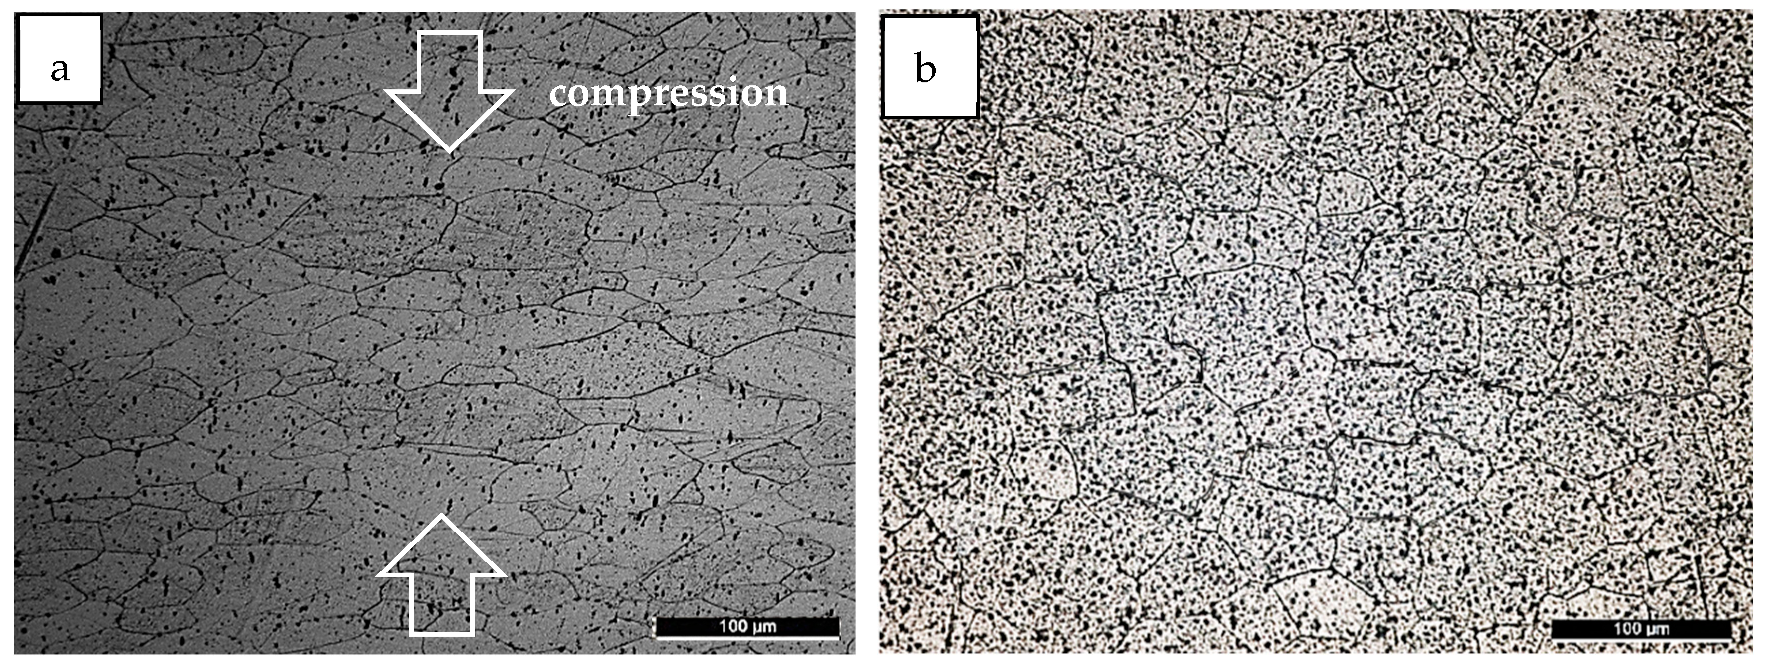
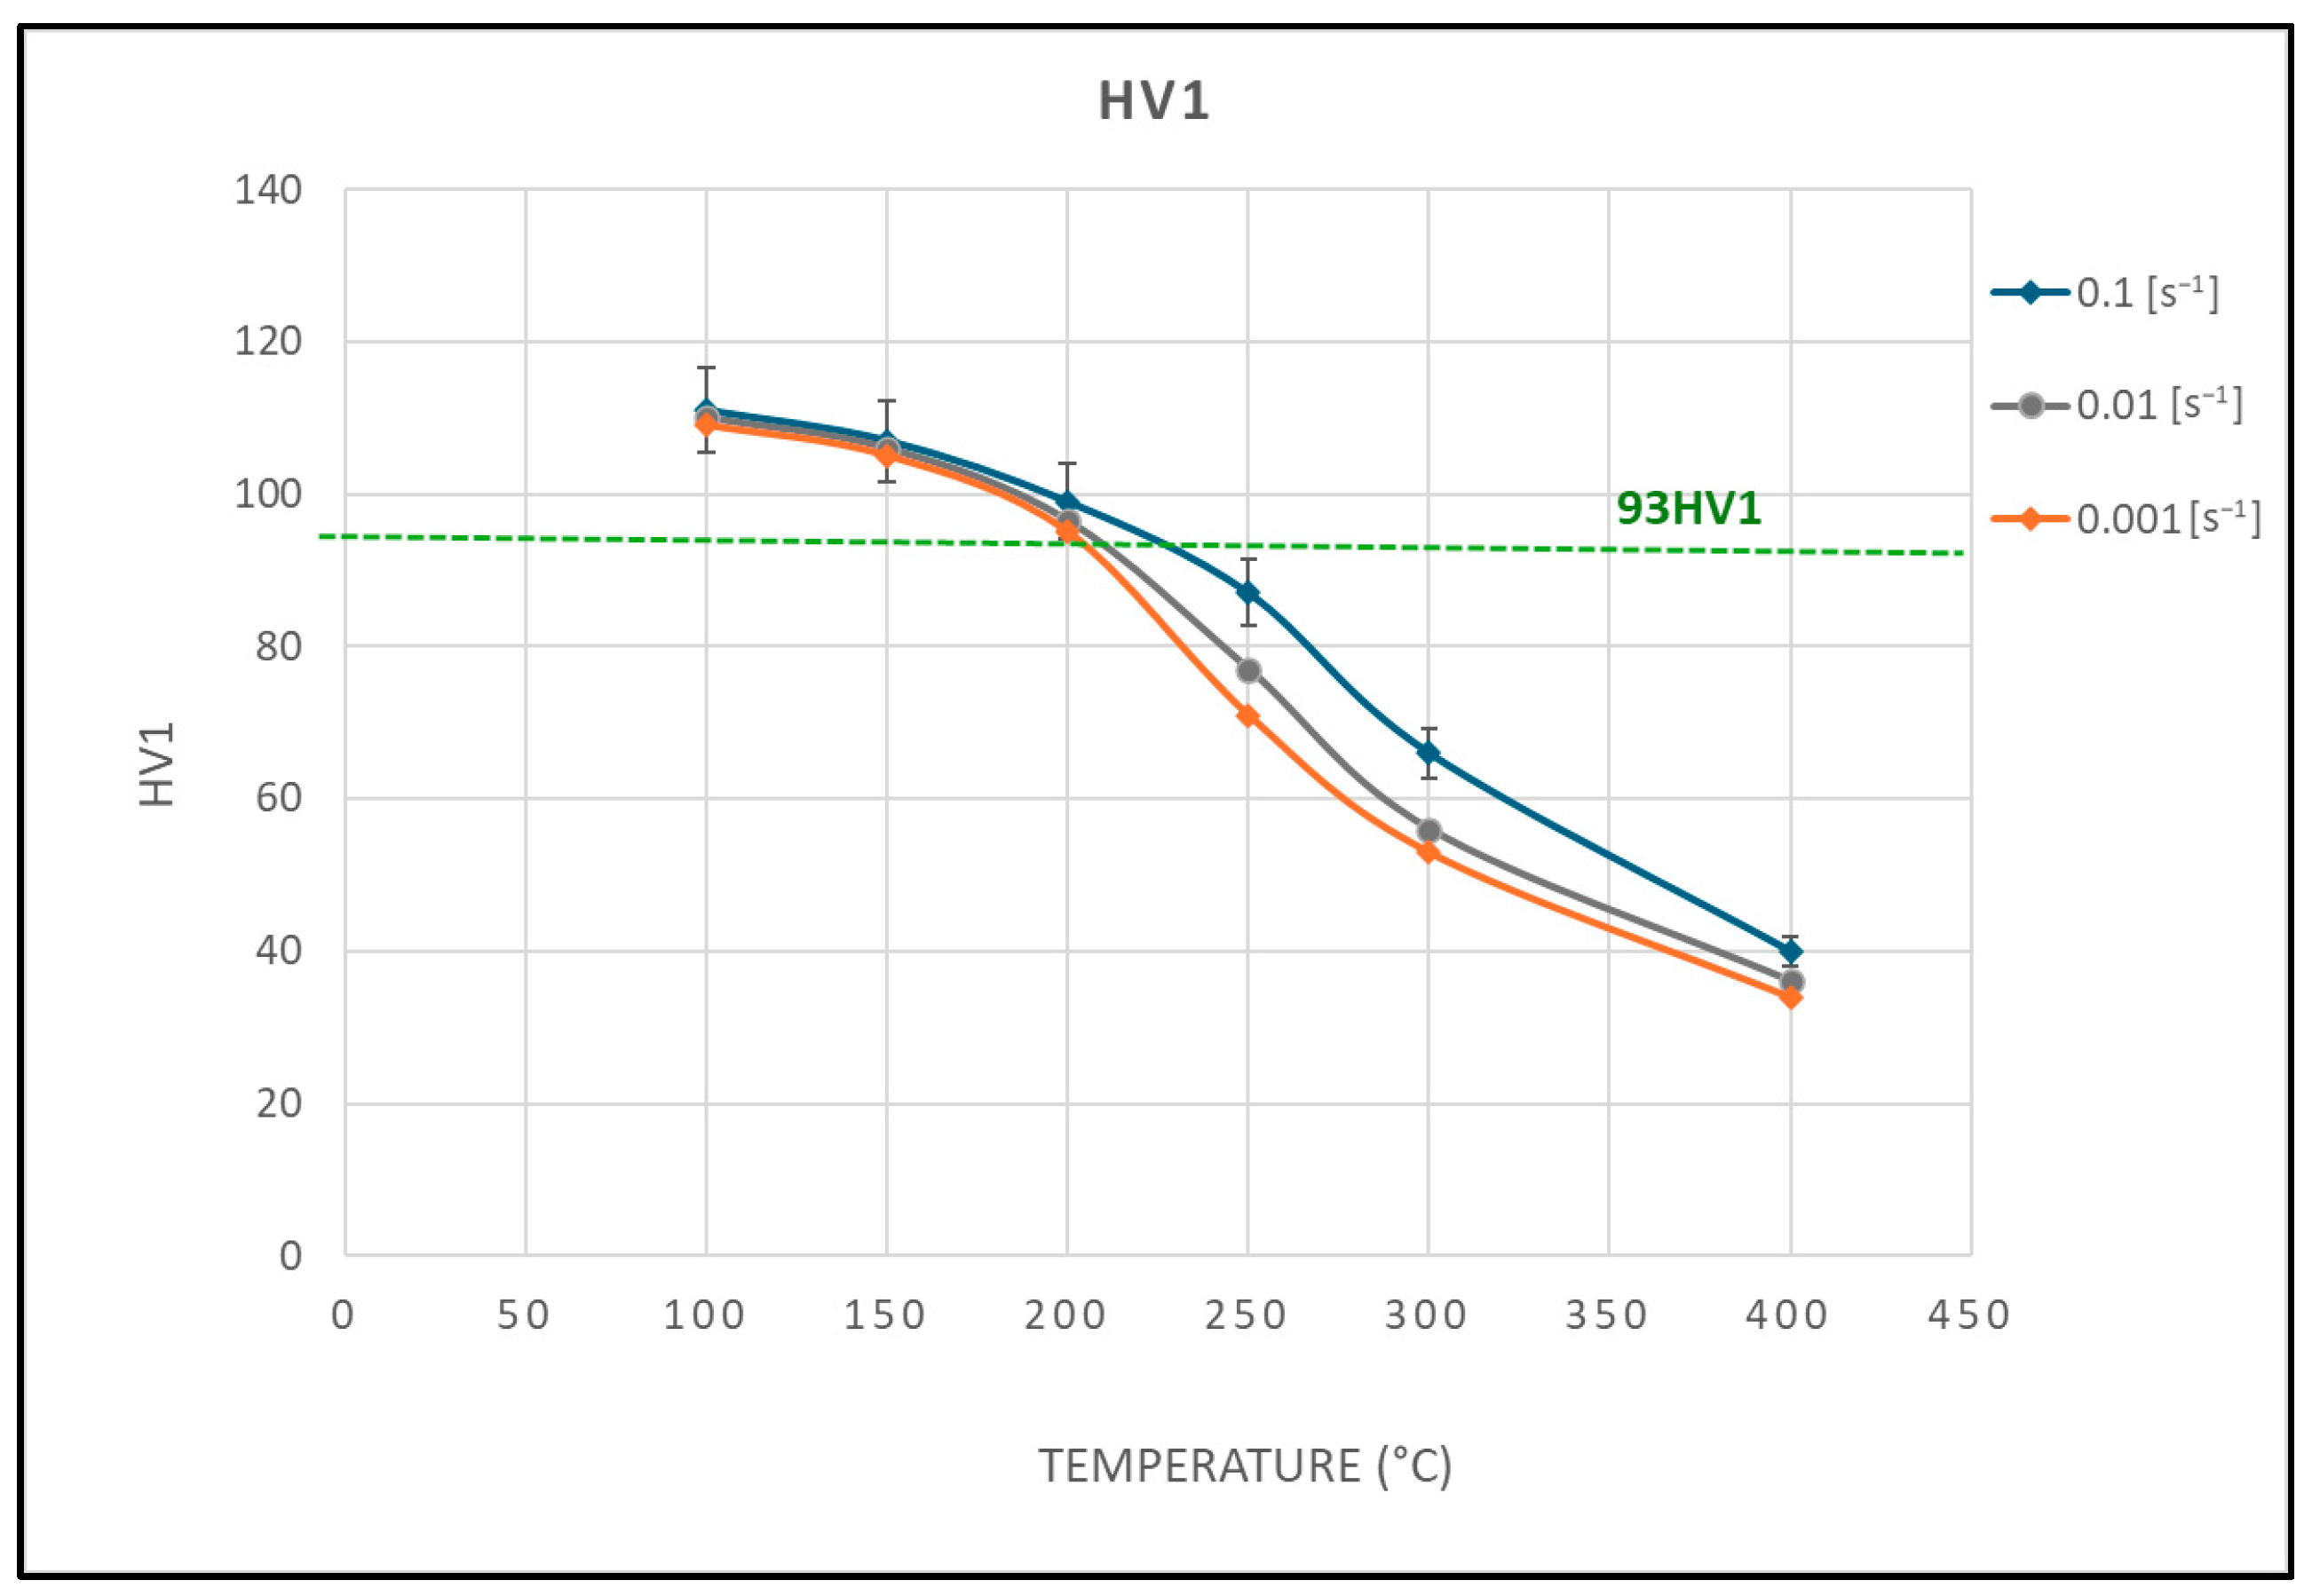
3.1. Compression Behavior

Compression curves are shown in Figure 3, divided into two groups: in Figure 3a, the curves are shown at a low strain rate (0.001 s−1), while in Figure 3b, they are shown at a high strain rate (0.1 s−1). In the low–temperature regime (T < 200 °C), all the σ–ε curves increase up to the final deformation, and at 200 °C, the curves increase in the first part and then reach a plateau where the stress is constant; lastly, for temperatures higher than 250 °C, the curves increase up to a peak and then moderately decrease. The decrease is more pronounced at a low strain rate.
The flow stresses σ corresponding to a deformation of ε = 0.04 (indicated with σ0.04) were taken as a reference to compare the strength of the alloy at different temperatures and strain rates. When the steady–state conditions are not reached, the flow stress can be replaced by an «apparent» flow stress. This is particularly useful when it is necessary to reliably determine the ‘flow stress’ in the initial stages of the plastic deformation process, before steady–state is achieved [15,19,26,30]. These stress values derived from the curves of Figure 3 are reported in Figure 4. The highest value of stress at ε = 0.04 is 255 MPa, measured after hot compression at the lowest temperature (100 °C) and the maximum strain rate (0.1 s−1), while the minimum stress (16 MPa) was found at 400 °C and a low strain rate (0.001 s−1). Compression tests on the same alloy were carried out at higher temperatures and strain rates by Qian et al. (520 °C–610 °C—1 s−1) in as–cast and homogenized conditions, finding peak flow stress values between 27 and 30 MPa [5].
The microstructure of the 6060 alloy after plastic deformation at the lowest temperature of 100 °C and at a strain rate of 0.001 s−1 is shown in Figure 5a. The grains appear elongated in the direction perpendicular to the compression deformation, which is indicated on the micrograph. After deformation at the highest temperature of 400 °C (Figure 5b), equiassic grains larger than those of the initial sample are visible, indicating that dynamic recrystallization (DRX) and grain growth occurred, while they did not take place at 100 °C. This behavior is rather general. For temperatures below 200 °C, the grains appear flattened at the end of the deformation process, while at temperatures higher than 250 °C, they are not. Considering the increase in flow stress with the applied strain (Figure 3), it can be concluded that the material underwent strain hardening during the plastic deformation process under these conditions. Above 250 °C, DRX occurred, as indicated by the shape of the stress–strain–curve, which is characterized by a stress decrease after a maximum point.
The microhardness values measured on the samples after the compression tests are shown in Figure 6. They are compared to the microhardness of the initial sample (93 HV1), which is also indicated on the same graph. Samples deformed at 100, 150, and 200 °C have a higher microhardness than the initial alloy, indicating the occurrence of strain hardening during the warm deformation test. At temperatures ≥ 250 °C, softening prevails on the strain hardening, leading to a hardness reduction. This is in agreement with the shape of the compression curves, which show a continuous increase at 100 °C and 150 °C, an increase followed by a plateau at 200 °C, and a slight decrease after reaching a peak at temperatures above 250 °C.
Plotting the flow stress, σ0.04, as a function of the hardness, a very good linear correlation is found, as shown in Figure 7. This confirms that the flow stress is representative of the alloy plastic strength, as influenced by temperature and strain rate.

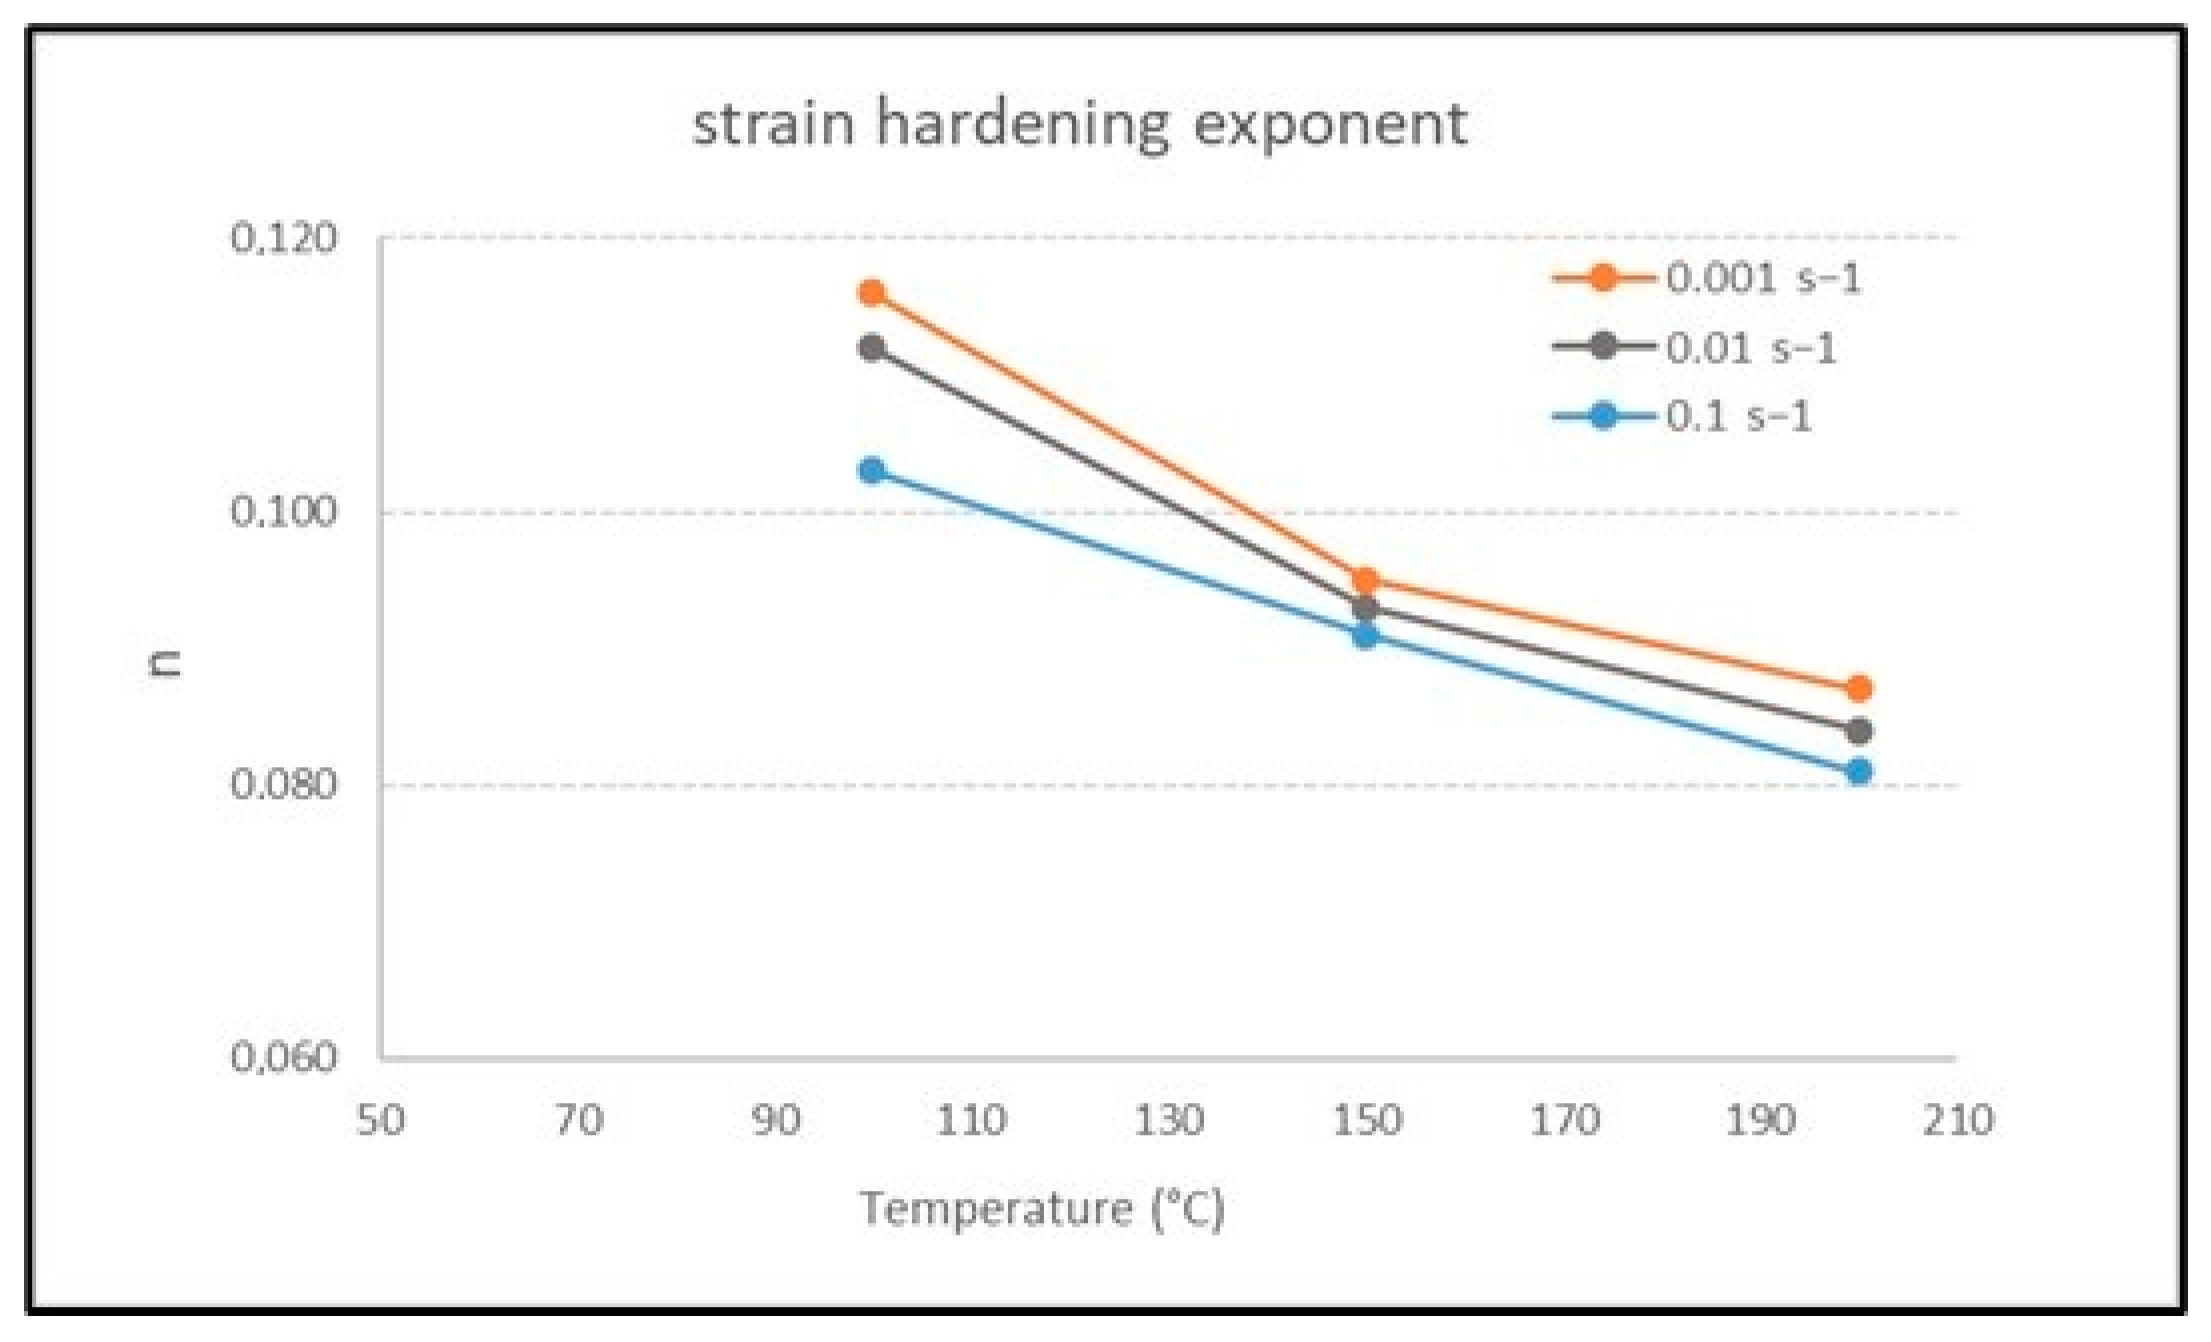
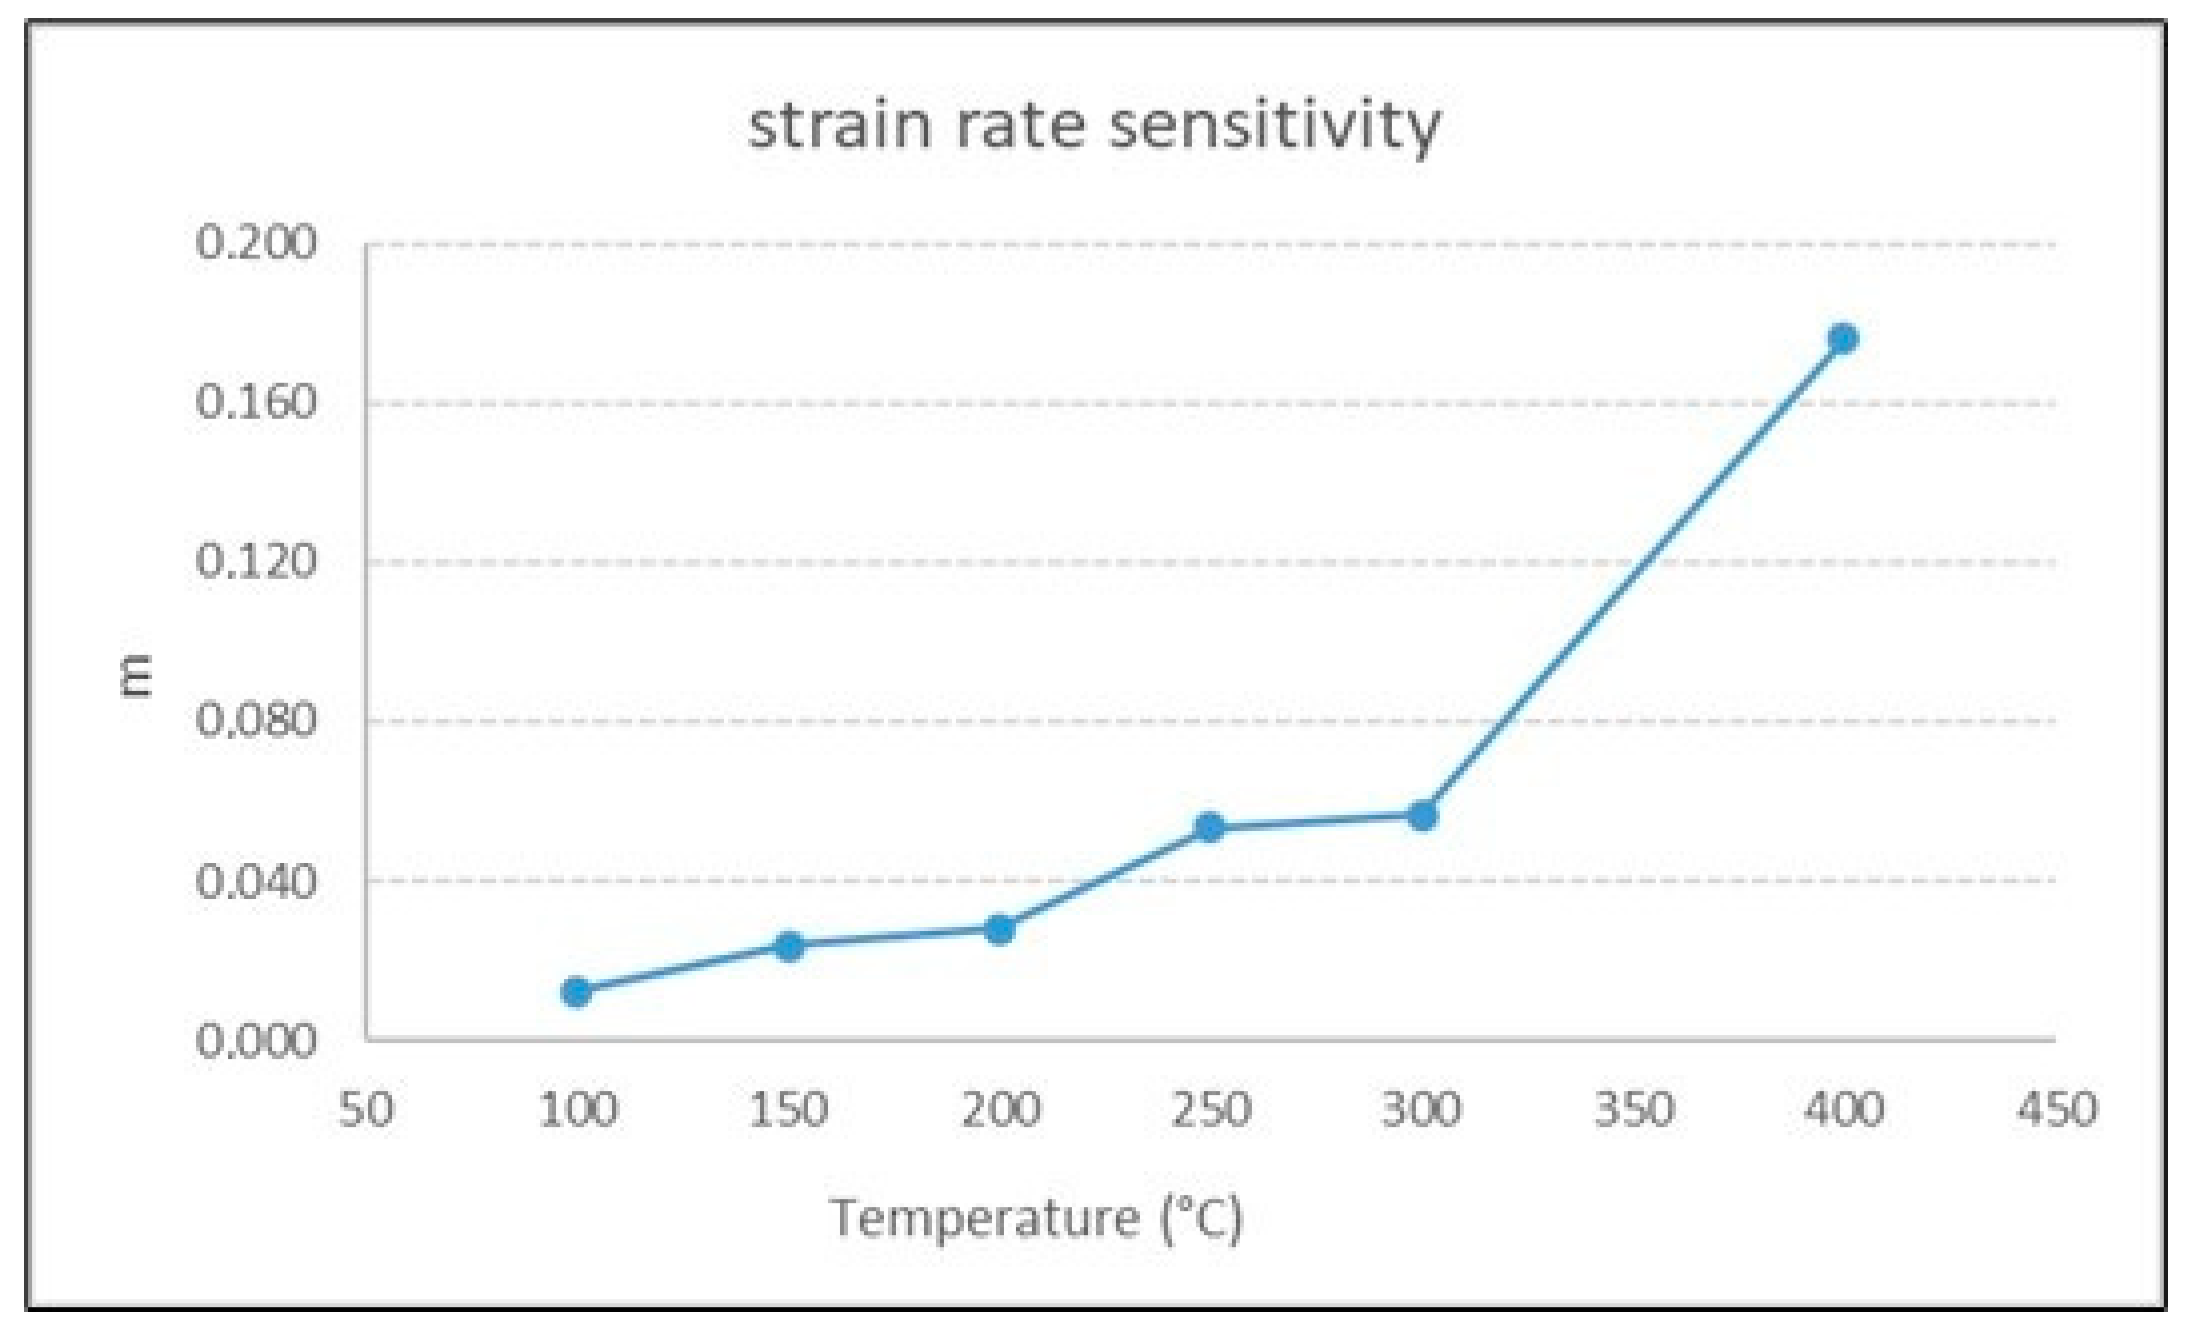
Strain Hardening Behavior and Strain Rate Sensitivity

The plastic deformation part of the hot compression curves from strains of about 0.02–0.04 up to those corresponding to the maximum flow stress was analyzed by applying the Hollomon equation (Equation (2)) with the aim of determining the strain hardening exponent n.
σ = K ε   n
In order to obtain n, this part of the σ–ε curves has been reported in a log scale, and the slope of the obtained linear correlation was measured, as shown in Figure 8a–c, for the sample deformed at 100 °C, 150 °C, and 200° C—0.1 s−1. Linear correlation between log(σ) and log(ε) was found only for the compression curves at 100 °C–150 °C and 200 °C.
The obtained n values are summarized in Table 1 and reported as a function of temperature in Figure 9. As can be observed, the strain hardening exponent decreases, increasing temperature and decreasing the strain rate. In fact, when the strain rate is lower, the dislocations have more time to move and multiply, leading to higher work hardening. A similar behavior was observed also for a 7075 Al alloy [31]. The values of n found in the literature for the 6060 Al alloy at room temperature are in the range of 0.11–0.15 [32,33]. At temperatures higher than 200 °C, the alloy undergoes dynamic recrystallization; therefore, it does not show strain hardening.
Strain rate sensitivity m was calculated according to Formula (3) considering the flow stresses at ε = 0.04 (σ1 and σ2) on the curves at the lowest and the maximum strain rates (έ1 = 0.001 s−1 and έ2 = 0.1 s−1). The obtained values of m are reported in Table 2 and plotted in Figure 10. A consistent increase in m is observed from 300 °C. These values are in line with those found by Vilamosa et al. in the same temperature range (RT–400 °C) [3] and Verlinden in the temperature range of 390–520 °C [4]. For temperatures lower than 250 °C (i.e., homologous temperature lower than ~0.55), m is lower than 0.05, while it exponentially increases up to ~0.18 for a homologous temperature greater than 0.55, typical of hot deformation conditions. Similar values were also found in the same temperature range for different Al alloys, for example, by Navid Moghadam [34] on an Al–Mg–Si alloy and by Cavaliere on an Al–Cu–Mg alloy [35].
m = f ε ˙ , T = d l o g σ d l o g ε ˙ T , ε = ln σ 2 σ 1 ln ε ˙ 2 ε ˙ 1
As for strain rate sensitivity, the plastic deformation behavior of this alloy can be divided into two temperature ranges, Tm < 0.55 and Tm > 0.55. Both flow stress and hardness undergo a rapid drop to much lower values for Tm > 0.55, while, symmetrically, strain rate sensitivity increases.

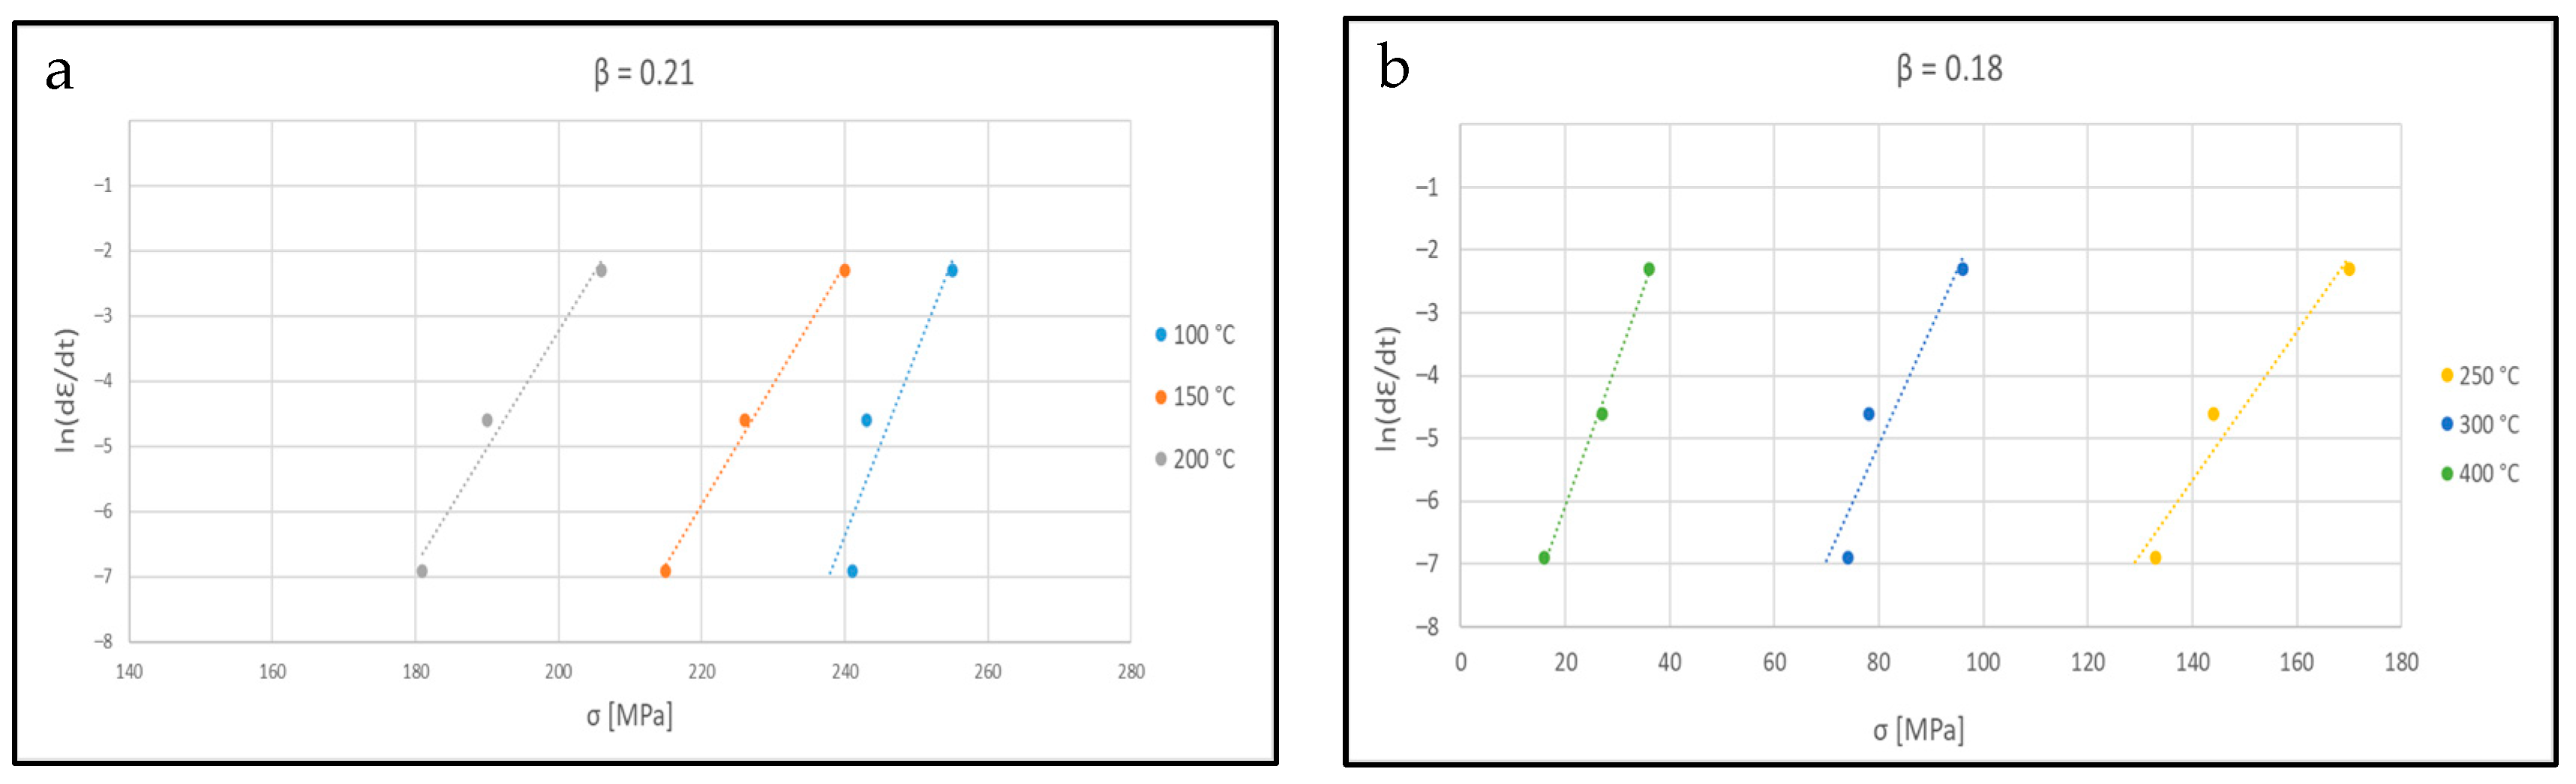
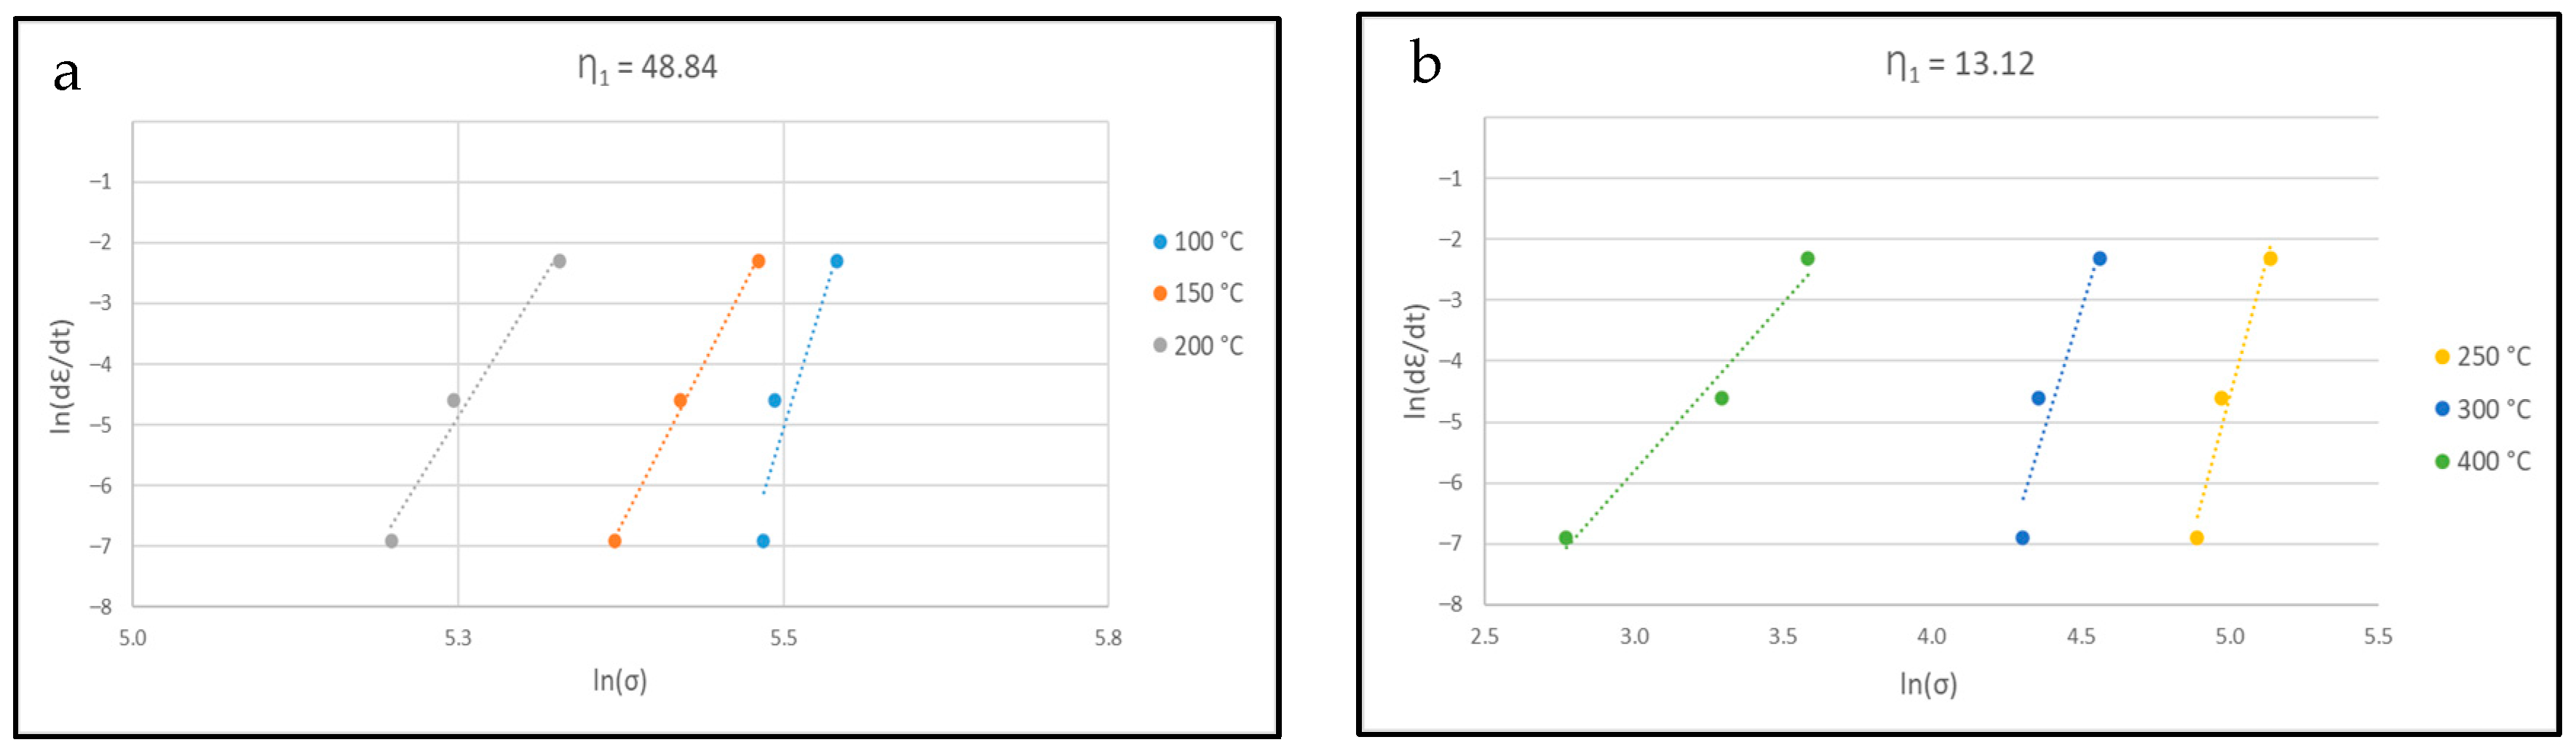
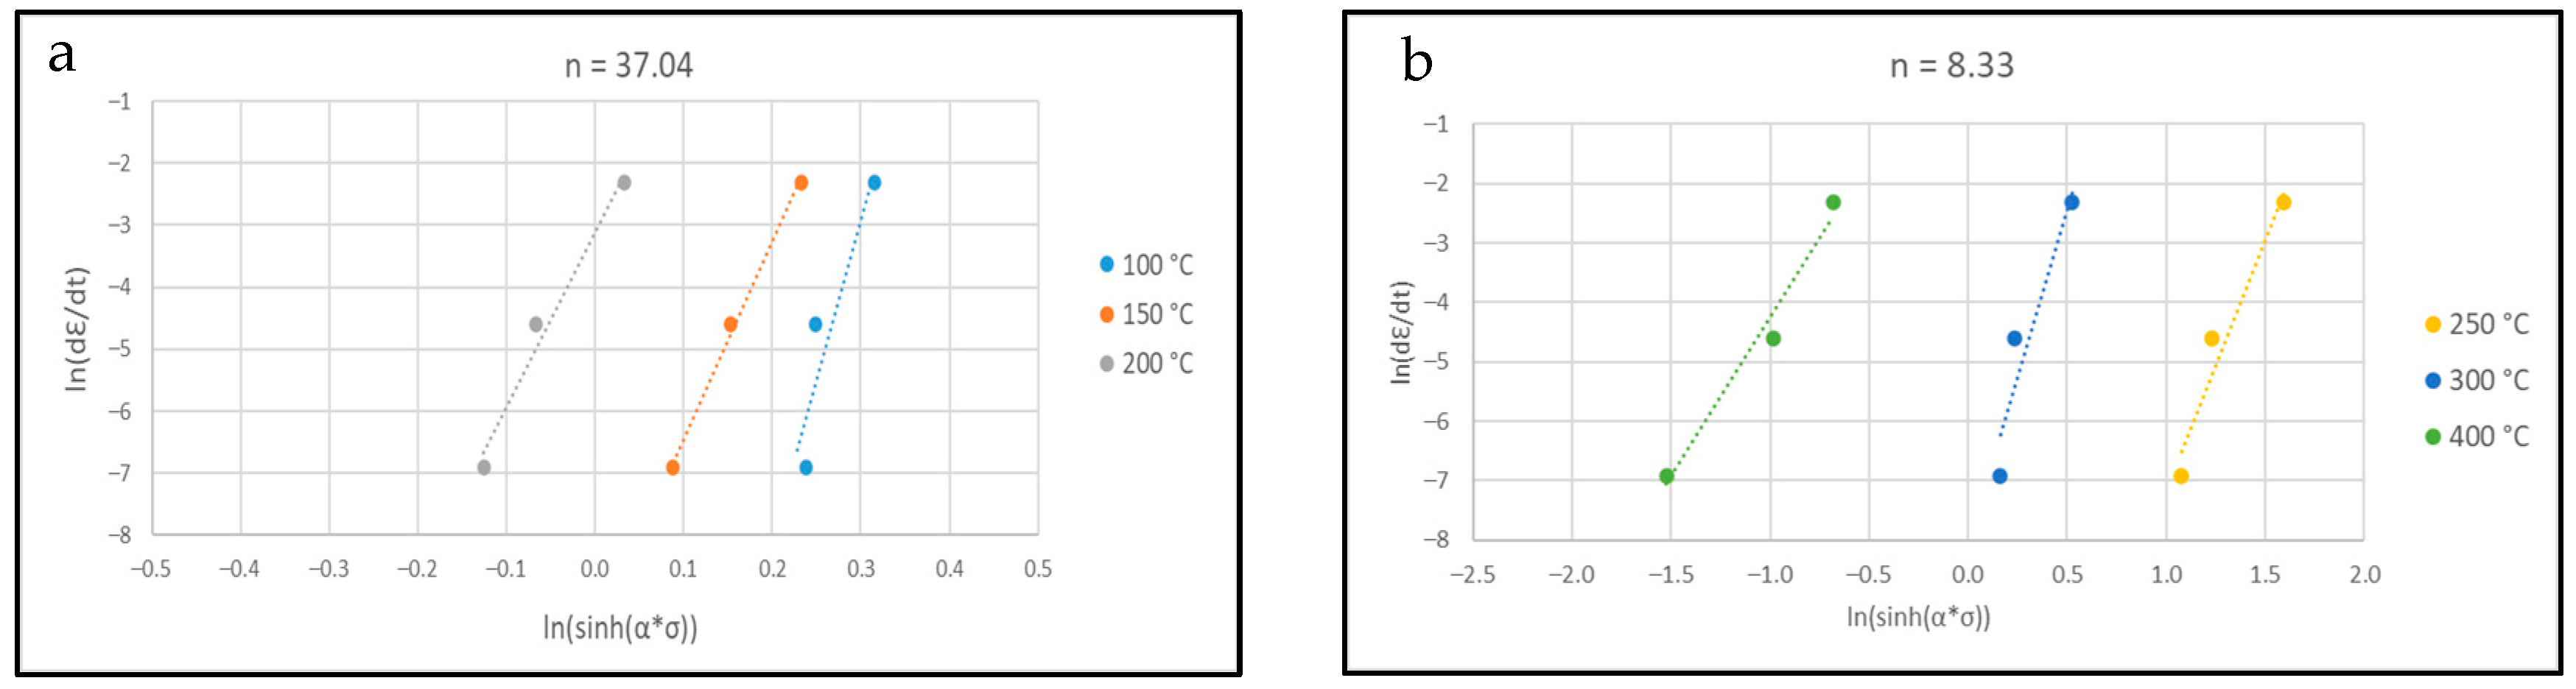
3.2. Development of Constitutive Model

Based on the observations about the plastic deformation of this alloy presented in the previous paragraph, the modeling of flow stress with temperature and strain rate was divided into two stages (warm and hot). The equation used is the hyperbolic sin type (Equation (1)) proposed by Sellars and Mctegart.
α in Equation (1) is a constant called the stress multiplier calculated as α = β/η1. The coefficient β is calculated as the mean value of the slope of the ln ε ˙ vs. σ lines, as reported in Figure 11, for warm and hot regimes, respectively. β is a material constant that influences the strain rate sensitivity in the hyperbolic sine model. The σ used is the flow stress at ε = 0.04. The values of β obtained are 0.23 and 0.19, while η1 represents another material constant that is involved in controlling the flow stress behavior and is calculated as the mean slope in the graph ln ε ˙ vs. ln(σ), as shown in Figure 121 = 53 for the warm regime and 14.04 for the hot one); therefore, α = β/η1 = 0.0044 and 0.0135, respectively.
The constant n is calculated as the mean slope of the correlations ln ε ˙ vs. ln(sinh(ασ)) (Figure 13), and it is n = 40.20 for the warm temperature range and n = 9.04 for the hot temperature range. Since the activation energy can be expressed as Q = nRs, where s is the slope of ln(sinh(ασ)) vs. 1000/T (Figure 14) and R is the gas constant, the value of the activation energy could be calculated. As can clearly be observed in Figure 14, the points plotted can be divided into two sets (corresponding to two temperature ranges), which are fitted by lines with different slopes. The warm range has a lower slope with respect to the hot one, and consequently the Q value derived is much lower, as can be seen in Table 3, which summarizes all the constant values found by applying Equation (1) to the warm and hot regime of the temperatures.
The activation energies found are 171 kJ/mole and 382 kJ/mole for the warm and hot ranges, respectively. In the literature, lower activation energies for the hot working of AA6060 alloy are reported. For example, Leo et al. found an activation energy of 308 kJ/mol for this alloy in the as–cast state when carrying out tensile tests between 400 and 490 °C and applying strain rates in the interval of 10−2–10−5 s−1 [20]. This value is not far from the one (382 kJ/mol) found in the present investigation considering that the highest temperature tested was 400 °C. El Mehtedi found a lower value of Q (206 kJ/mol) when testing the same alloy through hot torsion at strain rates of 0.01, 0.1, 1, and 5 s−1 in the temperature range from 400 to 550 °C [36]. Verlinden found an even lower Q (161 kJ/mol) after hot torsion in the temperature range of 390–520 °C and ε ˙ between 0.02 and 1 s−1 [4], which is close to the Q of the lattice self–diffusion of pure Al (143 kJ/mol) [32]. For some alloys of series 3000, higher values of Q were found (up to 539 kJ/mol for AA3015) depending on their microstructural characteristics [21,24]. It is important to emphasize that the parameters influencing the values of Q are numerous, including alloy composition, grain size, the presence of precipitates in the microstructure, deformation mechanisms (such as work hardening, recovery, and dynamic recrystallization), temperature, strain rate, and testing conditions (compression, tensile, torsion, etc.). Specifically, in the context of the present investigation, higher activation energy values are expected when calculated at lower temperatures within the dynamic recrystallization range, as nucleation and the growth of new grains, promoted by diffusional mechanisms, become more difficult. Additionally, a high density of intermetallic precipitates may result in a higher activation energy, as the deformation mechanisms in this alloy require overcoming more resistance to the dislocation motion, as well as the presence of impurities which, at higher temperatures, hinders the DRX. The activation energy in the warm temperature range, since the deformation processes at this temperatures are dislocation motion, multiplication, and piling up, requires an amount of energy lower than the one required for DRX, which, on the contrary, involves a complete microstructural change on a large scale.
The data of σ calculated by applying the model at the warm and hot temperature ranges were correlated with the experimental ones and, as can be observed in Figure 15, a very good correlation was obtained.
In the literature, the constitutive equations used to model the deformation behavior of Al alloys are of three types: a power–law equation, an exponential function, and a hyperbolic–sine function [27]. The first type is valid for relatively low levels of flow stress, while the second is applicable at relatively high levels of flow stress. The third type, which is used in the present investigation, covers a wider range of stress. To analyze the effect of deformation conditions on flow stress, the Zener–Hollomon parameter is used, which incorporates strain rate, temperature, and activation energy. In the present study, the temperature range was divided into two regimes, maintaining the same three strain rates, to calculate two different activation energy values (Q) associated with different mechanisms occurring in these temperature ranges. These values depend on different parameters related to the material characteristics. Vilamosa et al. [26], using the Bergstrom equation, separated the components of flow stress into three terms: one dependent only on temperature, another dependent on both temperature and strain rate, and the third related to strain hardening and, consequently, to dislocation density. This model can be applied over the entire temperature range, from low temperatures where strain hardening prevails over softening mechanisms to the high–temperature regime where the terms related to temperature become more significant. In their paper, Vilamosa applied this model to AA6060 with a very good fit to the data. However, no data on activation energy were included. Leo et al. [20] and Verlinden et al. [4] used the same sine–type equation as in the present study, while El Mehtedi [36] compared two different models (exponential function and hyperbolic sine–type function), finding a lower average absolute relative error when applying the hyperbolic sine–type equation.

4. Conclusions

In this study, compression tests in warm and hot regimes of temperatures ranging from 100 to 400 °C were conducted on a AA6060 alloy. The following main conclusions can be drawn:
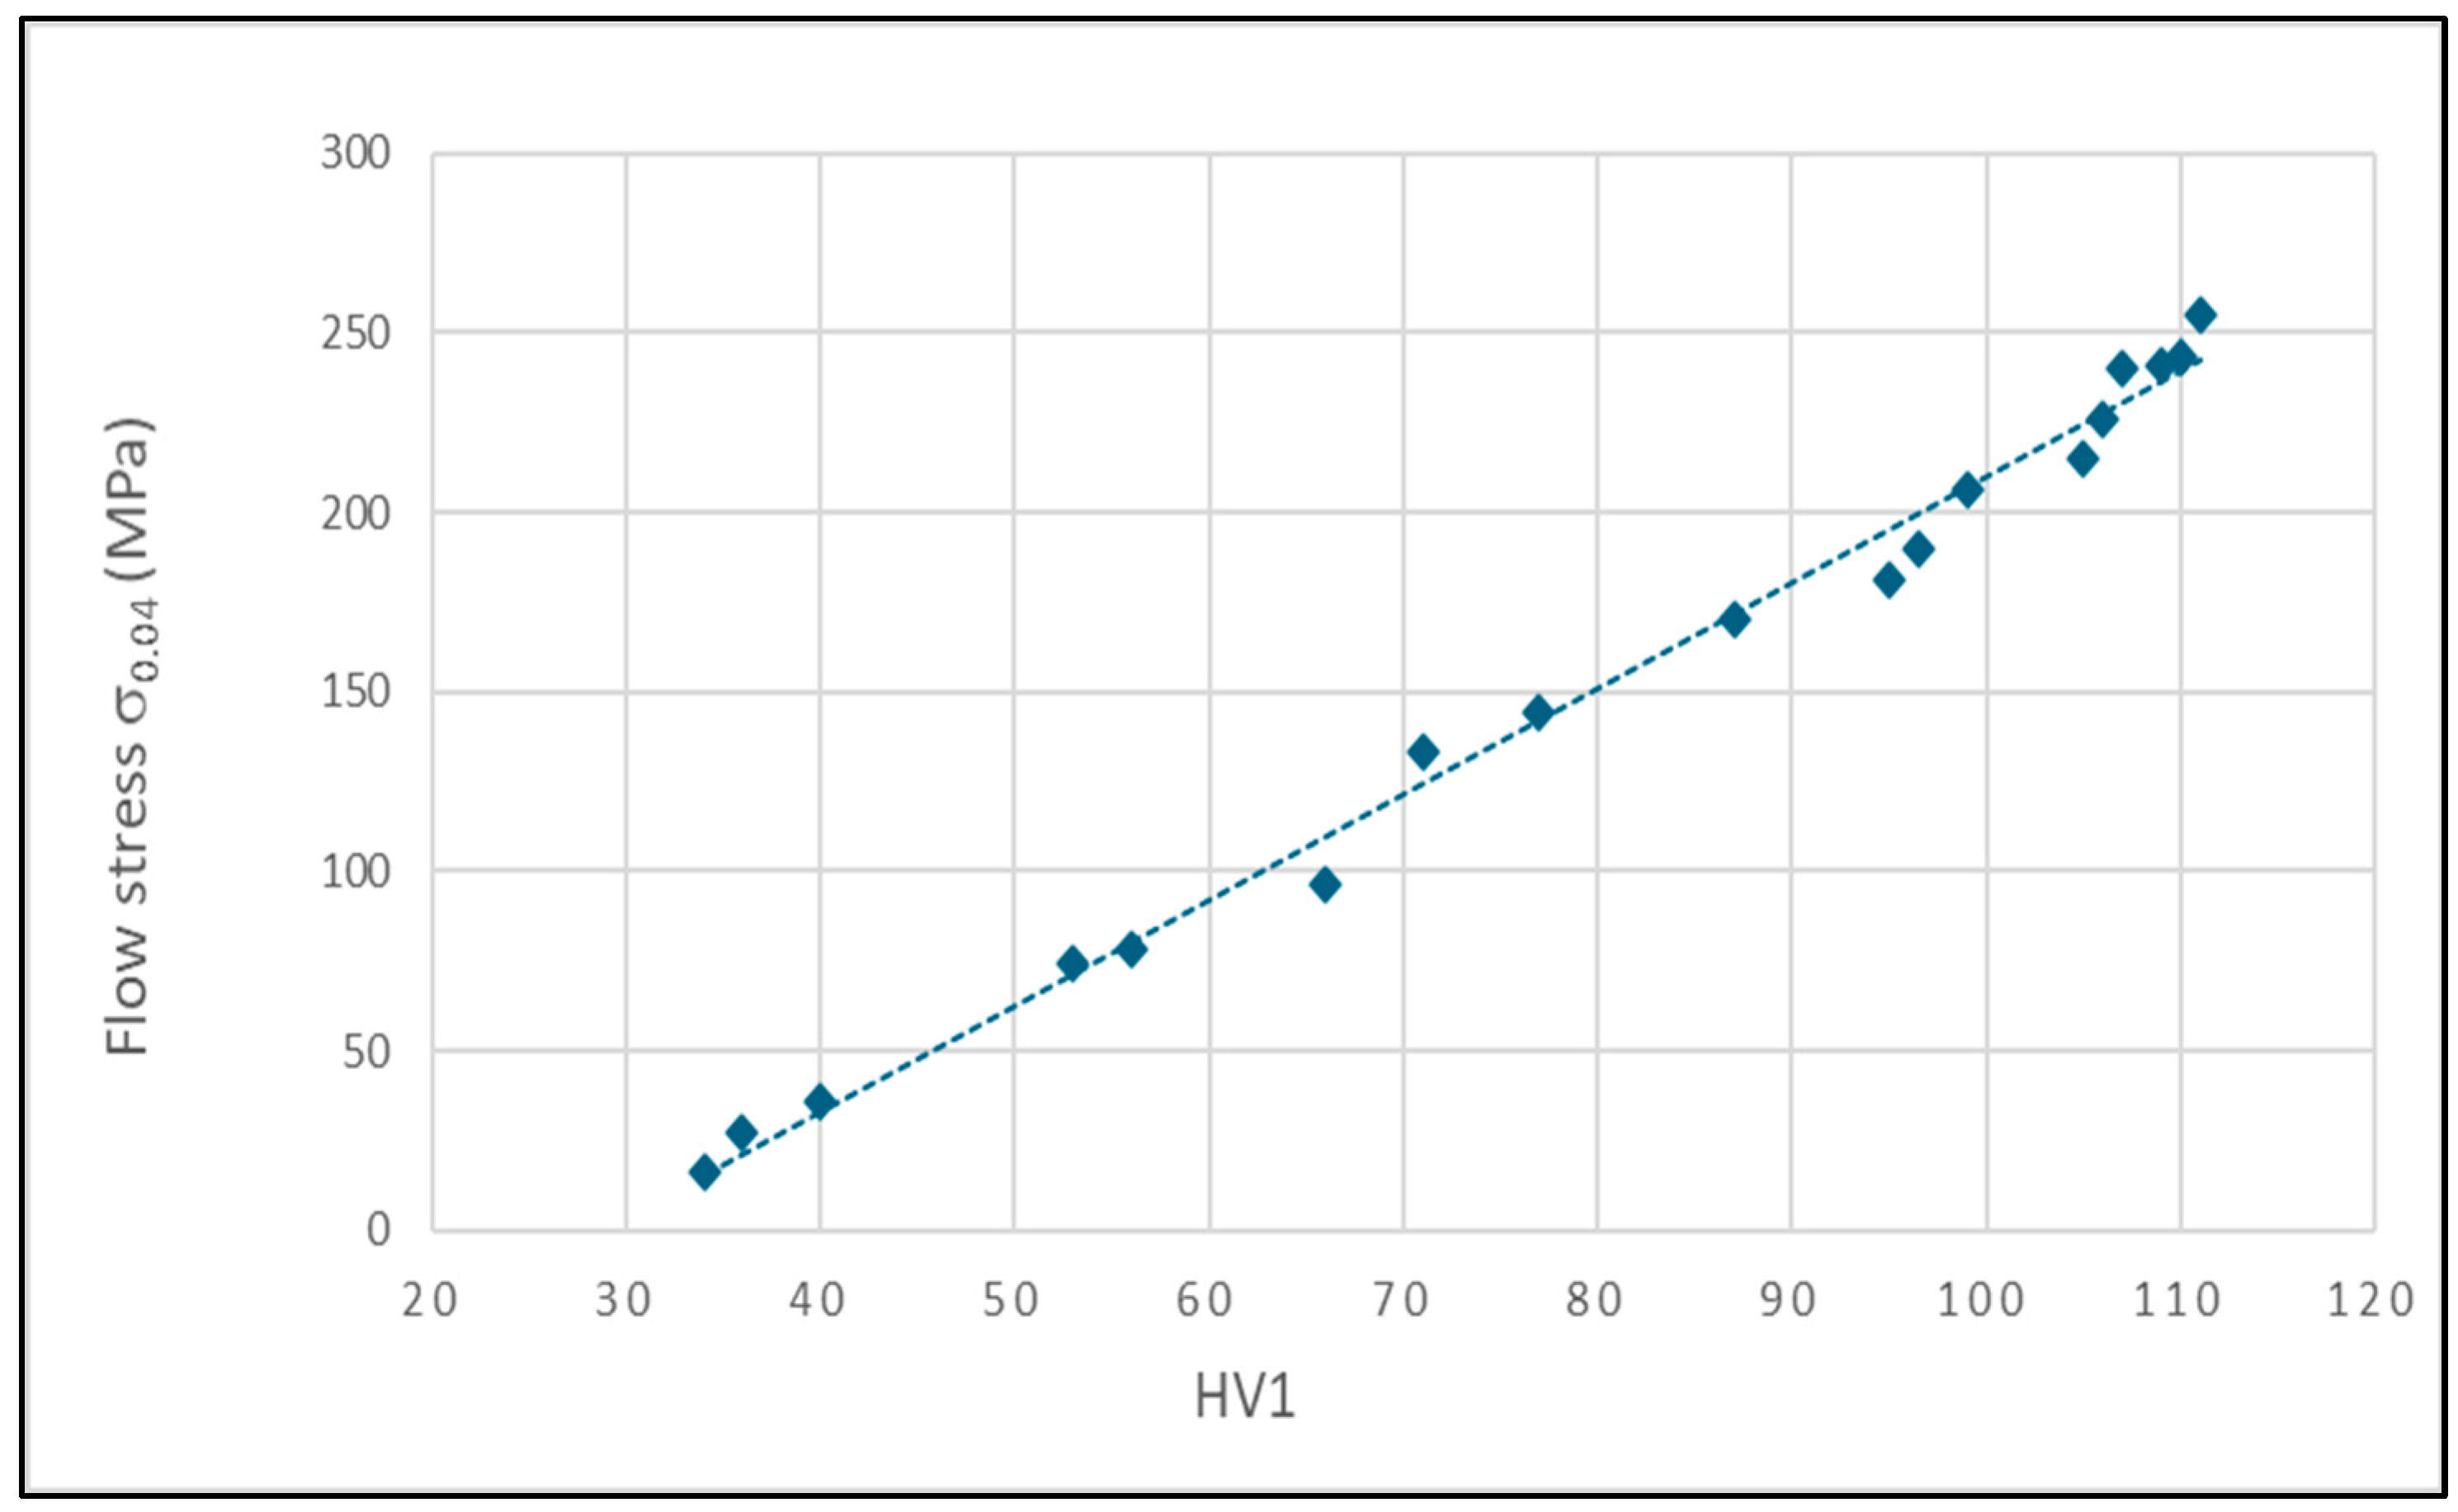
  • A very good linear correlation between flow stress and hardness was observed in both the warm and hot regimes;
  • Plastic deformation behavior has been studied by applying the hyper sine–type constitutive equation to both warm and hot regimes, verifying its suitability also to the warm temperature range (Tm < 0.55);
  • The constitutive constants were determined together with the activation energy for plastic deformation. The obtained Q value of the warm deformation is 171 kJ/mol, while the Q of the hot deformation is 382 kJ/mol;
  • The value of Q in the high–temperature regime is higher than that reported in the literature, as Q is related to the temperature range considered and the specific microstructural features of the alloy;
  • The two Q values are very different since the mechanisms involved at the two temperature ranges are different, with warm deformation characterized by dislocation motions, multiplications, and piling up, leading to strain hardening, while hot deformation involves dynamic recrystallization. This last phenomenon requires much higher energy since it involves microstructural changes on a large scale.

Author Contributions

Conceptualization, C.M. and G.S.; methodology, C.M.; validation, C.M. and G.S.; formal analysis, C.M. and G.S.; investigation, C.M. and G.S.; resources, G.S.; data curation, C.M. and G.S.; writing—original draft preparation, C.M.; writing—review and editing, C.M. and G.S.; supervision, G.S.; project administration, C.M. and G.S. All authors have read and agreed to the published version of the manuscript.

Funding

This research received no external funding.

Data Availability Statement

The original contributions presented in this study are included in the article. Further inquiries can be directed to the corresponding author.

Conflicts of Interest

The authors declare no conflict of interest.

References

  1. Bhaduri, A. Mechanical Properties and Working of Metals and Alloys; Springer: Berlin/Heidelberg, Germany, 2018; Volume 264. [Google Scholar]
  2. Li, J.; Wu, X.; Cao, L.; Liao, B.; Wang, Y.; Liu, Q. Hot deformation and dynamic recrystallization in Al–Mg–Si alloy. Mater. Charact. 2021, 173, 110976. [Google Scholar] [CrossRef]
  3. Vilamosa, V.; Clausen, A.H.; Hopperstad, O.S.; Børvik, T.; Skjervold, S. Influence of temperature and strain rate on the mechanical behaviour of the aluminium alloy AA6060. Mater. Sci. Forum 2014, 794–796, 520–525. [Google Scholar] [CrossRef]
  4. Verlinden, B.; Suhadi, A.; Delaey, L. A generalized constitutive equation for an AA6060 aluminium alloy. Scr. Met. Mater. 1993, 28, 1441–1446. [Google Scholar] [CrossRef]
  5. Qian, X.; Parson, N.; Chen, X.G. Effect of Homogenization Treatment and Microalloying with Mn on the Microstructure and Hot Workability of AA6060 Aluminum Alloys. J. Mater. Eng. Perform. 2019, 28, 4531–4542. [Google Scholar] [CrossRef]
  6. Mofarrehi, M.; Javidani, M.; Chen, X.G. Effect of Mn content on the hot deformation behavior and microstructure evolution of Al–Mg–Mn 5xxx alloys. Mater. Sci. Eng. A 2022, 845, 143217. [Google Scholar] [CrossRef]
  7. Li, K.; Pan, Q.; Li, R.; Liu, S.; Huang, Z.; He, X. Constitutive Modeling of the Hot Deformation Behavior in 6082 Aluminum Alloy. J. Mater. Eng. Perform. 2019, 28, 981–994. [Google Scholar] [CrossRef]
  8. Feng, X.; Wang, Y.; Huang, Q.; Liu, H.; Zhang, Z. The dynamic recrystallization microstructure characteristics and the effects on static recrystallization and mechanical properties of Al–Mg–Si alloy. Mater. Sci. Eng. A 2024, 899, 146454. [Google Scholar] [CrossRef]
  9. Winzer, R.; Glinicka, A. The static and dynamic compressive behaviour of selected aluminium alloys. Eng. Trans. 2011, 59, 85–110. [Google Scholar]
  10. Huang, K.; Logé, R.E. A review of dynamic recrystallization phenomena in metallic materials. Mater. Des. 2016, 111, 548–574. [Google Scholar] [CrossRef]
  11. Sellars, G.J.D.C.M. Hot Working and Forming Processes; Metals Society: London, UK, 1980. [Google Scholar]
  12. McQueen, H.J.; Langdon, T.G.; Mercahnt, H.D.; Morris, J.G.; Zaidi, M.A. Hot Deformation of Aluminum Alloys; TMS-AIME: Warrendale, PA, USA, 1991. [Google Scholar]
  13. McQueen, H.J.; Ryan, N.D. Constitutive analysis in hot working. Mater. Sci. Eng. A 2002, 322, 43–63. [Google Scholar] [CrossRef]
  14. Sellars, C.M. Modelling microstructural development during hot rolling. Mater. Sci. Technol. 1990, 6, 1072–1081. [Google Scholar] [CrossRef]
  15. Sellars, C.M.; McTegart, W.J. On the mechanism of hot deformation. Acta Met. 1966, 14, 1136–1138. [Google Scholar] [CrossRef]
  16. McQueen, H.J.; Spigarelli, S.; Kassner, M.E.; Evangelista, E. Hot Deformation and Processing of Aluminum Alloys; CRC Press: Boca Raton, FL, USA, 2016. [Google Scholar] [CrossRef]
  17. Menapace, C.; Sartori, N.; Pellizzari, M.; Straffelini, G. Hot Deformation Behavior of Four Steels: A Comparative Study. J. Eng. Mater. Technol. Trans. ASME 2018, 140, 021006. [Google Scholar] [CrossRef]
  18. Siyasiya, C.W.; Stumpf, W.E. Constitutive Constants for Hot Working of Steels: The Critical Strain for Dynamic Recrystallisation in C-Mn Steels. J. Mater. Eng. Perform. 2014, 24, 468–476. [Google Scholar] [CrossRef]
  19. Schindler, I.; Opěla, P.; Kawulok, P.; Sauer, M.; Rusz, S.; Kuc, D.; Rodak, K. Hot deformation activation energy of metallic materials influenced by strain value. Arch. Metall. Mater. 2021, 66, 223–228. [Google Scholar] [CrossRef]
  20. Leo, P.; Cerri, E. Hot tensile behaviour of a 6060 alloy in the as-cast and heat treated state. Metall. Ital. 2011, 103, 3–9. [Google Scholar]
  21. Zhang, J.X.; Sun, H.Y.; Du, P.; Liu, W.C. Effect of Processing Method on the Recrystallization Behavior of Cold-Rolled AA3003 Aluminum Alloy. J. Mater. Eng. Perform. 2020, 29, 4286–4294. [Google Scholar] [CrossRef]
  22. Yashin, V.; Aryshenskii, E.; Hirsch, J.; Konovalov, S.; Latushkin, I. Study of recrystallization kinetics in AA5182 aluminium alloy after deformation of the as-cast structure. Mater. Res. Express 2019, 6, 066552. [Google Scholar] [CrossRef]
  23. Tajally, M.; Huda, Z. Recrystallization kinetics for aluminum alloy 7075. Met. Sci. Heat Treat. 2011, 53, 213–217. [Google Scholar] [CrossRef]
  24. Liu, W.C.; Morris, J.G. Evolution of Recrystallization and Recrystallization Texture in Continuous-Cast AA 3015 Aluminum Alloy. Met. Mater. Trans. A 2005, 36, 2829–2848. [Google Scholar] [CrossRef]
  25. Evangelista, E.; Forcellese, A.; Gabrielli, F.; Mengucci, P. Hot formability of AA 6061 PM Aluminium Alloy. J. Mater. Process. Technol. 1990, 24, 323–332. [Google Scholar] [CrossRef]
  26. Vilamosa, V.; BÃrvik, T.; Hopperstad, O.S.; Clausen, A.H. Behaviour and modelling of aluminium alloy AA6060 subjected to a wide range of strain rates and temperatures. EPJ Web Conf. 2015, 94, 04018. [Google Scholar] [CrossRef]
  27. Churyumov, A.Y.; Teleshov, V.V. Quantitative description of the flow-stress dependence of aluminum alloys at the stage of steady flow upon hot deformation on the Zener–Hollomon parameter. Phys. Met. Metallogr. 2017, 118, 905–912. [Google Scholar] [CrossRef]
  28. Marioara, C.D.; Andersen, S.J.; Zandbergen, H.W.; Holmestad, R. The influence of alloy composition on precipitates of the Al–Mg–Si system. Metall. Mater. Trans. A 2005, 36, 691–702. [Google Scholar] [CrossRef]
  29. Menapace, C.; Bernard, F.; Lusa, M.; Ischia, G.; Straffelini, G. Effect of a dual-rate ageing treatment on the tensile properties of a commercial 6060 Al alloy. Mater. Sci. Eng. A 2021, 819, 141468. [Google Scholar] [CrossRef]
  30. Ghosh, A.K. A physically-based constitutive model for metal deformation. Acta Met. 1980, 28, 1443–1465. [Google Scholar] [CrossRef]
  31. Zhu, L.; Liu, Z.; Zhang, Z. Investigation on strengthening of 7075 aluminum alloy sheet in a new hot stamping process with pre-cooling. Int. J. Adv. Manuf. Technol. 2019, 103, 4739–4746. [Google Scholar] [CrossRef]
  32. Anderson, K.; Weritz, J.; Kaufman, J.G. ASM Handbook®, Volume 2B—Properties and Selection of Aluminum Alloys; ASM International: Almere, The Netherlands, 2019; Volume 2. [Google Scholar]
  33. Khelfa, T.; Muñoz-Bolaños, J.A.; Li, F.; Cabrera-Marrero, J.M.; Khitouni, M. Strain-Hardening Behavior in an AA6060-T6 Alloy Processed by Equal Channel Angular Pressing. Adv. Eng. Mater. 2021, 23, 2000730. [Google Scholar] [CrossRef]
  34. Moghadam, N.N.; Serajzadeh, S. Warm and hot deformation behaviors and hot workability of an aluminum-magnesium alloy using artificial neural network. Mater. Today Commun. 2023, 35, 105986. [Google Scholar] [CrossRef]
  35. Cavaliere, P. Hot and warm forming of 2618 aluminium alloy. J. Light Met. 2002, 2, 247–252. [Google Scholar] [CrossRef]
  36. El Mehtedi, M.; Spigarelli, S.; Gabrielli, F.; Donati, L. Comparison Study of Constitutive Models in Predicting the Hot Deformation Behavior of AA6060 and AA6063 Aluminium Alloys. Mater. Today Proc. 2015, 2, 4732–4739. [Google Scholar] [CrossRef]
Figure 1. Initial 6060 alloy sample microstructure; (a) optical microscope; (b) SEM.
Metals 15 00224 g001
Figure 2. DSC curve of 6060 alloy.
Metals 15 00224 g002
Figure 3. Hot compression curves at different temperatures and (a) ε ˙ = 0.001 s−1, (b) ε ˙ = 0.01 s−1, and (c) 0.001 s−1.
Metals 15 00224 g003
Figure 4. Flow stresses corresponding to ε = 0.04 obtained from the hot compression curves.
Metals 15 00224 g004
Figure 5. (a) Sample deformed at 100 °C—0.001 s−1 (warm regime); (b) sample deformed at 400 °C—0.001 s−1 (hot regime).
Metals 15 00224 g005
Figure 6. HV1 after compression tests at different temperatures.
Metals 15 00224 g006
Figure 7. Flow stresses, σ0.04, vs. HV1.
Metals 15 00224 g007
Figure 8. log(σ) vs. log(ε) curve used to calculate the strain hardening exponent n, as a slope of this line, according to the Hollomon equation (Equation (2)) at (a) 100 °C—0.1 s−1, (b) 150 °C—0.1 s−1, and (c) 200°C—0.1 s−1.
Metals 15 00224 g008
Figure 9. Strain hardening exponent n as a function of temperature.
Metals 15 00224 g009
Figure 10. Strain rate sensitivity m as a function of temperature.
Metals 15 00224 g010
Figure 11. ln ε ˙ vs. σ for warm (a) and hot regimes (b).
Metals 15 00224 g011
Figure 12. ln ε ˙ vs. lnσ for warm (a) and hot regimes (b).
Metals 15 00224 g012
Figure 13. ln ε ˙ vs. ln(sinh(ασ)) used for the determination of n for warm (a) and hot regimes (b).
Metals 15 00224 g013
Figure 14. ln(sinh(ασ)) vs. 1000/T used for the determination of the activation energy.
Metals 15 00224 g014
Figure 15. Calculated σp vs. experimental σp.
Metals 15 00224 g015
Table 1. Strain hardening exponent n determined from hot compression curves.
Strain Rate100 °C150 °C200 °C
0.001 s−10.1160.0950.087
0.01 s−10.1120.0930.084
0.1 s−10.1030.0910.081
Table 2. Strain rate sensitivity m determined from hot compression curves.
Strain Rate Sensitivity100 °C150 °C200 °C250 °C300 °C400 °C
m0.0120.0240.0280.0530.0570.176
Table 3. Constants of the constitutive model applied at two different temperature ranges (warm and hot).
Temperature Rangeβη1αnsQ (kJ/mole)A
warm0.2148.840.004437.040.561712.9 × 1017
hot0.1813.120.01358.335.533824.1 × 1031
Disclaimer/Publisher’s Note: The statements, opinions and data contained in all publications are solely those of the individual author(s) and contributor(s) and not of MDPI and/or the editor(s). MDPI and/or the editor(s) disclaim responsibility for any injury to people or property resulting from any ideas, methods, instructions or products referred to in the content.

