Abstract
There is a concern regarding sub-surface pores within laser powder bed fusion of Ti-6Al-4V, which can initiate cracks and reduce mechanical properties, especially after machining for surface finishing. This study investigated the effect of laser scanning speed and fine shot peening on the pore characteristics, hardness, and residual stress of Ti-6Al-4V fabricated by laser powder bed fusion using scanning electron microscopy, X-ray micro-computed tomography, Vickers hardness, and X-ray diffraction. As the laser scanning speed increased, the number of pores and pore size increased, which reduced the hardness of Ti-6Al-4V. Most pores were less than 20 µm in size and randomly distributed. The fine shot peening generated plastic deformation and compressive residual stress on the surface, leading to higher hardness, with similar surface properties at all scanning speeds. The depth of compressive residual stress by fine shot peening varied corresponding to the scanning speeds. Increasing the scanning speed accelerated the rate of conversion between the compressive and tensile residual stresses, and decreased the depth of the maximum hardness by the fine shot peening from initial tensile residual stress within Ti-6Al-4V fabricated by laser powder bed fusion, thus reducing the enhancement achieved by the fine shot peening.
1. Introduction
Ti-6Al-4V is an α + β alloy, known for its exceptional strength-to-weight ratio, wear and corrosion resistance, and good biocompatibility with the human body. Ti-6Al-4V is one of the most widely used titanium alloys across various industries, including the automotive, aerospace, and medical fields [1,2]. However, there is a challenge in its suitability for medical applications due to constraints posed by conventional manufacturing processes. Conventional manufacturing processes are widely recognized for their time-consuming nature in producing complex shapes, especially Ti-6Al-4V due to its high-strength characteristic [3]. In recent decades, additive manufacturing (AM) has gained substantial attention in various industries. AM provides several advantages compared with conventional manufacturing, including improved material management, enhanced design flexibility, and the ability to create highly complex designs with near-net shapes using computer-aided design (CAD) as a fabrication tool [4,5,6]. As a result, AM has seen growing applications in the medical device manufacturing industry, facilitating the production of custom-made devices for modern medical treatments [7]. Laser powder bed fusion (PBF-LB/M), such as selective laser melting (SLM), has emerged as one of the most widely used technologies for manufacturing medical applications [8,9]. However, there are inherent limitations associated with the characteristics of as-built PBF-LB/M components. These characteristics relate to a poor surface finish, thermal residual stress, defects, and anisotropic microstructures. These characteristics can significantly influence product performance, particularly in medical applications, potentially resulting in a diminished lifespan or even device failure [10,11,12].
Post-process treatments have gained significant importance in the field of additive manufacturing, as they offer a means to modify materials to meet specific application requirements. For instance, machining and abrasive blasting are currently common techniques for surface finishing to achieve precise dimensions and a smooth surface on PBF-LB/M components [13,14,15]. However, many studies raised concerns about the detrimental effects of sub-surface pores on strength and fatigue properties, especially after surface-finishing processes. These pores were identified as stress concentrations that could initiate cracks near the surface of PBF-LB/M components [16,17,18]. In the study conducted by Kumar et al. [19], the shot peening (SP) process emerged as a promising method for enhancing the properties of SLM Ti-6Al-4V [20]. This process has demonstrated the capability to increase bending fatigue strength to 55% of the tensile strength, which is comparable to the wrought Ti-6Al-4V. The SP process effectively closed near-surface pores within the severely plastic-deformed layer and shifted the initiation site for cracks to a deeper level due to the induced compressive stress. In our study, fine shot peening (FSP) was employed. This process is similar to SP but uses finer particles, typically less than 200 μm in size, and utilizes high-impact energy. The FSP can induce greater compressive residual stress and severe plastic deformation on the surface without changing the internal properties or dimensions [21,22,23]. By applying the FSP, the surface properties are expected to be further enhanced. Consequently, this study focuses on the effect of FSP on the surface properties of PBF-LB/M Ti-6Al-4V.
In addition, this study also investigated the effect of laser scanning speed, one of the main PBF-LB/M parameters. Recent research has highlighted the substantial influence of laser scanning speed on the porosity fraction within PBF-LB/M Ti-6Al-4V. Even a 1 vol% porosity can have detrimental effects on mechanical properties, particularly when higher scanning speeds are employed, potentially resulting in the formation of an undesirable lack of fusion (LOF) pore type [24]. While PBF-LB/M is recognized for its cost-effective manufacturing capabilities, its build speed lags behind that of other additive manufacturing (AM) processes. Therefore, it is crucial to enhance the build rate of PBF-LB/M without compromising quality to further improve its capability for mass production [25]. Therefore, this study aims to investigate the effects of increasing the laser scanning speed beyond the optimized speed and fine shot peening (FSP) on pore characteristics, including pore size, shape, and distribution pattern, as well as hardness and residual stress of PBF-LB/M Ti-6Al-4V. By conducting the investigation, this study is expected to advance the understanding of PBF-LB/M Ti-6Al-4V for further development of medical applications.
2. Materials and Methods
2.1. Materials
Ti-6Al-4V grade 23 powder from Advanced Powders and Coatings Inc., Canada, was used for the laser powder bed fusion (PBF-LB/M). The powder shape is spherical from the APATM Plasma Atomization process. The chemical composition of the powder is shown in Table 1. The apparent density of the powder is 2.53 g/cm3 and it has a median size of 35 µm (D10: 23 µm, D90: 47 µm). Ti-6Al-4V specimens were fabricated in a TRUMPF TruPrint1000 PBF-LB/M machine equipped with a TRUMPF fiber laser (Trumpf, Ditzingen, Germany). The fabrication was performed in an Ar gas environment to prevent any oxidation. Rectangular specimens with dimensions of 10 mm × 10 mm × 41 mm were built in the vertical direction relative to the substrate (Z-axis). The varying parameter was the laser scanning speed (v), including 905, 1260, and 1500 mm/s for label names of O, L1, and L2, respectively. Other parameters, such as laser power (P), hatch distance (s), layer thickness (t), and scanning pattern remained at their default values in all conditions. Volumetric energy density (E) was calculated in each condition using the following equation [8]. The summary of processing parameters is presented in Table 2.

Table 1.
Chemical compositions of Ti–6Al–4V powder (wt.%).

Table 2.
PBF–LB/M processing parameters for the fabrication of Ti–6Al–4V using the TRUMPF 1000 machine.
After the PBF-LB/M fabrication, the as-built specimens were cut into small pieces by electrical discharge machining (EDM, V500G, EXCETEK, Taichung City, Taiwan) and then went through surface polishing using the SiC abrasive paper up to 1500 grit size with an arithmetic mean deviation of the assessed profile (Ra) of around 0.4 µm to remove any irregularities or contaminants, ensuring a smooth and uniform surface. Then, the specimens were divided into two groups: the as-polished condition and the after-FSP condition.
2.2. Fine Shot Peening (FSP) Process
In the condition of after-FSP, the surfaces of the specimens were treated under the following FSP parameters using silica media (silicon dioxide, SiO2) with a size of around 80 µm. The silica media were shot at a 90-degree angle of the nozzle from the specimen surface, at a shooting distance of 20 cm from the specimen surface, with a shooting pressure of 0.5 MPa and 100% peening coverage [26]. The FSP was only performed in the x–z plane (parallel to the build direction) in this study as shown in Figure 1.
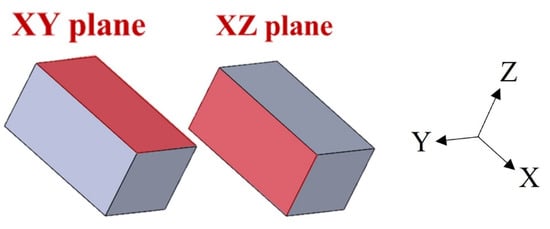
Figure 1.
The observed planes on the PBF–LB/M specimens.
2.3. Methods
After the PBF-LB/M fabrication, the experiments were conducted as follows. The density in the as-polished condition was measured 15 times using the Archimedes method for each condition. The relative density was determined by comparing the measured density to the theoretical density of Ti-6Al-4V, which is 4.43 g/cm3. To analyze the pore characteristics, the as-polished condition was prepared by polishing with abrasive paper up to 2000 grit, followed by 1 µm and 0.3 µm alumina, and finally, OP-S for achieving a mirror surface finish. Subsequently, pore shapes were observed in two planes: the x–y plane (perpendicular to the build direction) and the x–z plane (parallel to the build direction), with the build direction aligned along the z-axis. This observation was conducted using field-emission scanning electron microscopy (FESEM, JSM-7900F, JEOL, Tokyo, Japan) at a voltage of 15 kV. The pore distribution pattern was analyzed using X-ray micro-computed tomography (Micro-CT, SKYSCAN 1173, Karlsdorf-Neuthard, Germany) with parameters as shown in Table 3. Rectangular specimens made via EDM were examined with dimensions of 2 mm × 4 mm × 10 mm in size. The observation at each scanning speed was conducted by maintaining an identical position. Multiple 2D cross-sectional images were acquired from the specimens, and these images were stacked together to construct 3D models using CTvol software version 2.3.2.1. The analysis was carried out using CT Analyzer software version 1.18.9.0+. The resolution of the Micro-CT images was determined by the voxel size, which was set at 6 µm for this study. The pore size distribution in the as-polished condition was measured using ImageJ software version 1.53k on both planes, with observation at each scanning speed conducted while maintaining an identical position. This analysis was performed using 2D cross-sectional analysis with an optical microscope (OM, BX51M, OLYMPUS, Waltham, MA, USA).

Table 3.
Micro–CT parameters using the Bruker SkyScan 1173.
The microstructures of the as-polished condition were characterized using both field-emission scanning electron microscopy (FESEM, JSM-7900F, JEOL, Tokyo, Japan) and scanning electron microscopy (SEM, JCM-7000, JEOL, Tokyo, Japan) in secondary electron (SE) and backscattered electron (BSE) modes at a voltage of 15 kV. The specimens were polished to a mirror surface finish and then etched with Kroll’s reagent before observation on both planes, with identical positioning for each scanning speed. The phase composition was analyzed on both planes using X-ray diffraction (XRD, D8 Advance Eco, BRUKER, Karlsruhe, Germany) with Cu-Kα radiation. The XRD operated at a voltage of 40 kV and a current of 25 mA. Diffraction angles (2θ) were measured from 30° to 90° with a time/step of 0.3 s and an increment angle of 0.0204°.
The surface morphology of the as-polished and after-FSP conditions was examined in the x–z plane using SEM in SE mode at a voltage of 15 kV. The surface roughness of both conditions was assessed using a 3D optical profiler (VR-5200, KEYENCE, Mechelen, Belgium), and the arithmetic mean deviation of the assessed profile (Ra) was calculated according to ISO 4287. Measurements were taken at a distance of 4 mm, and each condition was evaluated 10 times. In the after-FSP condition, elemental mapping analysis on the x–z plane was conducted using electron probe microanalysis (EPMA, EPMA-1600, SHIMADZU, Kyoto, Japan) with SEM in BSE mode imaging at 15 kV.
Subsequently, the enhancement via fine shot peening of PBF-LB/M Ti-6Al-4V was investigated for each scanning speed. Vickers hardness was assessed in both planes according to ASTM E92, employing a force of 1.961 N (HV0.2) with a holding time of 10 s. The cross-section surfaces in the x–y plane were polished to a mirror surface finish, and Vickers hardness testing was conducted in the same plane. A force of 490.3 mN (HV0.05) was applied with a holding time of 10 s, measuring the hardness at 10 µm intervals up to a depth of 150 µm from the surface using a testing machine (HMV-G, SHIMAZU, Kyoto, Japan).
The residual stress in both the as-polished and after-FSP conditions was measured in the x–z plane using X-ray diffraction (XRD) with Cu-Kα radiation, an accelerating voltage of 40 kV, and a current of 25 mA. The diffraction angle (2θ) ranged from 137° to 146° with a time/step of 0.6 s and an increment angle of 0.0202°. The diffraction plane was (213) α-Ti, and the psi angle (ψ) varied between 0° and 45°. The residual stress was calculated using the “sin2 ψ” method, employing the slope of sin2 ψ vs. θ. The data collection began at the FSP surface and extended to a depth of 150 µm from the surface for all scanning speeds. The full width at half maximum (FWHM) measurements were also collected at different depths in the residual stress measurement. An electrochemical drilling process was used employing a mixture of 10% perchloric acid and 90% methanol as an electrolyte. The drilling step was 10 µm at each point [27]. Both the as-polished and after-FSP conditions were examined on the same specimen, with different lateral surfaces, while controlling the height and position to be identical for each scanning speed. The examination diameter was 5 mm, located in the middle of the lateral surface as shown in Figure 2.
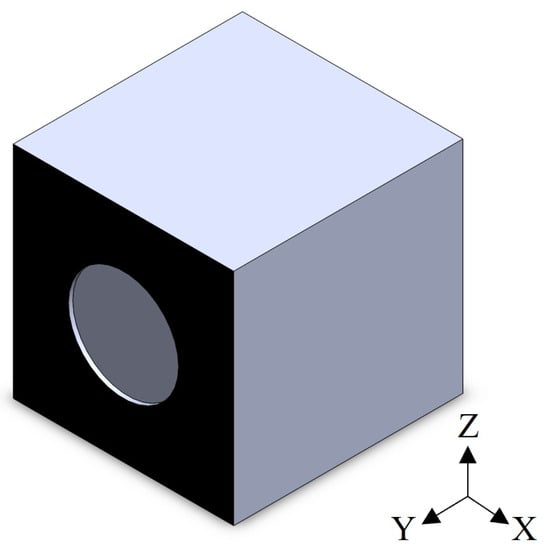
Figure 2.
Cuboid specimens for the residual stress measurement. The examined area is located in the middle with a diameter of 5 mm (black tape was used to prevent diffraction of other areas).
3. Results and Discussion
3.1. Effect of Laser Scanning Speed on Pore Characteristics, Microstructure, and Hardness of PBF-LB/M Ti-6Al-4V
3.1.1. Density and Pore Characteristics
The PBF-LB/M Ti-6Al-4V was fabricated with different laser scanning speeds of 905 (O), 1260 (L1), and 1500 (L2) mm/s. It found that the relative density exhibited a slight decrease with an increase in laser scanning speed. Specifically, the relative density values were 99.51% for O, 99.38% for L1, and 98.96% for L2. This can be attributed to the reduction in laser energy density from an increase in the laser scanning speed during the melting process, which affected the ability of the laser to fully melt the metal powder, leading to an increase in porosity within the specimens.
To analyze pore characteristics, pore shapes were observed using scanning electron microscopy (SEM). The SEM results revealed two types of pores present in all conditions. The first type, as shown in Figure 3a, consisted of spherical pores measuring less than 10 µm, which were expected to result from gas entrapment due to the high cooling rate of the laser melting process. The second type, illustrated in Figure 3b, was the lack of fusion (LOF) pores caused by a decrease in laser energy density during the PBF-LB/M process from an increase in laser scanning speed, leading to improper fusion between subsequent scan tracks or deposited layers. Based on the observation, the volumetric fraction of LOF was found to increase, correlating with higher laser scanning speed. These two pore types exhibited significant differences in terms of size and shape, with the LOF pores being larger and having sharper edges compared with the gas pores. Additionally, the LOF pores appeared more elongated compared with the gas pores.
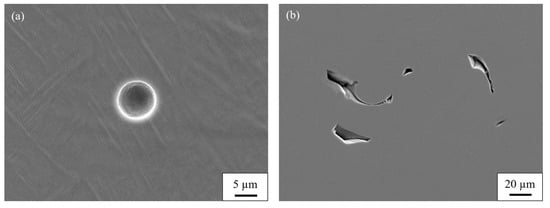
Figure 3.
Types of pores within PBF–LB/M Ti–6Al–4V: (a) gas pores; (b) lack of fusion (LOF) pores.
The pore distribution pattern was analyzed using X-ray micro-computed tomography (Micro-CT). The 3D models generated using CTvol software version 2.3.2.1 for each condition are depicted in Figure 4. The gray area represents the material while the red area represents the pores detected by the Micro-CT. Pores were identified by applying a threshold value to the images using CT Analyzer software version 1.18.9.0+, which enabled the visualization and detection of pores within the material. From the models, the number of detected pores was lower than expected compared with the Archimedes in Table 4. Similar findings were reported by Promoppatum et al. [28] in their study on pore detection using Micro-CT. The limited detection of pores was attributed to the detection capability of the Micro-CT which depended on the voxel size determined by the size of the specimen and the capacity of the machine. In this study, a voxel size of 6 µm was utilized, which indicated that pores smaller than approximately 18 µm may not have been detected. Therefore, it was possible that numerous small pores were not detectable by the Micro-CT, and the 3D models only displayed relatively large pores. The magnified images of pores in Figure 4 showed only the pore shape in each condition (no correlation with scale bar). The pore distribution pattern was random in all the conditions. Nonetheless, the number of detected pores and pore size still appeared to increase relatively with the laser scanning speed. To confirm the assumption of numerous small pores within the material, the pore size distribution using 2D cross-sectional analysis by OM was measured in both planes as depicted in Figure 5.
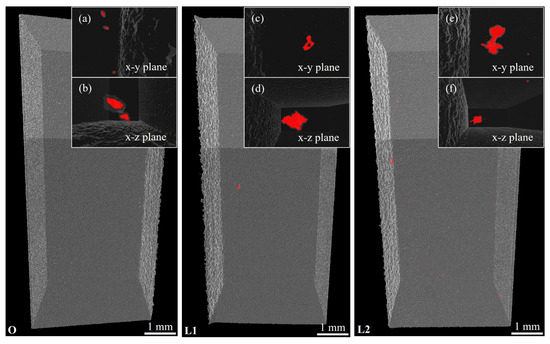
Figure 4.
The 3D models obtained from the Micro–CT with magnified images of pores in each condition are as follows: (a,b) 905 mm/s, O; (c,d) 1260 mm/s, L1; and (e,f) 1500 mm/s, L2. The magnified images showed only the pore shape in each condition (no correlation with the scale bar).

Table 4.
Relative density of PBF–LB/M Ti–6Al–4V varying laser scanning speeds by Archimedes method and Micro–CT.
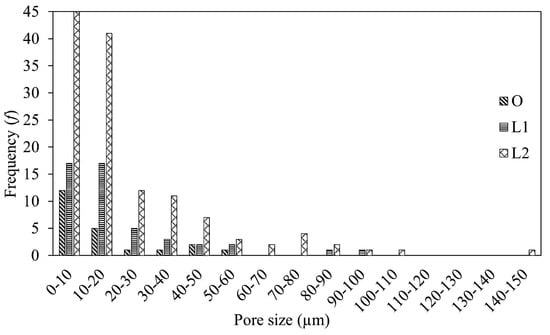
Figure 5.
Pore size distribution by 2D cross–sectional analysis.
From the pore size distribution result, most of the pores at all laser scanning speeds were smaller than 20 µm in size. Large pores, approximately larger than 60 µm, were only observed in the L1 and L2 conditions. The findings confirmed the assumption from the Micro-CT result, whereby the number of pores and the pore size increased with the higher laser scanning speeds. Moreover, as the laser scanning speed increased, the volumetric fraction of the LOF pore type (implied by the large pores) was found to increase within the material. These phenomena were possibly related to a discontinuous molten pool from lower laser energy input as well as a higher cooling rate [29]. Consequently, these led to a higher pore fraction consisting of both gas pores and LOF pores within the material. When comparing the Archimedes method and the Micro-CT, the Archimedes was more accurate for density measurement, but the Micro-CT provided a more complete visualization of the pore distribution pattern in this study.
3.1.2. Microstructural Characterization
Microstructures of PBF-LB/M Ti-6Al-4V were characterized using scanning electron microscopy (SEM) as shown in Figure 6. The microstructures of all conditions in both planes consisted of prior β grains filled with needle-like microstructures of the α′ martensite, regardless of the laser scanning speeds. The white needle-like microstructures represent the α′ martensite. The prior ꞵ grains were elongated along the dashed line. This can be attributed to the melting temperature exceeding the β transus temperature of approximately 990 °C followed by rapid solidification. Consequently, the metastable α′ martensite occurred by diffusionless and shear-type transformation processes. The α′ martensite nucleated at the prior β grain boundaries, which grow within the prior β grains and then spread into the neighboring β grains [30]. The prior β grains appeared elongated parallel to the build direction (BD) as the preferential growth direction of β grain <001> [31]. When comparing the x–y and x–z planes, the preferential growth direction of prior β grains was different, indicating the anisotropic microstructure of PBF-LB/M Ti-6Al-4V. Moreover, the α′ martensite appeared slightly shorter with increasing laser scanning speed, due to a higher cooling rate during the melting process. As a result, the condition with the highest laser scanning speed of 1500 mm/s (L2) exhibited the smallest microstructure. However, the difference between conditions was not significant.
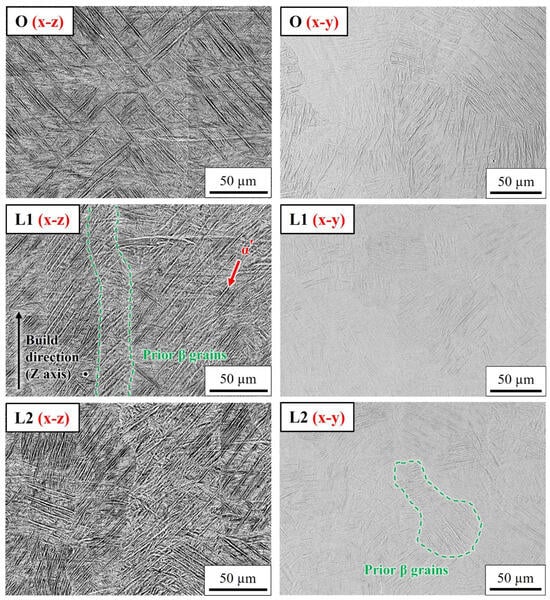
Figure 6.
Backscattered electron micrographs showing microstructures on the x–z and x–y planes of PBF–LB/M Ti–6Al–4V with different laser scanning speeds.
X-ray diffraction (XRD) was used to identify the phase composition. First, the optimized speed of 905 mm/s (O) condition was examined on both planes as shown in Figure 7. The XRD patterns exhibited the strong characteristics of HCP α/α′-Ti without an obvious β phase. However, the XRD profiles show different peak intensities between the x–y and x–z planes, which are related to the dissimilar thermal characteristics in both planes during the PBF-LB/M process. This dissimilarity arises because thermal dissipation primarily occurs along the negative z-axis (build direction) toward the substrate. The variation in peak intensities also indicates dissimilar crystallographic textures in both planes, which have different fractions of α/α′ crystallographic orientation, namely basal, pyramidal, and prismatic orientations [32].
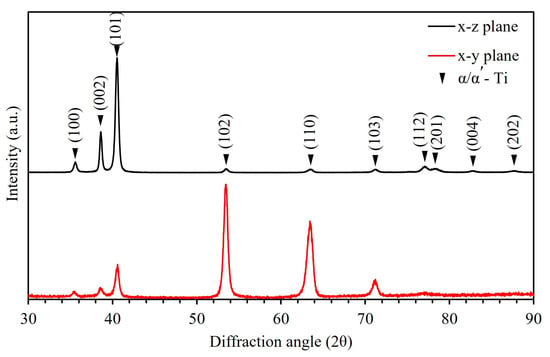
Figure 7.
Comparison of XRD profiles showing phase composition on both planes using the laser scanning speed of 905 mm/s (O).
XRD profiles of PBF-LB/M Ti-6Al-4V on the x–z plane with the various laser scanning speeds are presented in Figure 8. The XRD peak intensity exhibited the presence of HCP α/α′-Ti without any noticeable β phase at all scanning speeds. There was a slight increase in the peak intensity (2θ~38.6) with an increase in the laser scanning speed, suggesting an increase in the proportion of HCP α/α′-Ti attributed to the higher cooling rate. The results correlated well with the microstructural results of PBF-LB/M Ti-6Al-4V.
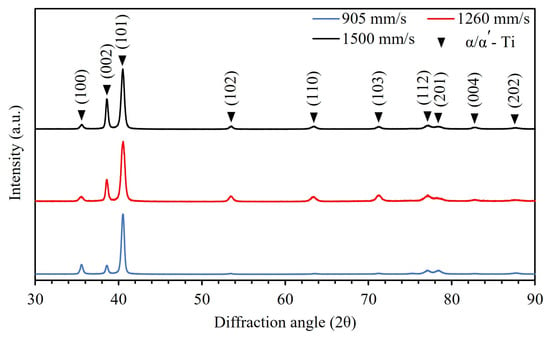
Figure 8.
XRD profiles showing phase composition on the x–z plane with different laser scanning speeds.
3.1.3. Hardness
The average Vickers hardness on the x–y and x–z planes was evaluated in Figure 9. On the x–y plane, the hardness for the laser scanning speeds of 905 mm/s (O1), 1260 mm/s (L1), and 1500 mm/s (L2) were 399 HV, 380 HV, and 368 HV, respectively. On the x–z plane, the hardness values for the laser scanning speeds of 905 mm/s (O1), 1260 mm/s (L1), and 1500 mm/s (L2) were 411 HV, 394 HV, and 387 HV, respectively. An increasing laser scanning speed resulted in a reduction in hardness. The reduction in hardness was due to the higher porosity since the difference in microstructures was small. When comparing the hardness in both planes, a slight difference was observed in the hardness of PBF-LB/M Ti-6Al-4V, which was possibly related to the dissimilar prior β grain orientation and crystallographic texture that controlled the slip system and plastic deformation ability, leading to different hardness in both planes, confirming the anisotropic behavior of PBF-LB/M Ti-6Al-4V in this study.
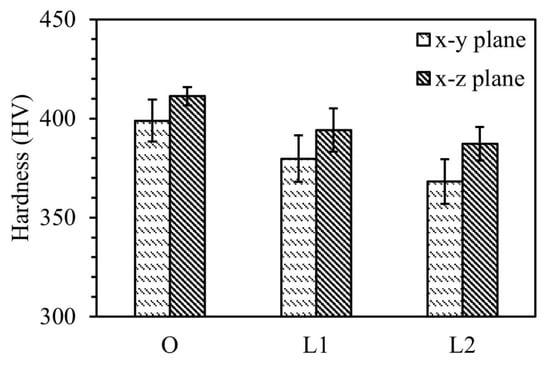
Figure 9.
Average Vickers hardness of the as–polished condition on the x–y and x–z planes.
3.2. The Enhancement via Fine Shot Peening (FSP) of the Surface Properties of PBF-LB/M Ti-6Al-4V
3.2.1. Surface Observation
First, the surface morphology of the as-polished and after-FSP conditions was examined by scanning electron microscopy (SEM) on the x–z plane. The surface morphology is depicted in Figure 10. The FSP surface treatment generated plastic deformation on the surface through compressive strain hardening [33], effectively modifying the surface. The original surface became no longer visible and displayed a homogeneous surface. However, there was the appearance of some overlaps and detached fragments on the treated surface along with some craters with an approximate diameter of 20 µm after the FSP process as indicated by the red arrows. In Figure 11, the arithmetic mean deviation of the assessed profile (Ra) shows that the after-FSP surface resulted in higher frequency and lower height, with a lower Ra value of approximately 0.2 µm compared with the as-polished surface, which was around 0.4 µm. The results show that the FSP effectively reduced the surface roughness of the as-polished surface, even though there were some craters on the FSP surface. However, the presence of craters may have the potential to be detrimental to the mechanical properties of PBF-LB/M Ti-6Al-4V in the form of stress concentration areas on the surface, which need to be further considered.
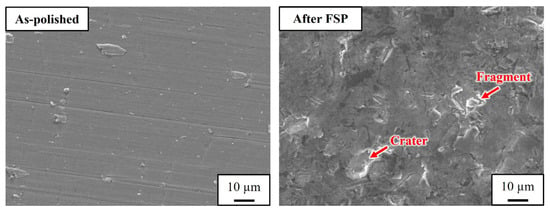
Figure 10.
Secondary electron micrographs showing surfaces of the as–polished and after–FSP conditions.
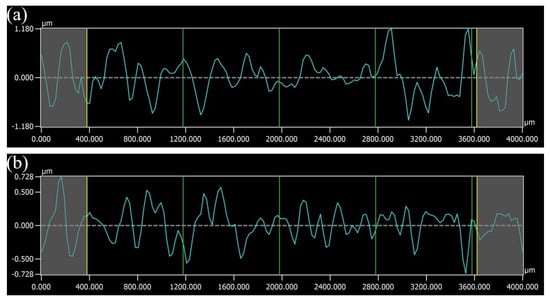
Figure 11.
Surface roughness profiles of PBF–LB/M Ti–6Al–4V: (a) as–polished condition; (b) after –FSP condition.
Elemental mapping analysis using EPMA was conducted to observe any element on the surface of the after-FSP condition as shown in Figure 12. The backscattered electron micrograph demonstrated regions with different compositions whereby the white areas corresponded to Ti-6Al-4V, while the fading black or gray areas were likely remnants of silica media by the FSP process. These silica media appeared to fracture and became embedded in the FSP surface, as observed in the mapping of the Si and O elements. The embedded silica size had a large range for which the average size was 16 µm and the largest size was up to 30 µm due to the aggregation of the silica media. Moreover, the embedded silica may be a part of the overlaps and detached fragment areas on the FSP surface, which has the potential to increase its surface hardness, as the silica media possesses a higher hardness of approximately 500–550 HV (as stated in the manufacturing specification).

Figure 12.
Elemental mapping from EPMA after the FSP with silica media (80 µm): (a) backscattered electron micrograph; (b) Si; and (c) O.
3.2.2. Surface Hardness
The average Vickers hardness of the as-polished and after-FSP conditions was evaluated on the x–z plane. In Figure 13, the average Vickers hardness of the as-built condition measured 411 HV, 394 HV, and 387 HV for the laser scanning speeds of 905 mm/s (O1), 1260 mm/s (L1), and 1500 mm/s (L2), respectively. The average Vickers hardness of the after-FSP condition improved up to 449 HV, 448 HV, and 424 HV for the laser scanning speeds of 905 mm/s (O1), 1260 mm/s (L1), and 1500 mm/s (L2), respectively. The results had no significant variation in hardness between the outer, inner, and center areas of the specimen at the same height. Additionally, there was no obvious height effect on hardness observed around these regions. The increase in hardness was due to the induced plastic deformation and the compressive residual stress by the FSP as well as the embedded silica on the surface. The improvement in hardness varied among the different scanning speeds, with L2 showing the highest increase in hardness. Interestingly, the surface hardness after the FSP in each scanning speed achieved almost the same hardness values. This was possibly due to similar surface properties of the FSP surface in all scanning speeds since the difference in microstructures and pore characteristics was small in the as-polished condition. The surface hardness in the after-FSP condition exhibited a relatively large range of values. This was related to the presence of the embedded silica on the FSP surface. In the L2 condition, a slightly lower hardness compared with the other scanning speeds having even the smallest microstructure may be related to several factors, including the porosity, the craters on the indentation areas, and even residual stress.
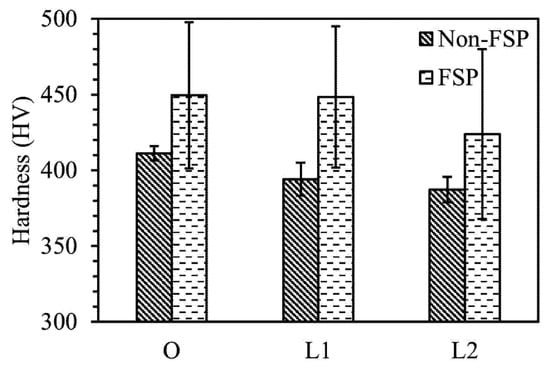
Figure 13.
Average Vickers hardness of the as–polished and after–FSP conditions on the x–z plane.
3.2.3. Residual Stress in Depths
Further examination through the residual stress measurement by X-ray diffraction (XRD) was conducted on the lateral surface (the x–z plane). First, the as-polished and after-FSP conditions using the optimized speed (905 mm/s, O) were examined as shown in Figure 14. In the as-polished condition, PBF-LB/M Ti-6Al-4V possessed tensile residual stress within the material with large variations in depth. The tensile residual stress was attributed to the temperature gradient between the subsequent layers (unmelted and melted layers) and scan tracks (hatch distance), which was high around the edge due to being near the area of loose powder during the laser melting of the PBF-LB/M [34]. In the after-FSP condition, the compressive residual stress was generated up to a depth of approximately 80 µm from the FSP surface. Then, the compressive residual stress was converted into the tensile residual stress, which was due to the inner materials not being influenced by the FSP process. In Figure 15, the residual stress of the after-FSP condition was measured. The maximum compressive residual stress was found at the FSP surface (0 µm), which was −925 MPa, −971 MPa, and −818 MPa for the different scanning speeds of the after-FSP O, L1, and L2, respectively. This was because of the plastic deformation on the surface due to the FSP process. The result showed a large variation but the same range of the residual stress for the scanning speeds of the after-FSP O and L1. The lower induced compressive residual stress of the after-FSP L2 was probably related to the higher initial tensile residual stress compared with other scanning speeds. After approximately 80 µm in depth from the FSP surface, the magnitude of the tensile residual stress increased with the laser scanning speed due to the higher cooling rate. As a result, in the after-FSP condition, the after-FSP O had the lowest tensile residual stress, but the after-FSP L2 had the highest tensile residual stress. However, the after-FSP L1 was close to the after-FSP L2 as shown in Figure 15. This was probably due to the stress relief from the higher porosity of the after-FSP L2 [35,36]. Moreover, the rate of conversion into the tensile residual stress was not equal for each scanning speed since the initial tensile residual stress was different. The depths at which the compressive residual stress reduced to around 0 MPa were approximately 40 µm, 30 µm, and 25 µm for the scanning speeds of the after-FSP O, L1, and L2, respectively. The results indicated that the tensile residual stress corresponding to the increase in the laser scanning speed may lower the enhancement via the FSP of the surface properties of PBF-LB/M Ti-6Al-4V in this study.
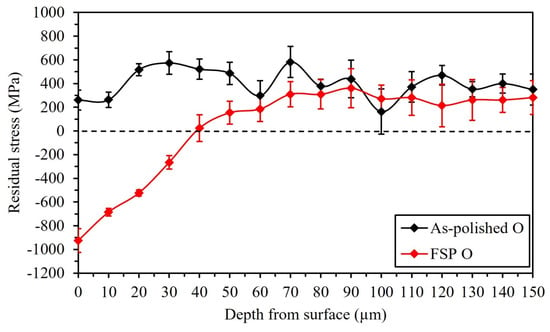
Figure 14.
Comparison of the residual stress at different depths from the surface between the as–polished O and after–FSP O conditions on the x–z plane.
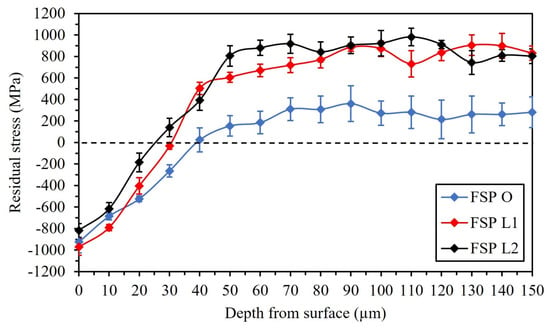
Figure 15.
Comparison of the residual stress of the after–FSP condition at different depths from the surface on the x–z plane.
3.2.4. Full Width at Half Maximum in Depths
The full width at half maximum (FWHM) of the after-FSP condition was examined on the x–z plane using X-ray diffraction (XRD) in Figure 16. The FWHM is a value used for a measurement of the broadening of the peak intensity, which is inversely proportional to crystallite size and related to the grain size of the material following Scherrer’s equation [37]. The results indicate that the FWHM showed large variation at all scanning speeds due to the large micro-strain by the presence of the residual stress and the small grain size of PBF-LB/M Ti-6Al-4V. At approximately 80 µm depth from the FSP surface, the FWHM showed almost the same values. The FWHM confirmed the small difference in microstructures at each scanning speed in the as-polished condition and confirmed the scanning speed of the as-polished L2 to possess the smallest grain at the highest scanning speed. The maximum FWHM was at the FSP surface (0 µm), possibly due to the compressive residual stress and the grain refinement by the FSP process, and then gradually decreased toward the inner region of the material. At the FSP surface (0 µm), the FWHM degree was different, indicating that the level of peak broadening was not the same, which may be related to the initial difference of the tensile residual stress as well as the grain size in the as-polished condition; thus, the after-FSP L1 was similar to L2 and the after-FSP O degree was the lowest.
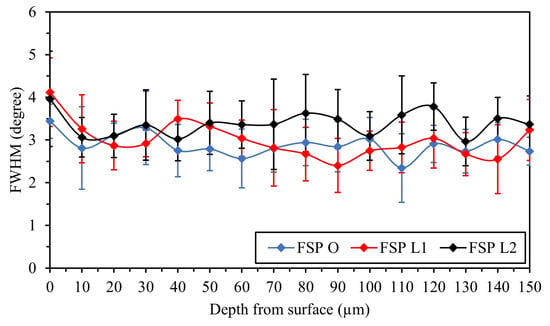
Figure 16.
Full width at half maximum (FWHM) degree of PBF–LB/M Ti–6Al–4V after the FSP process at different depths from the surface on the x–z plane at each scanning speed.
3.2.5. Hardness in Depths
To investigate the enhancement via fine shot peening on PBF-LB/M Ti-6Al-4V, the cross-section hardness in depths of the as-polished O and the after-FSP O condition was firstly evaluated on the x–y plane in Figure 17. The results show that the hardness improved up to the depth of the induced compressive residual stress by the FSP at approximately 80 µm from the FSP surface. The maximum Vickers hardness was 419 HV, observed at a depth of about 50 µm from the FSP surface, which then gradually decreased toward the inner region of the materials. The enhancement in hardness was attributed to the induced compressive residual stress by the FSP. Then, the cross-section hardness in depths of the after-FSP condition was investigated in Figure 18. At approximately 80 µm in depth from the FSP surface, the different hardness values at each scanning speed can be mainly attributed to the porosity and the tensile residual stress due to the small difference in microstructures whereby the O had the highest hardness because of the lowest porosity and tensile residual stress in contrast to the L2. The highest average Vickers hardness values were found to be 419 HV, 403 HV, and 412 HV for the scanning speeds of the after-FSP O, L1, and L2, respectively. The depths of maximum hardness were approximately 50 µm for the after-FSP O condition and approximately 30 µm for the after-FSP L1 and L2 conditions. The relatively low hardness before reaching the maximum may be from the presence of overlaps, detached fragments, and craters on the FSP surface. However, the after-FSP L2 exhibited higher maximum hardness compared with the after-FSP L1, which may possibly be related to the additional effect of grain size. The results confirmed the effect of the tensile residual stress on the FSP, which can lower the enhancement of the FSP on the surface properties since the FSP can generate compressive residual stress and maximum hardness with less depth on PBF-LB/M Ti-6Al-4V.
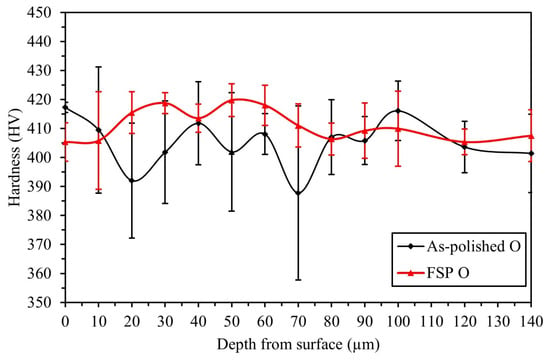
Figure 17.
Cross–section Vickers hardness results of the as–polished O and after–FSP O conditions on the x–y plane.
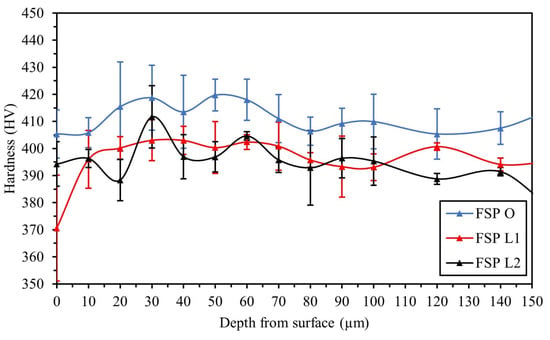
Figure 18.
Cross–section Vickers hardness results of the after–FSP condition on the x–y plane.
4. Conclusions
In this study, PBF-LB/M Ti-6Al-4V was investigated for the effect of laser scanning speed on pore characteristics (i.e., pore size, shape, and distribution pattern), microstructure, and hardness as well as the enhancement of the surface properties via the fine shot peening (FSP) process. The results are summarized as follows:
- An increase in the laser scanning speed can lead to an increase in the number of pores and pore size within the PBF-LB/M Ti-6Al-4V. The higher pore fraction consisting of both gas pores and lack of fusion (LOF) pores corresponds to lower laser energy input as well as a higher cooling rate. Furthermore, most of the pores were relatively small, approximately less than 20 µm in size, and exhibited a random distribution throughout the PBF-LB/M Ti-6Al-4V.
- The microstructures of all scanning speeds consisted of prior β grains filled with α′ martensite, exhibiting anisotropic behavior possibly related to the dissimilar prior β grain orientation and crystallographic texture on both planes. As the laser scanning speed increased, there was a slight increase in the proportion of α′ martensite, accompanied by grain refinement, which was attributed to the higher cooling rate. However, it was worth noting that the difference in microstructures among all scanning speeds was small.
- After the fine shot peening (FSP) process, the plastic deformation and compressive residual stress were induced on the FSP surface resulting in similar surface properties across different scanning speeds. However, the presence of overlaps, detached fragments, embedded silica remnants, and some craters contributed to a wide range of hardness.
- After the fine shot peening (FSP), the maximum compressive residual stress was observed at the FSP surface, after which it converted into tensile residual stress with varying magnitude depending on the laser scanning speeds. The initial tensile residual stress within the PBF-LB/M Ti-6Al-4V played a role in accelerating the rate of conversion between compressive and tensile residual stresses, as well as reducing the depth at which maximum hardness was achieved through the FSP process. Therefore, the initial tensile residual stress had the effect of lowering the overall enhancement achieved by the FSP process.
Based on the results of our investigation, this study emphasized the crucial roles of porosity and initial residual tensile stress within the PBF-LB/M Ti-6Al-4V with an increase in laser scanning speed during the PBF-LB/M process. A further systematic study related to residual stress is necessary to eliminate or minimize the initial residual tensile stress before any additional surface treatments, such as fine shot peening and laser shock peening, aimed at enhancing surface properties. This holds true for addressing porosity as well. The optimization of processing parameters in the PBF-LB/M is important. With all of these considerations, the PBF-LB/M Ti-6Al-4V can be advanced for further development in medical applications.
Author Contributions
Conceptualization, K.R. and A.K.; methodology, K.R. and A.K.; software, K.R.; validation, A.K.; formal analysis, K.R. and A.K.; investigation, K.R.; resources, A.K.; data curation, K.R. and A.K.; writing—original draft preparation, K.R.; writing—review and editing, A.K. and K.K.; visualization, K.R.; supervision, A.K. and K.K.; project administration, K.R.; funding acquisition, A.K. All authors have read and agreed to the published version of the manuscript.
Funding
This work was supported by the NSRF via the Program Management Unit for Human Resources & Institutional Development, Research and Innovation (grant number B05F640134); King Mongkut’s University of Technology Thonburi (KMUTT); Thailand Science Research and Innovation (TSRI); the National Science, Research and Innovation Fund (NSRF) Fiscal year 2023; and the Thailand Graduate Institute of Science and Technology (TGIST), grant number SCA-CO-2564-14423-TH. This research was financially supported by the OU Master Plan Implementation Project promoted under Osaka University.
Data Availability Statement
The original contributions presented in the study are included in the article, further inquiries can be directed to the corresponding author.
Conflicts of Interest
The authors declare no conflicts of interest.
References
- Festas, A.; Ramos, A.; Davim, J.P. Machining of titanium alloys for medical application-a review. Proc. Inst. Mech. Eng. Part B 2022, 236, 309–318. [Google Scholar] [CrossRef]
- Liu, Z.; He, B.; Lyu, T.; Zou, Y. A review on additive manufacturing of titanium alloys for aerospace applications: Directed energy deposition and beyond Ti-6Al-4V. JOM 2021, 73, 1804–1818. [Google Scholar] [CrossRef]
- Niinomi, M.; Nakai, M. Titanium-Based Biomaterials for Preventing Stress Shielding between Implant Devices and Bone. Int. J. Biomater. 2011, 2011, 836587. [Google Scholar] [CrossRef] [PubMed]
- Tamayo, J.A.; Riascos, M.; Vargas, C.A.; Baena, L.M. Additive manufacturing of Ti6Al4V alloy via electron beam melting for the development of implants for the biomedical industry. Heliyon 2021, 7, e06892. [Google Scholar] [CrossRef]
- Aufa, A.N.; Hassan, M.Z.; Ismail, Z. Recent advances in Ti-6Al-4V additively manufactured by selective laser melting for biomedical implants: Prospect development. J. Alloys Compd. 2022, 896, 163072. [Google Scholar] [CrossRef]
- Guo, A.X.; Cheng, L.; Zhan, S.; Zhang, S.; Xiong, W.; Wang, Z.; Wang, G.; Cao, S.C. Biomedical applications of the powder-based 3D printed titanium alloys: A review. J. Mater. Sci. Technol. 2022, 125, 252–264. [Google Scholar] [CrossRef]
- Meng, M.; Wang, J.; Huang, H.; Liu, X.; Zhang, J.; Li, Z. 3D printing metal implants in orthopedic surgery: Methods, applications and future prospects. J. Orthop. Translat. 2023, 42, 94–112. [Google Scholar] [CrossRef]
- Singla, A.K.; Banerjee, M.; Sharma, A.; Singh, J.; Bansal, A.; Gupta, M.K.; Khanna, N.; Shahi, A.S.; Goyal, D.K. Selective laser melting of Ti6Al4V alloy: Process parameters, defects and post-treatments. J. Manuf. Process. 2021, 64, 161–187. [Google Scholar] [CrossRef]
- Kumawat, S.; Deshmukh, S.R.; Ghorpade, R.R. Fabrication of Ti-6Al-4v cellular lattice structure using selective laser melting for orthopedic use: A review. Mater Today Proc. 2023. [Google Scholar] [CrossRef]
- Gorsse, S.; Hutchinson, C.; Gouné, M.; Banerjee, R. Additive manufacturing of metals: A brief review of the characteristic microstructures and properties of steels, Ti-6Al-4V, and high-entropy alloys. Sci. Technol. Adv. Mater. 2017, 18, 584–610. [Google Scholar] [CrossRef] [PubMed]
- Herzog, D.; Seyda, V.; Wycisk, E.; Emmelmann, C. Additive manufacturing of metals. Acta Mater. 2016, 117, 371–392. [Google Scholar] [CrossRef]
- Koju, N.; Niraula, S.; Fotovvati, B. Additively Manufactured Porous Ti6Al4V for Bone Implants: A Review. Metals 2022, 12, 687. [Google Scholar] [CrossRef]
- Nagarajan, B.; Hu, Z.; Song, X.; Zhai, W.; Wei, J. Development of micro selective laser melting: The state of the art and future perspectives. Engineering 2019, 5, 702–720. [Google Scholar] [CrossRef]
- Yap, C.Y.; Chua, C.K.; Dong, Z.L.; Liu, Z.H.; Zhang, D.Q.; Loh, L.E.; Sing, S.L. Review of selective laser melting: Materials and applications. Appl. Phys. Rev. 2015, 2, 041101. [Google Scholar] [CrossRef]
- Hashmi, A.W.; Mali, H.S.; Meena, A. Improving the surface characteristics of additively manufactured parts: A review. Mater. Today. Proc. 2021, 81, 723–738. [Google Scholar] [CrossRef]
- Gong, H.; Rafi, K.; Gu, H.; Ram, G.J.; Starr, T.; Stucker, B. Influence of defects on mechanical properties of Ti–6Al–4 V components produced by selective laser melting and electron beam melting. Mater. Des. 2015, 86, 545–554. [Google Scholar] [CrossRef]
- Edwards, P.; Ramulu, M. Fatigue performance evaluation of selective laser melted Ti–6Al–4V. Mater. Sci. Eng. A 2014, 598, 327–337. [Google Scholar] [CrossRef]
- Morita, T.; Tsuda, C.; Sakai, H.; Higuchi, N. Fundamental properties of Ti-6Al-4V alloy produced by selective laser melting method. Mater. Trans. 2017, 58, 1397–1403. [Google Scholar] [CrossRef]
- Kumar, P.; Ramamurty, U. High cycle fatigue in selective laser melted Ti-6Al-4V. Acta Mater. 2020, 194, 305–320. [Google Scholar] [CrossRef]
- Benedetti, M.; Torresani, E.; Leoni, M.; Fontanari, V.; Bandini, M.; Pederzolli, C.; Potrich, C. The effect of post-sintering treatments on the fatigue and biological behavior of Ti-6Al-4V ELI parts made by selective laser melting. J. Mech. Behav. Biomed. Mater. 2017, 71, 295–306. [Google Scholar] [CrossRef]
- Mahagaonkar, S.B.; Brahmankar, P.K.; Seemikeri, C.Y. Effect on fatigue performance of shot peened components: An analysis using DOE technique. Int. J. Fatigue 2009, 31, 693–702. [Google Scholar] [CrossRef]
- Morita, T.; Miyatani, A.; Kariya, S.; Kumagai, M.; Takesue, S.; Komotori, J. Influences of particle collision treatments on surface characteristics and fatigue strength of Ti-6Al-4V alloy. Results Mater. 2020, 7, 100128. [Google Scholar] [CrossRef]
- Morita, T.; Nakaguchi, H.; Noda, S.; Kagaya, C. Effects of fine particle bombarding on surface characteristics and fatigue strength of commercial pure titanium. Mater. Trans. 2012, 53, 1938–1945. [Google Scholar] [CrossRef]
- Kasperovich, G.; Haubrich, J.; Gussone, J.; Requena, G. Correlation between porosity and processing parameters in TiAl6V4 produced by selective laser melting. Mater. Des. 2016, 105, 160–170. [Google Scholar] [CrossRef]
- Sefene, E.M. State-of-the-art of selective laser melting process: A comprehensive review. J. Manuf. Syst. 2022, 63, 250–274. [Google Scholar] [CrossRef]
- Ongtrakulkij, G.; Khantachawana, A.; Kondoh, K. Effects of media parameters on the enhancement of hardness and residual stress of Ti6Al4V by fine shot peening. Surf. Interfaces 2020, 18, 100424. [Google Scholar] [CrossRef]
- Ongtrakulkij, G.; Kajornchaiyakul, J.; Kondoh, K.; Khantachawana, A. Investigation of Microstructure, Residual Stress, and Hardness of Ti-6Al-4V after Plasma Nitriding Process with Different Times and Temperatures. Coatings 2022, 12, 1932. [Google Scholar] [CrossRef]
- Promoppatum, P.; Srinivasan, R.; Quek, S.S.; Msolli, S.; Shukla, S.; Johan, N.S.; Jhon, M.H. Quantification and prediction of lack-of-fusion porosity in the high porosity regime during laser powder bed fusion of Ti-6Al-4V. J. Mater. Process. Technol. 2022, 300, 117426. [Google Scholar] [CrossRef]
- Zhang, B.; Li, Y.; Bai, Q. Defect formation mechanisms in selective laser melting: A review. Chin. J. Mech. Eng. 2017, 30, 515–527. [Google Scholar] [CrossRef]
- Yang, J.; Yu, H.; Yin, J.; Gao, M.; Wang, Z.; Zeng, X. Formation and control of martensite in Ti-6Al-4V alloy produced by selective laser melting. Mater. Des. 2016, 108, 308–318. [Google Scholar] [CrossRef]
- Liu, S.; Shin, Y.C. Additive manufacturing of Ti6Al4V alloy: A review. Mater. Des. 2019, 164, 107552. [Google Scholar] [CrossRef]
- Yang, J.; Yu, H.; Wang, Z.; Zeng, X. Effect of crystallographic orientation on mechanical anisotropy of selective laser melted Ti-6Al-4V alloy. Mater. Charact. 2017, 127, 137–145. [Google Scholar] [CrossRef]
- Kovacı, H.; Bozkurt, Y.B.; Yetim, A.F.; Aslan, M.; Çelik, A. The effect of surface plastic deformation produced by shot peening on corrosion behavior of a low-alloy steel. Surf. Coat. Technol. 2019, 360, 78–86. [Google Scholar] [CrossRef]
- Yakout, M.; Elbestawi, M.A.; Veldhuis, S.C. A study of the relationship between thermal expansion and residual stresses in selective laser melting of Ti-6Al-4V. J. Manuf. Processes 2020, 52, 181–192. [Google Scholar] [CrossRef]
- Ren, S.; Chen, Y.; Liu, T.; Qu, X. Effect of build orientation on mechanical properties and microstructure of Ti-6Al-4V manufactured by selective laser melting. Metall. Mater. Trans. A 2019, 50, 4388–4409. [Google Scholar] [CrossRef]
- Lan, L.; Xin, R.; Jin, X.; Gao, S.; He, B.; Rong, Y.; Min, N. Effects of laser shock peening on microstructure and properties of Ti–6Al–4V titanium alloy fabricated via selective laser melting. Materials 2020, 13, 3261. [Google Scholar] [CrossRef] [PubMed]
- Fu, P.; Chu, R.; Xu, Z.; Ding, G.; Jiang, C. Relation of hardness with FWHM and residual stress of GCr15 steel after shot peening. Appl. Surf. Sci. 2018, 431, 165–169. [Google Scholar] [CrossRef]
Disclaimer/Publisher’s Note: The statements, opinions and data contained in all publications are solely those of the individual author(s) and contributor(s) and not of MDPI and/or the editor(s). MDPI and/or the editor(s) disclaim responsibility for any injury to people or property resulting from any ideas, methods, instructions or products referred to in the content. |
© 2024 by the authors. Licensee MDPI, Basel, Switzerland. This article is an open access article distributed under the terms and conditions of the Creative Commons Attribution (CC BY) license (https://creativecommons.org/licenses/by/4.0/).