Article

Leaching Kinetics of Iron Collector Containing PGMs

1
Department of Non-Ferrous Metals Metallurgy, Ural Federal University, 620002 Yekaterinburg, Russia
2
Department of Rare Metals and Nanomaterials, Ural Federal University, 620002 Yekaterinburg, Russia
3
Laboratory of Advanced Technologies in Non-Ferrous and Ferrous Metals Raw Materials Processing, Ural Federal University, 620002 Yekaterinburg, Russia
*
Author to whom correspondence should be addressed.
Metals 2024, 14(12), 1416; https://doi.org/10.3390/met14121416
Submission received: 7 November 2024 / Revised: 6 December 2024 / Accepted: 9 December 2024 / Published: 11 December 2024
(This article belongs to the Section Extractive Metallurgy)

Abstract

:
The leaching kinetics of an industrial iron collector containing PGMs (Pd, Pt, Rh) in HCl and HF solutions were investigated. The effects of the HCl concentration (2.74–6.86 mol/L), the HF concentration (1.46–7.50 mol/L), temperature (323–363 K), and leaching time (0–210 min) on the extraction of Fe into the solution and Si into the gas phase from the iron collector were studied. The HCl concentration had a negative effect on the extraction of Si, which decreased from 78.2% to 58.1% and from 97.4% to 87.2% in the time ranges of 0–30 min and 30–120 min, respectively. This occurred due to the accumulation of Fe2+ in the solution and its interaction with HF, which led to a reduction in both the HF concentration and the extraction of Si. In addition, there were diffusion difficulties of the Fe and Si extraction because Fe precipitated on the surface of the cakes in the form of thin-film conglomerates of FeF2. This was confirmed by the XRF and EDS results, indicating that F was present on the surface of the cakes. The processes of the Fe and Si extraction were diffusion-chemically controlled and diffusion controlled—the apparent activation energies decreased from 26.9 kJ/mol to 7.8 kJ/mol and from 2.2 kJ/mol to 2.0 kJ/mol in the time range of 0–120 min, respectively. Using the shrinking core model and the full factorial experiment model, the kinetic equations, the optimal parameters of iron collector leaching, and the extraction rates of Fe and Si were determined. These optimal parameters ensure the extraction of Fe and Si at the level of 95% with high leaching rates: the HCl concentration of 4.36 mol/L, the HF concentration of 6.93 mol/L, temperature of 363 K, and leaching time of 80 min.

1. Introduction

Spent catalysts, or catalyst waste including automotive catalytic converters and industrial catalysts (e.g., from the chemical and petrochemical industries), contain precious metals (PMs), specifically the platinum group metals (PGMs), which are valuable due to their low natural abundance, unique properties, and the complex processes that are required for their extraction and refining from primary sources.
Whilst PGMs are found as naturally occurring ores, these metals may also be obtained by recycling PGM-bearing waste. These waste streams are typically orders of magnitude richer in PGMs than their naturally occurring ore equivalents, therefore recycling this waste helps to conserve natural resources. PGMs have outstanding catalytic properties, and waste suitable for recovery include crushed autocatalyst ceramic monoliths, catalytic soot filters, or heterogeneous process catalysts on a variety of different substrates.
In recent years, there has been a steady increase in the amounts of PMs and PGMs being recovered from secondary sources, driven in large part by high commodity prices and a rapid growth in autocatalyst recycling. The scarcity of these PMs, alongside the increasing costs and complexities involved in their extraction from primary sources, compared to the lower costs and environmental impacts of recycling-based extraction, has provided added incentives for this growing trend [1,2,3,4,5,6,7,8].
One of the effective ways of recycling spent automotive catalysts is melting them in a plasma furnace. This technology offers considerable competitive advantage over alternative methods of obtaining precious metals including cupellation, direct leaching and thermal decomposition, and/or recovery processes. Key advantages of plasma furnace melting technology include high PGM recovery rate (>98.5%), a continuous process, the by-product is inert and can be used as aggregate, rapid processing time, and versatility. High-temperature plasma smelting technology is used to recover the PGMs contained within the catalyst waste as a metallic collector. This collector is subjected to further chemical refining before the metals re-enter the product supply chain, hence, closing the recycling loop [9,10,11,12,13,14].
In our previous work [15], it was demonstrated that if the melting of automotive catalysts is carried out to obtain an iron-based collector, then it can be effectively dissolved using HCl or H2SO4 solutions. PGMs can be completely extracted from the resulting cakes during subsequent aqua regia leaching. In this case, the Si content in the iron collector should not exceed 10%. When the Si content in the collector is over 10%, the extraction of PGMs from the cakes does not exceed 40%. This is due to the incomplete destruction of the PGM-encapsulating ferrosilicon matrix formed during the smelting process. The use of HCl and HF as solvents contributes to the destruction of both Fe and Si components of the ferrosilicon matrix. Therefore, the leaching kinetics of a model sample of the collector containing 20% of Si and no PGMs in HCl and HF media were studied.
This work focused on an industrial iron collector containing more than 11% of Si and PGMs (Pd, Pt, Rh). Aside from the shrinking core model (SCM) [16], the full factorial experiment model (FFEM) [17,18] was used to study the leaching kinetics of the collector in HCl and HF solutions. The obtained kinetic equations made it possible to determine the optimal parameters of the collector leaching and the extraction rates of Fe into the solution and Si into the gas phase.

2. Materials and Methods

2.1. Materials

A sample of an iron collector, obtained in an industrial plasma furnace (Tetronics, Swindon, UK), was used. The collector was pre-ground in a planetary mill and sifted through a set of sieves. The granulometric characteristics of the collector were 100% fraction −0.5 mm.
A scanning electron microscopy (SEM) image with energy-dispersive X-ray spectroscopy (EDS) spectrum areas and the X-ray diffraction (XRD) pattern of the iron collector are shown in Figure 1. The results of the X-ray fluorescence (XRF), EDS, and XRD of the collector are given in Table 1 and Table 2. The chemical and phase composition of the collector are typical for smelting products of automotive catalysts.

2.2. Experimental Technique

In the experiments, the HCl concentration (CHCl) of 2.74–6.86 mol/L, the HF concentration (CHF) of 1.46–7.50 mol/L, temperature (T) of 323–363 K, and leaching time (τ) of 0–210 min were varied. A 10 g sample of the iron collector was loaded into a polytetrafluoroethylene (PTFE) beaker filled with an HCl and HF solution (liquid-to-solid ratio (L/S) of 10 mL/g) and placed into a preheated water bath. Stirring was carried out using a PTFE-coated straight stirrer (stirring speed of 200 rpm). After the end of the experiment, the slurry was filtered. The cake was washed with distilled water (L/S of 3 mL/g), dried in an oven at a temperature of 353 K, weighed, and analyzed.
The chemical reagents used in this work were of analytical grade. Distilled water complied with ISO 3696:1987. In order to improve the reliability of the results obtained, each experiment was carried out twice. The maximum error, as determined in replicate experiments, was 2.9%.

2.3. Analysis Methods

SEM was carried out using a JSM-6490LV microscope (Jeol, Tokyo, Japan) equipped with an INCA Energy 350 spectrometer (Oxford Instruments, Abingdon, UK) for EDS with mapping capability. XRD was carried out using a MAXima_X XRD-7000 diffractometer (Shimadzu, Kyoto, Japan). XRF was performed using an Axios-mAX spectrometer (Malvern Panalytical, Almelo, The Netherlands).

2.4. Calculation Method

The extraction of Fe into the solution and Si into the gas phase from the iron collector ( E E l , %) was calculated using Equation (1):
E E l = 100 m c a k e C E l c a k e m I C C E l I C 100
where m c a k e is the cake mass (g); C E l c a k e is the concentration of the element in the cake (%); m I C is the mass of the collector (g); C E l I C is the concentration of the element in the collector (%).
The cake yield ( η , %) was calculated using Equation (2):
η = m c a k e m I C 100
In the SCM, the extraction of Fe and Si ( X , fractions) was determined using Equations (3)–(9):
1 3 1 X 2 3 + 2 1 X = k C H C l m C H F n e E a R T τ
X = E E l 100
k = d 1 3   1 X 2 3 + 2 1 X d C H C l m C H F n e E a R T τ
m = d l n k H C l d l n C H C l
n = d l n k H F d l n C H F
E a = d l n k T d 1000 T R   10 3
k H C l , k H F , k T = d 1 3 1 X 2 3 + 2 1 X d τ
where k is the chemical reaction rate constant; m is the reaction order with respect to HCl concentration; n is the reaction order with respect to HF concentration; E a is the apparent activation energy (kJ/mol); R is the universal gas constant (J/(mol K)); k H C l is the subfactor of reaction order with respect to HCl concentration; k H F is the subfactor of reaction order with respect to HF concentration; k T is the subfactor of apparent activation energy with respect to temperature.
In the FFEM, the extraction rate of Fe and Si ( W E l , mol/min) was determined using Equations (10)–(20):
W E l = k C H C l m C H F n e E a R T
k = e k 0 k 1 k 2 k 3
m = 1 8 x 1 l n W E l g 1 8 x 1 2 l n C H C l m a x l n C H C l a v g
n = 1 8 x 2 l n W E l g 1 8 x 2 2 l n C H F m a x l n C H F a v g
E a = 1 8 x 3 l n W E l g R 1 8 x 3 2 T m a x 1 T a v g 1
k 0 = 1 8 x 0 l n W E l g 1 8 x 0 2
k 1 = 1 8 x 1 l n W E l g l n C H C l a v g 1 8 x 1 2 l n C H C l m a x l n C H C l a v g
k 2 = 1 8 x 2 l n W E l g l n C H F a v g 1 8 x 2 2 l n C H F m a x l n C H F a v g
k 3 = 1 8 x 3 l n W E l g T a v g 1 1 8 x 3 2 T m a x 1 T a v g 1
W E l g = d Q E l d τ
Q E l = m I C C E l I C E E l M E l
where k 0 k 3 are subfactors of the chemical reaction rate constant; x 1 is the response value of HCl concentration ( x 1 = 1 or 1); W E l g is the extraction rate of Fe and Si determined graphically (mol/min); C H C l m a x is the maximum HCl concentration (mol/L) ( C H C l m a x = 6.86 mol/L); C H C l a v g is the average HCl concentration (mol/L) ( C H C l a v g = 4.80 mol/L); x 2 is the response value of HF concentration ( x 2 = 1 or 1); C H F m a x is the maximum HF concentration (mol/L) ( C H F m a x = 7.50 mol/L); C H F a v g is the average HF concentration (mol/L) ( C H F a v g = 4.50 mol/L); x 3 is the response value of temperature ( x 3 = 1 or 1); T m a x is the maximum temperature (K) ( T m a x = 363 K); T a v g is the average temperature (K) ( T a v g = 343 K); x 0 is the response value of chemical reaction rate constant ( x 0 = 1); Q E l is the quantity of Fe and Si extracted from the collector (mol); M E l is the molar mass of Fe and Si (g/mol).

3. Results and Discussion

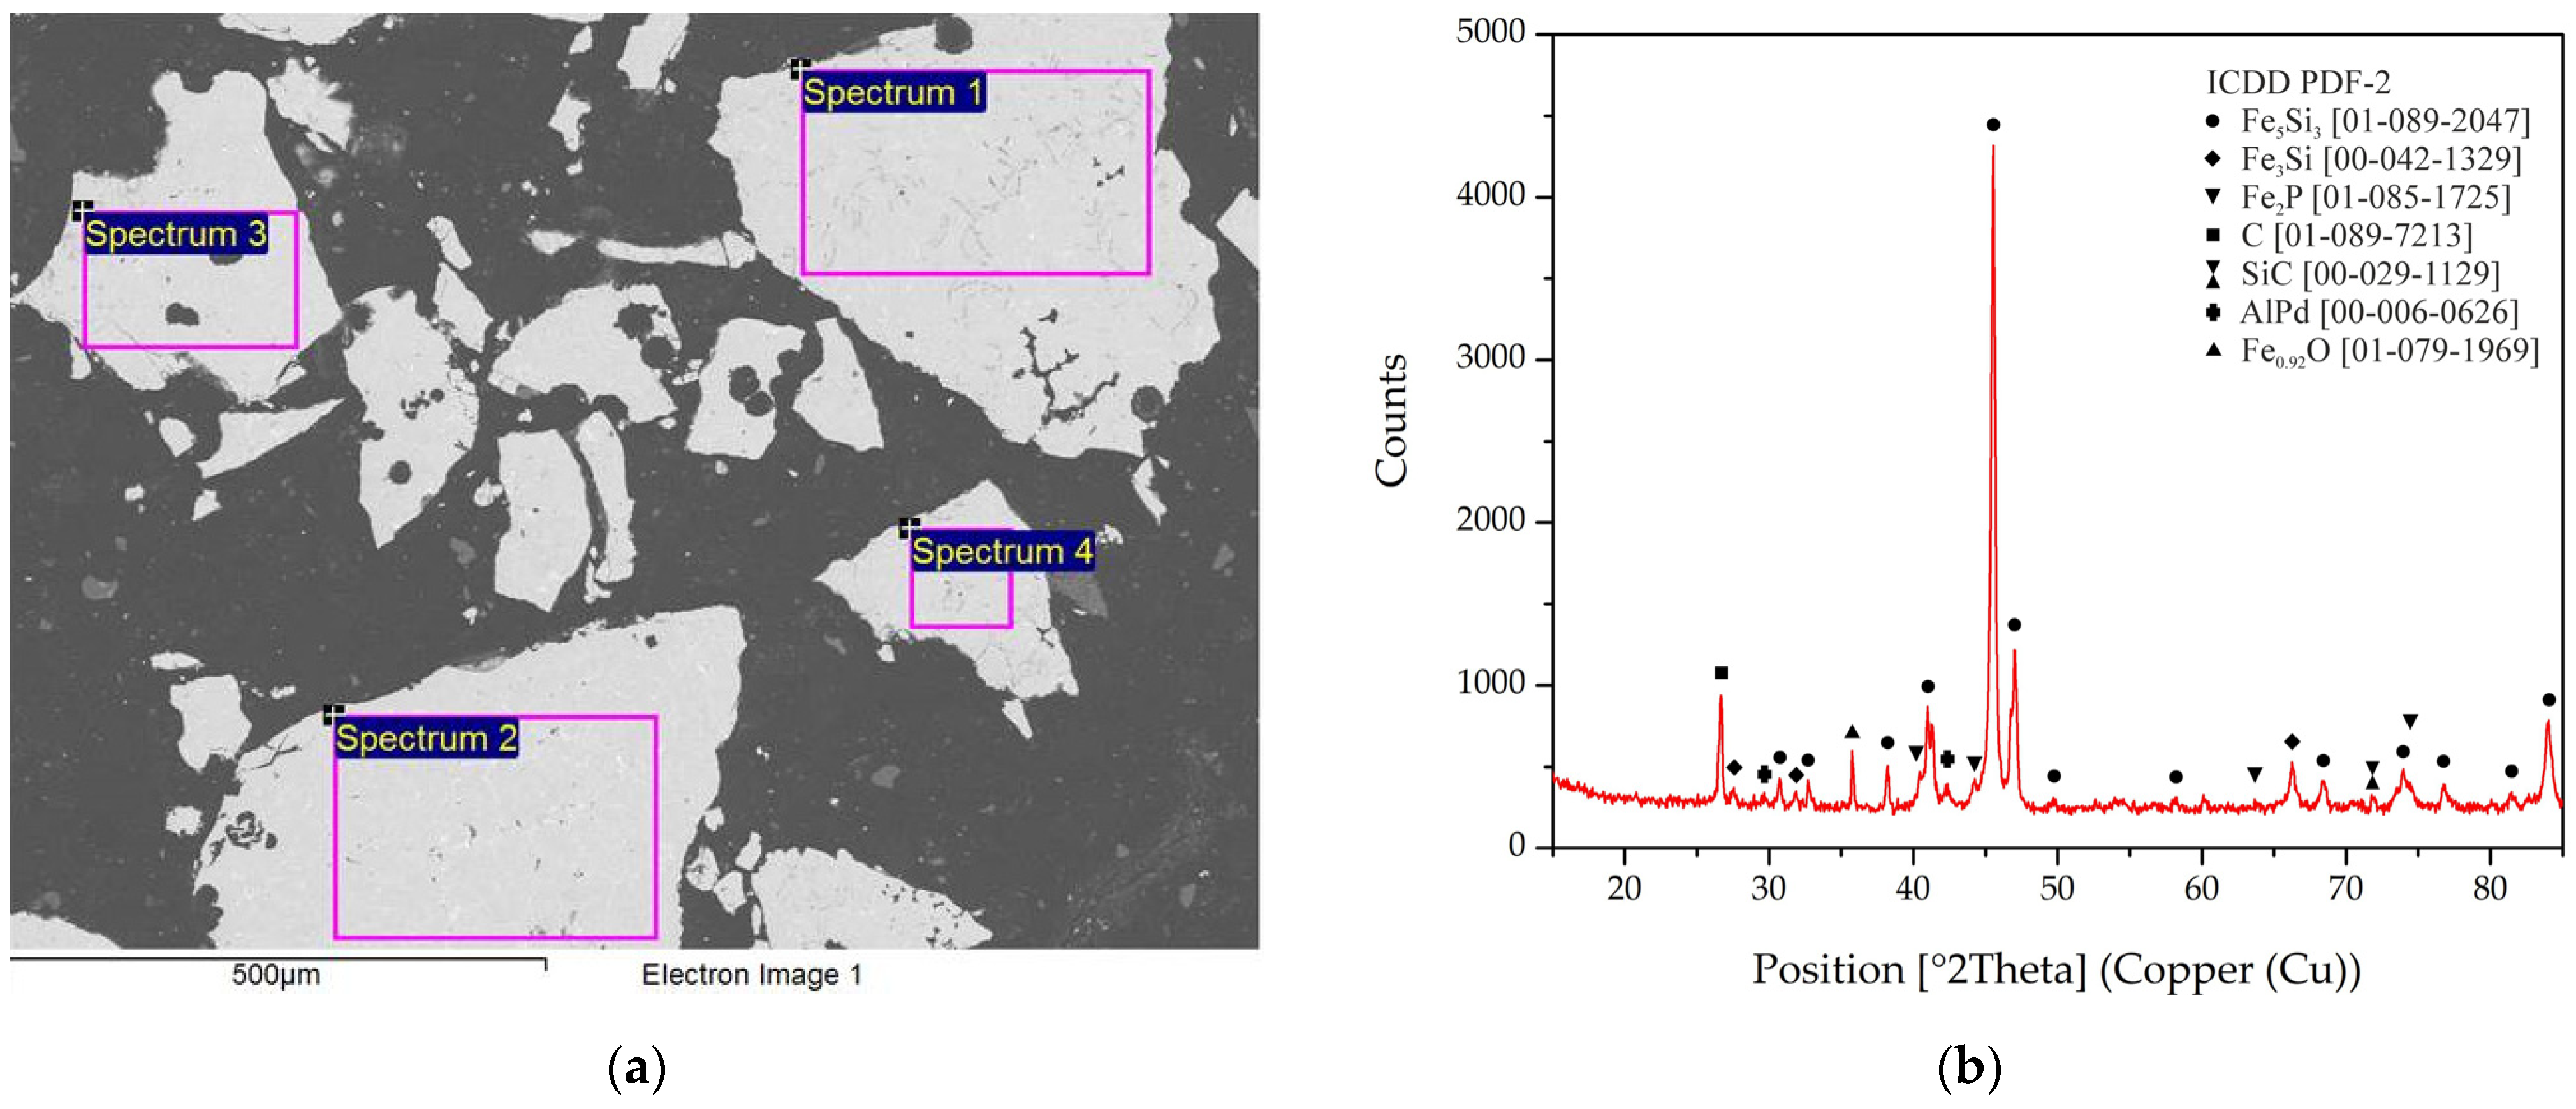
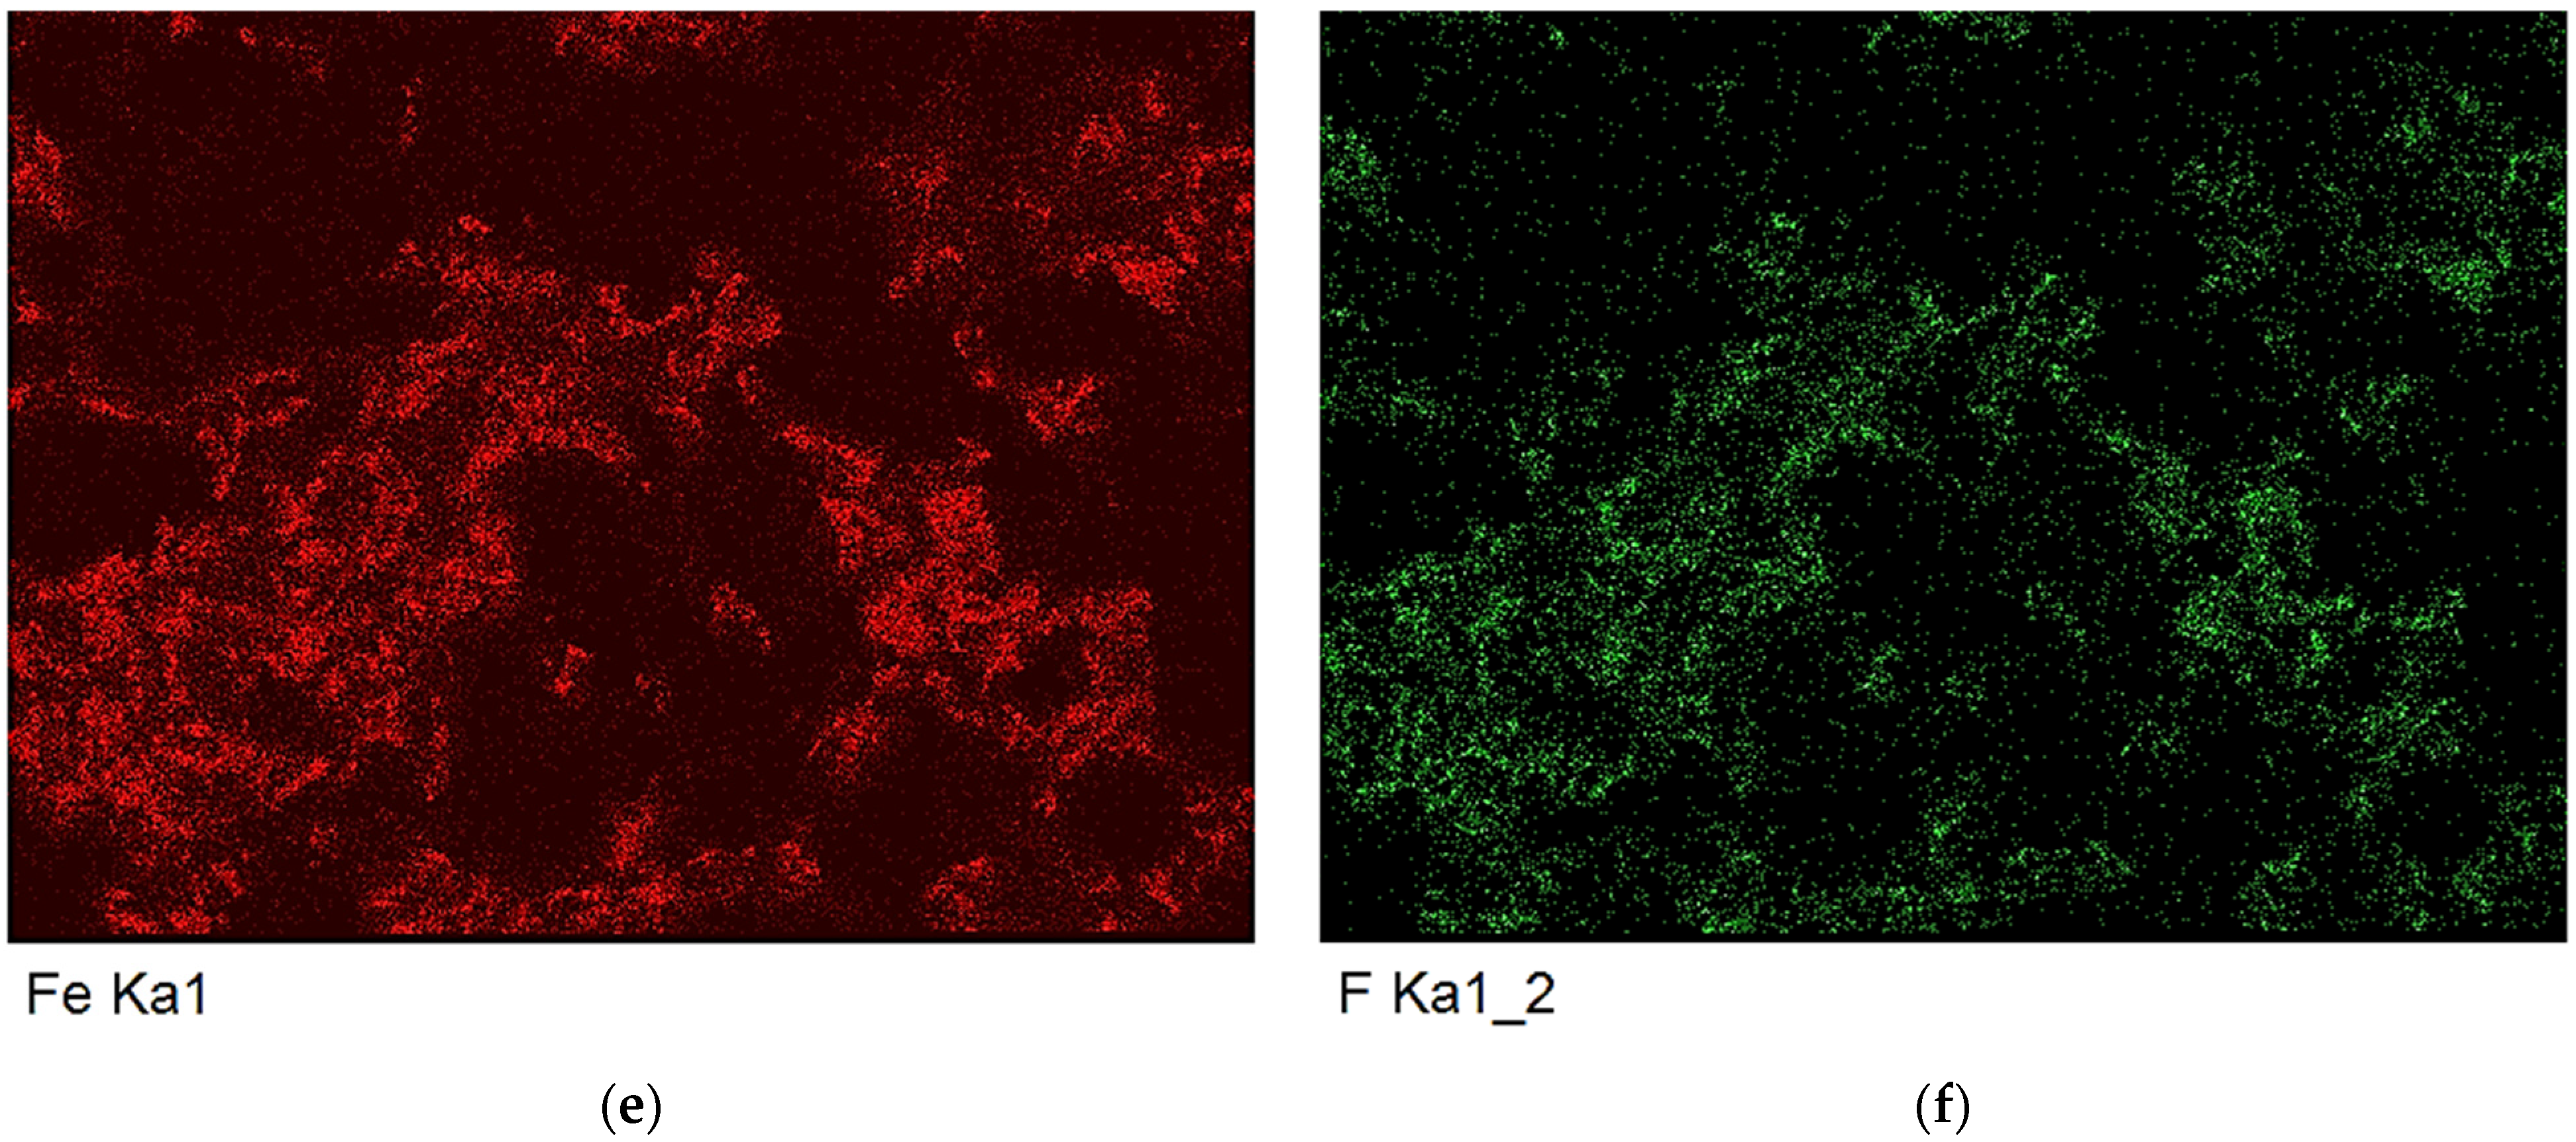
3.1. Characteristics of Cakes

In accordance with the XRF results, the cakes had the following chemical composition: 38.1–56.9% Fe, 6.6–19.9% Si, 4.5–11.8% C, 0.0–3.6% F, 1.0–11.3% Pd, 0.3–3.6% Pt, and 0.1–0.6% Rh. The extraction of Fe into the solution and Si into the gas phase from the iron collector was 17.8–100.0% and 19.2–100.0%, respectively. The cake yield varied within the range of 9.2–61.1%.
Some cakes were analyzed using both the XRF and EDS/XRD methods (Figure 2, Table 3 and Table 4). Aside from the components present in the initial iron collector, F was detected on the surface and in the pores of the cakes. EDS mapping (Figure 3) showed that F was distributed over the entire surface of the cakes. The reasons for this phenomenon are discussed below.

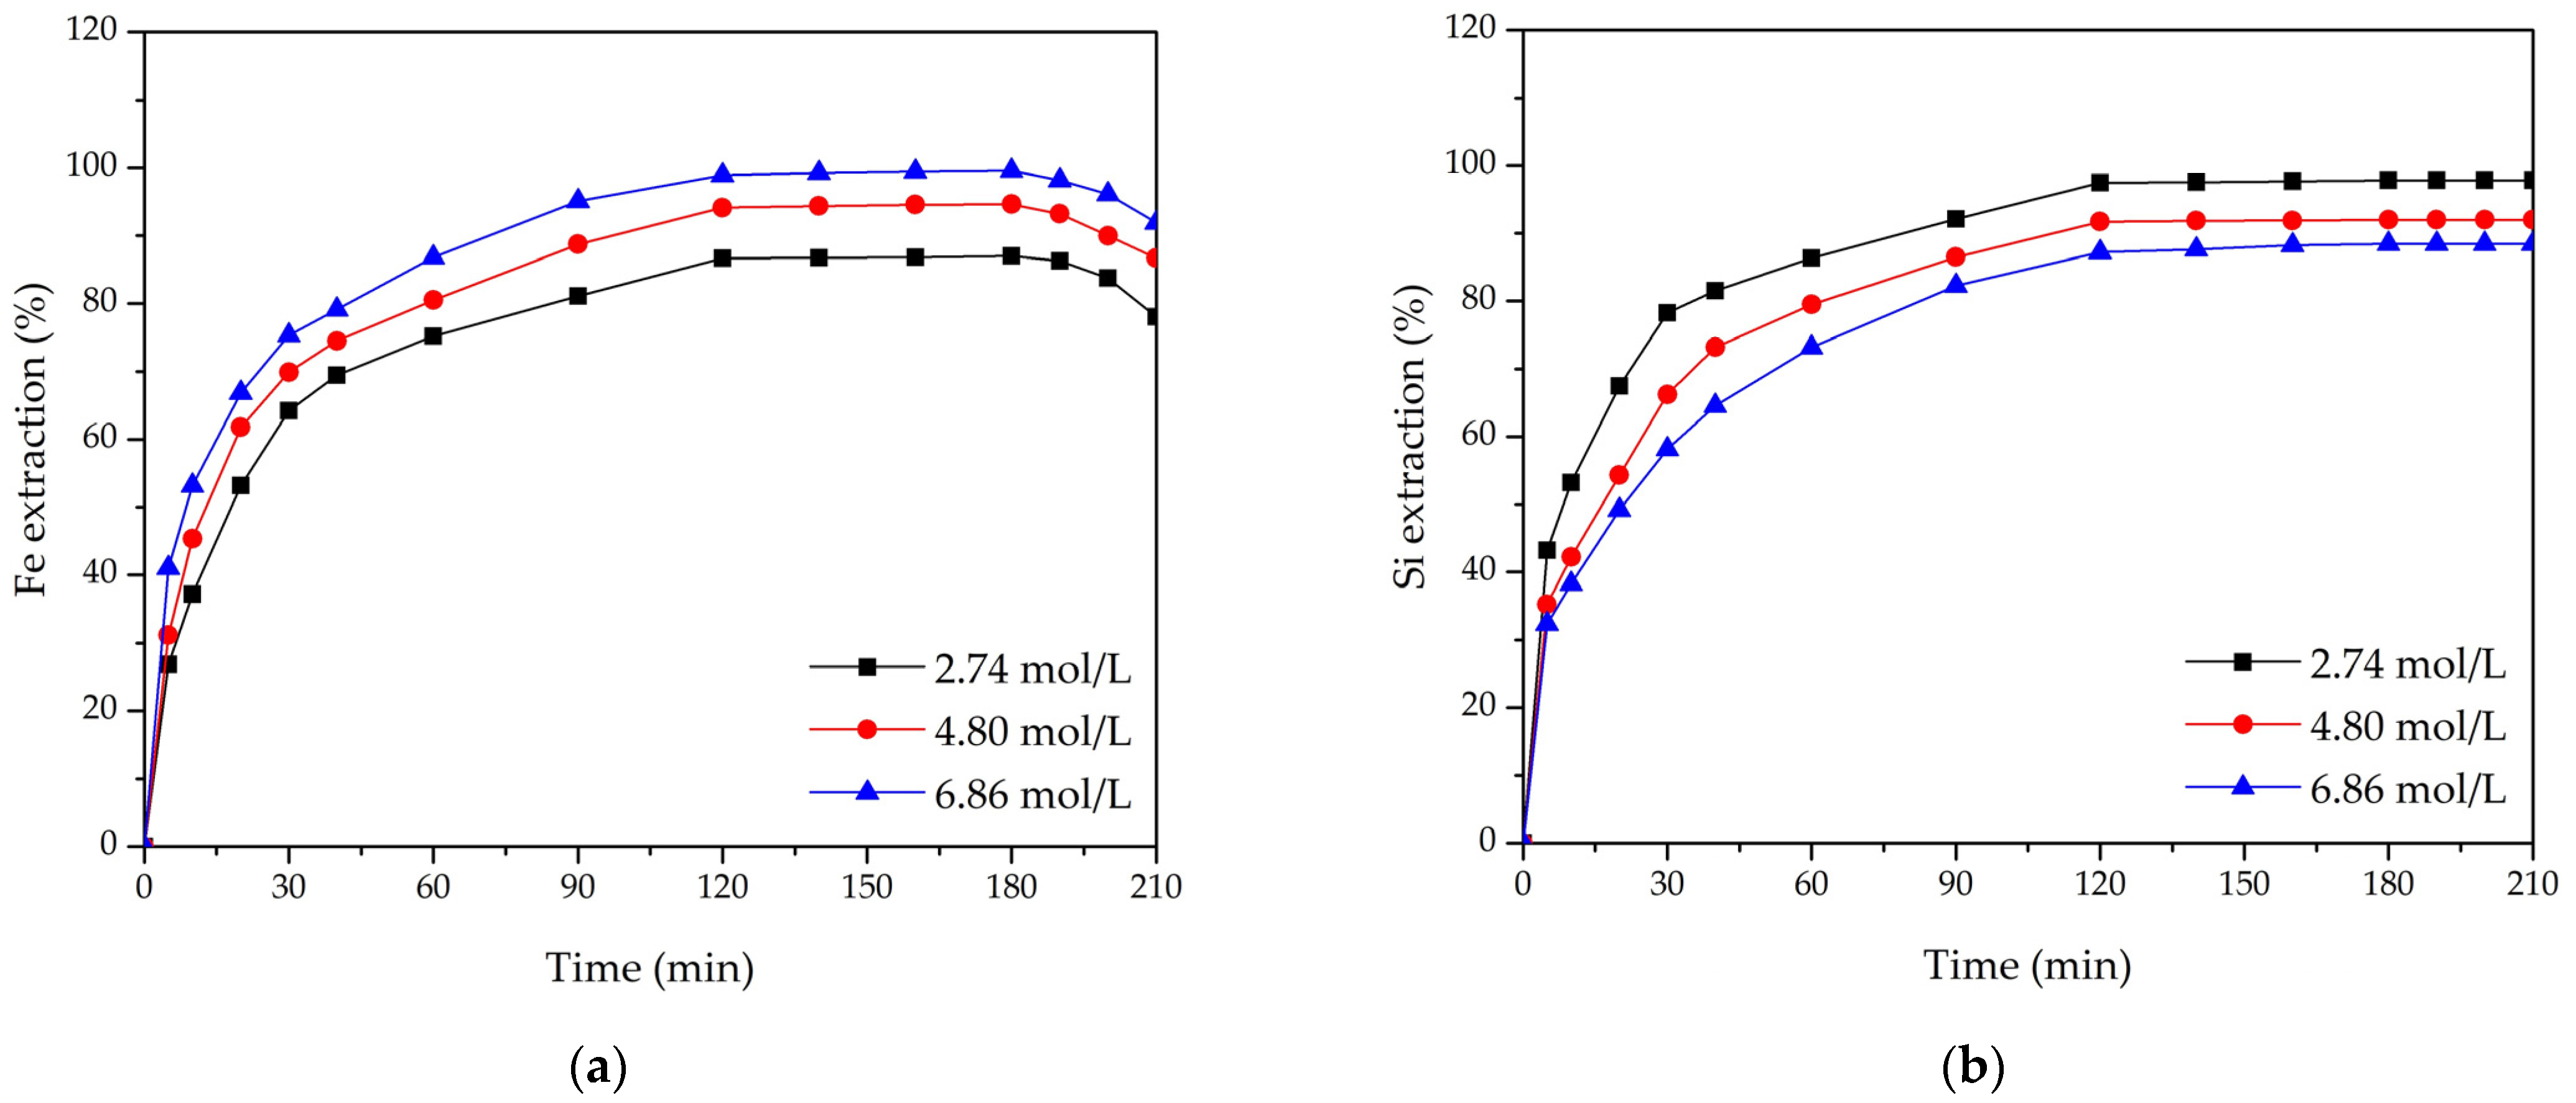
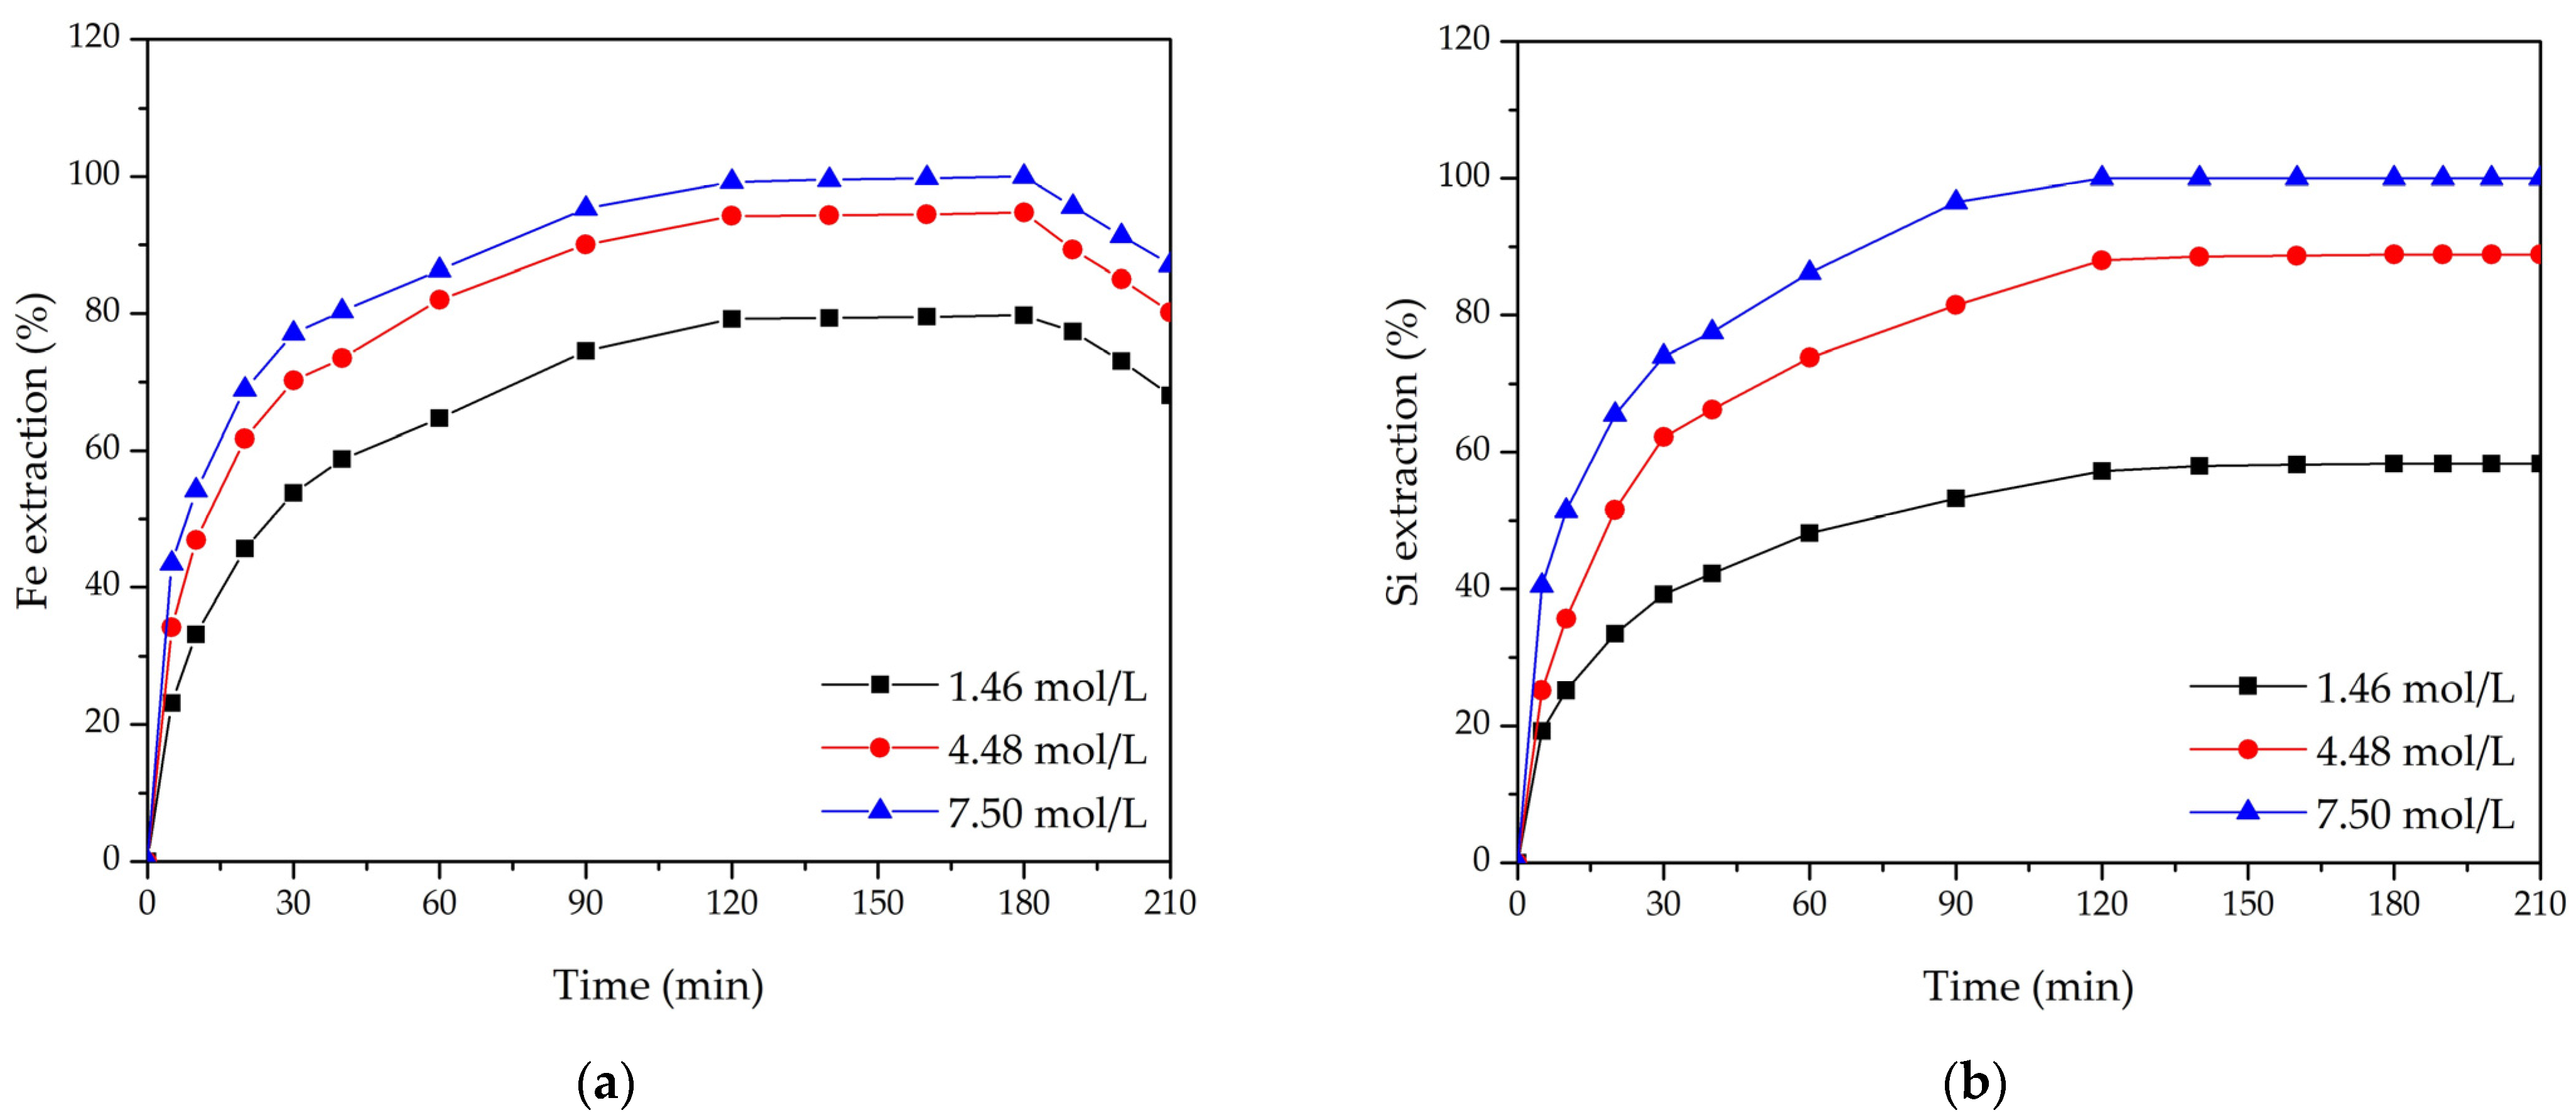
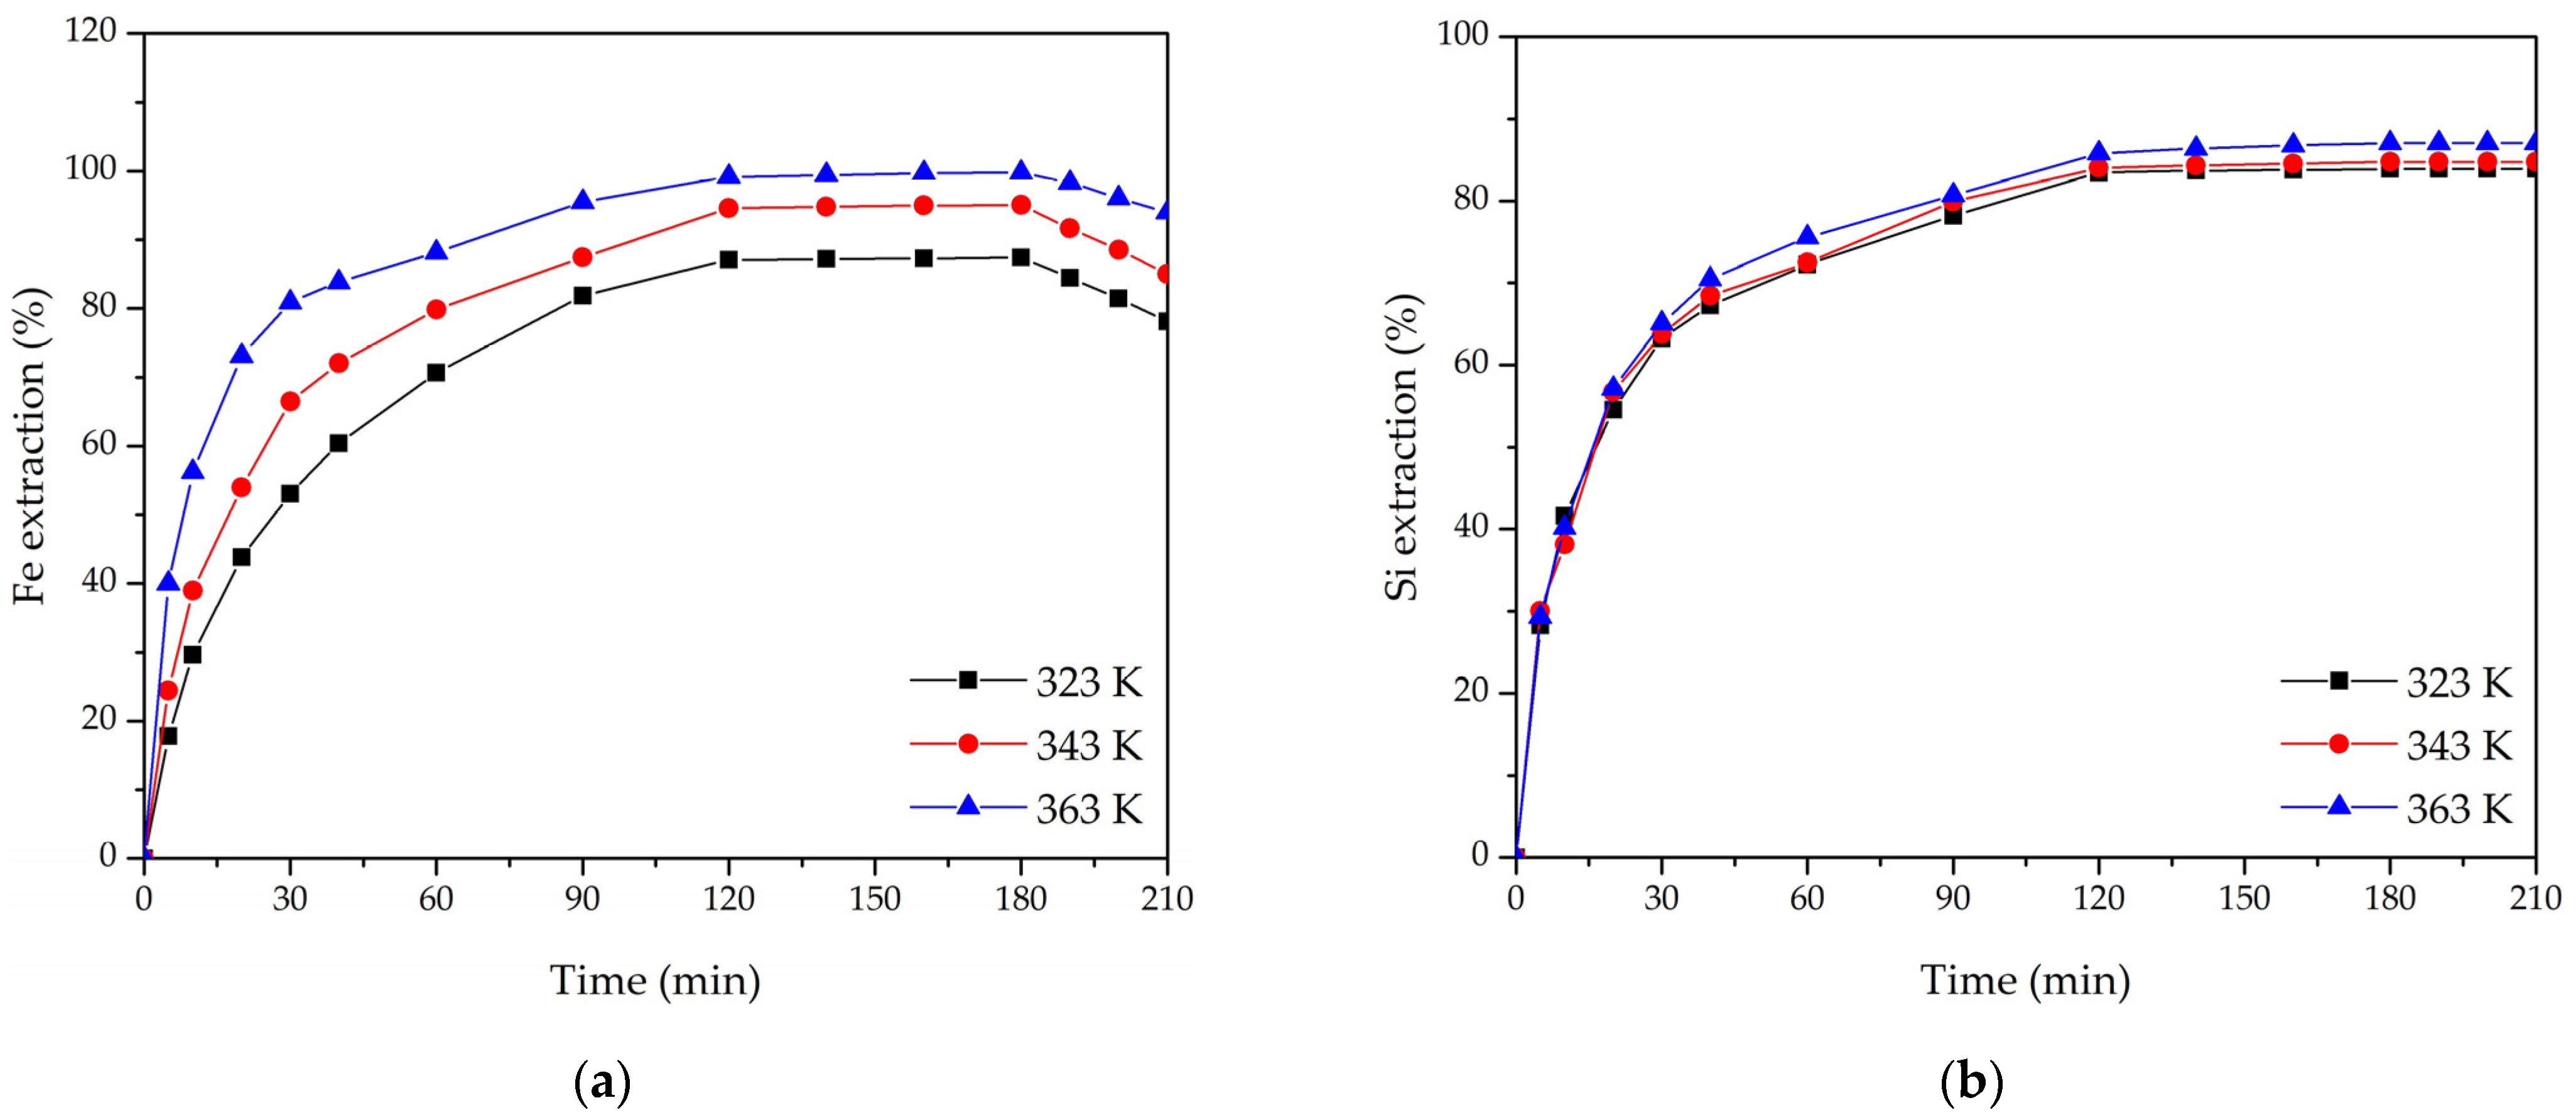
3.2. Effect of Leaching Parameters on Fe and Si Extraction

Figure 4 shows the influence of the HCl concentration on the extraction of Fe into the solution and Si into the gas phase from the iron collector. Increasing the HCl concentration from 2.74 mol/L to 6.86 mol/L allowed us to improve the extraction of Fe from 64.2% to 75.3% and from 86.7% to 98.9% in the time ranges of 0–30 min and 30–120 min, respectively (Figure 4a). This correlates with the supposed chemistry of the process (Equation (21)):
FexSiy + 2xHCl + 4yHF → xFeCl2 + ySiF4↑ + (x + 2y)H2
At the same time, there was a decrease in the extraction of Si from 78.2% to 58.1% and from 97.4% to 87.2% with identical changes in the HCl concentrations and the time ranges (Figure 4b). This occurred due to the accumulation of Fe2+ in the solution and its competitive interaction with HF (Equation (22)), which reduces the HF concentration and the extraction of Si (Equation (21)).
FeCl2 + 2HF → FeF2↓ + 2HCl
In the time range of 120–180 min, the amount of Fe passing into the solution was equal to the amount of Fe precipitating from the solution in the form of FeF2. Therefore, the increase in the extraction of Fe into the solution (dEFe/dτ) was zero. In the time range of 180–210 min, the process of FeF2 formation was predominant. This led to a decrease in the extraction of Fe into the solution (Figure 4a). In addition, after 120 min, the increase in the extraction of Si into the gas phase (dESi/dτ) was zero due to the presence of FeF2 on the surface of the cakes (Figure 4b).
FeF2 was present on the surface of the cakes in the form of thin-film conglomerates. This was confirmed by the XRF and EDS results (Section 3.1), indicating that F was present on the surface of the cakes. Conglomerates create diffusion difficulties by reducing the surface area of the cakes available for leaching, which has a negative effect on the extraction of Fe and Si [15]. This was also observed when ranging the HF concentration and temperature (see below).
The effect of the HF concentration ranging from 1.46 to 7.50 mol/L on the extraction of Fe and Si is presented in Figure 5. The extraction of Fe increased from 79.2% to 99.2% (Figure 5a), while the extraction of Si rose from 57.2% to 100.0% (Figure 5b) with 120 min of leaching. The positive effect of increasing the HF concentration on the extraction of Si was consistent with Equation (21). An erosion process led to a rapid increase in the area of the reaction surface, free of conglomerates. Therefore, the conditions of interaction between Fe and HCl were improved, which led to an increase in the Fe extraction.
Figure 6 shows the influence of temperature on the extraction of Fe and Si. Increasing the temperature from 323 K to 363 K allowed for an improvement in the extraction of Fe from 53.1% to 80.9% and from 87.1% to 99.2% in the time ranges of 0–30 min and 30–120 min, respectively (Figure 6a). At the same time, temperature had no effect on the extraction of Si (Figure 6b). Thus, the processes of the Fe and Si extraction were diffusion-chemically controlled (internal diffusion and chemically controlled) and diffusion controlled (internal diffusion controlled), respectively.

4. Modeling

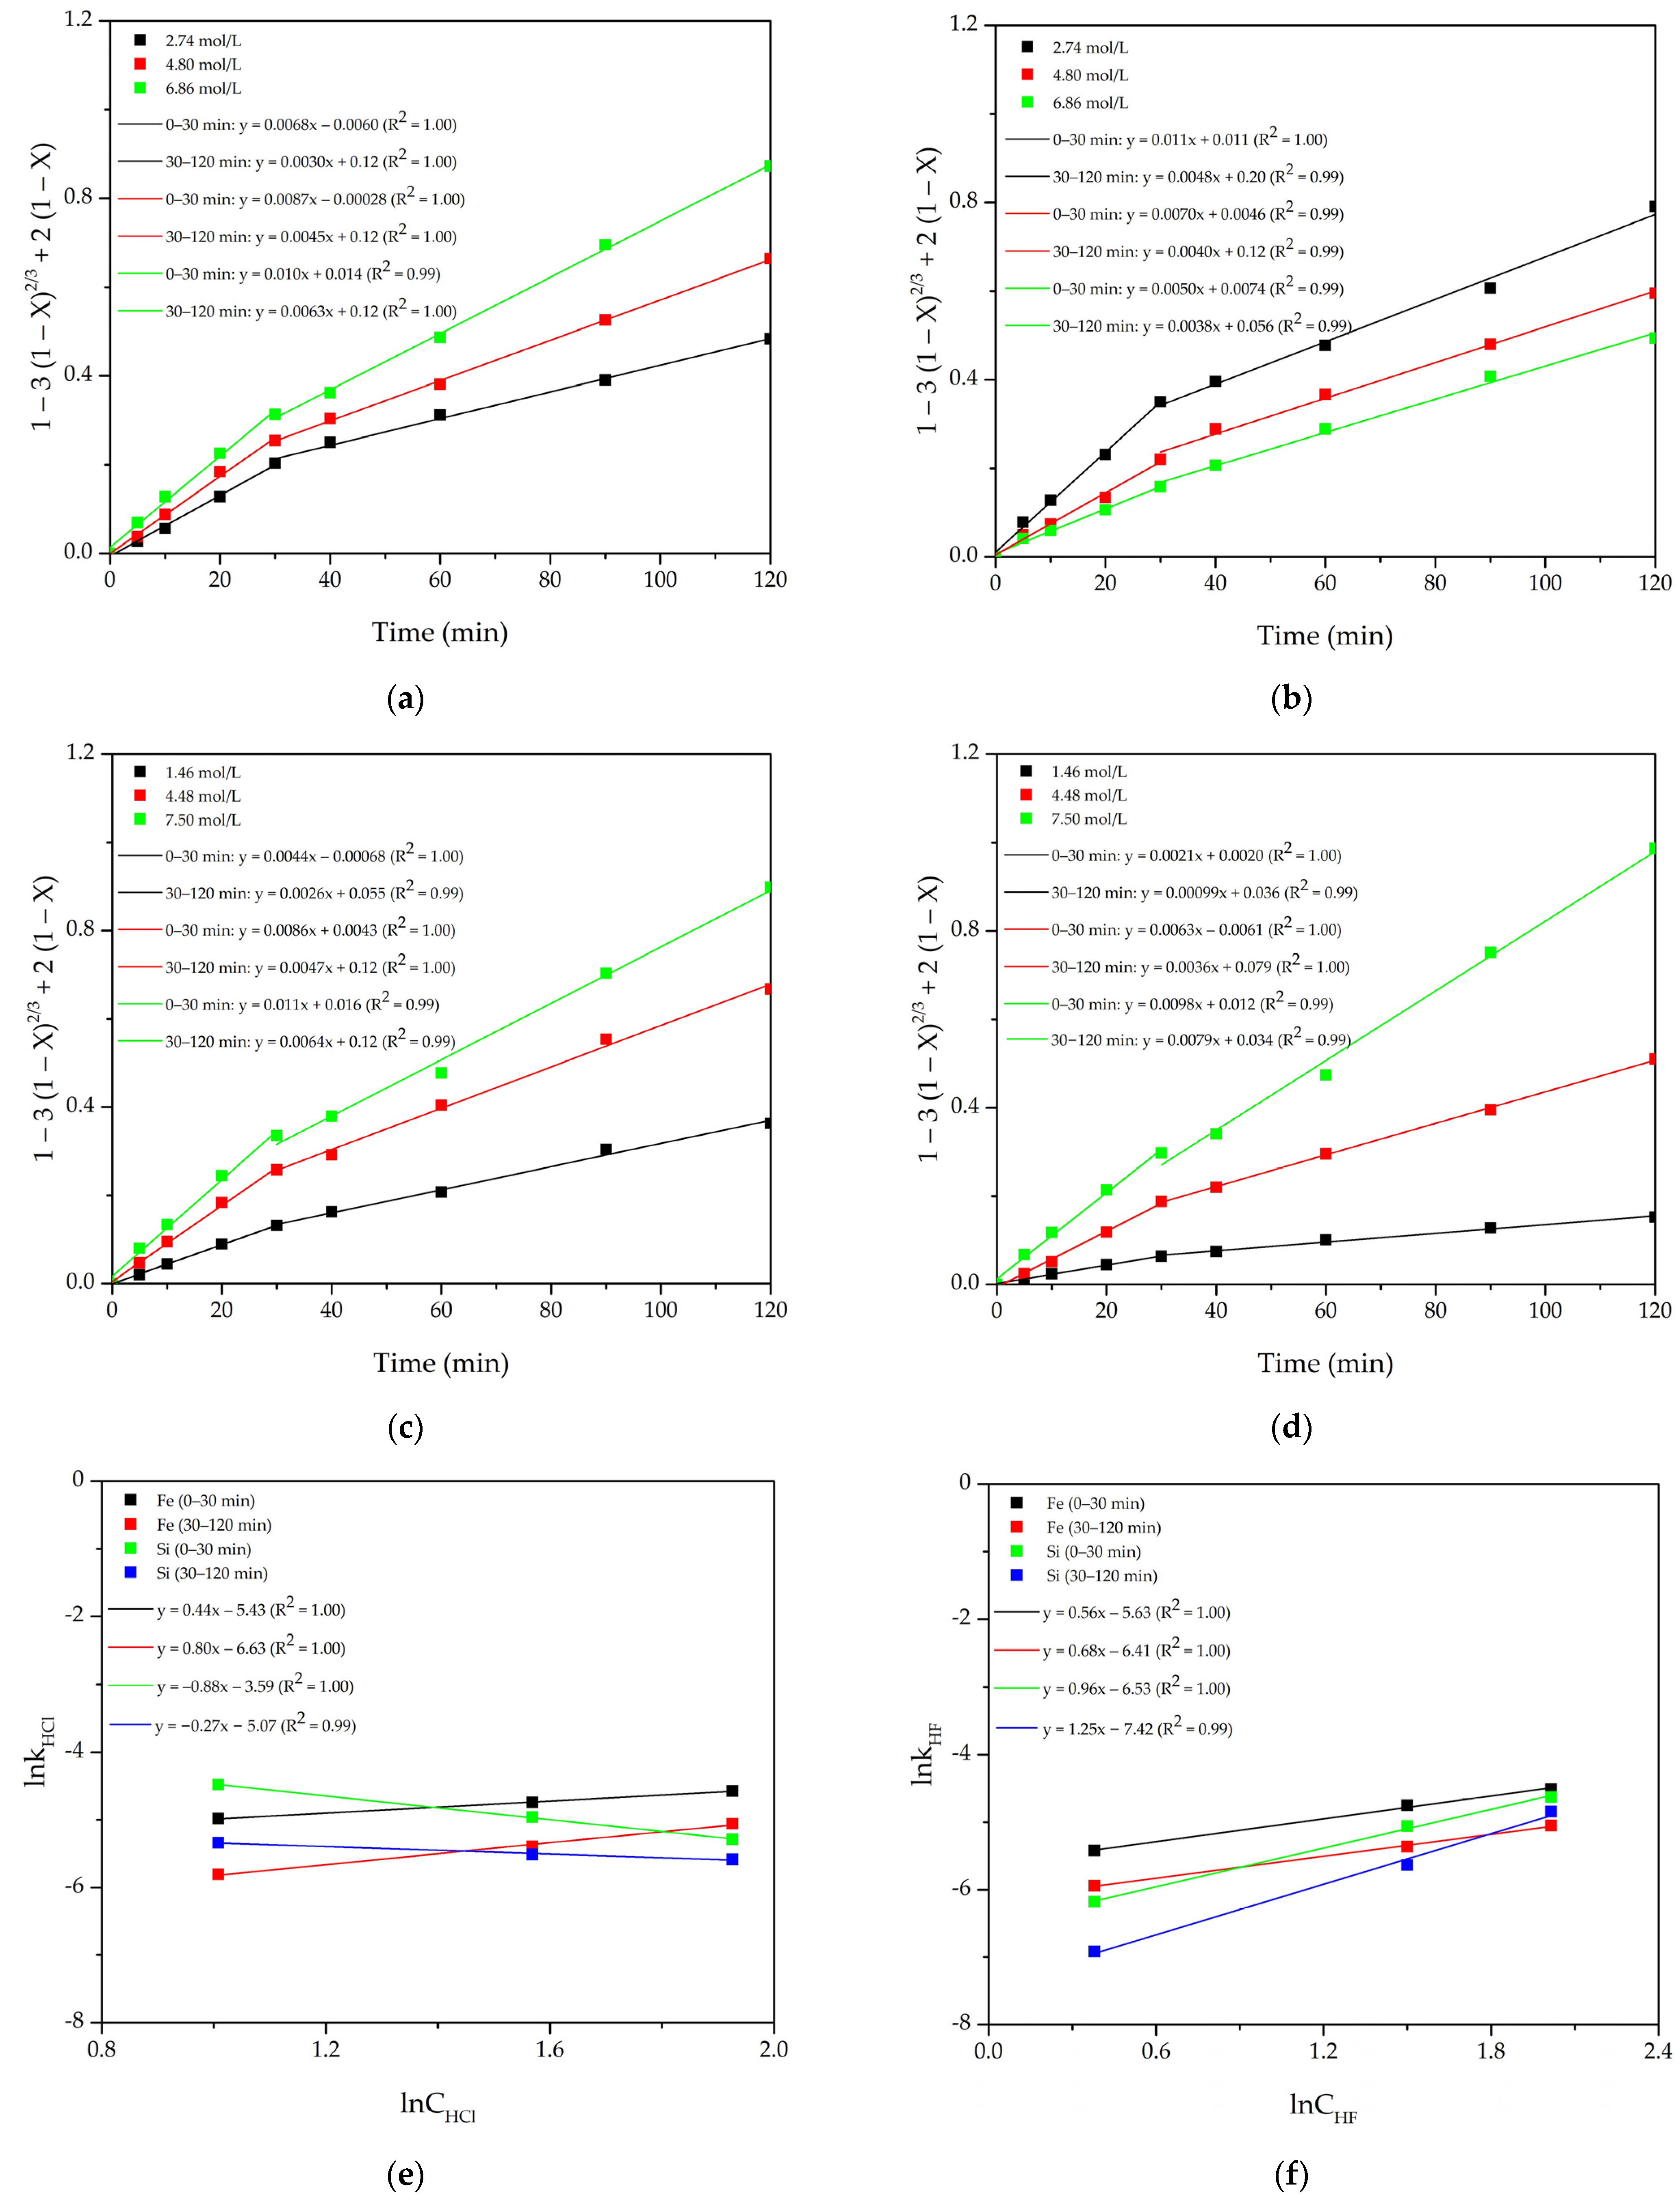
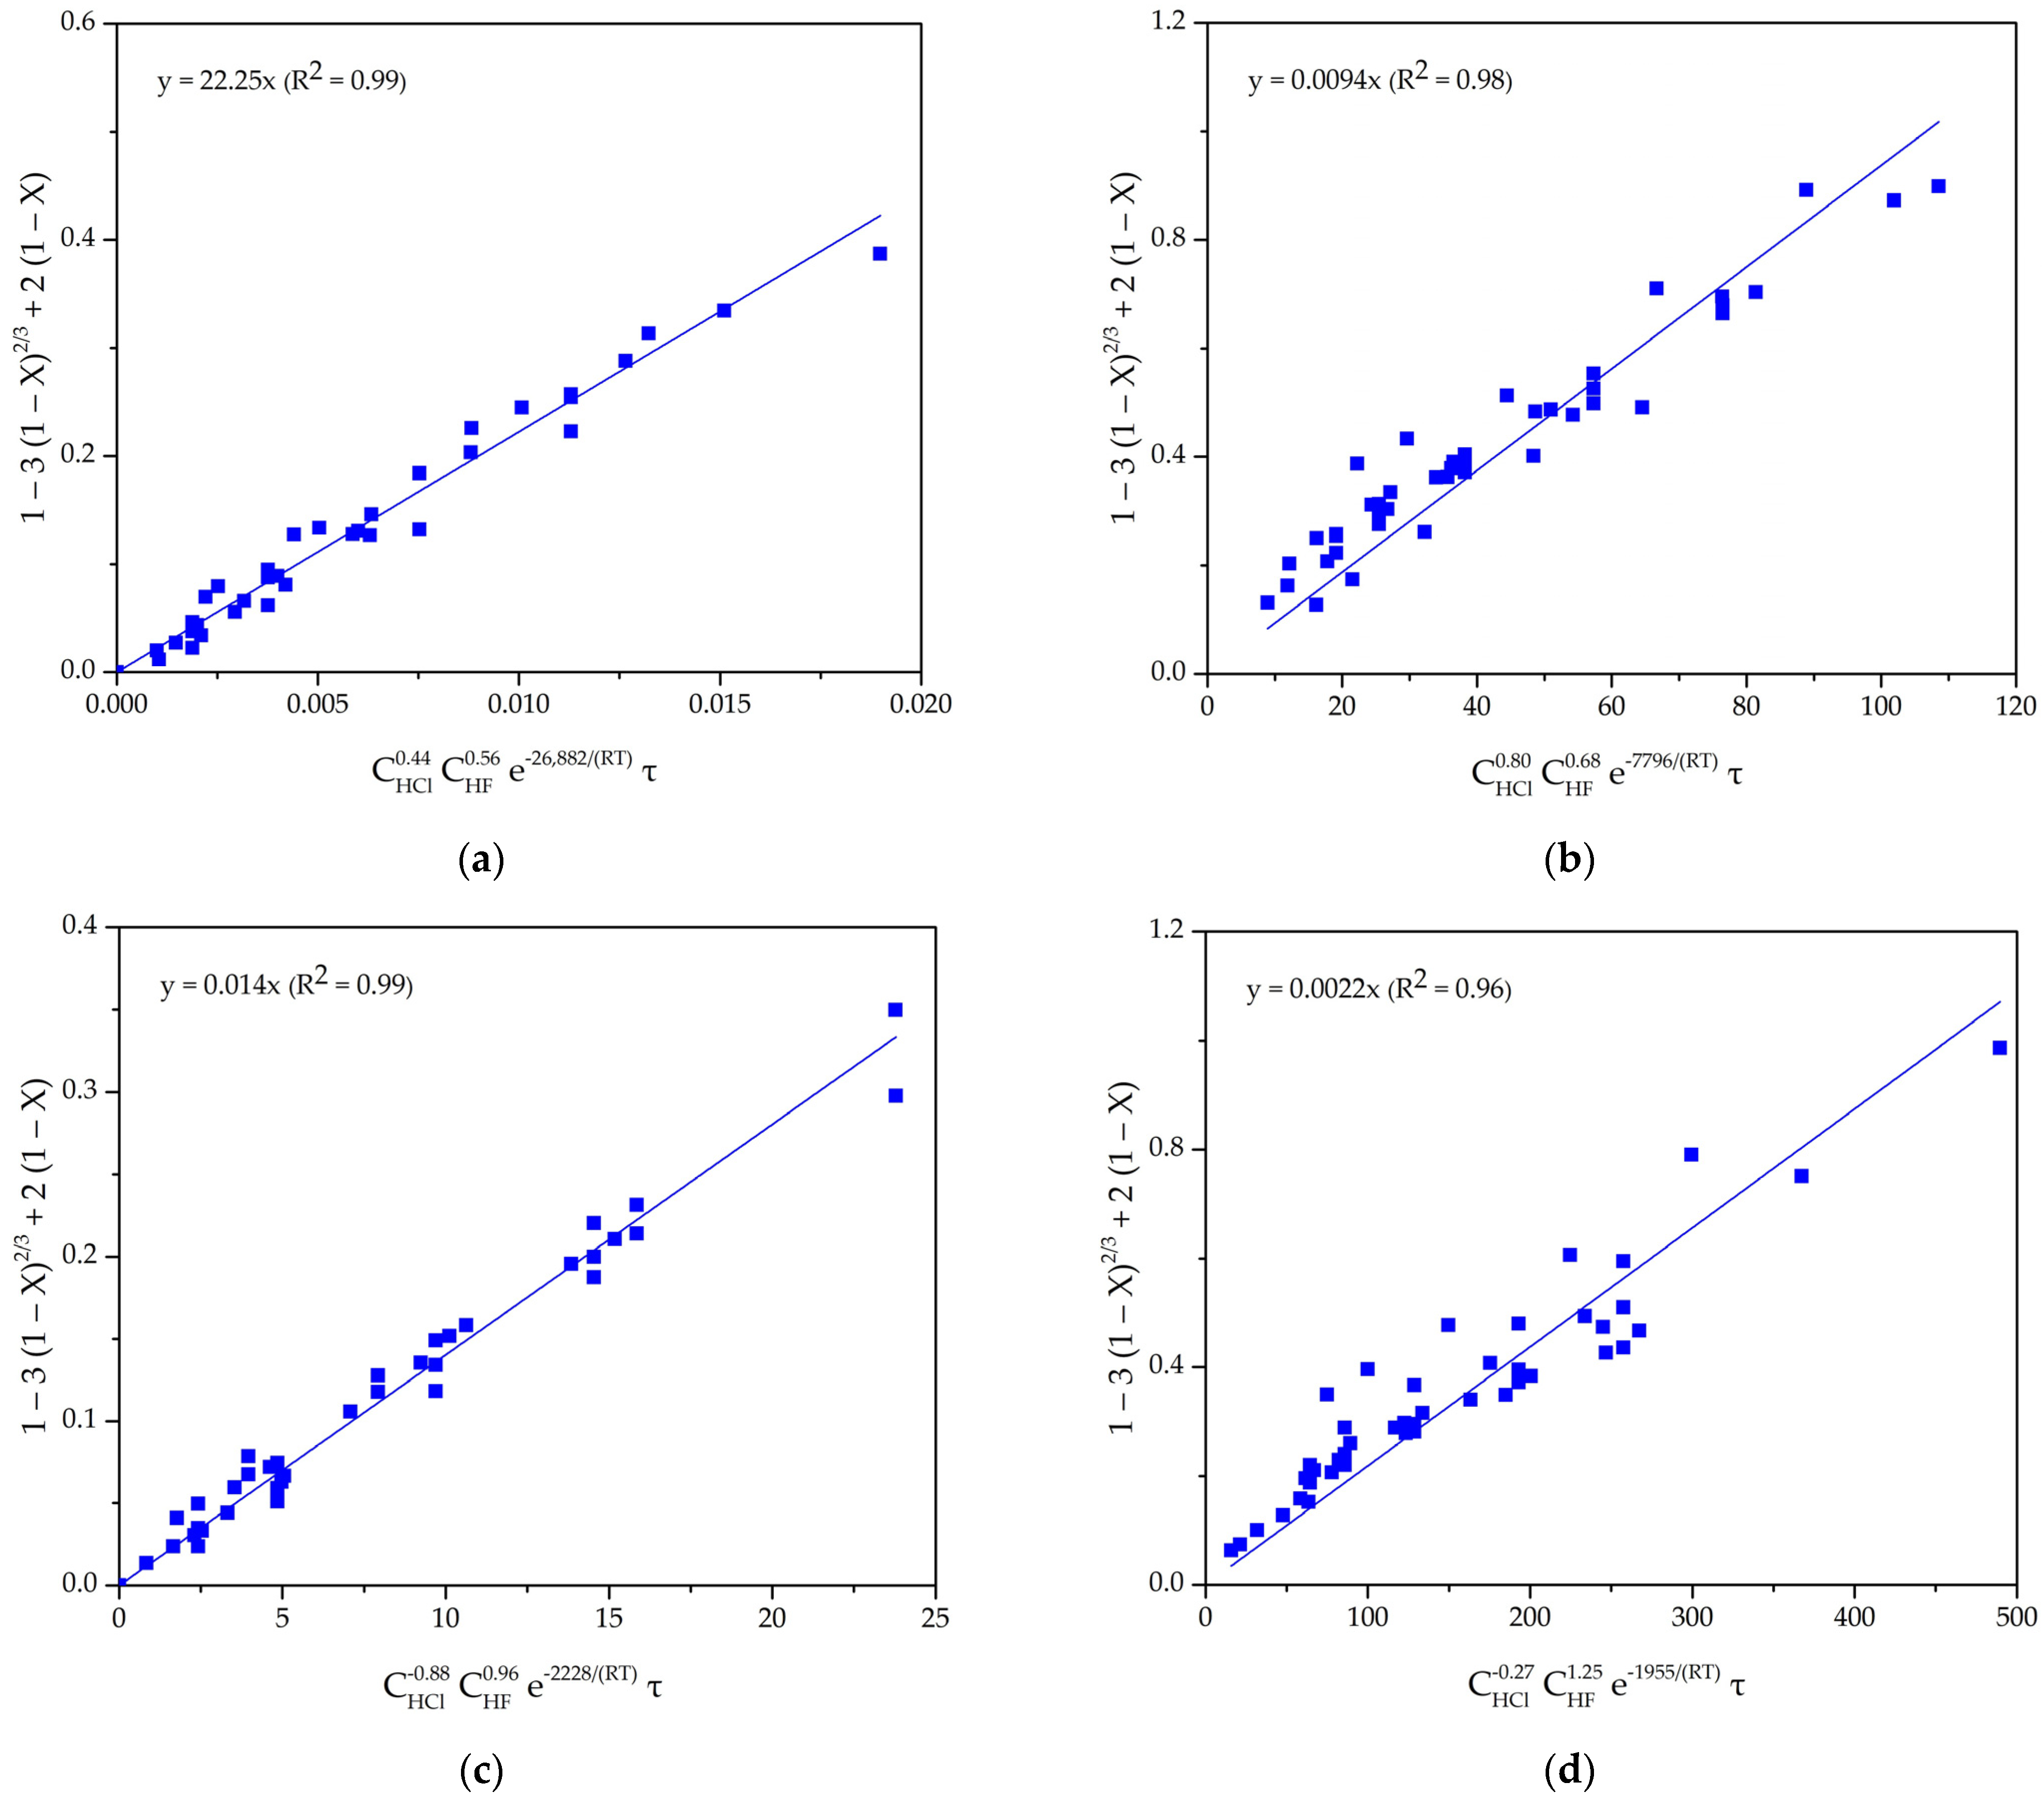
4.1. Shrinking Core Model

The SCM was used to obtain the kinetic equations and the optimal parameters of iron collector leaching in the time ranges of 0–30 min and 30–120 min. Since the increase in the extraction of Fe into the solution and Si into the gas phase (dEEl/dτ) from the iron collector in the time ranges of 120–180 min and 180–210 min was zero (or negative) (Figure 4, Figure 5 and Figure 6), these ranges were not considered. When modeling, Equation (3), describing the limiting stage of diffusion through the product layer (spherical particles), was applied as it is typical for diffusion-controlled leaching processes.
Figure 7a–d shows the results of modeling the extraction of Fe and Si by HCl and HF concentrations. The reaction orders with respect to HCl concentration were found for Fe and Si (Figure 7e) as 0.44 and −0.88 (time range of 0–30 min) and 0.80 and −0.27 (time range of 30–120 min), respectively. The reaction orders with respect to HF concentration were determined for Fe and Si (Figure 7f) as 0.56 and 0.96 (time range of 0–30 min) and 0.68 and 1.25 (time range of 30–120 min), respectively. The values obtained were fractional, which may indicate the presence of diffusion difficulties during leaching.
The results of modeling the extraction of Fe and Si by temperature are presented in Figure 8a,b, respectively. The apparent activation energies were found for Fe and Si (Figure 8c): 26.9 kJ/mol and 2.2 kJ/mol (time range of 0–30 min), 7.8 kJ/mol and 2.0 kJ/mol (time range of 30–120 min), respectively. Thus, the process of Fe extraction undergoes a transition from chemically controlled to diffusion controlled, while the process of the Si extraction is diffusion controlled.
Chemical reaction rate constants were found for Fe and Si (Figure 9) of 22.25 and 0.014 (time range of 0–30 min) and 0.0094 and 0.0022 (time range of 30–120 min), respectively. Based on the data obtained, the kinetic equations were proposed (Equations (23)–(26)).
F e 0 30 m i n : 1 3 1 X 2 3 + 2 1 X = 22.25 C H C l 0.44 C H F 0.56 e 26,882 R T τ
F e 30 120 m i n : 1 3 1 X 2 3 + 2 1 X = 0.0094 C H C l 0.80 C H F 0.68 e 7796 R T τ
S i ( 0 30 m i n ) : 1 3 1 X 2 3 + 2 1 X = 0.014 C H C l 0.88 C H F 0.96 e 2228 R T τ
S i 30 120 m i n : 1 3 1 X 2 3 + 2 1 X = 0.0022 C H C l 0.27 C H F 1.25 e 1955 R T τ

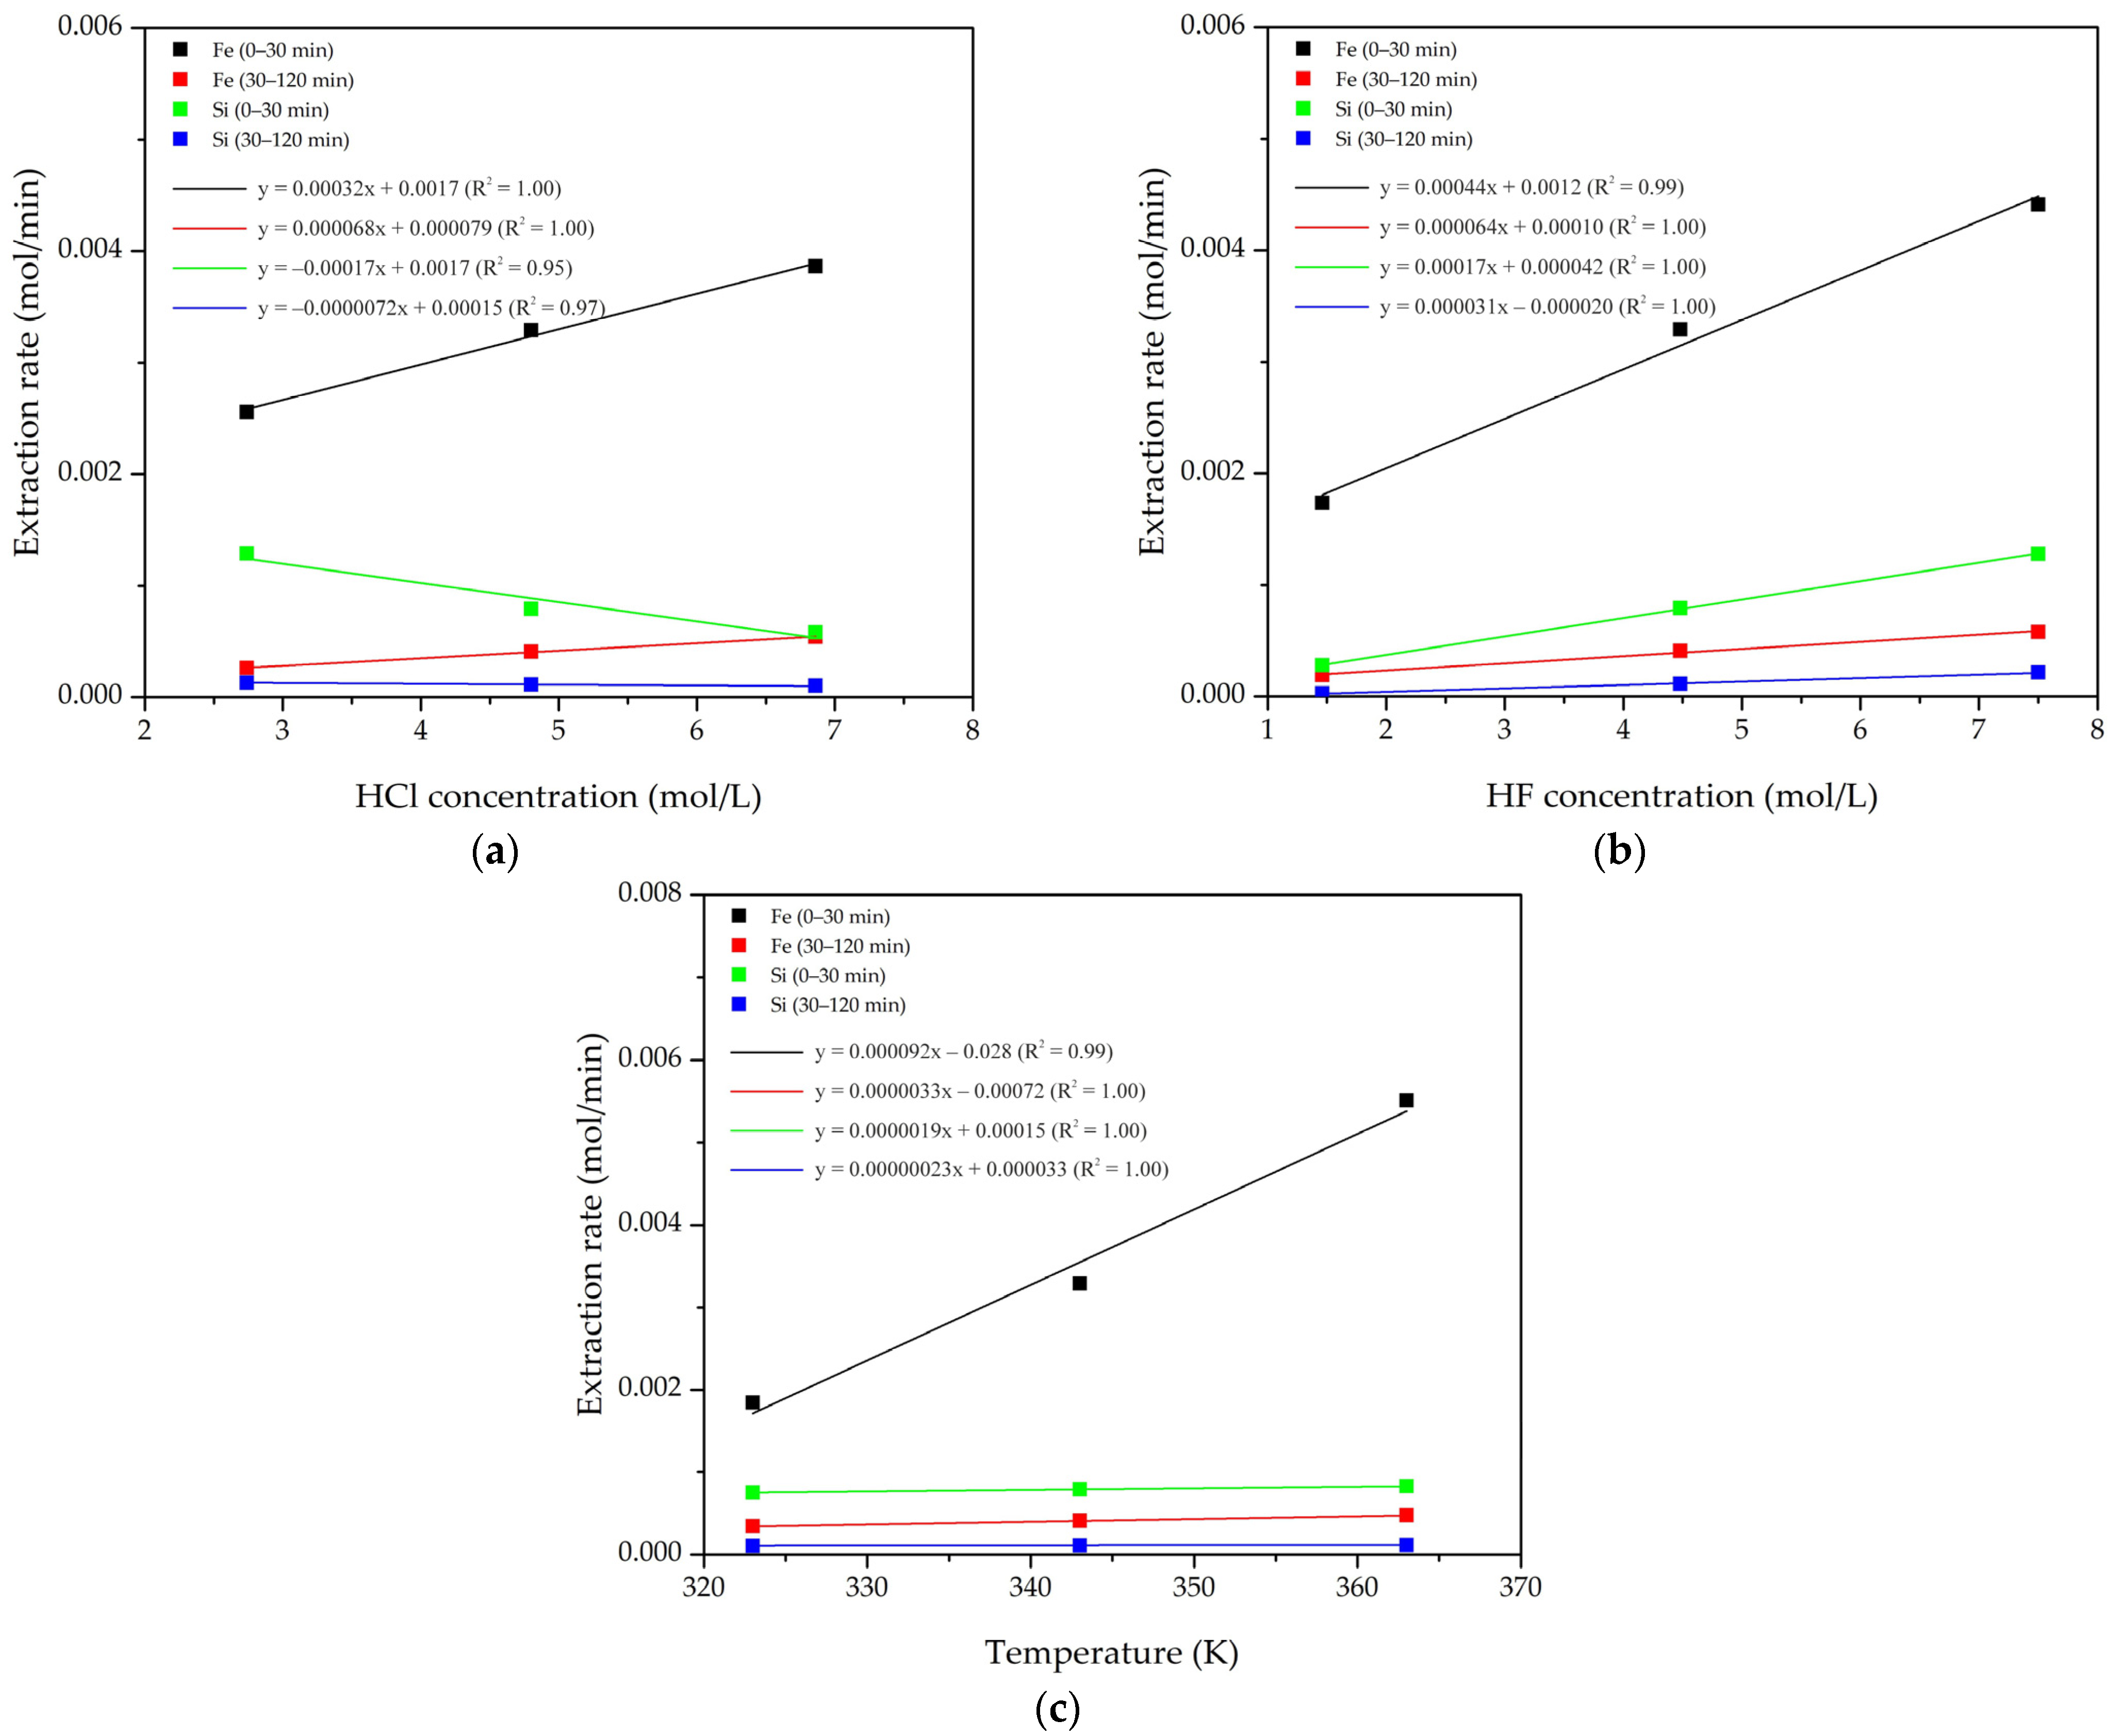
4.2. Full Factorial Experiment Model

The FFEM was used to obtain the kinetic equations (Equations (27)–(30)) and determine the extraction rates of Fe into the solution and Si into the gas phase from the iron collector (Figure 10) in the time ranges of 0–30 min and 30–120 min. The kinetic equations obtained using the FFEM and the SCM correlated well both with each other and with the experimental data (Section 3.2). The effect of the leaching parameters on the extraction rates of Fe and Si corresponded the data presented in Section 3.2.
W F e ( 0 30 m i n ) = 8.00 C H C l 0.45 C H F 0.57 e 26,682 R T
W F e ( 30 120 m i n ) = 0.00068 C H C l 0.79 C H F 0.68 e 7896 R T
W S i ( 0 30 m i n ) = 0.0017 C H C l 0.87 C H F 0.93 e 2308 R T
W S i ( 30 120 m i n ) = 0.000054 C H C l 0.28 C H F 1.25 e 1995 R T
Equations (23)–(30) were used to obtain the optimal parameters that provide the extraction of Fe and Si at the level of 95% with the minimum and the maximum leaching time of the iron collector and calculate the extraction rates of Fe and Si (Table 5). Analysis of the equations showed that the minimum leaching time as 80 min in the studied range of process parameters (Section 2.2). The maximum leaching time was 120 min, which was limited by the leaching kinetics of the collector (Figure 4, Figure 5 and Figure 6). The choice of the leaching parameters depends on the ratio of operating costs at a particular plant (reagent and energy consumption). The maximum rates of the Fe and Si extraction were achieved by selecting option No. 3 (Table 5). Leaching of the collector with the obtained optimal parameters ensured high PGM extraction during subsequent aqua regia processing of the cakes (at least 90%).

5. Conclusions

In this work, the leaching kinetics of an industrial iron collector containing PGMs in HCl and HF solutions were investigated. All leaching parameters had a positive effect on the extraction of Fe into the solution. The HF concentration had a positive effect on the extraction of Si into the gas phase, temperature had no effect, and the HCl concentration had a negative effect.
The positive effect of the HCl and HF concentrations on the extraction of Fe (m = 0.44 and 0.80 for τ = 0–30 min and 30–120 min, respectively) and Si (n = 0.96 and 1.25, respectively) was quite expected, since it corresponded to the proposed chemistry of the process. The positive effect of the HF concentration on the extraction of Fe (n = 0.56 and 0.68) was associated with an increase in the reaction surface during Si leaching. This improved the conditions of the interaction of Fe with HCl.
The effect of temperature on the leaching processes of Fe and Si was limited. For Fe, the apparent activation energy decreased from 26.9 kJ/mol to 7.8 kJ/mol in the time range of 0–120 min. This indicates the presence of internal diffusion difficulties caused by the deposition of a secondary phase (FeF2) on the surface of the cakes. At the same time, a relatively small effect of temperature was retained. The leaching process was diffusion-chemically controlled with a tendency to transition to diffusion controlled. For Si, the apparent activation energy was 2.0–2.2 kJ/mol in a similar time range and the process was diffusion controlled. There was no observable temperature effect.
The HCl concentration had a negative effect on the extraction of Si (m = −0.88 and −0.27), which decreased from 78.2% to 58.1% and from 97.4% to 87.2% in the time ranges of 0–30 min and 30–120 min, respectively. This occurred due to the competitive interaction of Fe2+ and HF, which reduced its activity toward Si. This interaction led to diffusion difficulties of the Fe and Si extraction because Fe precipitated on the surface of the cakes in the form of thin-film conglomerates of FeF2, which was confirmed by the XRF and EDS results.
The kinetic equations obtained using the SCM and FFEM enabled the determination of the optimal parameters of iron collector leaching and the extraction rates of Fe and Si. When the HCl concentration was 4.36 mol/L, the HF concentration 6.93 mol/L, temperature 363 K, and the leaching time 80 min, the extraction of Fe and Si reached 95%. At the same time, the extraction rates of Fe and Si were close to the maximum (WFe = 0.0068 mol/min and 0.00058 mol/min, WSi = 0.0013 mol/min and 0.00020 mol/min for τ = 0–30 min and 30–120 min, respectively).

Author Contributions

Conceptualization, E.K. and I.S.; Methodology, E.K. and K.K.; Software, K.K.; Validation, E.K. and A.K.; Formal analysis, K.K.; Investigation, I.S.; Resources, E.K.; Data curation, K.K. and A.K.; Writing—original draft preparation, E.K.; Writing—review and editing, E.K.; Visualization, E.K.; Supervision, E.K.; Project administration, E.K.; Funding acquisition, E.K. All authors have read and agreed to the published version of the manuscript.

Funding

The study was supported by a grant from the Russian Science Foundation, No. 23-29-00768, https://rscf.ru/project/23-29-00768/ (accessed on 7 November 2024).

Data Availability Statement

The original contributions presented in the study are included in the article, further inquiries can be directed to the corresponding author.

Conflicts of Interest

The authors declare no conflicts of interest.

References

  1. Wei, X.; Liu, C.; Cao, H.; Ning, P.; Jin, W.; Yang, Z.; Wang, H.; Sun, Z. Understanding the features of PGMs in spent ternary automobile catalysts for development of cleaner recovery technology. J. Clean. Prod. 2019, 239, 118031. [Google Scholar] [CrossRef]
  2. Jimenez de Aberasturi, D.; Pinedo, R.; Ruiz de Larramendi, I.; de Larramendi, J.R.; Rojo, T. Recovery by hydrometallurgical extraction of the platinum-group metals from car catalytic converters. Miner. Eng. 2011, 24, 505–513. [Google Scholar] [CrossRef]
  3. Angelidis, T. Development of a Laboratory Scale Hydrometallurgical Procedure for the Recovery of Pt and Rh from Spent Automotive Catalysts. Top. Catal. 2001, 16, 419–423. [Google Scholar] [CrossRef]
  4. Ghodrat, M.; Sharafi, P.; Samali, B. Recovery of Platinum Group Metals Out of Automotive Catalytic Converters Scrap: A Review on Australian Trends and Challenges; Lambotte, G., Lee, J., Allanore, A., Wagstaff, S., Eds.; Materials Processing Fundamentals 2018; TMS 2018; The Minerals, Metals & Materials Series; Springer: Cham, Switzerland, 2018; pp. 149–161. [Google Scholar] [CrossRef]
  5. Yakoumis, I.; Panou, M.; Moschovi, A.M.; Panias, D. Recovery of platinum group metals from spent automotive catalysts: A review. Clean. Eng. Technol. 2021, 3, 100112. [Google Scholar] [CrossRef]
  6. Benson, M.; Bennett, C.R.; Harry, J.E.; Patel, M.K.; Cross, M. The recovery mechanism of platinum group metals from catalytic converters in spent automotive exhaust systems. Resour. Conserv. Recycl. 2000, 31, 1–7. [Google Scholar] [CrossRef]
  7. Kašpar, J.; Fornasiero, P.; Hickey, N. Automotive catalytic converters: Current status and some perspectives. Catal. Today 2003, 77, 419–449. [Google Scholar] [CrossRef]
  8. Trinh, B.; Lee, J.; Suh, Y.; Lee, J. A review on the recycling processes of spent auto-catalysts: Towards the development of sustainable metallurgy. Waste Manag. 2020, 114, 148–165. [Google Scholar] [CrossRef] [PubMed]
  9. Peng, Z.; Li, Z.; Lin, X.; Tang, H.; Ye, L.; Ma, Y.; Rao, M.; Zhang, Y.; Li, G.; Jiang, T. Pyrometallurgical Recovery of Platinum Group Metals from Spent Catalysts. J. Miner. Met. Mater. Soc. 2017, 69, 1553–1562. [Google Scholar] [CrossRef]
  10. Morcali, M.H. A new approach to recover platinum-group metals from spent catalytic converters via iron matte. Resour. Conserv. Recycl. 2020, 159, 104891. [Google Scholar] [CrossRef]
  11. Carnogurska, M.; Prihoda, M.; Lazar, M.; Kurilla, P.; Dobakova, R. High-temperature processing and recovery of autocatalysts. Mater. Technol. 2018, 52, 335–340. [Google Scholar] [CrossRef]
  12. Ding, Y.; Zheng, H.; Zhang, S.; Liu, B.; Wu, B.; Jian, Z. Highly efficient recovery of platinum, palladium, and rhodium from spent automotive catalysts via iron melting collection. Resour. Conserv. Recycl. 2020, 155, 104644. [Google Scholar] [CrossRef]
  13. Liu, C.; Sun, S.; Zhu, X.; Tu, G. Metals smelting-collection method for recycling of platinum group metals from waste catalysts: A mini review. Waste Manag. Res. J. A Sustain. Circ. Econ. 2021, 39, 43–52. [Google Scholar] [CrossRef] [PubMed]
  14. Wen, Q.; Ding, Y.; Zheng, H.; Liu, B.; Zhang, S. Process and mechanism of electrolytic enrichment of PGMs from Fe-PGMs alloy. J. Clean. Prod. 2020, 271, 122829. [Google Scholar] [CrossRef]
  15. Kuzas, E.; Sandalov, I.; Karimov, K.; Kritskii, A.; Fomenko, I.; Zhidkov, I.; Abramov, A. Kinetics of Iron Collector Leaching in HCl and HF Media. Metals 2024, 14, 1077. [Google Scholar] [CrossRef]
  16. Levenspiel, O. Chemical Reaction Engineering, 3rd ed.; Wiley: New York, NY, USA, 1999. [Google Scholar]
  17. Montgomery, D.C. Design and Analysis of Experiments, 8th ed.; Environmental Progress & Sustainable Energy 32; Wiley: Hoboken, NJ, USA, 2012. [Google Scholar] [CrossRef]
  18. Kuzas, E.; Rogozhnikov, D.; Dizer, O.; Karimov, K.; Shoppert, A.; Suntsov, A.; Zhidkov, I. Kinetic study on arsenopyrite dissolution in nitric acid media by the rotating disk method. Miner. Eng. 2022, 187, 107770. [Google Scholar] [CrossRef]
Figure 1. SEM image with EDS spectrum areas (a) and XRD pattern (b) of the iron collector.
Metals 14 01416 g001
Figure 2. SEM images with EDS spectrum areas and XRD patterns: cake 1: CHCl = 2.74 mol/L, CHF = 1.46 mol/L, T = 323 K, τ = 180 min (a,b); cake 2: CHCl = 4.80 mol/L, CHF = 4.48 mol/L, T = 343 K, τ = 120 min (c,d); cake 3: CHCl = 6.86 mol/L, CHF = 7.50 mol/L, T = 363 K, τ = 180 min (e,f).
Metals 14 01416 g002
Figure 3. EDS mapping images: cake 1 (a,b); cake 2 (c,d); cake 3 (e,f).
Metals 14 01416 g003aMetals 14 01416 g003b
Figure 4. Effect of HCl concentration on the extraction of Fe (a) and Si (b) (CHF = 4.48 mol/L, T = 343 K).
Metals 14 01416 g004
Figure 5. Effect of HF concentration on the extraction of Fe (a) and Si (b) (CHCl = 4.80 mol/L, T = 343 K).
Metals 14 01416 g005
Figure 6. Effect of temperature on the extraction of Fe (a) and Si (b) (CHCl = 4.80 mol/L, CHF = 4.48 mol/L).
Metals 14 01416 g006
Figure 7. Results of modeling the extraction of Fe and Si: by HCl concentration (CHF = 4.48 mol/L, T = 343 K): for Fe (a) and Si (b), by HF concentration (CHCl = 4.80 mol/L, T = 343 K): for Fe (c) and Si (d); dependences of lnkHCl on lnCHCl (e) and lnkHF on lnCHF (f).
Metals 14 01416 g007
Figure 8. Results of modeling the extraction of Fe (a) and Si (b) by temperature (CHCl = 4.80 mol/L, CHF = 4.48 mol/L); dependences of lnkT on 1000/T (c).
Metals 14 01416 g008
Figure 9. Results of determining the chemical reaction rate constants for the time ranges of 0–30 min: Fe (a), Si (c) and 30–120 min: Fe (b), Si (d).
Metals 14 01416 g009
Figure 10. Effect of HCl concentration (a) (CHF = 4.48 mol/L, T = 343 K), HF concentration (b) (CHCl = 4.80 mol/L, T = 343 K), and temperature (c) (CHCl = 4.80 mol/L, CHF = 4.48 mol/L) on the extraction rates of Fe and Si.
Metals 14 01416 g010
Table 1. XRF and EDS results of the iron collector, %.
AnalysisAreaFeSiCPdPtRh
XRF76.811.94.91.00.30.1
EDSSpectrum 174.111.81.1
Spectrum 273.411.11.4
Spectrum 373.011.51.5
Spectrum 473.411.41.4
Table 2. XRD results of the iron collector, %.
Fe5Si3Fe3SiFe2PCSiCAlPdFe0.92O
38.235.99.78.05.02.11.2
Table 3. XRF and EDS results of the cakes, %.
MaterialAnalysisFeSiCFPdPtRh
Cake 1XRF52.310.05.63.71.00.2
EDS73.617.72.91.4
Cake 2XRF49.17.16.25.32.00.5
EDS40.66.92.46.7
Cake 3XRF43.68.39.91.79.53.10.6
EDS30.011.73.611.2
Table 4. XRD results of the cakes, %.
MaterialFe2PFe5Si3CFe3SiSiCAlPdCu2OTiO2Cu3PFe0.92OCr0.2Pt0.8Pt2SiFe3Pt
Cake 126.122.919.69.77.95.72.22.01.90.90.80.4
Cake 242.96.425.91.64.69.12.52.21.02.11.40.5
Cake 338.61.328.43.714.62.33.31.41.91.90.42.1
Table 5. Optimal parameters of the iron collector leaching and extraction rates of Fe and Si.
No.CHCl
(mol/L)
CHF
(mol/L)
T
(K)
τ
(min)
WFe
(mol/min)
WSi
(mol/min)
0–30 min30–120 min0–30 min30–120 min
13.594.803631200.00440.000590.00120.00021
24.115.103431200.00330.000390.00100.00014
34.366.93363800.00680.000580.00130.00020
44.997.36343800.00500.000400.00110.00015
Disclaimer/Publisher’s Note: The statements, opinions and data contained in all publications are solely those of the individual author(s) and contributor(s) and not of MDPI and/or the editor(s). MDPI and/or the editor(s) disclaim responsibility for any injury to people or property resulting from any ideas, methods, instructions or products referred to in the content.

