Abstract
It is difficult for traditional weathering steel (WS) to form a protective rust layer to withstand the chloride ions and high humidity. Hence, there is an urgent need to develop a new type of low-cost WS with excellent corrosion resistance in the containing NaCl environment. This study aims to determine the influence of Cu on the corrosion mechanism of 1%Ni WS in simulated containing NaCl atmospheric environments. By increasing the Cu content (0.15–0.55%), the corrosion resistance of WS is enhanced. The increasing Cu content promotes the formation of a stable and compact rust layer, significantly enriching the proportion of α-FeOOH to equip the rust layer with a physical barrier. The formation of CuO deposits in the holes and cracks make the rust layer more compact and uniform. The increased Cu content promotes the formation of CuFeO2 and increases the content of NiFe2O4. The formation of CuFeO2 and NiFe2O4 then equips the rust layer with a chemical barrier. Hence, the addition of Cu could enhance the resistance of 1%Ni WS to containing NaCl atmospheric environments.
1. Introduction
WS is a family of low-alloy structural steels, which has more corrosion resistance than typical carbon steel and is widely used in the construction of bridges, railways, carriages, containers, etc., and in rural, urban and industrial environments [1]. Recently, with the continuous development of marine engineering, the demand for weathering steel (WS) is increasingly gaining importance [1,2]. Traditional WS can be applied without paint in mild atmospheric environments. However, it is difficult for traditional WS to form a protective rust layer to withstand the chloride ions and high humidity [3,4]. Hence, advanced WS was developed to resist various marine atmospheres. Recently, it has been proven that 3%Ni WS can be applied paint-free in most marine atmospheres in Spain and Japan [5].
Ni-advanced WS forms a more compact and uniform rust layer than traditional WS in marine atmospheres [3,6]. Since the development of WS containing Ni, lots of studies have reached a consensus: the addition of Ni to WS is beneficial to the evolution of the compact rust layer, which forms a protective layer with physical and chemical barriers. It is believed that Ni has two effects on enhancing the corrosion resistance of WS [5,7,8]: (1) Ni can form NiFe2O4 in the rust layer, which can facilitate the nucleation of stable phases to form nanoscale α-FeOOH, causing the rust layer to form a more compact physical barrier; (2) Ni induces cation selectivity in the rust layer, making the resulting compact film an effective barrier to Cl− ions, and making the rust layer act as a chemical barrier. However, increasing the content of Ni seems to be the most effective and fastest way to improve the corrosion resistance of WS. Cheng et al. [9] indicated that when the amount of Ni is higher than 3%, the corrosion resistance of WS does not significantly improve. The corrosion resistance of WS with a Ni content of more than 3.5% is similar to that of WS with a Ni content of 3%. In addition, due to the high cost of Ni and commercialization, researchers have focused on reducing an appropriate amount of Ni and other corrosion-resistant compounds added to improve the corrosion resistance of WS.
In addition, some refs. [9,10,11] discovered that adding about 1% Ni to WS also resulted in good corrosion resistance in coastal atmospheric environments. Xu et al. [11] found that the corrosion resistance of WS can be effectively improved by adding Al and Mo to 1%Ni WS. Hence, the addition of other corrosion-resistant elements could feasibly improve the corrosion resistance of 1%Ni WS. Some studies [12,13] have illustrated that a small amount of Cu added to WS can reinforce the effect of Ni in WS. Hao et al. [14] found that Cu can form CuFeO2 in the rust layer to enhance the corrosion resistance of MnCuP WS. Kimura et al. [15] found that Cu, in the form of CuO, can jointly promote the formation of nanonetwork Fe(O,OH)6 with NiFe2O4. Carius et al. [16] showed the effect of Cu(Ⅱ) ions on the formation of α/γ-FeOOH and that Cu can be transformed into nano metallic copper, which accumulated on the rust layer, reducing the corrosion rate. In conclusion, the addition of 1%Ni and Cu is helpful for enhancing the corrosion resistance of WS. Therefore, the synergistic effect of Cu and Ni can be explored to develop a new type of low-cost WS with excellent corrosion resistance in the containing NaCl environment.
In this work, a wet–dry cycling corrosion test was carried out to simulate containing NaCl atmospheric environments to study the function of different contents of Cu-alloying elements in 1 wt% Ni WS. A scanning electron microscope (SEM) was used to observe the cross-section of the rust layer. X-ray diffraction (XRD) and X-ray photoelectron spectroscopy (XPS) were used to study the rust layer’s phase composition. The electrochemical behavior of the WS after different exposure times in the simulated containing NaCl atmospheric environment was investigated by EIS and potentiodynamic polarization. In conclusion, the influence of Cu on the corrosion mechanism of 1%Ni WS in simulated containing NaCl atmospheric environments was determined.
2. Materials and Methods
2.1. Sample Preparation
This study used a new type of 1%Ni weathering steel, which was melted using a 100 kg vacuum induction furnace. The chemical compositions of three 1%Ni steels with different Cu contents are shown in Table 1. Q235 steel was used as a contract test steel.

Table 1.
Chemical compositions of the test steel (wt.%).
2.2. Wet–Dry Cyclic Corrosion Test
According to TB/T 2375-1993, “Test Method for Periodic Infiltration Corrosion of Weathering Resistant Steel for Railway” [17], the test samples needed to be cut to the dimensions of 60 × 40 × 4 mm [18]. For the wet–dry cyclic corrosion test, each group of periodic processing required 4 parallel samples, 3 samples for corrosion kinetics analysis, and 1 sample for corrosion resistance analysis of the corrosion product layer. All samples had to be polished step by step with #150~1500 sandpaper until the surface of the sample was smooth and flat. After polishing, ultrasonic washing was carried out with acetone, dried and labeled with deionized water and alcohol, and stored in a drying box for 24 h until testing. The parameters of wet–dry cyclic corrosion test was shown in Table 2.
Table 2.
Parameters of wet–dry cyclic corrosion test.
The corrosion kinetics were obtained by measuring the weight loss. The test samples were measured by a precision balance to obtain the original weight, W0. Then, they were immersed in a solution (500 mL HCl + 500 mL deionized water + 3.5 g hexamethylenetetramine) in an ultrasonic cleaner for 600 s, with vigorous stirring at 25 °C to remove the surface corrosion products and obtain the final weights, Wt. This step was needed to ensure accuracy every time. Then, the corrosion rate (R, mg/cm2·h) of the WS was calculated as follows:
where (W0 − Wt) represents the weight loss of the WS, mg. S represents the exposed area of the WS, cm2. t represents the processing time, h.
2.3. Characterization and Analysis of the Corrosion Products
In this experiment, the digital camera was carried out to obtain surface morphologies of four test samples in the simulated containing NaCl atmospheric environment. Rigaku D/max-2500/PC X-ray diffractometer was used to detect the rust layer of four kinds of test steel by XRD (Rigaku Tokyo, Japan). The test angle under the Cu target was 10–70°, and the method of step scanning was adopted. The test voltage was 40 KV, and the current was 200 mA. The Hitachi S-3400N scanning electron microscope was used to observe the surface morphology of the rust layer and the cross-sections of the four test steels at different corrosion periods (HITACHI, Tokyo, Japan). The voltage and current during the test were 15 KV and 40 mA, respectively. XPS (EscaLab 250xi, Thermo Scientific, Waltham, MA, USA) was employed to investigate the elemental states using an Al Kα X-ray source. The binding energy was corrected by referencing the C1s peak (284.8 eV).
2.4. Electrochemical Measurements
Electrochemical analysis was carried out in a three-electrode system at room temperature (25 °C). A sample size of 10 × 10 × 4 mm was cut from the test steel with wire cutting. Five surfaces, other than the rusty surface, were polished with sandpaper, and the wire was welded on the back of the steel with an electric soldering iron. Those same five sides were sealed in a PVC pipe with epoxy resin as the working electrode. A Pt sheet was used as the counter-electrode, and a saturated calomel electrode (SCE) was used as the reference electrode. The solution used in the electrochemical test was a 3.5% sodium chloride solution. Before the test, in order to ensure the stability of the experimental environment and the surface state of the sample during the test, the sample was soaked in 3.5% NaCl solution for 1 h before the electrochemical open-circuit potential was measured for 600 s. After the open-circuit voltage stabilized, the sample was tested using the electrochemical impedance spectrum. EIS measurements were performed at the OCP, with the voltage perturbation amplitude of 10 mV in the frequency range from 105 Hz to 10−2 Hz. Potentiodynamic polarization measurements were carried out with a scan rate of 0.001667 V s−1 starting from −1.0 V up to −0.1 V vs. SCE.
3. Results
3.1. Corrosion Kinetics
Figure 1a shows the weight loss of the four test samples in the simulated containing NaCl atmospheric environment. The weight loss of the four test samples increased with each corrosion cycle. The weight loss of Q235 was the highest out of the four test samples. Meanwhile, the weight loss decreased with the increase in the Cu content in the same cycles. In the five cycles (360 h), the weight loss of Q235 was about 200 mg/cm2, and the weight loss of the 0.55Cu WS was about 105 mg/cm2, which is half as much as that of Q235. This indicates that the addition of Ni and Cu effectively improved the corrosion resistance of the WS. As shown in Figure 1b, the corrosion rates of the four test samples first rose in the initial corrosion cycles (<96 h) and then decreased in the later corrosion cycles (>96 h). Meanwhile, the corrosion rate decreased with the increase in the Cu content in the same cycles, which indicates that the addition of Cu was beneficial for enhancing the corrosion resistance. These preliminary results suggest that increasing the Cu content within a certain range benefits the corrosion resistance of 1%Ni WS in a simulated containing NaCl atmospheric environment.
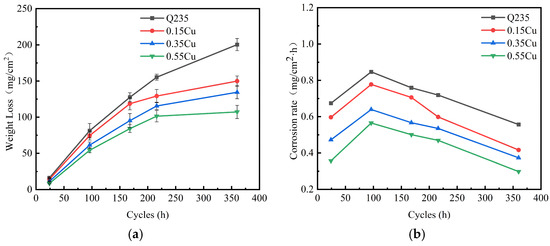
Figure 1.
The corrosion kinetics of four test samples in the simulated containing NaCl atmospheric environment for the wet–dry cyclic corrosion test: (a) weight loss plot; (b) corrosion rate plot.
3.2. Morphological Studies of Corrosion Products
Figure 2 presents the surface morphologies of the four test samples in the simulated containing NaCl atmospheric environment after different exposure times. Wang et al. [19] determined that the surface morphology of WS could quantify the evolution of the protective properties of the rust layer during the corrosion process. Hence, the corrosion resistance of the rust layer could be preliminarily judged by observing the surface morphology. In the early stage of the corrosion process, the surface morphologies of the four test samples were covered in an orange rust layer, which was identified as no protective ability. As the corrosion process continued, the surface morphologies of Q235 and 0.15Cu WS showed that the orange rust layer transformed into a black rust layer with caking, which indicates that the protective ability was poor. However, the surface morphology of 0.55Cu presented a dark brown rust layer with a small amount of caking, which means it was equipped with some protective ability. This phenomenon indicates that increasing the Cu icontent within a certain range benefits the corrosion resistance of 1%Ni WS, which is very consistent with the corrosion kinetics of the four test samples.
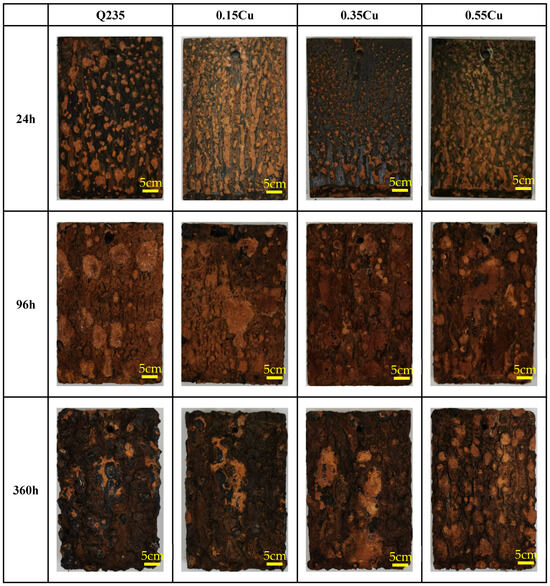
Figure 2.
Surface morphologies of four test samples in the simulated containing NaCl atmospheric environment.
Figure 3 shows the microscopic morphologies of four test samples in the simulated containing NaCl atmospheric environment with different corrosion cycles. In the early corrosion process, lots of cracks and holes existed in the rust layer, which resulted in an easy entrance for corrosion particles to increase the corrosion rate. Meanwhile, feather-shape-like (γ-FeOOH) and rosette-like (β-FeOOH) structures were observed, which are considered open structures that allow for corrosion particles to easily pass through the rust layer, leading to an increased corrosion rate [20,21]. Open structures and cracks cause a high corrosion rate in the early corrosion process. However, compared to the microscopic morphology of Q235, those of 0.35Cu and 0.55Cu WS contained fewer cracks and holes, which led to a lower corrosion rate than that of Q235, as shown in Figure 1. As the corrosion process continued, needle-shaped and cotton-ball-shape structures (α-FeOOH) appeared on the surfaces of the 0.35Cu and 0.55Cu WS. These structures can be dense, impeding corrosion particles by building a physical barrier to decrease the corrosion rate. Hence, in the later corrosion process, Q235 still contained lots of cracks and holes, while the 0.35Cu and 0.55Cu WS formed a physical barrier to decrease the corrosion rate. Meanwhile, it was observed that the holes contained in the 0.35Cu and 0.55Cu WS gradually decreased as the corrosion process continued, which may indicate that the Cu could repair the holes. Hence, this phenomenon indicates that the addition of Cu is beneficial for the formation of α-FeOOH and makes the rust layer more compact, resulting in better corrosion resistance.
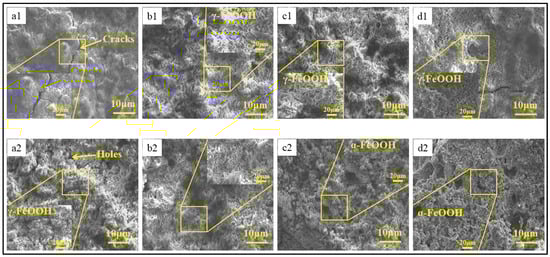
Figure 3.
The microscopic morphology of four test samples in the simulated containing NaCl atmospheric environment. (a1–d1) refer to 24 h; (a2–d2) refer to 360 h (a) Q235; (b) 0.15Cu; (c) 0.35Cu; (d) 0.55Cu.
Figure 4 shows the cross-sectional microscopic morphologies of the four test samples in the simulated containing NaCl atmospheric environment. As shown in Figure 4, there were many cracks and holes in the rust layer, which shows that it was not equipped with a protective ability in the early corrosion process. As the corrosion process continued, the cross-sectional microscopic morphology of Q235 was still similar to that of the early rust layer. Meanwhile, compared to Q235, the rust layer for 0.35Cu and 0.55Cu WS was more uniform and compact, which formed a physical barrier to decrease the corrosion rate. This is the main reason for the decreased corrosion rate in the later corrosion cycles.
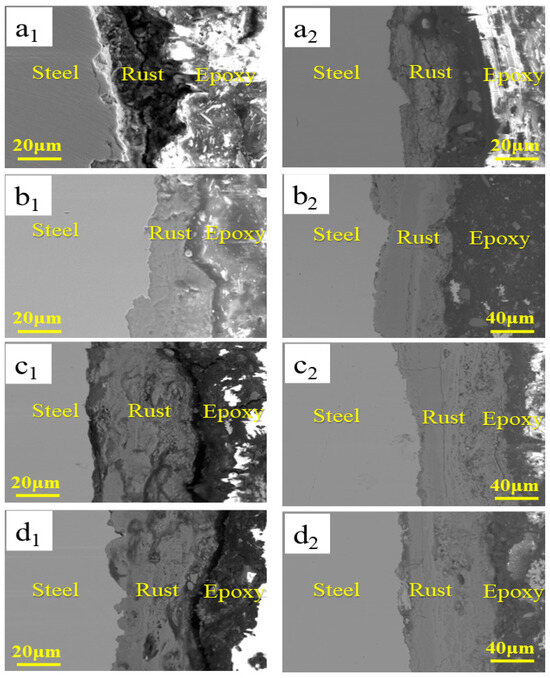
Figure 4.
The cross-sectional microscopic morphology of four test samples in the simulated containing NaCl atmospheric environment. (a1–d1) refer to 24 h; (a2–d2) refer to 360 h; (a) Q235; (b) 0.15Cu; (c) 0.35Cu; (d) 0.55Cu.
3.3. Composition of the Rust Layer
Figure 5 shows the XRD spectra of the four test samples in the simulated containing NaCl atmospheric environment. As shown in Figure 5, all rust layers were composed of γ-FeOOH, β-FeOOH, α-FeOOH, and Fe3O4. Although the composition of the rust layer was the same, the contents of each component were different. The reference intensity ratio method and the Rietveld method were carried out to determine the relative amount of each component [22]. In the early corrosion stage, the rust layer was mainly composed of lots of γ-FeOOH and β-FeOOH and a small number of α-FeOOH and Fe3O4. As the corrosion process continued, the contents of α-FeOOH and Fe3O4 increased, and the γ-FeOOH and β-FeOOH decreased. In addition, the content of α-FeOOH increased with the increase in Cu content. This indicates that the Cu element could promote the generation of α-FeOOH, which is very consistent with previous studies [23,24].

Figure 5.
The XRD spectra of the four test samples in the simulated containing NaCl atmospheric environment. (a) After 24 h; (b) after 96 h; (c) after 360 h; (d) the proportion of each phase in the rust layer of the four test samples.
Kamimura [22] indicated that the ratio of α (α-FeOOH) to γ* (the total content of γ-FeOOH, β-FeOOH, and Fe3O4) could be calculated to evaluate the protective ability of the rust layer. A higher α/γ* means that the rust layer has better corrosion resistance. In addition, when the α/γ* is greater than 1, it means that the rust layer has a protective ability. As shown in Figure 6, the α/γ* values of Q235, 0.15Cu, 0.35Cu, and 0.55Cu were 0.15, 0.21, 0.28, and 0.33, respectively. These ratios were all lower than 1, which shows that the rust layer was not equipped with a protective ability. In the later corrosion process, the α/γ* values of Q235, 0.15Cu, 0.35Cu, and 0.55Cu were 0.29, 0.79, 0.91, and 1.41, respectively. This indicates that the addition of Cu and Ni effectively improved the corrosion resistance. In addition, the α/γ* increased with the increasing Cu content, indicating that the protective ability of the rust layer also improved with the increasing Cu content. These results are consistent with the corrosion kinetics.
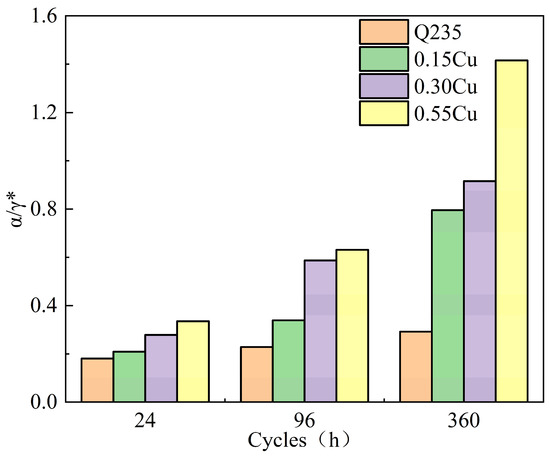
Figure 6.
The protective ability of the four test samples in the simulated containing NaCl atmospheric environment.
To further analyze the role of Cu in the evolution of the rust layer during the corrosion process, XPS analysis was conducted to study the Cu 2p and Ni 2p in the corrosion products for 0.55Cu contents WS after 360 corrosion cycles, as shown in Figure 7. As shown in Figure 7, Cu 2p spectra of the 0.55Cu contents WS after 360 corrosion cycles exhibited two fitting peaks at 932.6 ± 0.1 and 933.6 ± 0.1 eV, corresponding to CuFeO2 and CuO, respectively. The Ni 2p spectrum displayed two fitting peaks at 855.5 ± 0.1 and 858.7 ± 0.1 eV, corresponding to NiFe2O4 and Ni(OH)2, respectively.
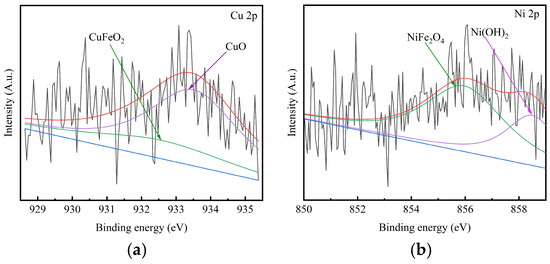
Figure 7.
XPS spectra of Cu 2p and Ni 2p in the corrosion products for 0.55Cu contents WS after 360 corrosion cycles. (a) Cu 2p; (b) Ni 2p.
3.4. Electrochemical Properties of the Rust Layer
The general behavior of the four test samples (rusted steels) in 3.5% NaCl after different exposure times in the simulated containing NaCl atmospheric environment was investigated by recording the potentiodynamic polarization curves over a wide potential range (Figure 8). Figure 8 shows that the addition of Cu and Ni influences the anodic curves. The anodic and cathodic reactions were mainly controlled by the metal dissolution and the reduction reaction of the corrosion products and oxygen, respectively. The relationship between the current density i and the polarization potential E under Tafel should follow the Butler–Volmer equation, as follows:
where icorr is the corrosion current density, ba is the Tafel constant for an anode and bc is the Tafel constant for a cathode (icorr, ba and bc). These reflect the corrosion mechanism and kinetics and are considered electrochemical corrosion parameters. Hence, this equation can be carried out to obtain the electrochemical parameters, as shown in Figure 8d and Table 3 [25,26]. Meanwhile, the cathodic process is controlled by the reduction of rust and dissolved O2, and the anodic process is controlled by the metal dissolution. It was found that with the increase in the Cu content and the continuation of the corrosion cycle, the corrosion potential of the rust layer gradually became positive, and the corrosion current density gradually decreased. This indicates that the corrosion resistance of the rust layers was gradually enhanced. The results of the XRD analysis show that the composition of each phase in the rust layer was different; the higher the Cu content, the higher the α-FeOOH content. Hedenstedt et al. [27] investigated the kinetics of the hydrogen evolution reaction for α-FeOOH and γ-FeOOH. The results show that the corrosion potential of α-FeOOH is more positive than that of γ-FeOOH. Thus, it can be considered that the corrosion potential shifted positively with the increase in the Cu content. This suggests that the corrosion resistance of the rust is enhanced as the Cu content of the 1%Ni WS increases. It can be seen from the polarization curve that increasing the Cu content in the 1%Ni WS is beneficial to improving the corrosion resistance of corrosion products.
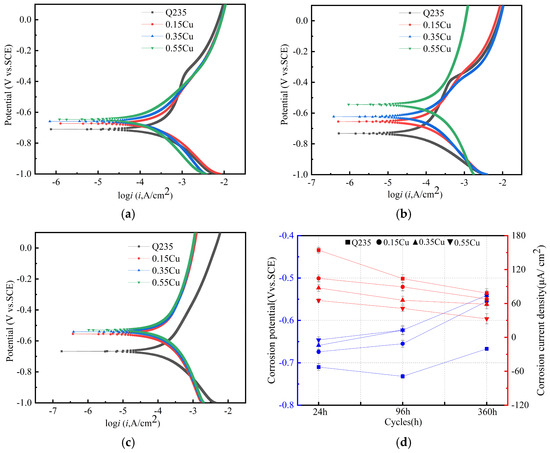
Figure 8.
The Tafel plots of the four test samples in the simulated containing NaCl atmospheric environment. (a) After 24 h; (b) after 96 h; (c) after 360 h; (d) Tafel parameter.
Table 3.
Tafel curve parameters with the four test samples.
In order to further evaluate the electrochemical mechanism of the rust layer, the EIS was carried out, as shown in Figure 9. The figure shows that the Nyquist diagram consists of two incomplete semi-arcs, namely the capacious reactance arc in the high-frequency region and the diffusion mass transfer arc in the low-frequency region. With the continuation of the corrosion process, the arc radii of the four test samples increased gradually, and in the different corrosion stages, the arc radii of the test steels with more Cu content were greater than those of the test steels with less Cu content. The above results show that with the extension of corrosion time, the charge transfer resistance of the rust layer of the WS increased continuously, and the corrosion resistance of the product layer increased continuously. The test steel containing Cu, especially the 0.55Cu WS, has more obvious improvement in the densification degree and corrosion resistance of the corrosion product layer. Figure 9(a2–c2,a3–c3) show the Bode diagrams of the four test samples with different corrosion periods, which are mainly composed of impedance mode diagrams and phase angle diagrams. Due to the porosity, mass transfer, and relaxation effects in the corrosion products, the maximum phase angle measured was less than 90°, which is not an ideal capacitor [21,28].

Figure 9.
The EIS plot of the four test samples in the simulated containing NaCl atmospheric environment. (a1–d1) Nyquist plots; (a2–d2,a3–d3) Bode plots for the different corrosion time periods. (a) Q235; (b) 0.15Cu; (c) 0.35Cu; (d) 0.55Cu.
Based on the EIS test results, a fitting equivalent circuit diagram of the electrochemical impedance spectrum was proposed, as shown in Figure 10. Qrust and Rrust represent the constant phase components and resistors of the rust layer, respectively. Rs, Qdl, Rct, and W1 represent the solution resistance, constant phase element of the double-layer capacitor, charge transfer resistance, and the Warburg impedance, respectively [29]. The Warburg impedance is always recognized as the diffusion of dissolved O2 for the process of mass transport which meaning to equipment the phase compositions of the rust layer. This phenomenon has been extensively researched on the generation of rust layer for WS, where the mass transport of the rust layer is restricted by the diffusion of oxidation products. Hence, it is reasonable for a straight line to appear with a slope approaching 1 in the low-frequency area due to limitations in the diffusion of oxidation products [21]. The smaller value of W1 indicates the rust layer is equipped with an excellent phase composition.
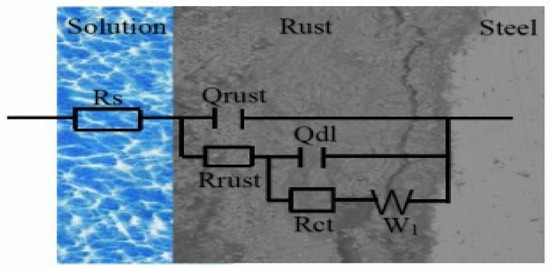
Figure 10.
Electrochemical equivalent circuits used to fit the measured EIS data of the rust layer.
The corrosion parameters obtained from the EIS for the rust layers in different corrosion periods are shown in Table 4, and the fitting errors were less than 10−4. RS refers to the physical impedance in addition to the reaction impedance in the entire test system, including the impedance of the electrolytic cell system, the contact impedance generated by the connection with the electrochemical workstation, the impedance of the wire, etc. Hence, the changes of Rs may be caused by the change in the number of ions in the solution. Because the surface of the rust layer is uneven and rough and porous, the double electric layer capacitor cannot become an ideal capacitor element. Therefore, the constant phase components Qrust and Qdl are used to represent the double electric layer capacitor, which usually represents the surface roughness of the corrosion system, mainly due to the uneven surface caused by the corrosion products generated by the complex electrochemical corrosion reaction. The N value, which represents the phase shift, characterizes different surface phenomena, such as surface heterogeneity resulting from surface roughness, dissolution of the metal, impurities, distribution of the active sites, inhibitor adsorption or porous layer formation. As shown in Table 4, the n values are all less than 1, which demonstrates that the rust layer is very heterogeneous. It is clear that both Rrust and Rct increased with the longer corrosion time, revealing that the resistances of the corrosion product films (barrier properties) to the charge transfer were enhanced, and the resistance of the rust layer was increased. This indicates that the corrosion resistance of the rust layer was improved, which hinders the invasion of the corrosion ions [7]. The values of Rct and Rrust of the Cu-containing WS were higher than that of Q235. The results show that Cu can improve the resistance of the corrosion product film and the charge transfer resistance of 1%Ni WS.
Table 4.
The fitting results of the EIS curves of the four test samples after different corrosion cycles.
4. Discussion
Refs. [4,5] reported that Ni can effectively improve corrosion resistance in the marine atmospheric environment when the content of Ni is greater than 3%. Ni reacts with H2O and O2 in the air to form Ni(OH)2. A part of Ni(OH)2 is hydrolyzed to form NiO, and another part of Ni replaces Fe2+ in Fe3O4 to form NiFe2O4, as shown in Figure 11. Nickel ferrate is a substance that promotes the spontaneous conversion of γ-FeOOH to a stable phase of α-FeOOH at the nanoscale. The chemical reactions involved are as follows [30]:
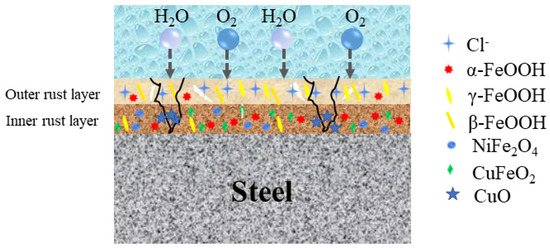
Figure 11.
Schematic diagram of corrosion mechanism of 1%Ni WS containing Cu.
Some researchers have shown that Ni2+ can replace Fe2+ in the Fe3O4 octahedral structure to form a NiFe2O4 phase [31]. It provides many sites for the nucleation of γ-FeOOH and α-FeOOH, promotes the spontaneous conversion of γ-FeOOH to the nanoscale α-FeOOH stable phase, and can form an electronegative rust layer inside the corrosion product layer to prevent the intrusion of Cl−, thus improving the corrosion resistance of WS. Therefore, the addition of Ni to WS could have stronger corrosion resistance than ordinary weathering steel in the marine atmosphere environment. Considering the cost factor, this method could appropriately reduce the content of Ni, but the corrosion resistance of the WS does not satisfy the requirements in the marine atmospheric environment.
The above experimental results show that it is feasible to add Cu to 1%Ni WS to enhance its corrosion resistance in the containing NaCl atmospheric environment. The morphology results of the corrosion products confirm that the addition of Cu effectively reduced the diameters of the holes and cracks, indicating that Cu could repair the rust layer, as shown in Figure 3. As refs. [24,32] reported, the Cu reacts with H2O and O2 in the air to form Cu(OH)2. A part of Cu(OH)2 is hydrolyzed to form CuO. The generation of CuO plays a key role in improving the corrosion resistance of WS. The Schematic diagram of corrosion mechanism of 1%Ni WS containing Cu is shown in Fig.11. Firstly, it is deposited in the holes and cracks, making the rust layer more compact and uniform, which could impel the entrance of the corrosion particles to form a physical barrier. Additionally, the CuO provides nucleation sites for amorphous oxyhydroxide to promote nano-sized oxyhydroxide network, which not only traps the corrosion particles, but also facilitates the formation of α-FeOOH, leading to the rust layer forming a physical barrier with a protective ability.
In addition, as shown in Figure 1, the higher the Cu content is, the lower the corrosion weight loss. In the later corrosion stages, parts of the initial corrosion products (FeOOH) transform into Fe3O4. Meanwhile, the content of Fe3O4 is relatively reduced under the conditions of high Cu content, which indicates that Cu reacts with Fe3O4. As ref. [32] indicated, the higher Cu content could be attributed to the formation of CuFeO2, which is generated by one Cu+ replacing one Fe3+ in the spinel oxide Fe3O4. The formation of CuFeO2 plays a similar role as NiFe2O4 in the rust layer of WS. The CuFeO2 gives the rust layer an electronegative layer, and then impels the Cl− to close to the WS. Moreover, the Gibbs free energy of CuFeO2 (−479,900 J/mol) is higher than that of Fe3O4 (−101,545 J/mol), which means that CuFeO2 is more thermodynamically stable than Fe3O4 [33,34]. Hence, a Cu addition could promote the formation of CuFeO2, causing the rust layer to form a chemical barrier and impelling the Cl− to close the WS, thus enhancing the corrosion resistance of the WS. Overall, adding a small amount of Cu can make up for a lack of corrosion resistance due to the reduction in Ni content. A rust layer could form with physical and chemical barriers to enhance the corrosion resistance in the marine atmospheric environment.
5. Conclusions
The addition of Cu to 1%Ni WS effectively improves the densification and stability of the rust layer, and the corrosion rate decreases with an increase in Cu content. The 0.55Cu WS showed better corrosion resistance in a simulated containing NaCl atmosphere. The conclusions are as follows:
- (1)
- An increasing Cu content promotes the formation of a stable and compact rust layer, significantly enriching the proportion of α-FeOOH to equip the rust layer with a physical barrier.
- (2)
- The formation of CuO deposits in the holes and cracks make the rust layer more compact and uniform. This provides nucleation sites for amorphous oxyhydroxide to promote a nano-sized oxyhydroxide network, which not only traps the corrosion particles but also facilitates the formation of α-FeOOH, leading to the rust layer forming a physical barrier with a protective ability.
- (3)
- Cu promotes the formation of CuFeO2, and the content of NiFe2O4 increases with an increase in Cu content. The formation of CuFeO2 and NiFe2O4 equips the rust layer with a chemical barrier.
Author Contributions
Conceptualization, Q.W.; methodology, Q.W. and C.H.; software, Q.Y. and M.Q.; validation, S.W.; formal analysis, S.W.; investigation, Q.Y. and M.Q.; resources, Q.W.; data curation, Q.Y. and M.Q.; writing—original draft preparation, Q.W. and C.H.; writing—review and editing, Q.W. and C.H.; visualization, Q.W. and M.Q.; supervision, Q.W.; project administration, Q.W. All authors have read and agreed to the published version of the manuscript.
Funding
The authors gratefully acknowledge the financial support from the Development Program between Nanjing Iron & Steel Co., Ltd. and Yanshan University (Grant No. IG A B21090004), the Cangzhou Natural Science Foundation (Grant No. 221001012D), and the Scientific Research and Innovation Project of Cangzhou Normal University (Grant No. cxtdl2301).
Data Availability Statement
The original contributions presented in the study are included in the article, further inquiries can be directed to the corresponding author.
Conflicts of Interest
Author Mingliang Qiao was employed by Nanjing Iron & Steel Co., Ltd. The remaining authors declare that the research was conducted in the absence of any commercial or financial relationships that could be construed as a potential conflict of interest. Besides, the authors declare that this study received funding from Nanjing Iron & Steel Co., Ltd. The funder was not involved in the study design, collection, analysis, interpretation of data, the writing of this article or the decision to submit it for publication.
References
- Jia, J.; Cheng, X.; Yang, X.; Li, X.; Li, W. A study for corrosion behavior of a new-type weathering steel used in harsh marine environment. Constr. Build. Mater. 2020, 259, 119760. [Google Scholar] [CrossRef]
- Morcillo, M.; Chico, B.; Diaz, I.; Cano, H.; Fuente, D.D.L. Atmospheric corrosion data of weathering steels. A review. Corros. Sci. 2013, 77, 6–24. [Google Scholar] [CrossRef]
- Wu, W.; Cheng, X.; Zhao, J.; Li, X. Benefit of the corrosion product film formed on a new weathering steel containing 3% nickel under marine atmosphere in Maldives. Corros. Sci. 2019, 165, 108416. [Google Scholar] [CrossRef]
- Zhang, B.; Liu, W.; Sun, Y.; Yang, W.; Chen, L.; Xie, J.; Li, W. Corrosion behavior of the 3 wt.% Ni weathering steel with replacing 1 wt.% Cr in the simulated tropical marine atmospheric environment. J. Phys. Chem. Solids 2023, 175, 111221. [Google Scholar] [CrossRef]
- Diaz, I.; Cano, H.; Fuente, D.D.L.; Chico, B.; Vega, J.M.; Morcillo, M. Atmospheric corrosion of Ni-advanced weathering steels in marine atmospheres of moderate salinity. Corros. Sci. 2013, 76, 348–360. [Google Scholar] [CrossRef]
- Sun, Y.; Liu, W.; Dong, B.; Zhang, T.; Chen, L.; Yang, W.; Li, H.; Zhang, B.; Xie, J.; Cui, J. Designing weathering steel with optimized Mo/Ni ratios for better corrosion resistance in simulated tropical marine atmosphere. Met. Mater. Int. 2024, 30, 909–927. [Google Scholar] [CrossRef]
- Yu, Q.; Yang, X.; Dong, W.; Wang, Q.; Zhang, F.; Gu, X. Layer-by-layer investigation of the multilayer corrosion products for different Ni content weathering steel via a novel Pull-off testing. Corros. Sci. 2021, 195, 109988. [Google Scholar] [CrossRef]
- Jia, J.; Liu, Z.; Cheng, X.; Du, C.; Li, X. Development and optimization of Ni-advanced weathering steel: A review. Corros. Commun. 2021, 2, 82–90. [Google Scholar] [CrossRef]
- Cheng, X.; Jin, Z.; Liu, M.; Li, X. Optimizing the nickel content in weathering steels to enhance their corrosion resistance in acidic atmospheres. Corros. Sci. 2017, 115, 135–142. [Google Scholar] [CrossRef]
- Cheng, X.Q.; Tian, Y.W.; Li, X.G.; Zhou, C. Corrosion behavior of nickel-containing weathering steel in simulated marine atmospheric environment. Mater. Corros. 2014, 65, 1033–1037. [Google Scholar] [CrossRef]
- Xu, X.; Zhang, T.; Wu, W.; Jiang, S.; Yang, J.; Liu, Z. Optimizing the resistance of Ni-advanced weathering steel to marine atmospheric corrosion with the addition of Al or Mo. Constr. Build. Mater. 2021, 279, 122341. [Google Scholar] [CrossRef]
- Boyd, W.K.; Fink, F.W. Corrosion of Metals in the Atmosphere; Metals and Ceramics Information Center: Watertown, MA, USA, 1974. [Google Scholar]
- Cano, H.; Díaz, I.; Fuente, D.D.L.; Chico, B.; Morcillo, M. Effect of Cu, Cr and Ni alloying elements on mechanical properties and atmospheric corrosion resistance of weathering steels in marine atmospheres of different aggressivities. Mater. Corros. 2018, 69, 8–19. [Google Scholar] [CrossRef]
- Hao, L.; Zhang, S.; Dong, J.; Ke, W. Evolution of corrosion of MnCuP weathering steel submitted to wet/dry cyclic tests in a simulated coastal atmosphere. Corros. Sci. 2012, 58, 175–180. [Google Scholar] [CrossRef]
- Kimura, M.; Kihira, H.; Ohta, N.; Hashimoto, M.; Senuma, T. Control of Fe(O,OH)6 nano-network structures of rust for high atmospheric-corrosion resistance. Corros. Sci. 2005, 47, 2499–2509. [Google Scholar] [CrossRef]
- Carius, C. Knowledge of the corrosion process of copper-bearing steels. Z. Met. 1930, 22, 337–341. [Google Scholar]
- TB/T 2375-1993 (1993); Test Method for Periodic Immersion Corrosion of Weathering Steels for Railway. Ministry of Railways: Beijing, China, 1993.
- Liu, H.; Huang, F.; Yuan, W.; Hu, Q.; Liu, J.; Cheng, Y.F. Essential role of element Si in corrosion resistance of a bridge steel in chloride atmosphere. Corros. Sci. 2020, 173, 108758. [Google Scholar] [CrossRef]
- Wang, B.; Liu, L.; Cheng, X.; Wu, W.; Liu, C.; Zhang, D.; Li, X. Advanced multi-image segmentation-based machine learning modeling strategy for corrosion prediction and rust layer performance evaluation of weathering steel. Corros. Sci. 2024, 237, 112334. [Google Scholar] [CrossRef]
- Antunes, R.A.; Costa, I.; Faria, D.L.A.D. Characterization of corrosion products formed on steels in the first months of atmospheric exposure. Mater. Res. 2003, 6, 403–408. [Google Scholar] [CrossRef]
- Yu, Q.; Dong, W.; Yang, X.; Wang, Q.; Zhang, F. Insights into the corrosion mechanism and electrochemical properties of the rust layer evolution for weathering steel with various Cl− deposition in the simulated atmosphere. Mater. Res. Express 2021, 8, 036515. [Google Scholar] [CrossRef]
- Kamimura, T.; Hara, S.; Miyuki, H.; Yamashita, M.; Uchida, H. Composition and protective ability of rust layer formed on weathering steel exposed to various environments. Corros. Sci. 2006, 48, 2799–2812. [Google Scholar] [CrossRef]
- Cano, H.; Neff, D.; Morcillo, M.; Dillmann, P.; Diaz, I.; de La Fuente, D. Characterization of corrosion products formed on Ni 2.4 wt%–Cu 0.5 wt%–Cr 0.5 wt% weathering steel exposed in marine atmospheres. Corros. Sci. 2014, 87, 438–451. [Google Scholar] [CrossRef]
- Zhang, T.; Liu, W.; Chen, L.; Dong, B.; Yang, W.; Fan, Y.; Zhao, Y. On how the corrosion behavior and the functions of Cu, Ni and Mo of the weathering steel in environments with different NaCl concentrations. Corros. Sci. 2021, 192, 109851. [Google Scholar] [CrossRef]
- Mansfeld, F. Tafel slopes and corrosion rates obtained in the pre-Tafel region of polarization curves. Corros. Sci. 2005, 47, 3178–3186. [Google Scholar] [CrossRef]
- Mccafferty, E. Validation of corrosion rates measured by the Tafel extrapolation method. Corros. Sci. 2005, 47, 3202–3215. [Google Scholar] [CrossRef]
- Hedenstedt, K.; Simic, N.; Wildlock, M.; Ahlberg, E. Kinetic study of the hydrogen evolution reaction in slightly alkaline electrolyte on mild steel, goethite and lepidocrocite. J. Electroanal. Chem. 2016, 783, 1–7. [Google Scholar] [CrossRef]
- Yu, Q.; Dong, W.; Yang, X.; Wang, Q.; Zhang, F. The Role of the Direct Current Electric Field in Enhancing the Protective Rust Layer of Weathering Steel. J. Mater. Eng. Perform. 2021, 30, 6309–6322. [Google Scholar] [CrossRef]
- Chen, Z.; Yu, Q.; Zhao, L.; Zhang, C.; Gu, M.; Wang, Q.; Wang, G. Insight into the role of Si on corrosion resistance of weathering steel in a simulated industrial atmosphere. J. Mater. Res. Technol. 2023, 26, 487–503. [Google Scholar] [CrossRef]
- Jia, J.; Wu, W.; Cheng, X.; Zhao, J. Ni-advanced weathering steels in Maldives for two years: Corrosion results of tropical marine field test. Constr. Build. Mater. 2020, 245, 118463. [Google Scholar] [CrossRef]
- Wu, W.; Cheng, X.; Hou, H.; Liu, B.; Li, X. Insight into the product film formed on Ni-advanced weathering steel in a tropical marine atmosphere. Appl. Surf. Sci. 2018, 436, 80–89. [Google Scholar] [CrossRef]
- Wu, W.; Dai, Z.; Liu, Z.; Liu, C.; Li, X. Synergy of Cu and Sb to enhance the resistance of 3%Ni weathering steel to marine atmospheric corrosion. Corros. Sci. 2021, 183, 109353. [Google Scholar] [CrossRef]
- Hao, L.; Zhang, S.; Dong, J.; Ke, W. Atmospheric corrosion resistance of MnCuP weathering steel in simulated environments. Corros. Sci. 2011, 53, 4187–4192. [Google Scholar] [CrossRef]
- Wagman, D.D.; Evans, W.H.; Parker, V.B.; Schumm, R.H.; Nuttall, R.L. The NBS Tables of Chemical Thermodynamic Properties. J. Phys. Chem. Ref. Data 1982, 11. [Google Scholar] [CrossRef]
Disclaimer/Publisher’s Note: The statements, opinions and data contained in all publications are solely those of the individual author(s) and contributor(s) and not of MDPI and/or the editor(s). MDPI and/or the editor(s) disclaim responsibility for any injury to people or property resulting from any ideas, methods, instructions or products referred to in the content. |
© 2024 by the authors. Licensee MDPI, Basel, Switzerland. This article is an open access article distributed under the terms and conditions of the Creative Commons Attribution (CC BY) license (https://creativecommons.org/licenses/by/4.0/).