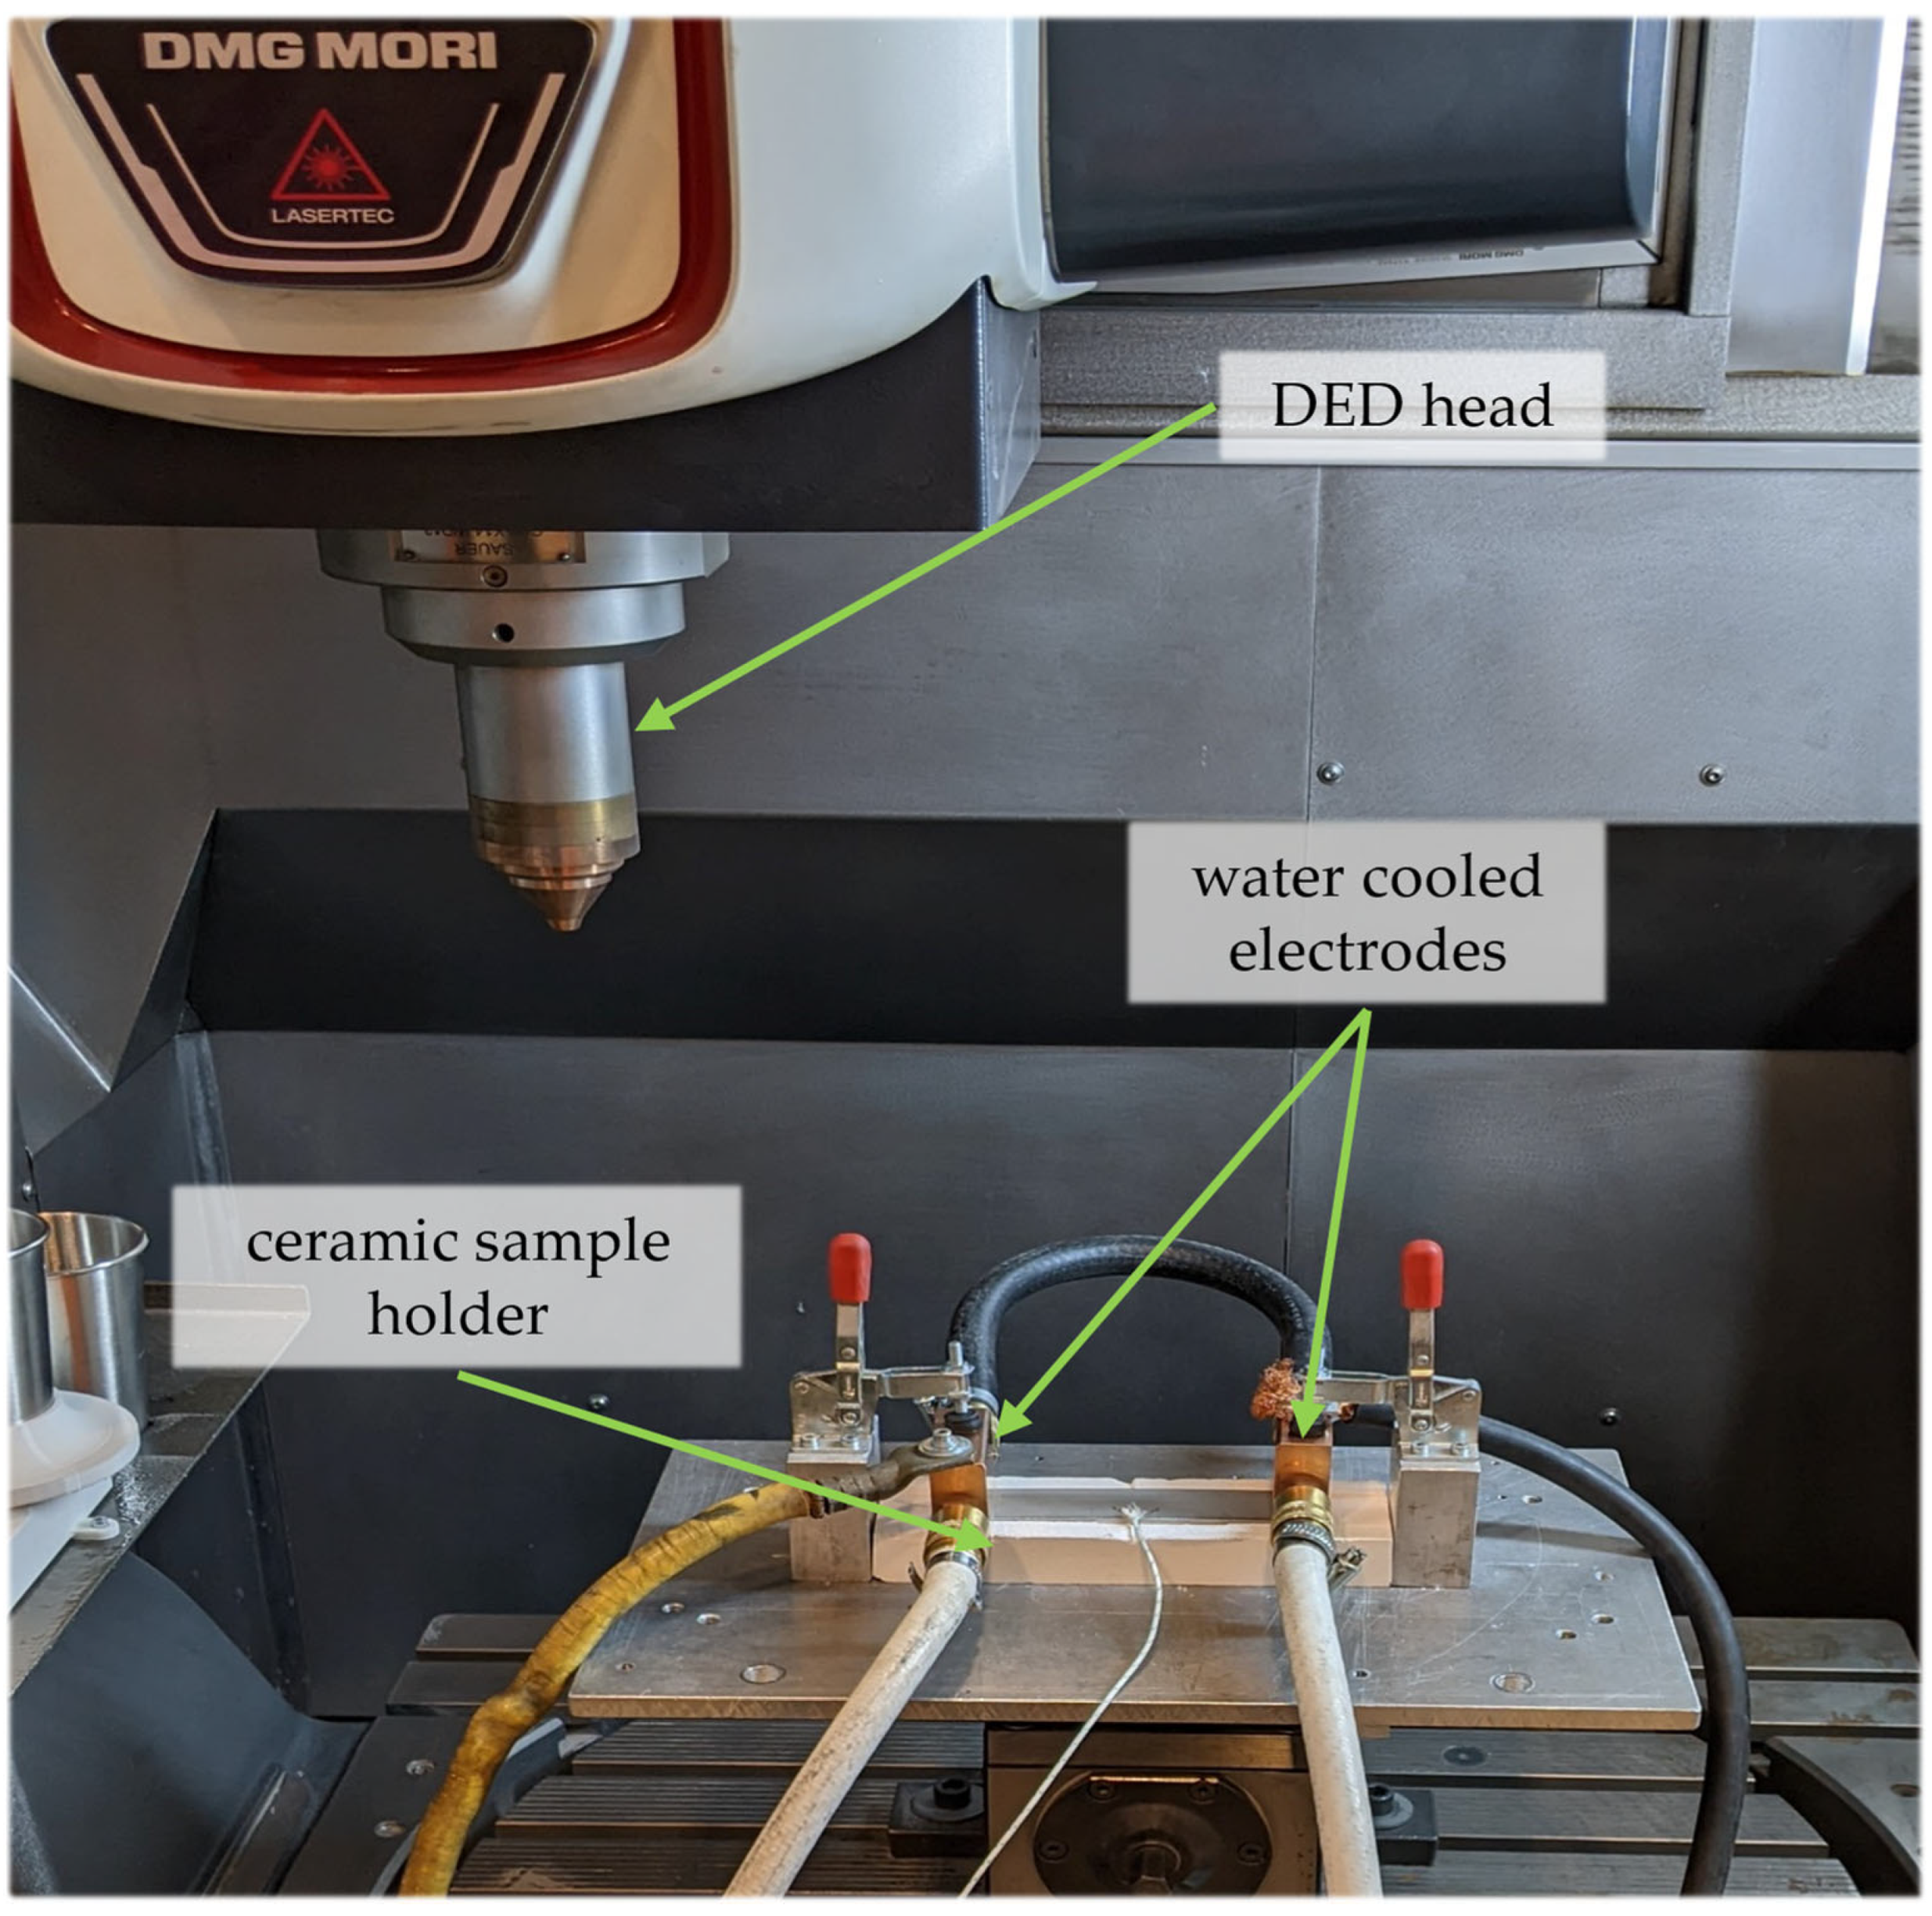
1. Introduction
In the rapidly evolving field of additive manufacturing (AM), optimizing process parameters is essential for producing components with the required structural integrity and functional performance [
1,
2]. AM technologies allow for the creation of complex geometries layer by layer, making them suitable for industries, such as aerospace, automotive, and tooling [
3,
4]. Among these technologies, Directed Energy Deposition (DED) has gained significant attention due to its versatility in fabricating new parts, repairing high-value components, and producing functionally graded materials [
5,
6]. While electron beam-based DED can provide high energy for certain applications, it requires a vacuum environment, which is generally impractical for most robotized cells due to the added complexity and equipment cost. DED processes are broadly classified based on the energy source used—such as laser (DED-LB), electron beam, or plasma arc—and the form of material, either powder or wire. Each DED process family offers unique advantages depending on the application requirements and operational environment. This paper focuses on powder-based DED-LB, which, despite some drawbacks, offers a competitive advantage in terms of precision and the surface finish as shown in
Figure 1. Powder DED-LB systems are particularly advantageous for applications requiring high control over deposition rates and intricate geometries due to the focused laser energy. Although powder-based systems may have limitations regarding material utilization and cost, their ability to produce fine, detailed structures makes them suitable for high-value applications in aerospace, automotive, and medical fields, where accuracy and complex geometries are critical [
7,
8,
9].
Recent advances in DED-LB process optimization have focused on critical parameters, such as the laser power, powder feed rate, traverse speed (feed rate), contact angle, and substrate temperature [
10,
11,
12]. These factors play crucial roles in determining bead track geometry and ultimately the quality of the final component [
13,
14,
15]. For instance, laser power governs the melt pool dimensions and energy input, directly influencing the bead depth and width. Research shows that increasing the laser power, typically in the range of 500 W to 3000 W, can enhance the penetration depth, but excessive power can result in keyholing or vaporization if not balanced with other factors [
16,
17]. Similarly, the feed rate, which controls the deposition speed, affects layer formation, with slower feed rates (e.g., 200 mm/min to 1200 mm/min) resulting in wider and deeper bead pools, but also increasing the heat-affected zone (HAZ) [
18]. Higher feed rates can reduce bonding strength by limiting the energy input, potentially leading to insufficient fusion.
The contact angle also plays a significant role in ensuring proper interlayer fusion and minimizing defects, like porosity or cracking. Maintaining contact angles between 120° and 140° has been shown to promote strong interlayer bonding, whereas deviations can lead to poor adhesion and structural weakness [
19,
20]. The substrate temperature, another critical factor, influences the cooling rate and thermal gradients, which affect residual stress and the microstructure. Preheating the substrate to temperatures between 200 °C and 800 °C has been found to reduce thermal stresses and improve metallurgical bonding between layers, though excessively high temperatures can lead to undesirable microstructural changes [
11].
In addition to these key parameters, the powder flow rate, laser spot size, and scanning pattern are known to impact DED-LB outcomes [
21]. For instance, the powder flow rate influences the deposition efficiency and layer homogeneity, with excessive flow rates causing uneven layers, while too little powder results in weak bonding. The laser spot size affects energy distribution in the melt pool, with larger spots promoting uniform energy input but reducing the resolution. Conversely, smaller spot sizes offer precision but risk localized overheating. The scanning pattern, dictating the laser path, affects the heat distribution and residual stress, with improper patterns leading to warping or distortion.
Although many factors influence DED-LB, in this study, a regression model was formulated based on the laser power, feed rate, contact angle, and substrate temperature, focusing on their direct influence on bead geometry for single bead tracks. These four parameters govern key aspects of the process, such as energy input and layer adhesion, making their optimization critical to achieving dimensional accuracy and high-quality part production. To systematically explore the interactions between these variables, we employed a full factorial Design of Experiments (DoE), which tests all possible combinations of selected parameters and their levels. This approach ensures that both main effects and interaction effects are thoroughly evaluated, providing a comprehensive understanding of how each parameter influences bead geometry [
22,
23]. Following the experiments, the Pearson correlation coefficient was applied to quantify the linear relationships between process variables and bead characteristics. The Pearson correlation coefficient ranges from −1 to 1, with values close to 1 indicating strong positive correlations and values near −1 indicating strong negative correlations. This analysis helped prioritize variables with the most significant impact on bead geometry, guiding further optimization efforts.
By combining full factorial DoE with Pearson correlation analysis, we developed a regression equation for identifying critical factors in DED-LB processes [
24]. This approach helps optimize parameters that influence bead characteristics for improved structural integrity and performance.
3. Results and Discussion
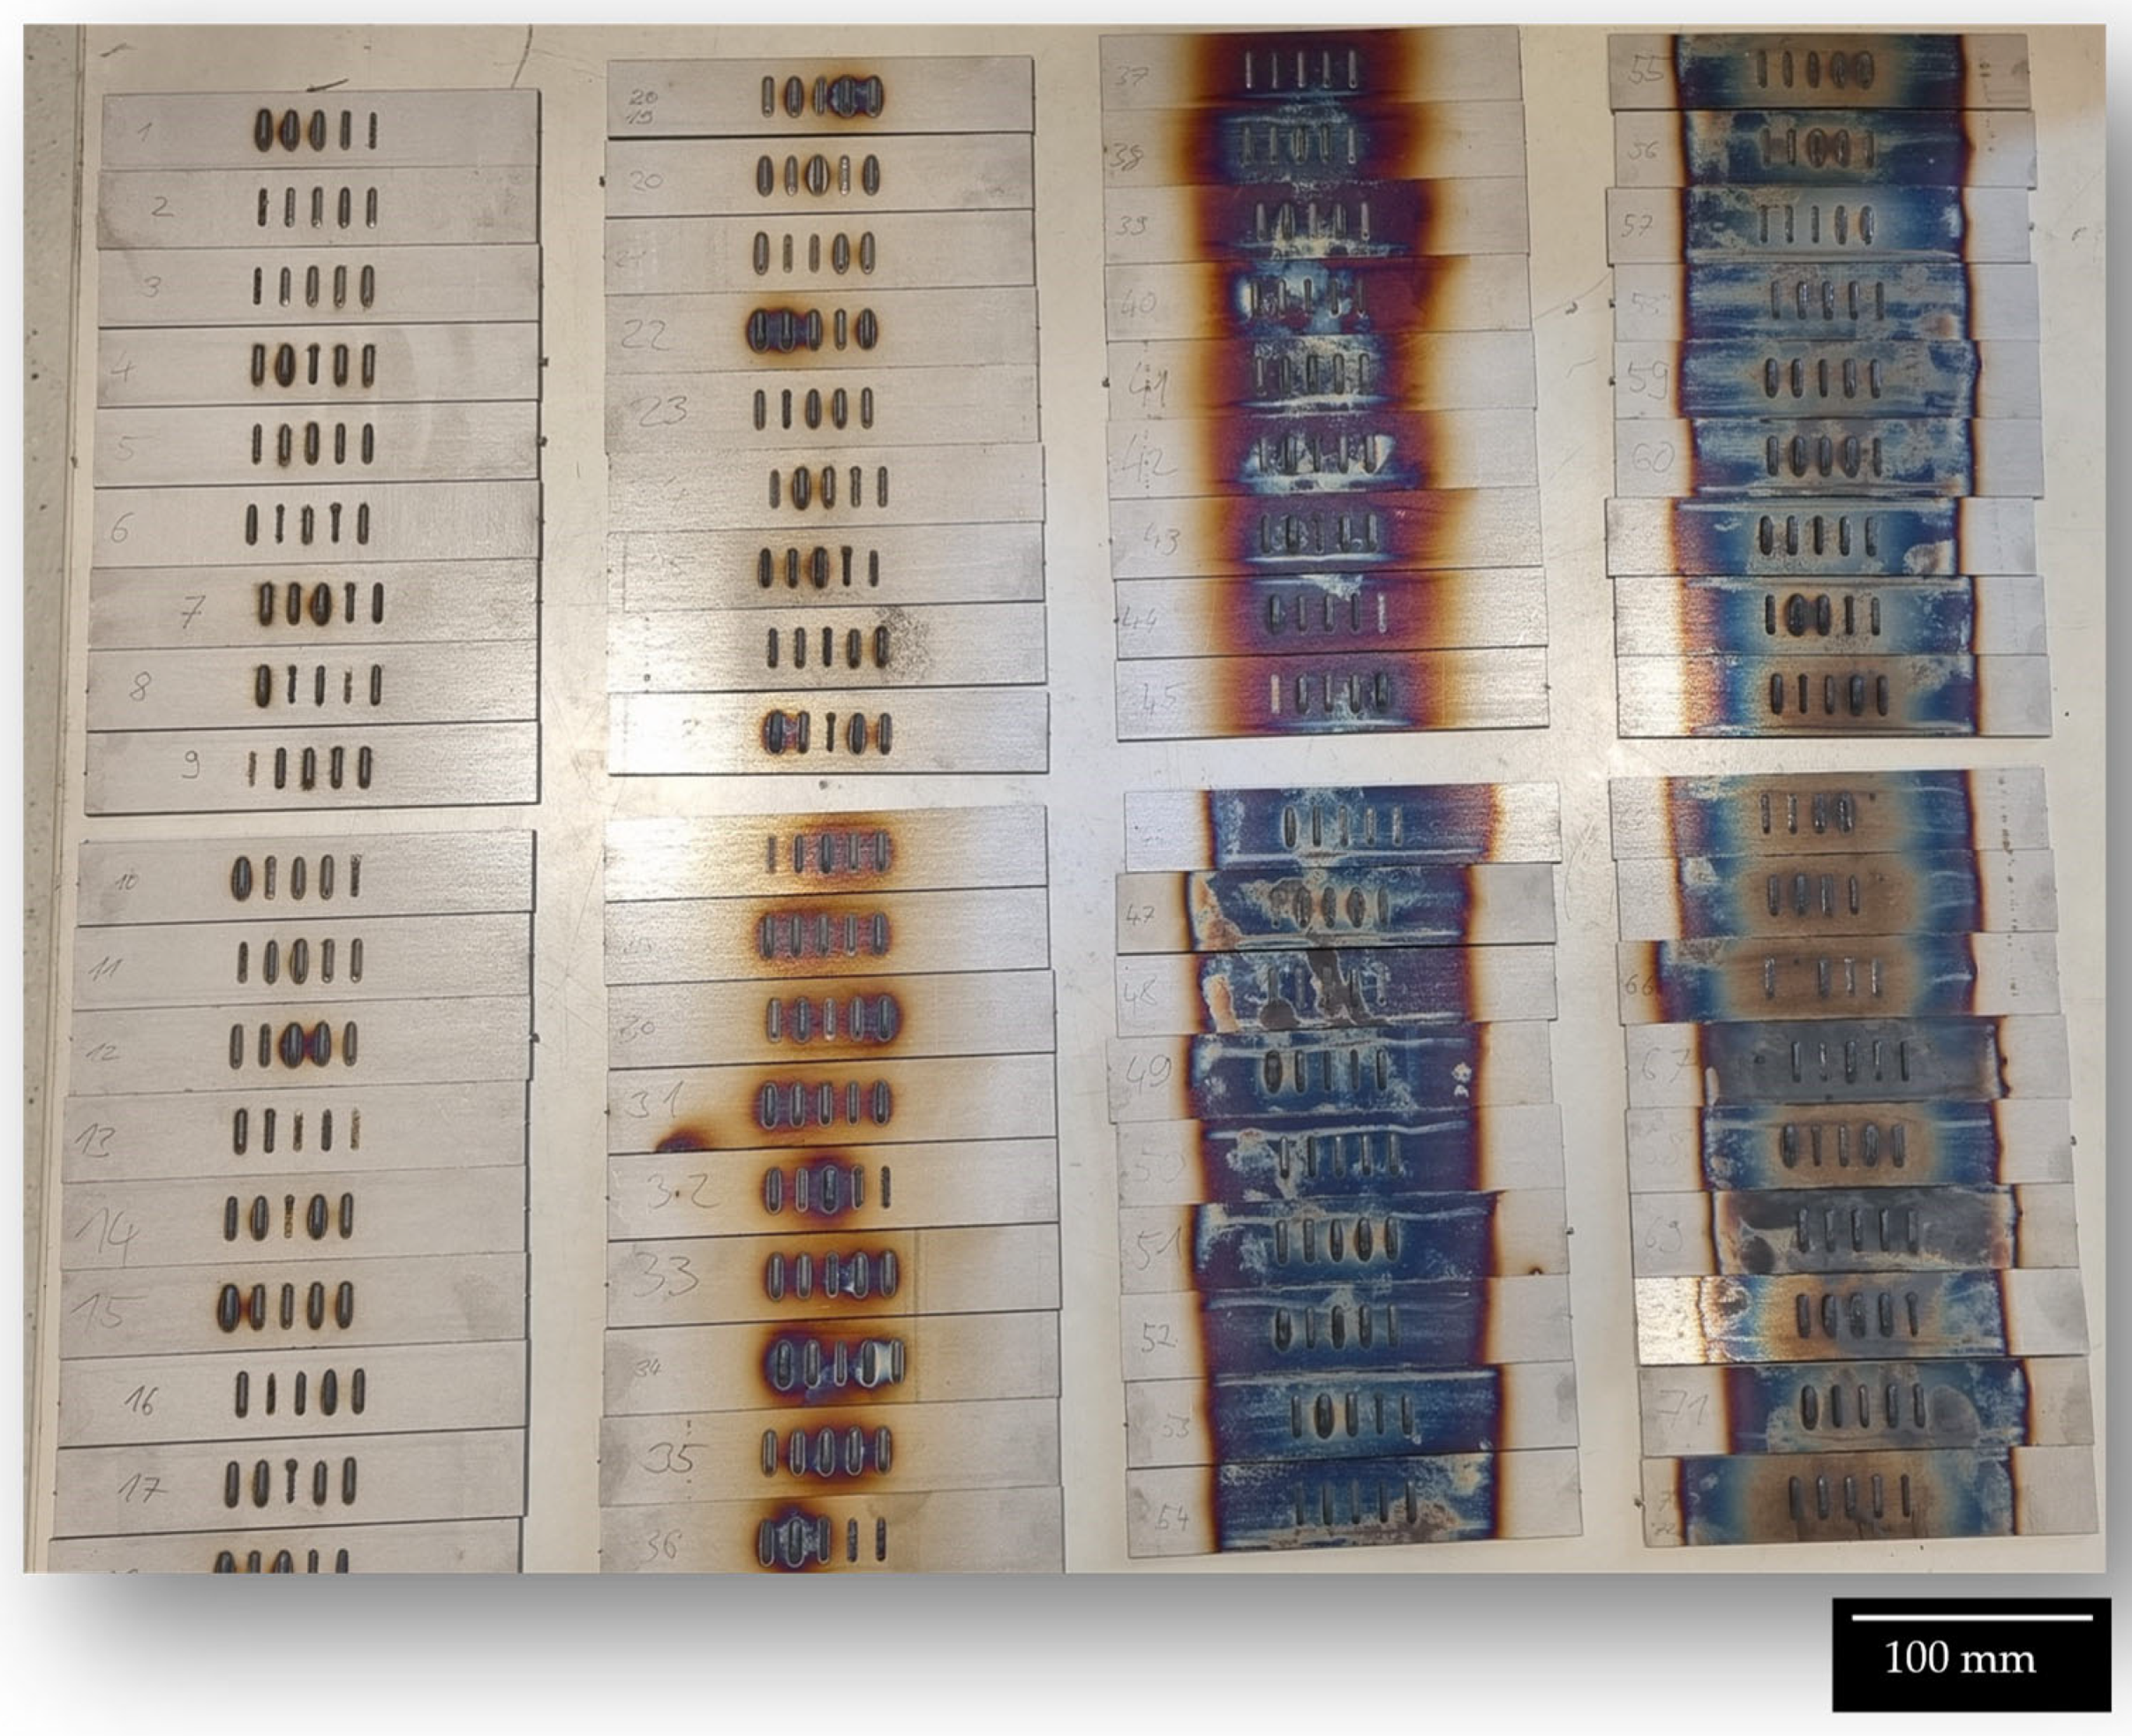
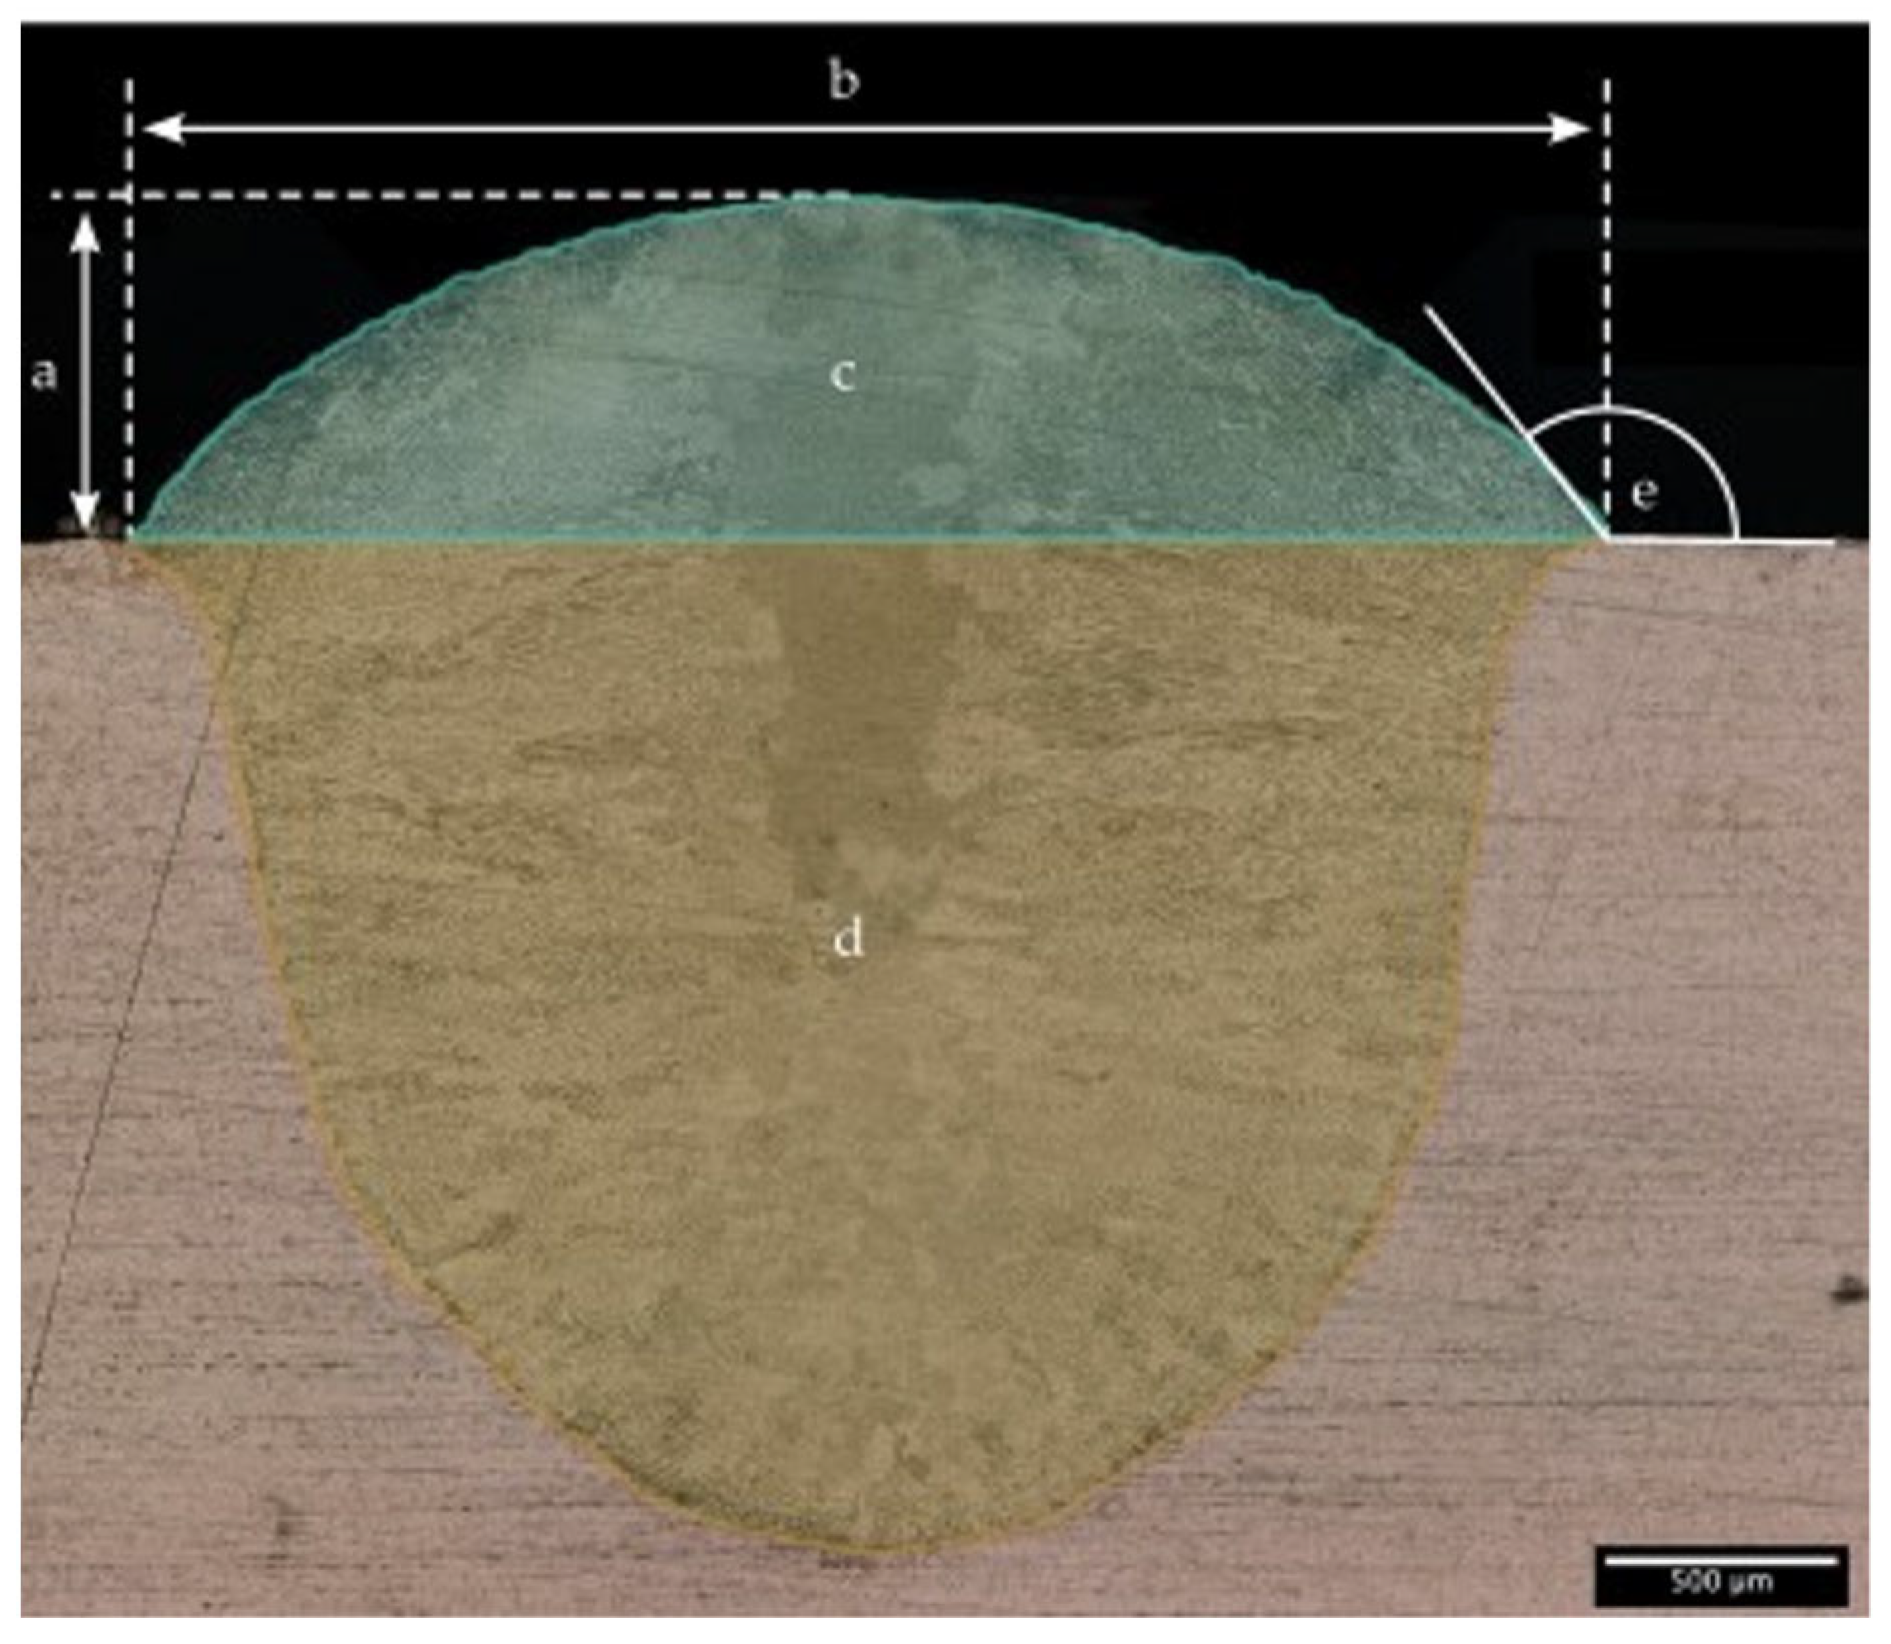
To study the process parameter influence, each bead track was cut, polished, and etched using V2A etching solution. Cross-sectional images were captured using the VHX5000 digital microscope at 200× magnification to measure the bead height, width, dilution, and contact angle. Image analysis and measurements were conducted using Keyence software (Version 1.8.04) to ensure precision in data collection. It should be noted that there can be potential measurement errors from the Keyence VHX5000 digital microscope (KEYENCE DEUTSCHLAND GmbH, Neu-Isenburg, Germany) due to factors, such as magnification variability, calibration inaccuracies, parallax error, user-dependent variability, and environmental influences. These errors could introduce deviations of up to a few micrometers, potentially impacting the precision of bead geometry predictions; however, as the same instrument and settings are consistently applied to all samples, any measurement deviations are likely uniform, ensuring consistent accuracy across the dataset. The data collected were used to create a regression model to predict the machine settings needed to achieve specific bead characteristics. Key measurements included the bead width (b), bead height (a), dilution, and contact angle (e). The contact angle was measured on both sides of the bead and averaged. The dilution was calculated as the ratio of the molten substrate area (d) to the total molten area (c + d), using Equation (1) as shown in
Figure 4. Regression analysis was performed using Minitab 2022 with boundary conditions listed in
Table 4. The contact angle was used to ensure that it remained above 90° to reduce the risk of fusion defects. Although powder mass flow could not be controlled directly, it was used as a predictor in the model to help calculate the required laser power and traverse speed for a given powder mass flow and substrate temperature to achieve the desired bead geometry.
Building on the initial linear regression model, further analysis using quadratic regression was carried out to account for non-linear effects between the process parameters and bead characteristics. This advanced modeling approach allowed us to capture the complex interactions between key variables, such as the bead width, bead height, dilution, substrate temperature, and powder mass flow. The inclusion of quadratic terms helped to better explain the non-linear relationships observed in the data, where the effects of certain parameters exhibited diminishing or accelerating trends at higher levels.
For the feed rate, the quadratic regression model provided a more accurate representation of how the process variables interact. The model Equation (2) reveals that the powder mass flow and dilution have significant non-linear effects on the feed rate, with positive linear effects that taper off at higher values, as indicated by the negative quadratic terms. Despite showing significant effects in the quadratic model, the Pearson correlation analysis indicated no direct linear relationship between the powder mass flow or substrate temperature and the feed rate, as both had a Pearson correlation coefficient of zero (
Table 5). The quadratic terms, however, demonstrated the complex interplay between the bead height and dilution, suggesting optimal ranges for minimizing defects while maintaining the desired feed rate.
As shown in Equation (3), the influence of the dilution was significant, with strong linear and non-linear effects. The quadratic term for the powder mass flow in the model suggested a diminishing effect, but the Pearson correlation analysis revealed no direct linear relationship between the powder mass flow or substrate temperature and laser power, with both having a Pearson correlation coefficient of zero. This indicates that while these variables showed non-linear effects in the model, they are not strong linear predictors of laser power. The analysis instead highlights dilution as a critical factor in determining the required energy input, emphasizing the need for precise control over material deposition to optimize energy consumption during the deposition process. Similarly, for the contact angle, the quadratic model highlights the importance of controlling the bead width, bead height, and dilution to maintain stable bead geometries. The regression model Equation (4) indicated that the dilution had a significant non-linear effect, with increasing values initially reducing the contact angle but eventually reaching a plateau. The Pearson correlation analysis further supported this finding, with the powder mass flow showing the highest correlation with contact angle stability. In contrast, the bead height had no measurable influence on the contact angle, as indicated by a Pearson correlation coefficient of zero. The inclusion of quadratic terms allowed the model to better predict when the contact angle would fall below critical thresholds, ensuring sufficient fusion between the bead layers. Finally, the quadratic regression model for laser power provided insight into the required energy input based on process parameters.
The quadratic regression models developed for the feed rate, contact angle, and laser power highlight the complex interactions between the process parameters. The influence of the substrate temperature on bead geometry was investigated. The relationship between the heat input and substrate temperature is essential, as the substrate temperature affects the cooling rate and thermal gradients, impacting heat input stability and, consequently, bead geometry. This relationship is fundamental for understanding how the substrate temperature influences cladding characteristics. The substrate temperature has a clear influence on key bead characteristics, as demonstrated in
Figure 5. The graphs highlight the relationship between the substrate temperature and the bead width, contact angle, bead height, and dilution. As seen in
Figure 5a, the bead width shows a slight positive linear trend with an increasing substrate temperature. Higher temperatures tend to increase the fluidity (decrease viscosity) of the molten material, allowing it to spread more widely across the substrate, resulting in a gradual increase in the bead width. In contrast,
Figure 5b illustrates that the contact angle decreases with an increasing substrate temperature. As the substrate temperature rises, the molten material wets the surface more effectively, resulting in a smaller contact angle. This behavior is beneficial for achieving strong bonding between layers, as lower contact angles generally lead to better fusion. However, the bead height, as shown in
Figure 5c, appears to remain relatively constant across varying substrate temperatures, likely due to dominant factors, such as the laser power and powder flow, which more directly control the deposition volume. The substrate temperature mainly affects cooling and solidification rates, with a lesser impact on the bead height. The dilution, presented in
Figure 5d, increases with the substrate temperature. Higher temperatures promote the melting of more substrate material, leading to stronger substrate material mixing into the bead pool. This increased dilution enhances bonding but must be controlled to avoid unwanted changes in the microstructure of the bead. In some cases, increased substrate temperatures can alter material wetting behavior and cooling rates, resulting in deviations from predicted values, particularly for the bead width and contact angle. These trends observed in the regression analysis are well captured by the quadratic regression model, which accounts for both linear and non-linear effects of the substrate temperature. Given the importance of the substrate temperature on key bead characteristics, we designed a series of validation experiments to confirm the predictive capability of the regression models.
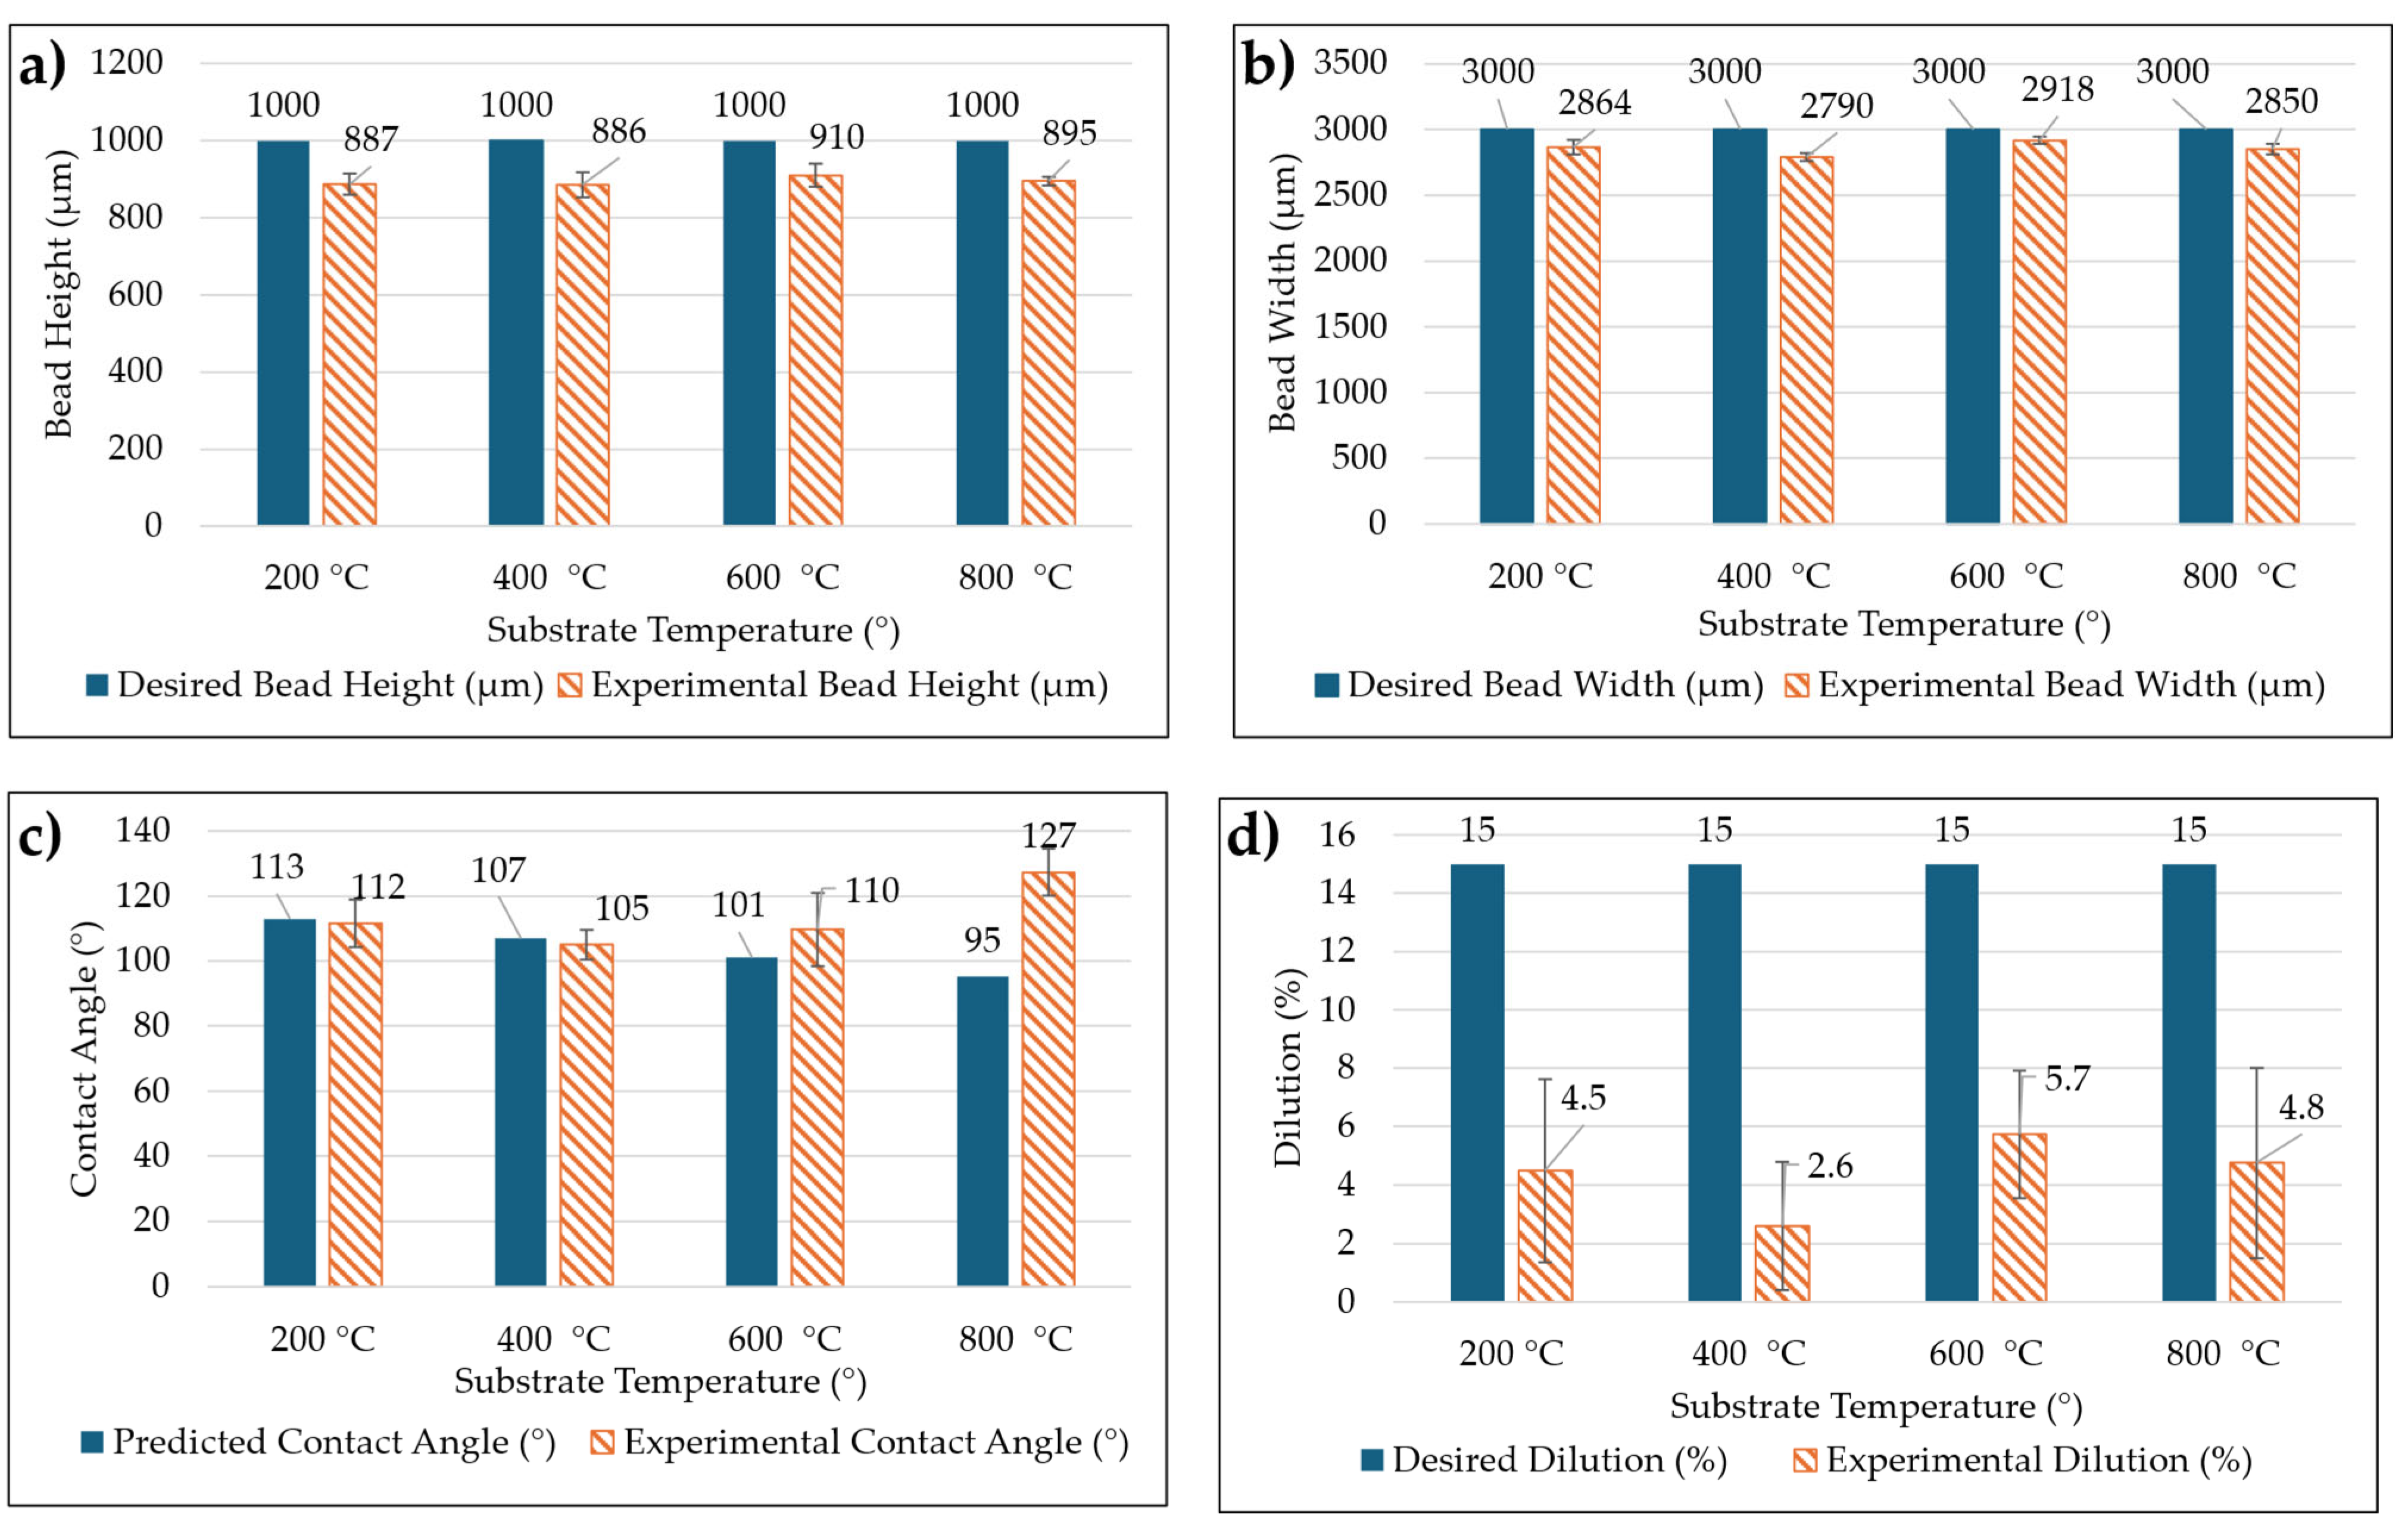
To assess the predictive accuracy of the regression models, the target bead geometry dimensions were inputted into the regression equations to calculate the required process parameters, as shown in
Table 6. The selected target values were 3 mm for the bead width, 1 mm for the bead height, 15% for the dilution, and 15 g/min for the powder mass flow, with substrate temperatures set at room temperature 200 °C, 400 °C, 600 °C, and 800 °C. For each parameter set, three beads were produced using the same experimental setup as described previously to validate the model. The process parameters—primarily the substrate temperature, laser power, feed rate, and powder mass flow—were systematically varied (within 5% of calculated values), and the actual measured results were compared to the predicted values obtained from the regression models, as shown in
Figure 6 and
Figure 7.
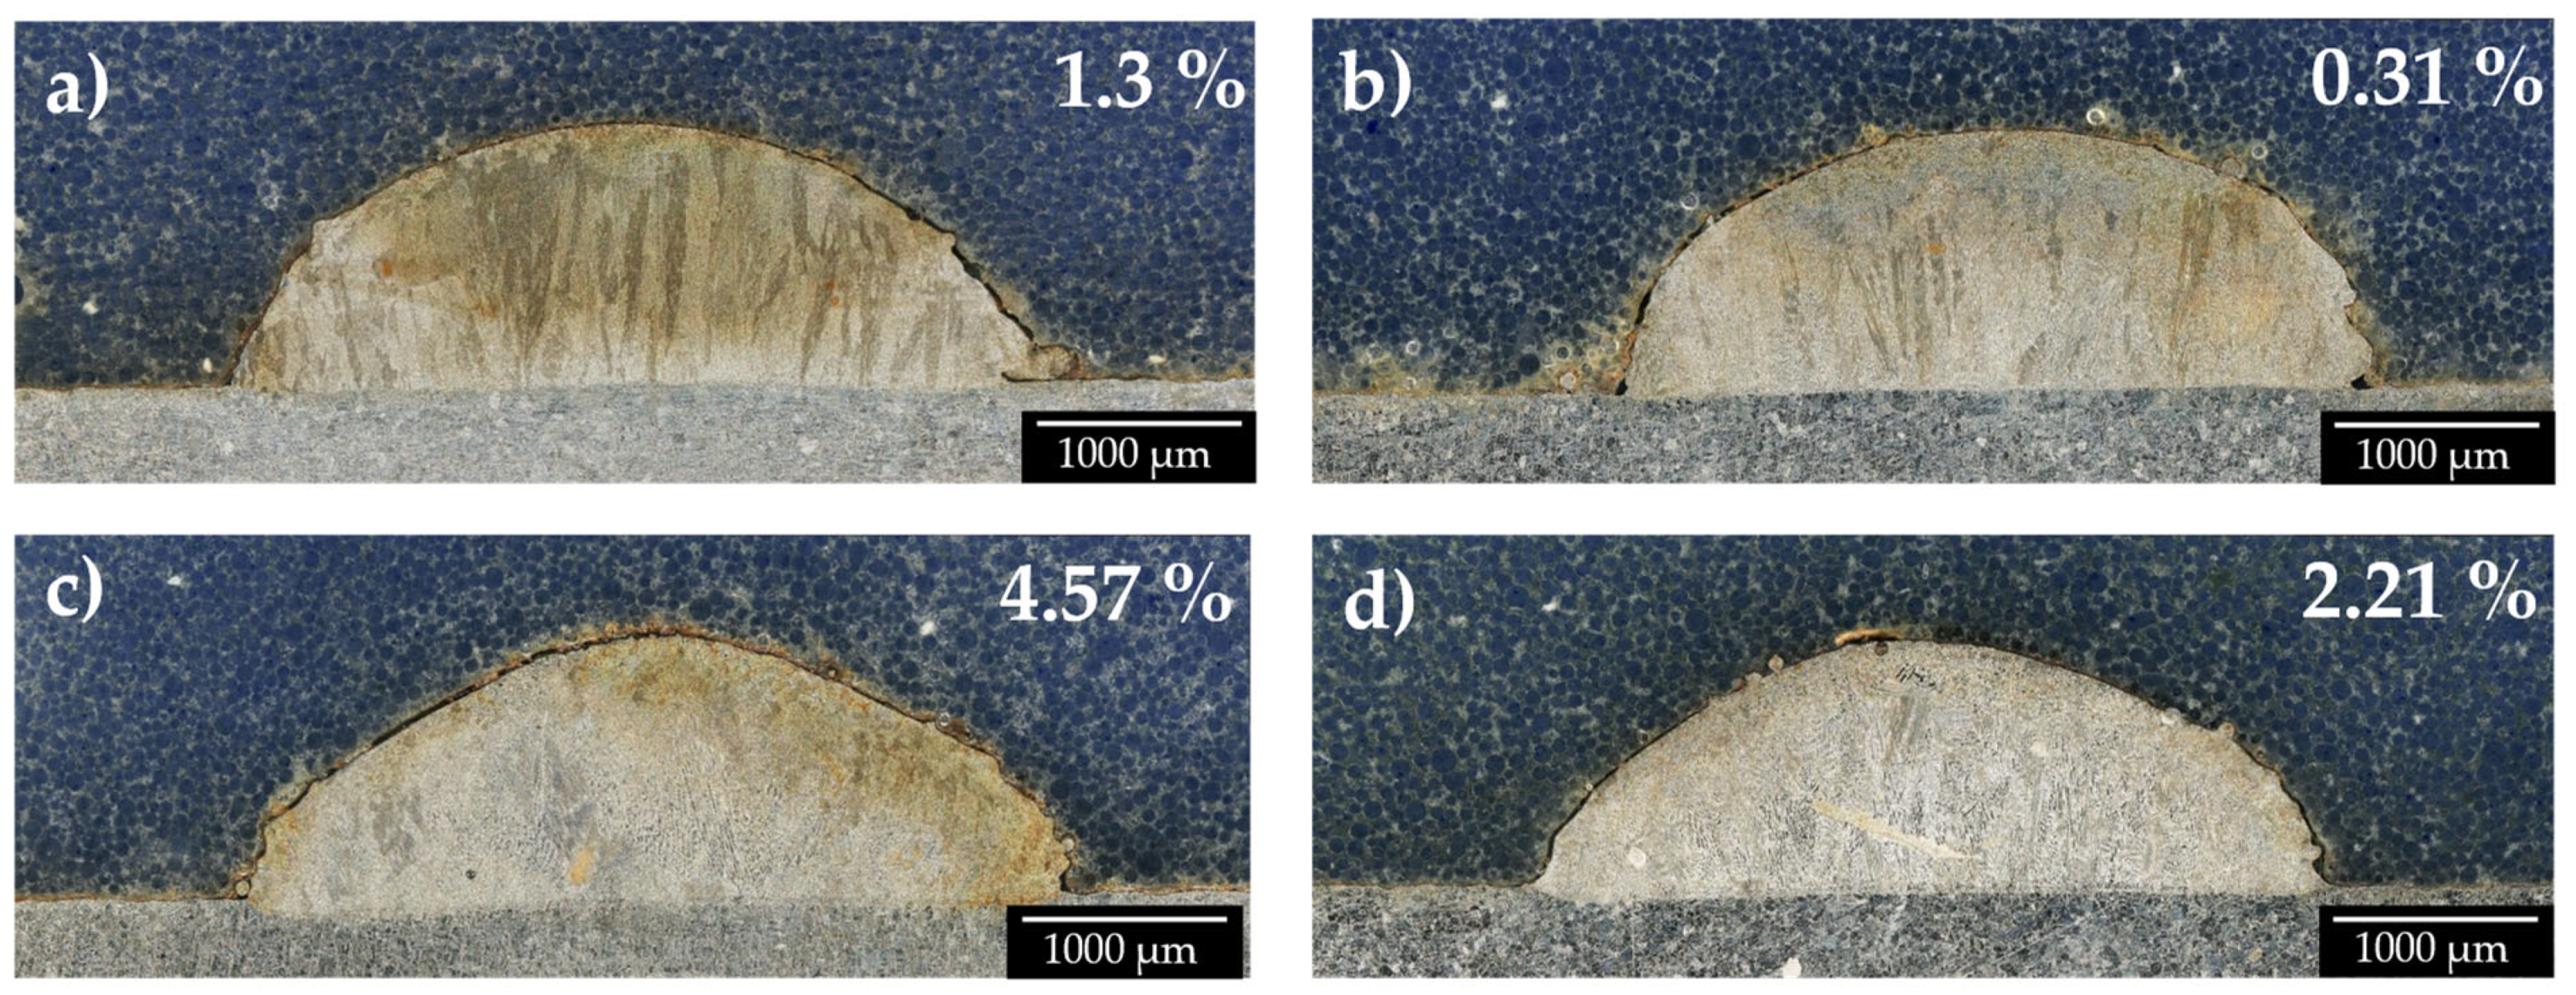
The experimental results for the bead height, bead width, contact angle, and dilution were compared with the desired target values across substrate temperatures of 200 °C, 400 °C, 600 °C, and 800 °C. Overall, the model was able to predict the bead height, bead width, and contact angle with reasonable accuracy, while it struggled to accurately predict the dilution. For the bead height, the target value was set at 1000 µm, and the experimental values were slightly lower, with the largest deviation occurring at 200 °C and 400 °C, where the bead height was 886 µm, representing a 11.8% decrease from the target. At the highest substrate temperature of 800 °C, the bead height was 895 µm, a 10.5% decrease, indicating that the model performed relatively well across all temperature ranges. The desired bead width of 3000 µm was also generally achieved, with the largest deviation observed at 400 °C, where the bead width was 2790 µm, a 7% decrease. At 800 °C, the bead width was 2895 µm, a 5% decrease from the desired value. The contact angle predictions were similarly close to the experimental values, with the largest deviation occurring at 800 °C, where the experimental contact angle was 95°, a 25% decrease compared to the predicted value of 127°. At lower temperatures, the deviations were smaller, with the experimental contact angle at 200 °C showing only a 1% decrease. This suggests that while the model remains accurate at lower temperatures, its prediction for the contact angle at higher temperatures requires refinement. However, the model significantly underperformed when predicting the dilution. While the target dilution was set at 15% for all temperatures, the experimental dilution consistently fell short. The largest deviation occurred at 400 °C, where the experimental dilution was 2.6%, representing an 82.7% decrease. At 800 °C, the dilution was only 4.8%, a 68% decrease. This significant deviation underscores the need for further refinement of the model when predicting the dilution, as it is a key parameter in determining the quality of the bead. These results indicate that while the model was effective in predicting the bead height, bead width, and contact angle, it failed to accurately predict the dilution, highlighting the need for further refinement in the process model.

 ,
, 


