Article

Microstructure Evolution and Mechanical Properties of Pure Ti Alloy Sheet Fabricated by Double-Side Corrugated Rolling

1
School of Intelligent Manufacture and Electrical Engineering, Nanyang Normal University, Nanyang 473000, China
2
College of Mechanical Engineering, Taiyuan University of Technology, Taiyuan 030024, China
*
Author to whom correspondence should be addressed.
Metals 2024, 14(11), 1242; https://doi.org/10.3390/met14111242
Submission received: 20 September 2024 / Revised: 13 October 2024 / Accepted: 29 October 2024 / Published: 31 October 2024

Abstract

:
In this study, pure Ti alloy sheets were fabricated by double corrugated roll + flat roll rolling (DCFR) and flat roll + flat roll rolling (FFR) at 700 °C and 400 °C, respectively. The microstructure, texture, and mechanical properties were investigated systematically. The results showed that the recrystallization fraction was small and there were a large number of substructures and deformation structures in the two rolling processes. The textures of the sheet rolled at 700 °C and 400 °C were the basal bimodal TD texture and mainly consisted of B and E types with Euler angles (15°, 25°, 0°) and (15°, 30°, 30°). Compared with the FFR sheet, the texture was weakened at the center of the DCFR sheet rolled at 700 °C, while the texture weakening of the sheet rolled at 400 °C is insignificant. The tensile strength of the sheet rolled by DCFR at 400 °C was about 90 MPa higher than that of the sheet rolled by DCFR at 700 °C. The elongation in the rolling direction is almost 15%, and that in the transverse direction varies from 10% to 23% for the sheet rolled at different temperatures and rolling processes. The tensile test indicates that the alloy rolled by DCFR at 400 °C exhibits superior isotropy. Through the analysis of texture types, it is discovered that although the texture intensity of the alloy is higher than that of the FFR alloy, its more abundant texture types weaken its anisotropy. After annealing at 650 °C for 1 h, the grains recrystallized from the deformed and elongated state into equiaxed crystals, the texture intensity decreased, and the grain orientation became more diversified.

1. Introduction

A pure titanium sheet boasts outstanding ductility, specific strength, and corrosion resistance. As a structural, biological, and functional material, it is extensively utilized in medical, biological, petroleum, marine, and chemical domains [1,2,3]. Owing to its intricate deformation mechanism, numerous scholars have conducted copious research on pure titanium or commercial pure titanium (CP-Ti) [4,5,6,7,8]. The crystal structure of the pure titanium α phase at room temperature is a close-packed hexagonal structure with an axial ratio c/a of 1.587, which is lower than the ideal axial ratio (1.633) [9]. At room temperature, the pure titanium prismatic slip system requires less shear stress and is more facile to initiate compared with the basal slip system [10,11,12]. Due to the lower symmetry of the crystal structure and the fewer independent slip systems of pure titanium, the grains will exhibit a pronounced preferred orientation during the rolling process, giving rise to the texture characteristics of anisotropy in microstructure and properties [13]. Texture is the crucial factor causing the anisotropy of mechanical properties [14]. The research of Chen et al. [15] indicates that the yield strength and tensile strength of a pure titanium sheet in three directions are highly disparate due to the presence of anisotropy during stretching. Consequently, TA1, a critical material in aerospace applications, consistently encounters challenges related to cracking and uneven deformation throughout the forming process [16,17].
Numerous researchers have conducted relevant studies on weakening texture and have mitigated the rolling texture through high-density current-assisted rolling [18], cross-rolling [17,19], adjustment of pressure, and other approaches [20,21]. WANG et al. [18] facilitated the application of a high-density pulse current in the rolling direction of a sheet metal, which enhanced the internal dislocation mobility of the metal, and reduced the microstructure anisotropy in the directions of 0°, 45°, and 90°. However, this technology is complex, demands sophisticated equipment, and poses challenges for mass production. LIU et al. [19] prepared a pure titanium sheet by the process of bi-directional cross-rolling, which significantly weakened the texture characteristics of the pure titanium sheet. Although cross-rolling can significantly weaken the texture and improve the anisotropy, its strength decreases significantly, which cannot meet the engineering application conditions in many practical productions. In recent years, the simple process, low equipment requirements, and easy-to-achieve mass production of the corrugated roll rolling process are increasingly becoming the focus of attention.
Corrugated roll rolling is a technology that changes the force mode in the rolling process and weakens the metal texture by changing the shape of the roll [22]. Corrugation rolling in magnesium alloys has been extensively studied. Wang et al. [23] rolled a Mg-6Al-3Sn magnesium alloy sheet into a corrugated sheet and then flattened the roll, significantly weakening the texture of the magnesium alloy base surface. Sun et al. [24] rolled a Mg-3Al-1Zn plate with a corrugated surface and discovered that the original strong base texture of the plate shifted, and the texture changed near or away from the corrugated surface. A magnesium alloy and pure titanium have the same crystal structure, but at present, there are fewer studies related to corrugated roll rolling of pure titanium and a lack of systematic and in-depth research.
The purpose of this thesis is to systematically study the changes in microstructure and properties of TA1 after rolling by double corrugated roll + flat roll rolling (DCFR) and flat roll + flat roll rolling (FFR) at different temperatures. The effect of corrugation rolling on the microstructure and mechanical anisotropy of TA1 was studied, which provides a new solution for reducing the texture of a TA1 sheet.

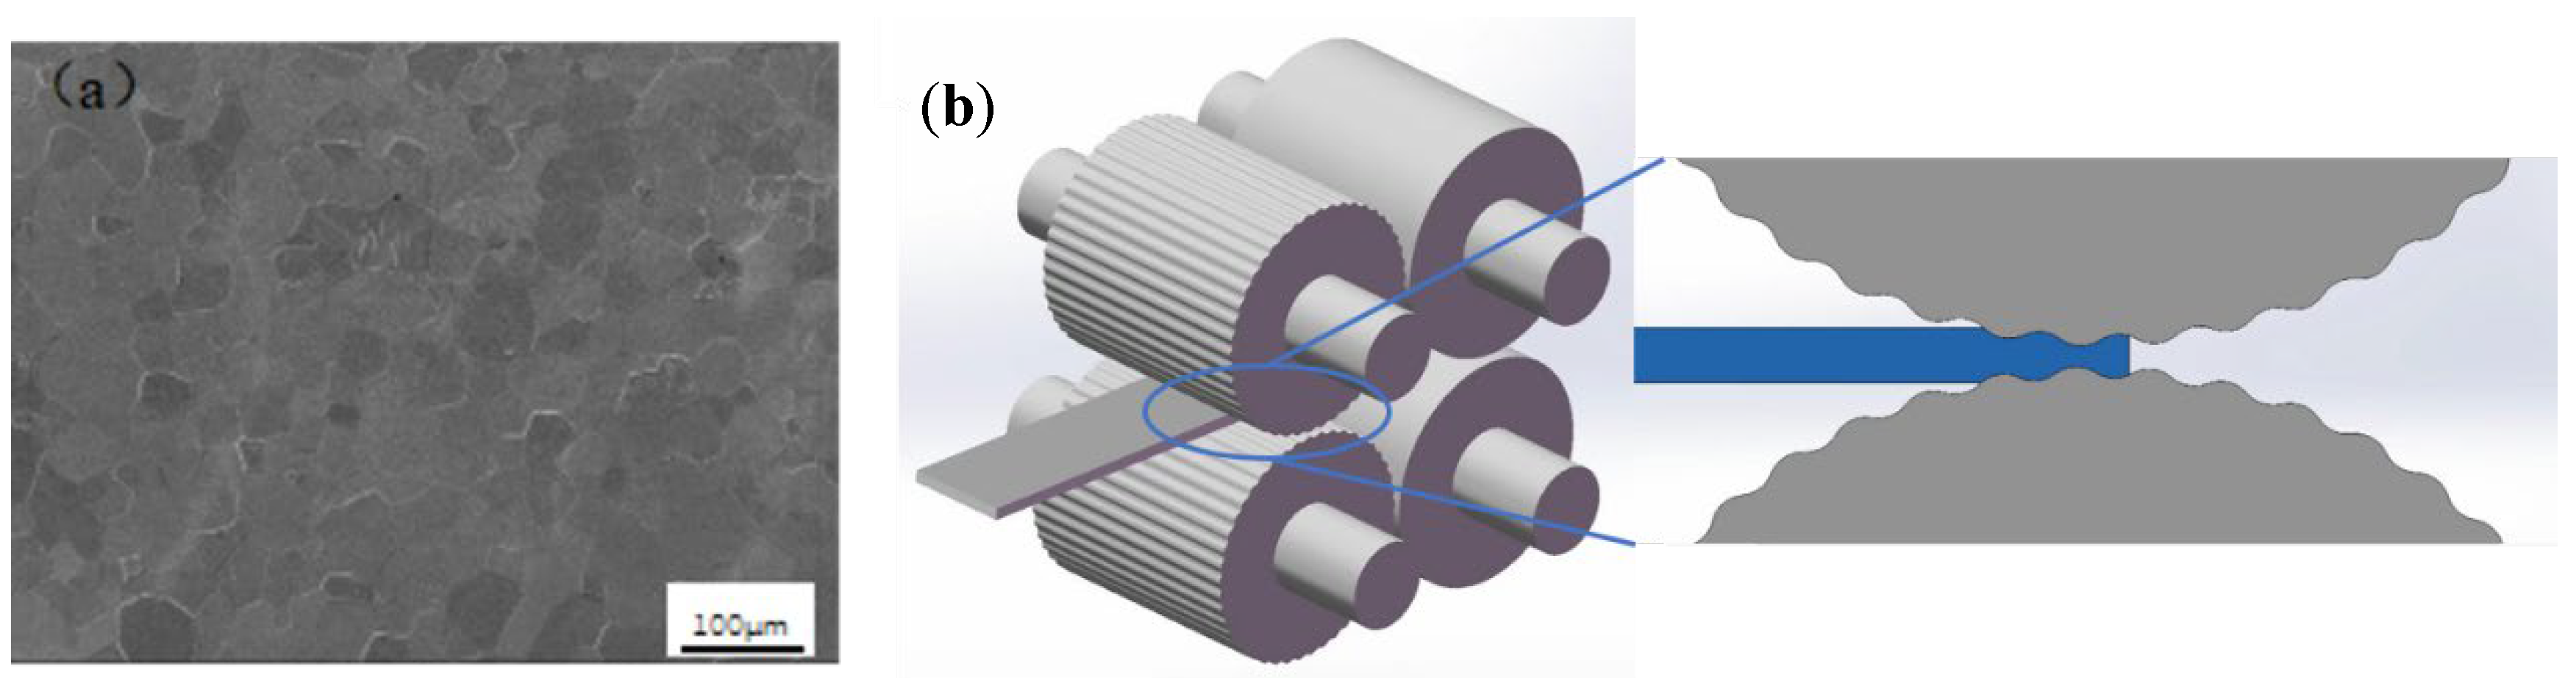
2. Experimental Procedure

The size of the TA1 pure titanium plate is 80 mm × 60 mm × 4 mm, and its chemical composition is presented in Table 1. Figure 1a depicts the microstructure of the original titanium plate. The grain size of equiaxed crystals is 34 μm. The DCFR process is divided into two stages. The first stage is the corrugated roll rolling (CR) of the TA1 titanium plate, and the corrugated roll is made of a roll with a diameter of ∅150. The height difference between the peaks and troughs is 1 mm. The second stage is the flat roll rolling (FR), and the rolling diagram is shown in Figure 1b. The titanium plates were placed in the tube heating furnace and held at 400 °C and 700 °C, respectively, for 20 min, followed by the first corrugated roll rolling with a reduction rate of 25%, resulting in titanium plates corrugated on both upper and lower surfaces. Subsequently, the titanium plates were heated at 400 °C and 700 °C, respectively, for 10 min, and the second flat roll rolling was conducted. Argon gas protected the heating process. The total reduction rate of the two passes is 50%. Under the same conditions, the comparison experiment of two-time flat rolling is referred to as FFR. The RD-ND plane of the hot-rolled titanium plate was cut by wire cutting.
The tensile samples of DCFR- and FFR-rolled titanium plates were cut, and the size of the tensile samples is presented in Figure 2. The Instron 5969 universal tensile testing machine was employed for the experiment, which was produced by ITW Group Instron in Boston, MA, USA, with the tensile speed being set at 0.5 mm/min. The evolution of microstructure and texture was investigated through scanning electron microscopy (SEM) and electron backscattered diffraction (EBSD) of JEOL-JSM-IT500 produced in Japan by Nippon Electronics Co., LTD. Before microstructure characterization, the RD-ND surface of the sample was electrolytically polished and etched. The ratio of the electrolytic polishing liquid was perchloric acid/n-butanol/methanol = 1:3:6, the polishing voltage was set at 32 V, the time was set to 30 s, and the polishing temperature was controlled at −30 °C. The corrosion solution was a 100 mL solution consisting of 5 mL of nitric acid, 3 mL of hydrofluoric acid, and 92 mL of water, and the corrosion time was 5 min. The JEOL-IT500 SEM and its EBSD system were utilized in the experiment, and the operating voltage was 20 KV.

3. Results

3.1. Microstructure of TA1 Plate Rolled at 400 °C

Figure 3 depicts the microstructure of the plates at diverse positions after one-step double corrugation rolling (DCR) and one-step flat rolling (FR). In Figure 3a, the microstructure in proximity to the rolling surface of the wave crest reveals the presence of twins, and the grains are elongated along the RD direction. This is because the TA1 alloy has a hexagonal close-packed structure, and its independent slip system is limited. When it fails to meet the deformation requirements during processing deformation, in addition to the operation of the <c + a> slip system, twins also emerge in the deformation process [25,26,27]. Grain deformation is relatively low, and most of them remain equiaxed. A small amount of grain fragmentation occurred and most grains remained intact at position DCR-B. At position DCR-C, it was seen that the grains became fibrotic. The grains are significantly elongated along the RD direction, and grain fragmentation also increased. The grain deformation at position DCR-D is significantly smaller than that of DCR-D, and the grain boundaries are obvious. The grains underwent deformation and fragmentation, and twinning also occurred. As shown in Figure 3e,f, the grains at position FR-E are significantly elongated along the RD direction, and they underwent squeezing and crushing to some degree. The grain deformation at position FR-F was relatively small, and the grain elongation is smaller than that at position FR-E. The equiaxed grains still presented themselves, and some grains also underwent squeezing and crushing.
Figure 4 shows the microstructure at different positions of titanium sheets after the second pass of DCFR and FFR processes at 400 °C. It can be observed that the grains at positions DCFR-A and DCFR-C are elongated obviously, and more grains crushing and squeezing made it difficult to clearly distinguish the grain boundaries. The grain deformation at positions DCFR-B and DCFR-D is much more than that at positions DCFR-A and DCFR-C. The grain morphology is clear, and the degree of grain elongation also reduced. The grains were broken into needle-shaped shapes at position DCFR-B, indicating that the grain deformation is uneven.

3.2. Microstructure of TA1 Plate Rolled at 700 °C

At 700 °C, we rolled out first-pass DCR and the first-pass FR, and the microstructure morphology is shown in Figure 5. In the crest thickness direction, the grains are larger, and the deformation is lighter. The microstructure variability in the two positions is not obvious in DCR-A or DCR-B, and compared with 400 °C, no large number of twins were observed under 700 °C rolling, and the grains in the two DCR-C and DCR-D positions are in a severely elongated state. The degree of grain deformation is lower in the position farther away from the trough surface. In the flat-rolled plate near the upper surface, the degree of grain deformation is between DCR-A and DCR-C; in the thickness direction, the degree of deformation in the FR-E position is higher than that in the middle FR-F position.
Figure 6 depicts the microstructure of DCFR and FFR titanium plates at various positions after two passes of flat rolling. It can be discerned that the grain of two positions, FFR-E and FFR-F, are considerably longer than the four positions of the DCFR titanium plate. In the DCFR titanium plate, the grain deformation of DCFR-A is more pronounced than that at DCFR-C, and the grain fracture and elongation are more conspicuous. In contrast to the rolling at 400 °C, the grains are more distinct, and the grains with fibrous elongation are fewer. Conversely, more equiaxed crystals can be observed in the microstructure of the six positions under the two processes, which ought to be the consequence of dynamic recrystallization resulting from the increase in rolling temperature and leading to more energy input during the rolling process.

3.3. Mechanical Properties

Figure 7a shows the tensile properties of the sheets rolled by the DCFR process and FFR process at 400 °C. Yield strength and tensile strength values are illustrated in Table 2. It can be seen that the yield strength and tensile strength of the DCFR process are higher than those of the FFR process. In the RD direction, the yield strength of DCFR and FFR is 446.3 MPa and 442.4 MPa, respectively. The tensile strength of DCFR and FFR is 458.5 MPa and 451.2 MPa, respectively. In the TD direction, the yield strength of DCFR and FFR is 445.2 MPa and 427.7 MPa, respectively. The tensile strength of DCFR and FFR is 455.2 MPa and 436.5 MPa, respectively. In the RD direction, the elongation of DCFR and FFR is 14.1% and 25.6%. In the TD direction, the elongation of DCFR and FFR is 15.5% and 16.8%. The elongation of the sheet rolled by the FFR process is higher than that of DCFR in two directions. The elongation in the RD direction is smaller than that in the TD direction for the DCFR sheet, while the elongation in the RD direction is greater than that in the TD direction for the FFR sheet. The tensile strength of the DCFR sheet is higher than that of the FFR sheet, while the elongation of the DCFR sheet is lower than that of the FFR sheet. Compared with the FFR sheet, the DCFR sheet had less planar anisotropy in elongation. Overall, the strength of the DCFR sheet is higher than that of the FFR sheet, and the planar anisotropy of elongation is smaller than that of the FFR sheet.
Figure 7b shows the tensile strength and elongation of the sheets rolled by two processes at 700 °C. It can be observed that the yield strength and tensile strength of the DCFR sheet are higher than those of the FFR sheet. In the RD direction, the yield strength of DCFR and FFR is 381.2 MPa and 396.2 MPa, and the tensile strength of DCFR and FFR is 389.4 MPa and 404.5 MPa. In the TD direction, the yield strength of DCFR and FFR is 353.9 MPa and 386.3 MPa, and the tensile strength of DCFR and FFR is 360.6 MPa and 393.6 MPa.
It was seen that the elongation of the DCFR and FFR sheet is 11.1% and 25.5% in the RD direction, and in the TD direction, it is 14.8% and 20.8%. The elongation of the titanium sheet rolled by the FFR process has a significant difference in the RD and TD directions, and the planar anisotropy is very obvious. The fracture elongation of the tensile specimen along the RD direction is significantly higher than that of other tensile specimens. Moreover, we test the hardness of the alloys, and the results are shown in Table 3.

4. Discussion

4.1. Rolled Texture and Annealed Texture at 400 °C

Figure 8 shows the pole figures at different positions after the second pass of rolling at 400 °C. The texture types are inclined TD texture with two peaks in the TD direction. This is consistent with the typical rolling double-peak texture obtained by ordinary unidirectional rolling studied by Gurao et al. [28]. The texture strength of DCFR is higher than that of FFR at 400 °C, and the maximum polar density intensity at position DCFR-A is larger than that at position DCFR-C, while the maximum polar density intensity at position DCFR-B is greater than that at position DCFR-D. The maximum polar density strength at position FFR-E is lower than that at position FFR-F. Compared with the FFR process, the DCFR process cannot weaken the texture strength of the titanium sheet. There are certain differences in the grain orientation at different positions of the titanium sheet produced by the DCFR process. The texture strength was also significantly different in the polar density strength at different positions.
Figure 9 shows the reverse pole figures at different positions of titanium sheets annealed at 650 °C/1 h using DCFR and FFR processes at 400 °C. It can be seen that the grain size at the original peak and valley of the DCFR titanium sheet is exactly opposite. The grain size at position DCFR-A is larger with less fine recrystallization, while the grain size at position DCFR-B is smaller. The grain size at position DCFR-D is larger, while it is smaller at position DCFR-C. The larger grains generally presented as red or near red, while smaller grains presented as green and blue or near green and near blue. The grain size of the titanium sheet rolled by the DCFR process is small after the annealing treatment.
Figure 10 shows the pole figures at different positions of the titanium sheet after annealing at 650 °C/1 h. It was seen that both DCFR and FFR titanium sheets exhibited the typically basal inclined TD-type bimodal texture, indicating that the texture type of titanium sheets does not change much after annealing. The texture strength at positions DCFR-A and DCFR-C is lower than that at position FFR-E, and the texture strength at positions DCFR-B and DCFR-D is smaller than that at position FFR-F. The maximum polar density intensity at position DCFR-A is 11.7% lower than that at position FFR-E, while the maximum polar density intensity at position DCFR-A is 24.9% lower than that at position FFR-E. Similarly, the maximum polar density intensity at position DCFR-B is 12.6% less than that at position FFR-F and the maximum polar density intensity at position DCFR-D is 32.4% less than that at position FFR-F. The texture strength of the near upper surface position is greater than the corresponding middle position, and the green contour area in the middle region of the DCFR titanium sheet is significantly more concentrated than that of the FFR titanium plate.

4.2. Rolled Texture and Annealed Texture at 700 °C

At 700 °C, the {0001} pole figure of DCFR and FFR titanium plates at different positions is presented in Figure 11. It can be observed that under two kinds of rolling processes, the DCFR titanium plates exhibit a double-peak TD texture on the basal surface. In the area adjacent to the upper surface of the plate, the maximum pole density intensity at the primary crest (a) and trough (c) of the DCFR titanium plate is 11.34 and 10.26, respectively. The maximum polar density intensity in the near upper surface (e) region of the FFR titanium plate is 9.56. Compared to the middle region along the thickness direction of the two types of titanium plates, the maximum pole density intensity at the original crest (b) and trough (d) of the DCFR titanium plate is 8.19 and 8.01, respectively. The maximum polar density intensity in the (f) region of the FFR titanium plate is 7.52. It can be perceived that for the two types of rolled titanium plates, the texture strength near the upper surface is higher than that in the middle region, and the texture strength of the DCFR titanium plate is stronger than that of the FFR titanium plate. Moreover, within the DCFR titanium plate, the texture strength at the original trough is weaker than that at the original peak, and the middle region in the thickness direction of the plate also possesses the same characteristics.
Figure 12 depicts the inverse pole figure at various positions after DCFR and FFR at 700 °C and annealing at 650 °C for 1 h. Similarly to the annealing process conducted at 400 °C, upon annealing at 650 °C for 1 h, the plates rolled at 700 °C exhibited an equiaxed crystal morphology, and all the deformed structures as well as elongated grains vanished. In contrast, the grains of the alloy after annealing at 700 °C are smaller, and the crystals demonstrate relatively more grain orientation.
It can be observed in Figure 13 that after annealing, the texture strength of the DCFR titanium plate is lower than that of the FFR titanium plate. In contrast to the more prominent basial tilting TD-type texture formed by the FFR titanium plate, the DCFR titanium plate shows a certain angle of deflection, and the extreme density intensity points are more scattered. In the DCFR titanium plate, the texture strength at the trough is still lower than that at the crest position, yet it is close to those at the (b) and (d) positions. The texture strength of the FFR titanium is significantly higher than that at the original upper crest and original upper trough of the DCFR, but the disparity in texture in the direction of its thickness is merely 0.34.
The alloys rolled at 400 °C and 700 °C through different procedures are inclined to generate base surface TD texture. Additionally, the two procedures and temperatures exert distinct influences on the texture. Compared with the FFR sheet, the texture was weak at the center of the DCFR sheet rolled at 700 °C, while the texture weakening of the sheet rolled at 400 °C is insignificant. After annealing at 650 °C, all the deformed structures of the TA1 alloy were recrystallized and transformed into equiaxed crystals.

4.3. Effect of Texture Evolution on Properties of Alloys

The TA1 alloy is rolled under diverse processing procedures, presenting distinct performance variances. This paper intends to investigate the impact of these procedures on alloy anisotropy; thus, the index of plane anisotropy (IPA) is employed to characterize the magnitude of material anisotropy [29]. The anisotropy index IPA of the material’s yield strength and plasticity can be calculated by the following formula:
I P A = n 1 X m a x i = 1 n 2 X m i d X m i n n 1 X m a x × 100 %
Xmax, Xmin, and Xmid, respectively, represent the maximum, minimum, and intermediate values of a certain property of the material, while n represents the number of different directions of the material. The anisotropy of a certain property can be measured by the magnitude of IPA. The smaller the value of IPA, the lower the anisotropy and the more isotropic the material tends to be. The anisotropy statistics of the yield strength and fracture elongation of the materials calculated at different temperatures and different processes is presented in Table 4. It can be observed that the DCFR process exhibits better isotropy in both the yield strength and fracture plasticity of the sheet rolled at 400 °C. When rolling at 700 °C, the alloy rolled by the FFR process demonstrates better isotropy. The anisotropy of the DCFR rolled alloy at different temperatures is compared, and it is discovered that the cyclic fluctuating load at 400 °C is the most favorable for the anisotropy of the rolled alloy. The anisotropy of the alloy rolled at different temperatures by FFR was compared, and it was found that the anisotropy of the alloy rolled at 700 °C is the least compared with DCFR. The order of isotropy of the alloy under the four processes is 400 DCFR > 700 FFR > 400 FFR > 700 DCFR. Rolling at 400 °C can significantly enhance the anisotropy of the TA1 alloy during the rolling process and stabilize the alloy properties.
It can be observed from Section 4.1 and Section 4.2 that the cyclic load does not effectively reduce the texture strength of the alloy. Instead, the alloy subjected to cyclic load enhances the texture strength. The higher the texture strength is, the poorer the isotropy of the material becomes. However, in this study, the 400 DCFR titanium alloy with higher texture strength not only possesses higher yield strength but also demonstrates better isotropy.
Figure 14 shows ODF maps at constant φ2 = 0° and 30° at different positions after the second pass of rolling at 400 °C. In conjunction with Figure 15, the texture of the titanium sheet processed by DCFR and FFR is mainly B-type and E-type texture, while the texture at positions DCFR-C and DCFR-D tends to be D-type texture. The texture types at position DCFR-C are B-type and D-type textures, while the texture on the ODF maps at constant φ2 = 0° falls between the B-type and D-type textures, and the texture on the ODF maps at constant φ2 = 0° is the E type. The texture is similar to B-type and E-type textures for titanium sheets processed by the FFR process. The texture types at position DCFR-A are (8°, 30°, 0°). The textures at position DCFR-B are (25°, 25°, 0°) and (10°, 25°, 30°). The textures at position DCFR-C are (20°, 20 °, 0 °) and (30 °, 15 °, 30 °). The textures at position DCFR-D are (30°, 20°, 0°) and (15°, 20°, 30°). The textures at position FFR-E are (8°, 30°, 0°). The textures at position FFR-F are (10°, 30°, 0°) and (15°, 25°, 30°). And the detailed information is listed in Table 5.
In the study of Zhong et al. [30], it was found that increasing the reduction amount during cold rolling would promote the formation of D and A textures in B and E textures, thus enriching texture types and reducing the anisotropy of titanium alloys. In this study, only B and E textures were generated by flat rolling at 400 °C, and the generation of B and E textures after DCFR also promoted the generation of D and A textures. This is because the cyclic load generated by the corrugated roller causes the load of each part of the plate to be inconsistent and the deformation of the DCFR-C position is large [23,31]. The increase in texture types promotes the isotropy of the alloy, so the difference in properties in different directions of the 400 DCFR alloy is the smallest.
The TA1 alloy was rolled by FFR and DCFR processes at 400 °C, and the DCFR alloy not only showed higher yield strength, but also better performance in weakening anisotropy. In engineering practice, the DCFR process can be used to regulate the weaving structure of TA1 alloy sheets and thus the anisotropy of the alloy to improve its formability.

5. Conclusions

This paper systematically explains the microstructure and texture evolution of TA1 sheets rolled with DCFR and FFR at varying temperatures, followed by annealing at 650 °C. Additionally, the mechanical properties of the rolled sheets were evaluated, leading to the following conclusions:
  • The recrystallization rate of the plates produced by the two rolling processes at different temperatures is small, and there are a lot of substructure and deformed grains.
  • Compared with the FFR sheet, the texture weakening of the sheet rolled at 400 °C is insignificant. The textures of the sheet are the basal bimodal TD texture and mainly consist of B and E types with Euler angles (15°, 25°, 0°) and (15°, 30°, 30°).
  • The tensile strength of the sheet rolled by DCFR at 400 °C was about 90 MPa higher than that of the sheet rolled by DCFR at 700 °C. The elongation in the rolling direction is almost 15%, and that in the transverse direction varies from 10% to 23% for the sheet rolled at different temperatures and rolling processes. The tensile test indicates that the alloy rolled by DCFR at 400 °C exhibits superior isotropy.

Author Contributions

Conceptualization, Z.D. and J.H.; methodology, W.Z.; validation, J.H. and W.Z.; formal analysis, W.Z. and Z.D.; investigation, W.Z.; resources, J.H.; data curation, Z.D. and W.Z.; writing—original draft preparation, Z.D. and W.Z.; writing—review and editing, Z.D. and J.H.; visualization, Z.D.; supervision, J.H.; project administration, Z.D.; funding acquisition, J.H. All authors have read and agreed to the published version of the manuscript.

Funding

This work was supported by the National Natural Science Foundation of China (52275362); Natural Science Foundation of Anhui Provincial Education Department, China (Grant No. KJ2021A1041); Central Government Guides regarding the Special Fund Projects of Local Scientific and Technological Development (YDZJSX2021A020, YDZX20191400002149); Natural Science Foundation of Henan Province (222300420254); and Young Backbone Teachers’ Project of Nanyang Normal University (2023-qngg-8).

Data Availability Statement

The data presented in this study are available on request from the corresponding author. The data are not publicly available due to privacy and ethical reasons.

Acknowledgments

We would like to extend our sincere gratitude to Xinyang Liu for his invaluable contributions in gathering the experimental data during this study.

Conflicts of Interest

The authors declare no conflicts of interest.

References

  1. Gan, X.; Li, S.; Xiao, S.; Yang, Y. Integrated high-performance and accurate shaping technology of low-cost powder metallurgy titanium alloys: A comprehensive review. Int. J. Miner. Metall. Mater. 2024, 31, 413–426. [Google Scholar] [CrossRef]
  2. Kim, K.T.; Eo, M.Y.; Nguyen, T.T.H.; Kim, S.M. General review of titanium toxicity. Int. J. Implant. Dent. 2019, 5, 10. [Google Scholar] [CrossRef] [PubMed]
  3. Sidambe, A. Biocompatibility of Advanced Manufactured Titanium Implants—A Review. Materials 2014, 7, 8168–8188. [Google Scholar] [CrossRef] [PubMed]
  4. Xu, C.; Zhu, W.-F. Comparison of microstructures and mechanical properties between forging and rolling processes for commercially pure titanium. Trans. Nonferrous Met. Soc. China 2012, 22, 1939–1946. [Google Scholar] [CrossRef]
  5. Li, K.; Yang, P. Interaction among deformation, recrystallization and phase transformation of TA2 pure titanium during hot compression. Trans. Nonferrous Met. Soc. China 2016, 26, 1863–1870. [Google Scholar] [CrossRef]
  6. Yin, Y.-F.; Xu, W.; Sun, Q.-Y.; Xiao, L.; Sun, J. Deformation and fracture behavior of commercially pure titanium with gradient nano-to-micron-grained surface layer. Trans. Nonferrous Met. Soc. China 2015, 25, 738–747. [Google Scholar] [CrossRef]
  7. Qarni, M.J.; Sivaswamy, G.; Rosochowski, A.; Boczkal, S. Effect of incremental equal channel angular pressing (I-ECAP) on the microstructural characteristics and mechanical behaviour of commercially pure titanium. Mater. Des. 2017, 122, 385–402. [Google Scholar] [CrossRef]
  8. Alvarez, K.; Nakajima, H. Metallic Scaffolds for Bone Regeneration. Materials 2009, 2, 790–832. [Google Scholar] [CrossRef]
  9. Yoo, M.H.; Wei, C.T. Slip Modes of Hexagonal-Close-Packed Metals. J. Appl. Phys. 1967, 38, 4317–4322. [Google Scholar] [CrossRef]
  10. Naka, S.; Kubin, L.P.; Perrier, C. The plasticity of titanium at low and medium temperatures. Philos. Mag. A 1991, 63, 1035–1043. [Google Scholar] [CrossRef]
  11. Biget, M.P.; Saada, G. Low-temperature plasticity of high-purity α-titanium single crystals. Philos. Mag. A 1989, 59, 747–757. [Google Scholar] [CrossRef]
  12. Naka, S.; Lasalmonie, A.; Costa, P.; Kubin, L.P. The low-temperature plastic deformation of α-titanium and the core structure of a-type screw dislocations. Philos. Mag. A 1988, 57, 717–740. [Google Scholar] [CrossRef]
  13. Wu, X.; Kalidindi, S.; Necker, C.; Salem, A. Prediction of crystallographic texture evolution and anisotropic stress–strain curves during large plastic strains in high purity α-titanium using a Taylor-type crystal plasticity model. Acta Mater. 2007, 55, 423–432. [Google Scholar] [CrossRef]
  14. Bozzolo, N.; Dewobroto, N.; Grosdidier, T.; Wagner, F. Texture evolution during grain growth in recrystallized commercially pure titanium. Mater. Sci. Eng. A 2005, 397, 346–355. [Google Scholar] [CrossRef]
  15. Chen, F.-K.; Chiu, K.-H. Stamping formability of pure titanium sheets. J. Mater. Process. Technol. 2005, 170, 181–186. [Google Scholar] [CrossRef]
  16. Ji, X.; Xu, J.; Zhang, H.; Du, J.; Zeng, W.; Wang, W. Plastic deformation mechanism of TA1 pure titanium plate using SEM-EBSD in-situ tensile testing. Mater. Sci. Eng. A 2024, 908, 146768. [Google Scholar]
  17. Liu, D.-K.; Huang, G.-S.; Gong, G.-L.; Wang, G.-G.; Pan, F.-S. Influence of different rolling routes on mechanical anisotropy and formability of commercially pure titanium sheet. Trans. Nonferrous Met. Soc. China 2017, 27, 1306–1312. [Google Scholar] [CrossRef]
  18. Wang, Z.; Song, H. Effect of electropulsing on anisotropy behaviour of cold-rolled commercially pure titanium sheet. Trans. Nonferrous Met. Soc. China 2009, 19, s409–s413. [Google Scholar] [CrossRef]
  19. Sahoo, S.K.; Sabat, R.K.; Sahni, S.; Suwas, S. Texture and microstructure evolution of commercially pure titanium during hot rolling: Role of strain-paths. Mater. Des. 2016, 91, 58–71. [Google Scholar] [CrossRef]
  20. Nasiri-Abarbekoh, H.; Ekrami, A.; Ziaei-Moayyed, A.A.; Shohani, M. Effects of rolling reduction on mechanical properties anisotropy of commercially pure titanium. Mater. Des. 2012, 34, 268–274. [Google Scholar] [CrossRef]
  21. Nasiri-Abarbekoh, H.; Ekrami, A.; Ziaei-Moayyed, A.A. Effects of thickness and texture on mechanical properties anisotropy of commercially pure titanium thin sheets. Mater. Des. 2013, 44, 528–534. [Google Scholar] [CrossRef]
  22. Li, S.; Liu, X.; Jia, Y.; Han, J.; Wang, T. Interface Characteristics and Bonding Performance of the Corrugated Mg/Al Clad Plate. Materials 2021, 14, 4412. [Google Scholar] [CrossRef] [PubMed]
  23. Wang, H.-Y.; Feng, T.-T.; Zhang, L.; Liu, C.-G.; Pan, Y.; Zha, M.; Nan, X.-L.; Wang, C.; Jiang, Q.-C. Achieving a weak basal texture in a Mg–6Al–3Sn alloy by wave-shaped die rolling. Mater. Des. 2015, 88, 157–161. [Google Scholar] [CrossRef]
  24. Sun, Z.; Wu, Y.; Xin, Y.; Peng, Y.; Feng, B.; Liu, Q. Varying the strong basal texture in a Mg-3Al-1Zn plate by a new wave-shaped interface rolling. Mater. Lett. 2018, 213, 151–153. [Google Scholar] [CrossRef]
  25. Gurao, N.P.; Kapoor, R.; Suwas, S. Deformation behaviour of commercially pure titanium at extreme strain rates. Acta Mater. 2011, 59, 3431–3446. [Google Scholar] [CrossRef]
  26. Qin, H.; Jonas, J.J. Variant selection during secondary and tertiary twinning in pure titanium. Acta Mater. 2014, 75, 198–211. [Google Scholar] [CrossRef]
  27. Wang, S.; Zhang, Y.; Schuman, C.; Lecomte, J.-S.; Zhao, X.; Zuo, L.; Philippe, M.-J.; Esling, C. Study of twinning/detwinning behaviors of Ti by interrupted in situ tensile tests. Acta Mater. 2015, 82, 424–436. [Google Scholar] [CrossRef]
  28. Gurao, N.P.; Sethuraman, S.; Suwas, S. Evolution of Texture and Microstructure in Commercially Pure Titanium with Change in Strain Path During Rolling. Metall. Mater. Trans. A 2012, 44, 1497–1507. [Google Scholar] [CrossRef]
  29. Lin, B.; Ma, P.-C.; Li, H.-R.; Deng, S.-X.; Zeng, G.-J.; Tang, J.-G.; Li, J.-F.; Li, X.-W. Anisotropy of Al-Li alloy plate and its heredity effect in mechanical property distribution of spun-dome. Trans. Nonferrous Met. Soc. China 2023, 33, 1318–1330. [Google Scholar] [CrossRef]
  30. Zhong, Y.; Yin, F.; Nagai, K. Role of deformation twin on texture evolution in cold-rolled commercial-purity Ti. J. Mater. Res. 2011, 23, 2954–2966. [Google Scholar] [CrossRef]
  31. Wang, T.; Liu, W.; Liu, Y.; Wang, Z.; Ignatov, A.V.; Huang, Q. Formation mechanism of dynamic multi-neutral points and cross shear zones in corrugated rolling of Cu/Al laminated composite. J. Mater. Process. Technol. 2021, 295, 117157. [Google Scholar] [CrossRef]
Figure 1. (a) Microstructure of original TA1 titanium plate; (b) double corrugated roll + flat roll rolling diagram.
Metals 14 01242 g001
Figure 2. Size diagram of tensile specimen.
Metals 14 01242 g002
Figure 3. Microstructures at different positions of DCR and FR at 400 °C: (a) DCR-A (near the upper crest); (b) DCR-B (the middle of the upper crest); (c) DCR-C (near the upper trough); (d) DCR-D (the middle of the upper trough); (e) FR-E (near the upper surface); (f) FR-F (the middle of the sheet).
Metals 14 01242 g003
Figure 4. Microstructures at different positions of DCFR and FFR at 400 °C: (a) DCFR-A (near the upper crest); (b) DCFR-B (the middle of the upper crest); (c) DCFR-C (near the upper trough); (d) DCFR-D (the middle of the upper trough); (e) FFR-E (near the upper surface); (f) FFR-F (the middle of the sheet).
Metals 14 01242 g004
Figure 5. Microstructures at different positions of DCR and FR at 700 °C: (a) DCR-A (near the upper crest); (b) DCR-B (the middle of the upper crest); (c) DCR-C (near the upper trough); (d) DCR-D (the middle of the upper trough); (e) FR-E (near the upper surface); (f) FR-F (the middle of the sheet).
Metals 14 01242 g005
Figure 6. Microstructures at different positions of DCFR and FFR at 700 °C: (a) DCFR-A (near the upper crest); (b) DCFR-B (the middle of the upper crest); (c) DCFR-C (near the upper trough); (d) DCFR-D (the middle of the upper trough); (e) FFR-E (near the upper surface); (f) FFR-F (the middle of the sheet).
Metals 14 01242 g006
Figure 7. Tensile mechanical properties of DCFR and FFR titanium plates. (a) Mechanical properties of the TA1 plate in the RD and TD directions under diverse rolling processes at 400 °C; (b) mechanical properties of the TA1 plate in the RD and TD directions at various rolling processes at 700 °C.
Metals 14 01242 g007
Figure 8. Pole figures of DCFR and FFR titanium plates rolled in 400 °C: (a) DCR-A (near the upper crest); (b) DCR-B (the middle of the upper crest); (c) DCR-C (near the upper trough); (d) DCR-D (the middle of the upper trough); (e) FR-E (near the upper surface); (f) FR-F (the middle of the sheet).
Metals 14 01242 g008
Figure 9. Inverse pole figures of DCFR and FFR titanium plate rolling at 400 °C and annealing at 650 °C for 1 h: (a) DCFR-A (near the upper crest); (b) DCFR-B (the middle of the upper crest); (c) DCFR-C (near the upper trough); (d) DCFR-D (the middle of the upper trough); (e) FFR-E (near the upper surface); (f) FFR-F (the middle of the sheet).
Metals 14 01242 g009
Figure 10. Pole figures of DCFR and FFR titanium plate rolling at 400 °C and annealing at 650 °C for 1 h: (a) DCFR-A (near the upper crest); (b) DCFR-B (the middle of the upper crest); (c) DCFR-C (near the upper trough); (d) DCFR-D (the middle of the upper trough); (e) FFR-E (near the upper surface); (f) FFR-F (the middle of the sheet).
Metals 14 01242 g010
Figure 11. Pole figures of DCFR and FFR titanium plates rolled in 400 °C: (a) DCFR-A (near the upper crest); (b) DCFR-B (the middle of the upper crest); (c) DCFR-C (near the upper trough); (d) DCFR-D (the middle of the upper trough); (e) FFR-E (near the upper surface); (f) FFR-F (the middle of the sheet).
Metals 14 01242 g011
Figure 12. Inverse pole figures of DCFR and FFR titanium plate rolling at 700 °C and annealing at 650 °C for 1 h: (a) DCFR-A (near the upper crest); (b) DCFR-B (the middle of the upper crest); (c) DCFR-C (near the upper trough); (d) DCFR-D (the middle of the upper trough); (e) FFR-E (near the upper surface); (f) FFR-F (the middle of the sheet).
Metals 14 01242 g012
Figure 13. Pole figures of DCFR and FFR titanium plate rolling at 700 °C and annealing at 650 °C for 1 h: (a) DCFR-A (near the upper crest); (b) DCFR-B (the middle of the upper crest); (c) DCFR-C (near the upper trough); (d) DCFR-D (the middle of the upper trough); (e) FFR-E (near the upper surface); (f) FFR-F (the middle of the sheet).
Metals 14 01242 g013
Figure 14. ODF of DCFR and FFR titanium plates rolled in 400 °C: (a) DCFR-A (near the upper crest); (b) DCFR-B (the middle of the upper crest); (c) DCFR-C (near the upper trough); (d) DCFR-D (the middle of the upper trough); (e) FFR-E (near the upper surface); (f) FFR-F (the middle of the sheet).
Metals 14 01242 g014
Figure 15. Specific locations of several typical textures in the titanium rolling process within the ODF cross-section diagram.
Metals 14 01242 g015
Table 1. Element composition of TA1 alloy.
ElementsTiFeCNHO
at. %99.6960.030.080.030.0140.15
Table 2. Statistical Table for Yield Strength, Tensile Strength, and Elongation.
σ0.2 (MPa)σs (MPa)δ (%)
400 DCFR-RD446.3 ± 13.4458.5 ± 13.814.1 ± 0.4
400 DCFR-TD445.2 ± 13.4455.2 ± 13.715.5 ± 0.5
400 FFR-RD442.4 ± 13.3451.2 ± 13.525.6 ± 0.7
400 FFR-TD427.7 ± 12.8436.5 ± 13.116.8 ± 0.5
700 DCFR-RD381.2 ± 11.4389.4 ± 11.711.1 ± 0.3
700 DCFR-TD353.9 ± 10.6360.6 ± 10.814.8 ± 0.4
700 FFR-RD396.2 ± 11.9404.5 ± 12.125.5 ± 0.8
700 FFR-TD386.3 ± 11.6393.6 ± 11.820.8 ± 0.6
Table 3. Vickers hardness of each plate.
Original TA1 Sheet400 DCFR400 FFR700 DCFR700 FFR
Vickers hardness/HV142.2 ± 4.1165 ± 4.9160 ± 4.8155 ± 4.6155 ± 4.5
Table 4. IPA of the material’s yield strength and plasticity.
IPAσ0.2IPAδ
400 DCFR0.0030.099
400 FFR0.0330.344
700 DCFR0.0720.333
700 FFR0.0240.184
Table 5. Texture type of DCFR and FFR titanium plates rolled in 400 °C.
Texture Type
400 DCFR-A(8 °, 30 °, 0 °)
400 DCFR-B(25 °, 25 °, 0 °) and (10 °, 25 °, 30 °)
400 DCFR-C(20 °, 20 °, 0 °) and (30 °, 15 °, 30 °)
400 DCFR-D(30 °, 20 °, 0 °) and (15 °, 20 °, 30 °)
400 FFR-E(8 °, 30 °, 0 °)
400 FFR-F(10 °, 30 °, 0 °) and (15 °, 25 °, 30 °)
Disclaimer/Publisher’s Note: The statements, opinions and data contained in all publications are solely those of the individual author(s) and contributor(s) and not of MDPI and/or the editor(s). MDPI and/or the editor(s) disclaim responsibility for any injury to people or property resulting from any ideas, methods, instructions or products referred to in the content.

