Article

Enhancing the Strength and Toughness of A356.2-0.15Fe Aluminum Alloy by Trace Mn and Mg Co-Addition

1
School of Energy and Mechanical Engineering, Dezhou University, Dezhou 253023, China
2
Institute of Metal Research, Chinese Academy of Sciences, Shenyang 110016, China
3
School of Materials Science and Engineering, University of Science and Technology of China, Shenyang 110016, China
*
Author to whom correspondence should be addressed.
Metals 2023, 13(8), 1451; https://doi.org/10.3390/met13081451
Submission received: 23 July 2023 / Revised: 9 August 2023 / Accepted: 10 August 2023 / Published: 12 August 2023

Abstract

:
In the present work, microalloying is put forward to improve the microstructure and tensile properties of A356.2-0.15Fe (wt.%) alloy by the co-addition of trace Mn and Mg. A suitable Mn/Fe mass ratio of 0.5 is obtained for alloys with 0.15Fe. The yield strength, ultimate tensile strength, and elongation of the A356.2-0.15Fe alloy with an Mn/Fe ratio of 0.5 and containing 0.42 wt.% Mg is 179 MPa, 286 MPa, and 9.1%, respectively, which is acceptable for automotive wheel hub applications. Optical microscopy (OM), scanning electron microscopy (SEM), transmission electron microscopy (TEM), X-ray diffraction (XRD), and electron-probe microanalyzer (EPMA) methods are used to characterize the microstructure of the alloys. The results indicate that Mn addition promotes the transformation of the acicular β-Al5FeSi phase to the block-shaped α-Al(Fe, Mn)Si phase. The ratio of length/width of the Fe-rich phase in the alloy is reduced by 78.8% with an Mn/Fe ratio of 0.5 and containing 0.35 wt.% Mg, compared with that of the alloy without Mn addition and containing 0.35 wt.% Mg. The addition of Mg reduces the secondary dendrite arm spacing (SDAS) from 26.1 μm to 20.9 μm. The volume fraction of the precipitated Mg2Si phase in the alloy containing 0.42 wt.% Mg increases by 60% compared with that in the alloy containing 0.35 wt.% Mg. The morphology transformation of the Fe-rich phase, the reduction of SDAS, and the increase in volume fraction of precipitated Mg2Si phase comprehensively contribute to the improvement of A356.2-0.15Fe alloy. The microstructure evolution mechanism and the effect of microstructure on tensile properties are analyzed and discussed.

1. Introduction

The Al-7.0Si-0.35Mg (A356.2) alloy is a type of cast Al alloy, which is extensively used in the aerospace and automotive industry due to its advantages of low density, good castability, high corrosion resistance, satisfactory mechanical properties, and excellent thermal conductivity [1,2,3]. According to the American Aluminum Association standard, A356.2 alloys with Fe content less than 0.12 wt.% can achieve appropriate comprehensive mechanical properties. However, the policy of energy-saving and environmental protection drives the recovery and remelting of aluminum alloys. To cope with limited global resources and environmental issues, an increasing number of electrolytic Al have been replaced by recycled Al scraps. The content of Fe in alloys produced in the remelting process is often higher than 0.12 wt.% owing to the high Fe content in the iron tools and the recycled aluminum alloys. Fe is an inevitable and harmful impurity present in recycled Al alloys. As the main impurity element in the A356.2 alloy, Fe consists in the acicular β-Al5FeSi phase during the solidification process [4,5]. The plate-like or acicular β-Al5FeSi phase mainly distributes at the grain boundaries and the grain interior, which intensifies the stress concentration and reduces the tensile properties of A356.2 alloy [6,7,8,9,10].
In order to reduce the influence of Fe content on the mechanical properties of A356.2 alloy, two main methods have been devoted in these years. One is to physically remove or separate the Fe element through sedimentation, centrifugation, or magnetic separation [11,12]. For example, the Fe-rich phase is mainly concentrated at the bottom of the alloy by Sn addition, and the Fe content is reduced significantly [13]. The interface between the β-Sn phase and the Fe-rich phase is coherent. The β-Sn in molten Al can be attached to the surface of the Fe-rich phase so that the Fe-rich phase can be settled to the bottom of the melt under the effect of gravity. Currently, not only the removal or separation efficiency of the Fe-rich phase is insufficient, but also reducing the content of Fe in the melt will increase the production cost. The other is microalloying, which is a relatively simple and effective way to modify the microstructure and improve the tensile properties of A356.2 alloys with a high content of Fe. Recent reports have established that trace addition of elements can transform the morphology of the Fe-rich phase from an acicular into block-shaped, remarkably improving the mechanical properties of aluminum alloys with a high content of Fe. The selected elements include single non-RE elements, single RE elements, and co-added elements. Lin et al. reported that the microstructure of the β-Al5FeSi phase in the A356.2-1.5Fe was effectively refined by V addition [14]. When 0.8 wt.% V was added, the largest amount of the acicular β-Al5FeSi phase was transformed into the block-shaped α-Al(Fe, Mn)Si phase, which contributes to improving the mechanical properties. As reported by Zhang and Sanchez et al., Mn addition played an effective role in refining the microstructure of the β-Al5FeSi phase in Fe-rich aluminum alloy [15,16]. Song et al. investigated the influence of B on the formation of the Fe-rich phase in Al-Fe-Si alloy. The results indicated that the addition of B was beneficial to the reduction of the initial formation temperature of the Fe-rich phase in alloys containing high levels of Fe, which contributed to refining and inhibiting the growth of the primary Fe-rich phase [17]. The trace addition of rare earth elements such as Nd [18], Y [19], and Ce [20] also modified the morphology of the β-Al5FeSi phase. For example, the addition of Ce element refined the microstructure, reduced the volume fraction of the Fe-rich phase, and promoted the conversion of β-Fe to α-Fe, which contributed to obtaining higher elongation compared with the alloy without Ce addition [20]. Moreover, the morphology of the β-Al5FeSi phase was also changed by the co-addition of Mn and Cr [21]. The addition of 0.13 wt.% Mn and 0.13 wt.% Cr converted the acicular β-Al5FeSi phase into the bulk α-Al(Fe, Mn)Si phase, greatly enhancing the tensile properties of A356-0.2Fe alloys. Zou et al. investigated the influence of the combined addition of Mn and Mo [22]. The results indicated that the combined addition of Mn and Mo refined the α-Al(FeMn)Si phase and promoted the formation of Chinese-script-like α-Al(FeMnMo)Si, which helped to improve the mechanical performances. The combined addition of Mn and B was investigated, and the results indicated that a Chinese-script iron-rich phase with consistent morphology and uniform distribution was obtained [23]. Among all the elements that modify the β-Al5FeSi phase, Mn is the cheapest and most widely used in the industry. However, for alloys with different content of Fe, the optimal addition amount of Mn is different.
The mechanical properties of alloys will also be improved by phase transformation or precipitated phase formation [24,25,26]. Mg was reported to play an active part in the strengthening of A356.2 alloys [27]. The study by Salleh et al. [28] indicated that the grain size of the primary α-Al phase and the morphology of the eutectic Si phase were adequately refined by Mg addition. As reported by Yamamoto et al. [29], the yield strength and ultimate tensile strength were all enhanced by Mg addition for T5-treated Al-7Si alloys. In addition, the modification effect of Ce on A356-0.20Fe alloy was enhanced because of Mg addition [30]. However, the addition of excessive Mg will reduce the tensile properties of the alloy due to the formation of the eutectic Mg2Si phase [31]. It is needed to control the Mg content in the A356.2 alloy.
The Fe content in A356.2 alloy for a wheel hub is required to be less than 0.12 wt.%. When the Fe content is higher than this value, the mechanical properties of the alloy would be significantly reduced. In order to improve the strength and toughness of the A356.2 alloy with a high content of Fe simultaneously. The combined addition of elements will have a better effect on the mechanical properties of the alloy. In this paper, the effect of trace Mn with different Mn/Fe ratios on the microstructure evolution of A356.2-0.15Fe alloy containing a fixed Mg content is studied first. Then, to further improve the strength of the alloy, the influence of Mg on the microstructure and tensile properties of A356.2-0.15Fe alloy with an optimal Mn/Fe ratio is investigated. Based on these experiment results, the role of Mn and Mg in the A356.2-0.15Fe alloy is analyzed and discussed.

2. Materials and Methods

The studied alloy ingots were prepared using high-purity Al-containing 0.09–0.10 wt.% Fe, Mg (≥99.9 wt.%), and intermediate alloys Al-24Si, Al-10Fe, Al-24Mn, Al-10Ti, Al-10Sr, and Al-5Ti-1B. Firstly, the high-purity Al, Al-24Si, Al-10Fe, Al-24Mn, and Al-10Ti were melted at 750 °C in a graphite crucible. Then, the flowing Ar gas was blown in the melt for 5 min when the melt temperature decreased to 730 °C. Subsequently, the Mg, Al-10Sr, and Al-5Ti-1B were added to the melt followed by mechanical stirring for 30 s to ensure homogenization. Finally, the melt was poured into a permanent steel mold preheated to 250 °C when the melt cooled to 700 °C. The actual chemical compositions of the solidified alloys are shown in Table 1. All samples were subjected to a T6 heat treatment, including a solution treatment at 540 °C for 6 h followed by quenching in hot water at 70–90 °C, and an aging treatment at 130 °C for 3.5 h.
The specimens for microstructure characterization were ground with SiC paper up to 5000 grit, polished with 2.5 μm diamond paste, and then etched with 0.5 vol.% HF aqueous solution for 12 ± 1 s. The microstructure was examined by optical microscopy (OM, Axio Observer.Z1m, CARL ZEISS, Jena, Germany) and scanning electron microscopy (SEM, JSM-7001F, JEOL, Tokio, Japan) equipped with energy dispersive spectrometry (EDS, X-Max, OXFORD, Oxford, UK) operated at 20 kV. In order to analyze the nanoscale precipitated phase, transmission electron microscopy (TEM, JEM-2100EX, JEOL, Tokio, Japan) was used. The TEM specimen preparation process is as follows: (1) a thin slice with a thickness of 1 mm was cut using wire cutting equipment; (2) the slice was ground down to 60–80 μm using SiC paper; (3) use the punching instrument to obtain a disc with a diameter of 3 mm; (4) the disc was ground to 40~50 μm with 5000 SiC paper; (5) the center area of the disc was thinned to 10 μm thickness with pitting instrument (GATAN Inc., Warrendale, PA, USA); (6) the sample was thinned by precision ion etch instrument (RES101, LEICA, Wiztlar, Germany) equipped with LN2 cooling system to obtain the thin area of the sample. The secondary dendrite arm spacing (SDAS) was manually measured on micrographs using the linear intercept method, which involved counting the number of secondary arms that intersect a straight line drawn along a primary dendrite arm [32]. The volume fraction of the nanoscale precipitated phase was evaluated by the image analysis method according to ASTM E1245-03 [33]. The number of pictures used for statistics was 20 in this experiment. The phases were identified by X-ray diffraction (XRD, Philips-PW 1700, PHILIPS, Amsterdam, Netherlands) equipped with Cu Kα radiation at the scanning range from 15° to 85° and the scanning speed of 2° min−1. Element distribution of the alloy Ⅱ was measured by an electron-probe microanalyzer (EPMA, SHIMADZU-1610, SHIMADZU, Kyoto, Japan). For the tensile test, the dog-bone tensile specimens with a diameter of 5 mm and a gauge length of 25 mm were measured by a tensile testing machine (Zwick 150, Zwick/Roell, Ulm, Germany) equipped with an extensometer at room temperature with an initial strain rate of 3.0 × 10⁻³ s−1 according to the standard GB/T 228.1-2021 [34]. The load was continuously applied until the specimen fractured during the tensile test. The loads were simultaneously recorded and the strains were recorded by the extensometer. The tensile properties of the alloys were obtained from the average of three valid parallel samples.

3. Results and Discussion

3.1. Effect of Mn and Mg Co-Addition on Microstructure of A356.2-0.15Fe Alloys

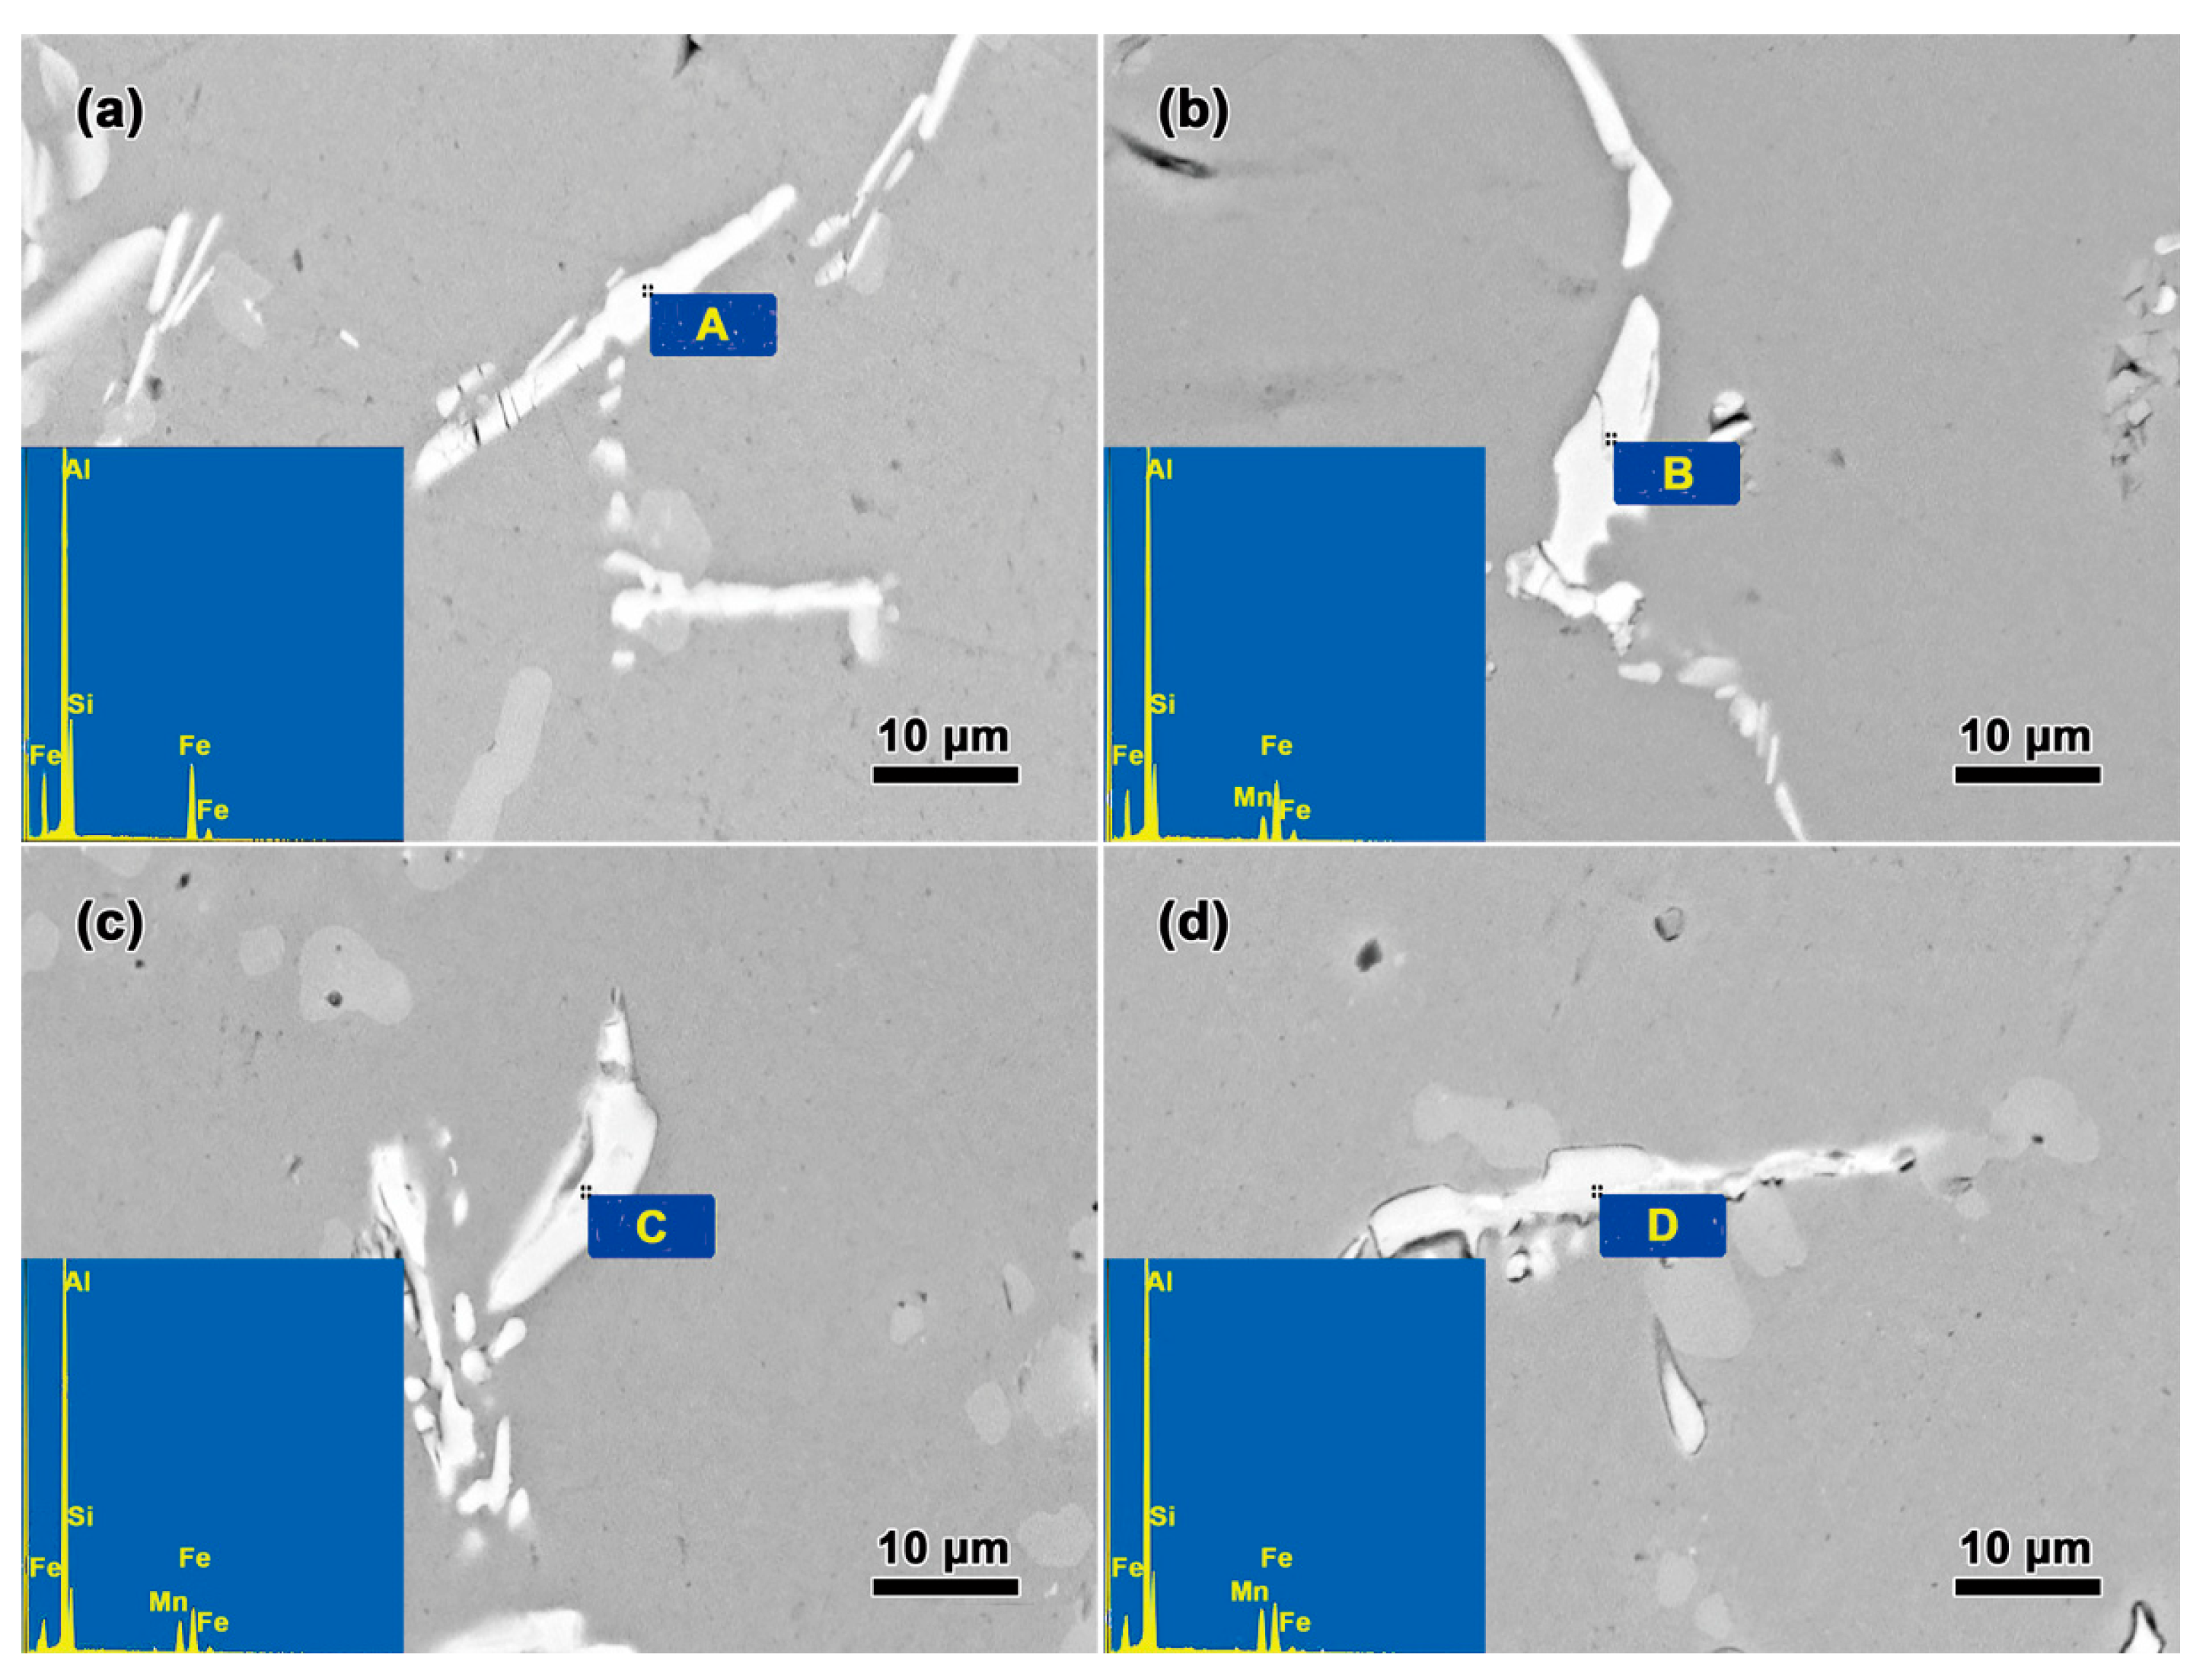
Figure 1 displays the XRD patterns of A356.2-0.15Fe alloys with an Mn/Fe ratio of 0 and 1.1. In the Mn-free alloy, the main phases are α-Al, eutectic Si, and β-Al5FeSi. In the alloy with an Mn/Fe ratio of 1.1, the α-Al(Fe, Mn)Si phase appears. In order to further study the influence of Mn on the β-Al5FeSi, The Fe-rich phases marked by A to D in samples with different Mn/Fe ratios are observed using SEM, and the EDS results are displayed in Table 2. The results demonstrate that the Fe-rich phase of Mn-free A356.2-0.15Fe alloys contains only Al, Si, and Fe elements, while the Fe-rich phase in Mn-containing A356.2-0.15Fe alloys comprises Al, Si, Mn, and Fe elements. Combine with the XRD analysis results, the Fe-rich phase in Mn-free A356.2-0.15Fe alloys is identified as the β-Al5FeSi phase, and the Fe-rich phase in A356.2-0.15Fe alloys containing Mn is identified as the α-Al(Fe, Mn)Si phase. While the composition of the α-Al(Fe, Mn)Si phase in A356.2-0.15Fe alloys with an Mn/Fe ratio of 0.5, 0.8, and 1.1 varies. As the content of Mn increases, the Mn content rises, and the Fe content decreases in the α-Al(Fe, Mn)Si phase.
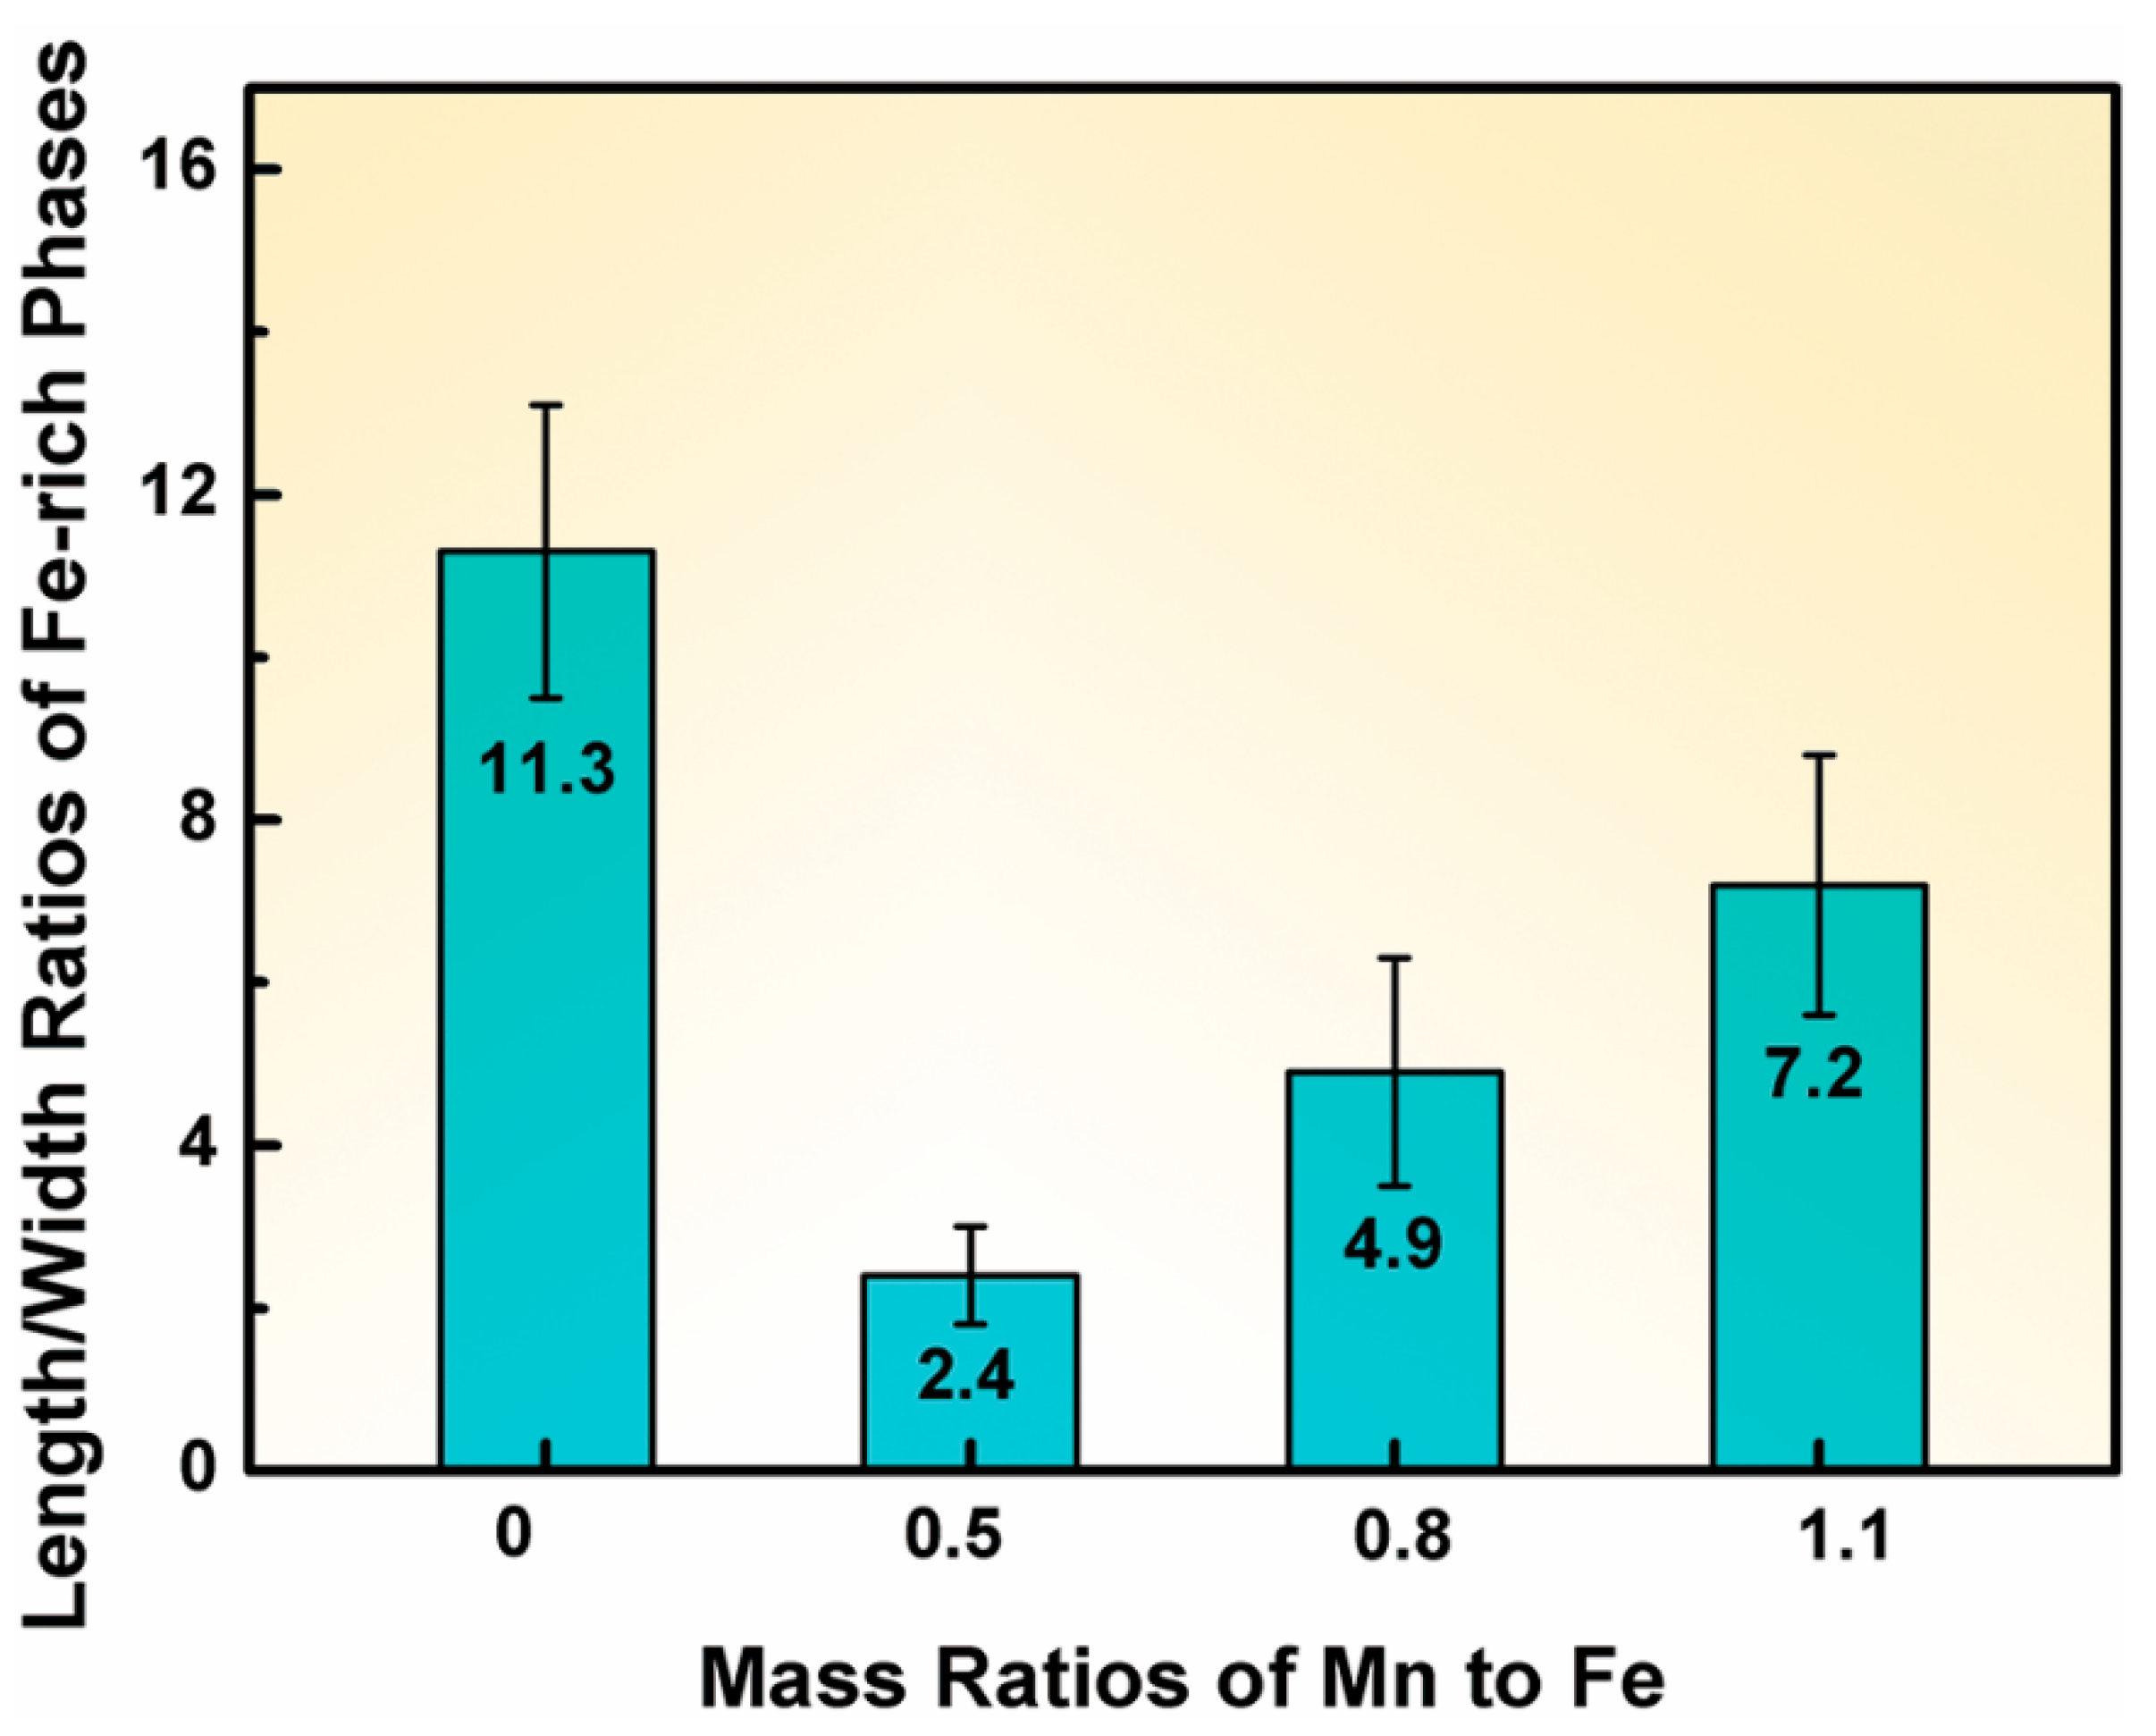
The Fe-rich phase is thin and acicular in Figure 2a, less acicular in Figure 2b,c, and long rod-shaped in Figure 2d. The length/width ratios (the length divided by width) of the Fe-rich phases in A356.2-0.15Fe alloys with an Mn/Fe ratio of 0, 0.5, 0.8, and 1.1 is 11.3, 2.4, 4.9, and 7.2, respectively (as shown in Figure 3), indicating that the addition of Mn changes the length/width ratio of the Fe-rich phase. The results of this study suggest that the minimum length/width ratios of the Fe-rich phase are achieved at an Mn/Fe ratio of 0.5.
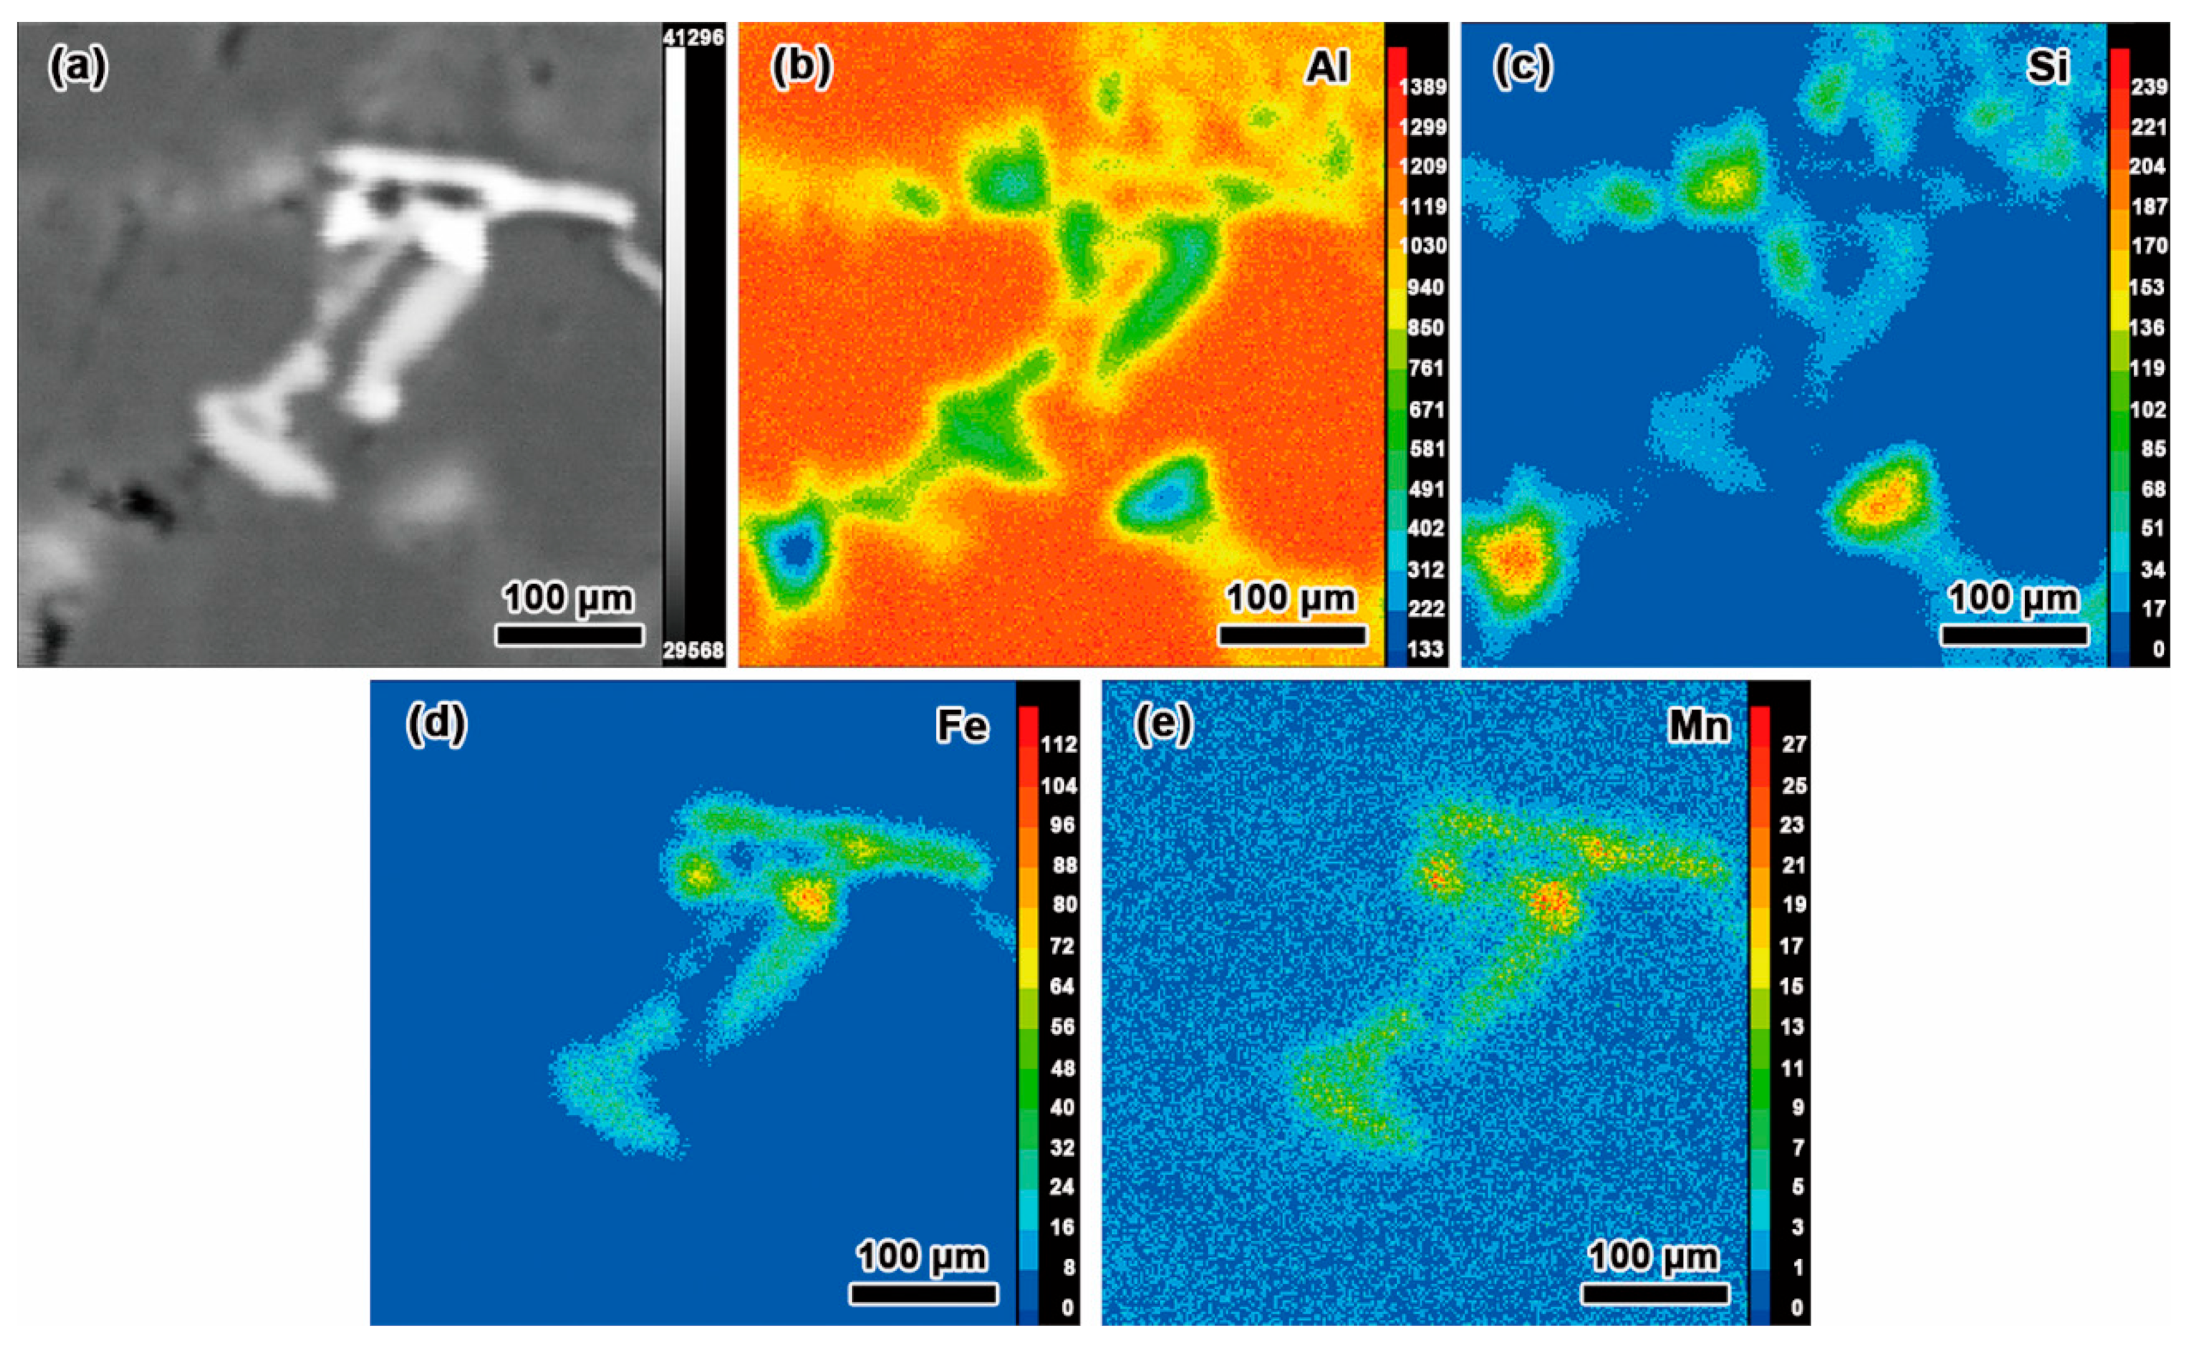
Generally, the β-Al5FeSi phase adopts a monoclinic crystal structure with the lattice parameters of a = 0.579 nm, b = 1.227 nm, c = 0.431 nm, and γ = 98.9° [35]. The morphology of the β-Al5FeSi phase tends to be acicular because of its special monoclinic crystal structure [36]. The whole area of Figure 4a is selected for the mapping scan. The mapping scan results of Al, Si, Fe, and Mn elements in A356.2-0.15 alloy with an Mn/Fe of 0.5 and containing 0.35 wt.% Mg are presented in Figure 4b–e, respectively. The element distribution in Figure 4d,e indicates that Fe and Mn atoms are all enriched in the α-Al(Fe, Mn)Si phase. Mn and Fe elements have similar physical and chemical properties, and the difference in the atomic radius between Mn and Fe is small (4%). Thus, the Fe element can be substituted easily by Mn during the growth of the β-Al5FeSi phase, resulting in the formation of the α-Al(Fe, Mn)Si phase. As more Mn is added to the melt, the content of Mn in the Fe-rich phase increases. It has been reported that the α-Al(Fe, Mn)Si phase has a BCC (Im3) or SC (Pm3) crystal structure [37], which depends on the content of Mn in the Fe-rich phase. Therefore, the α-Al(Fe, Mn)Si phase with a block-shaped morphology is easy to form because of its crystal structure.
As reported previously, the Fe-rich phase is a brittle phase with high strength and low plasticity [38]. During plastic deformation, the stress is easily concentrated around the Fe-rich phase, leading to the formation of a crack in the interface of the matrix and the Fe-rich phase. The modification of the Fe-rich phase would enhance the stress concentration resistance during the deformation process. Then there will be fewer crack sources due to the fracture of the Fe-rich phase, which contributes to a significant effect on improving the elongation of the alloy. Thus, the Mn/Fe ratio is set as 0.5 to maximize the toughness of the A356.2-0.15Fe alloy. In order to further improve the strength of the alloy, the influence of Mg on the microstructure and tensile properties of A356.2-0.15Fe alloy with an Mn/Fe ratio of 0.5 is investigated.
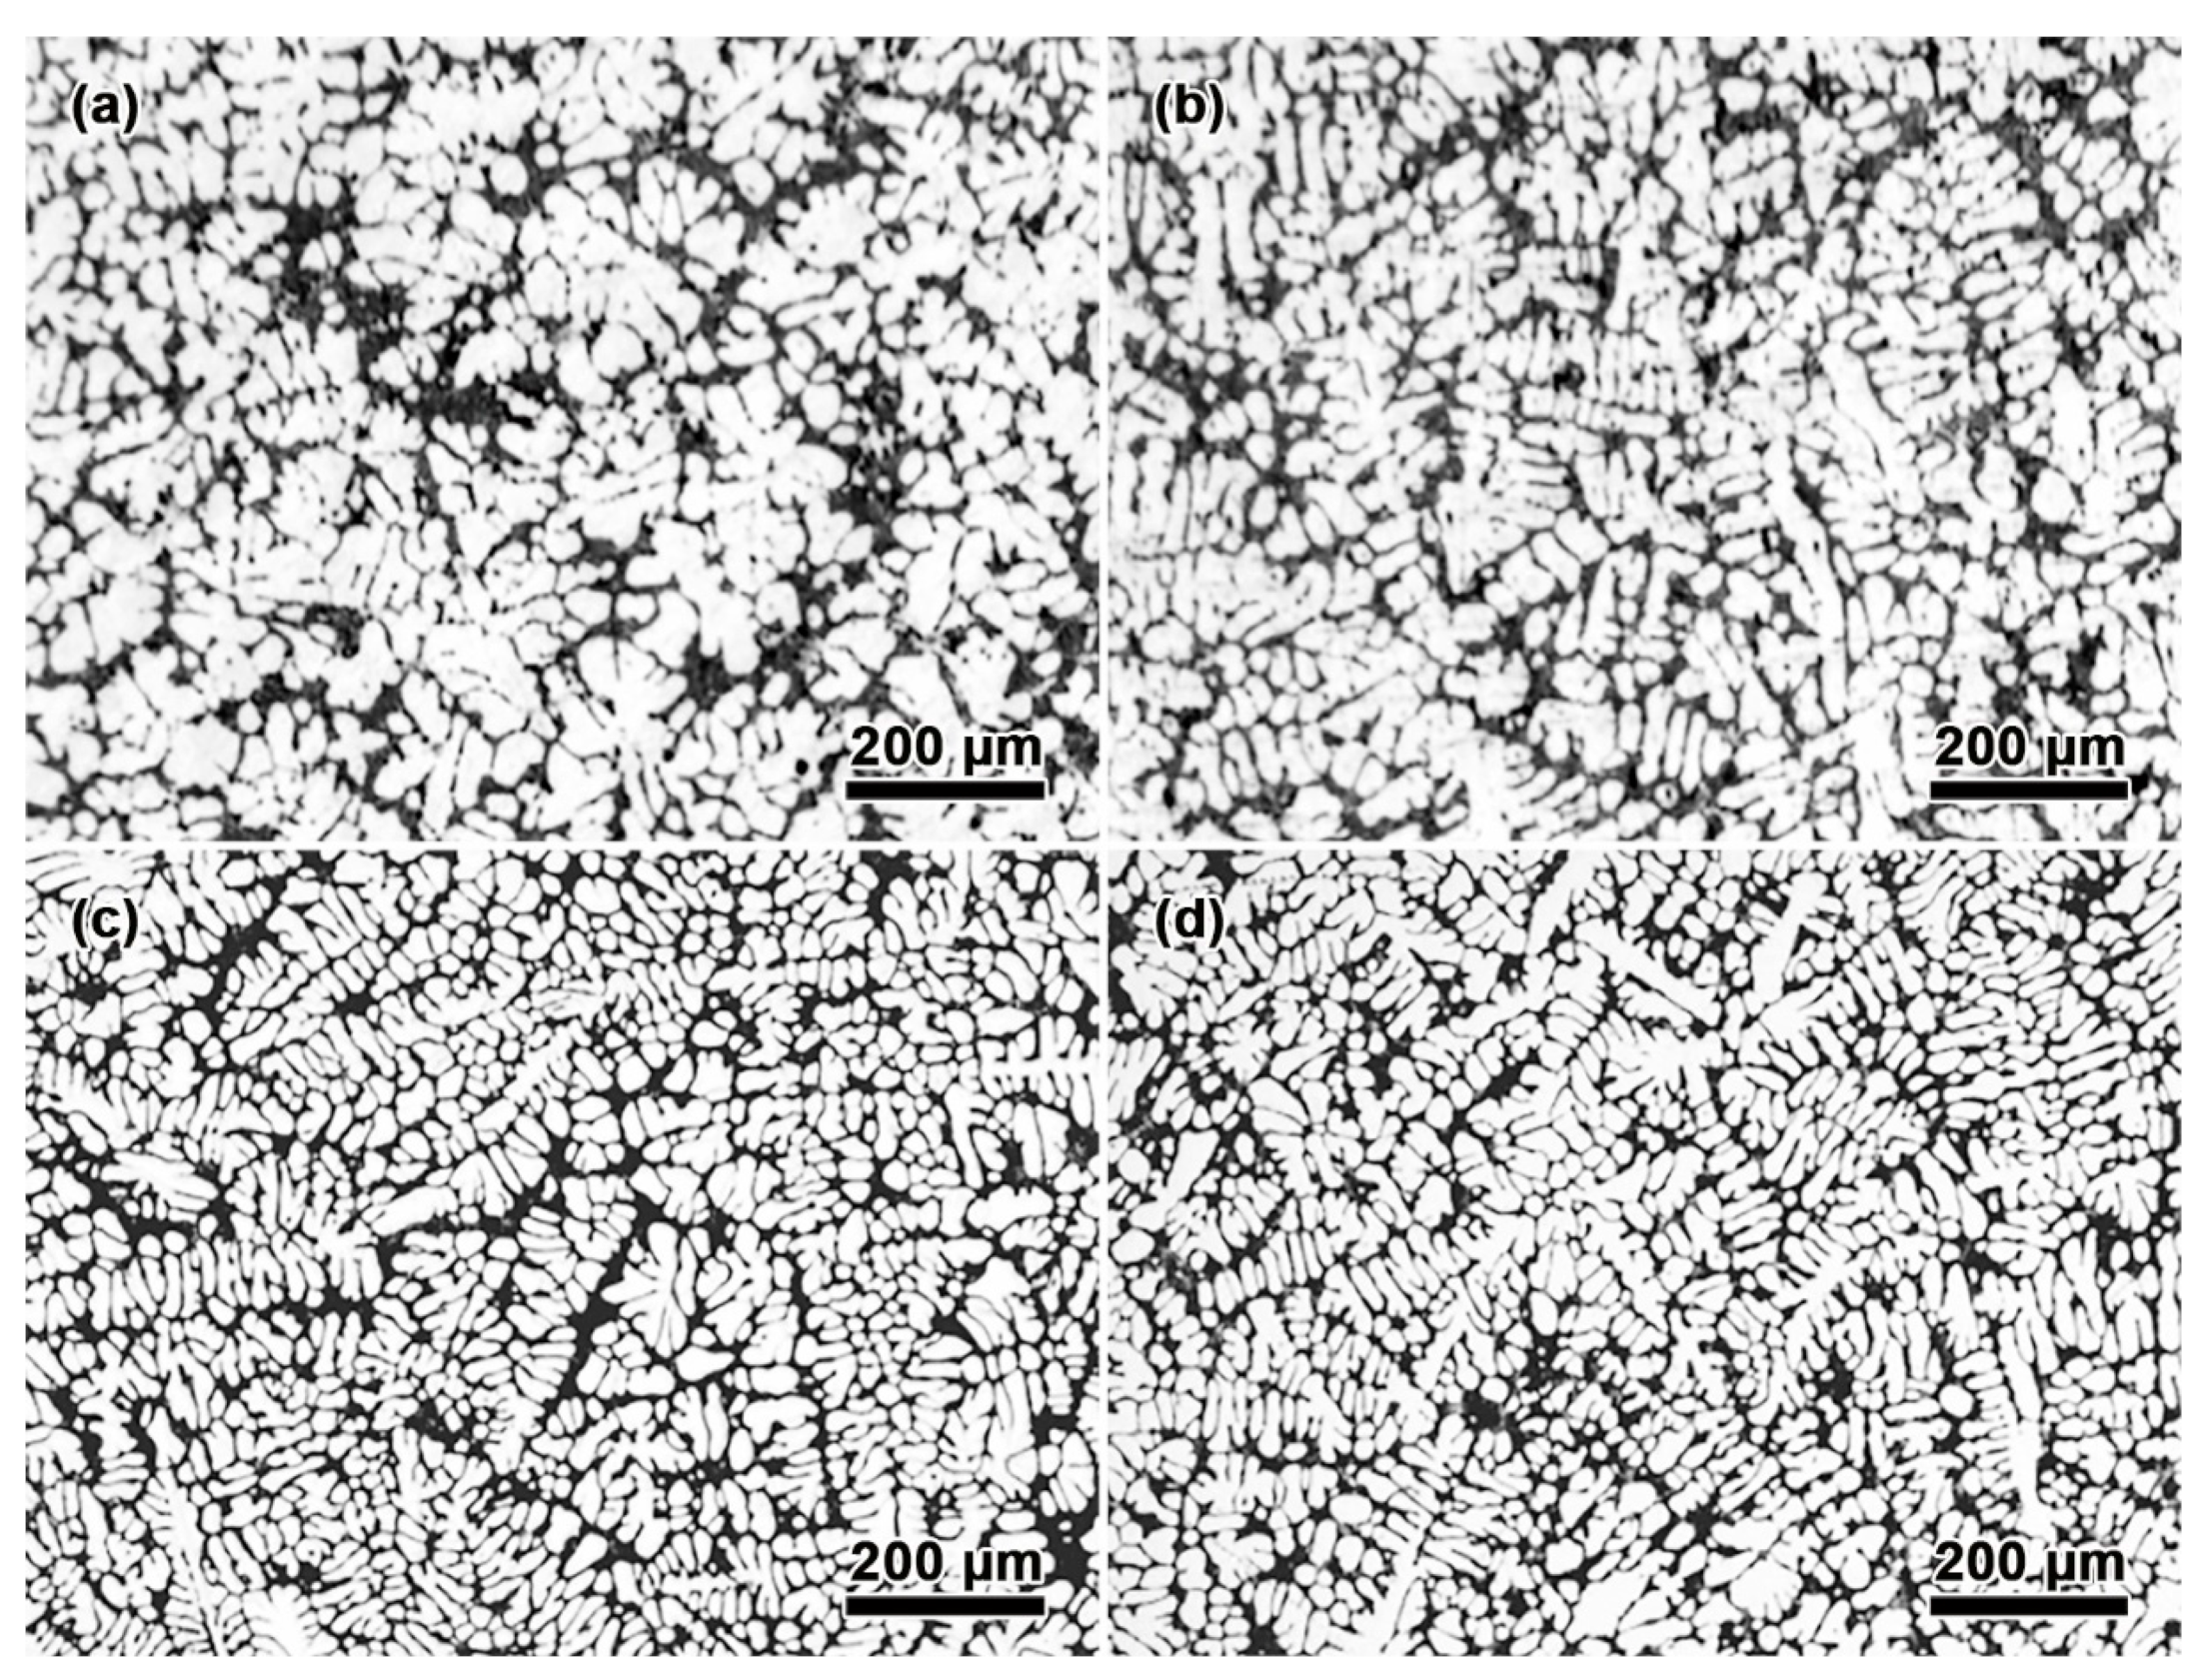
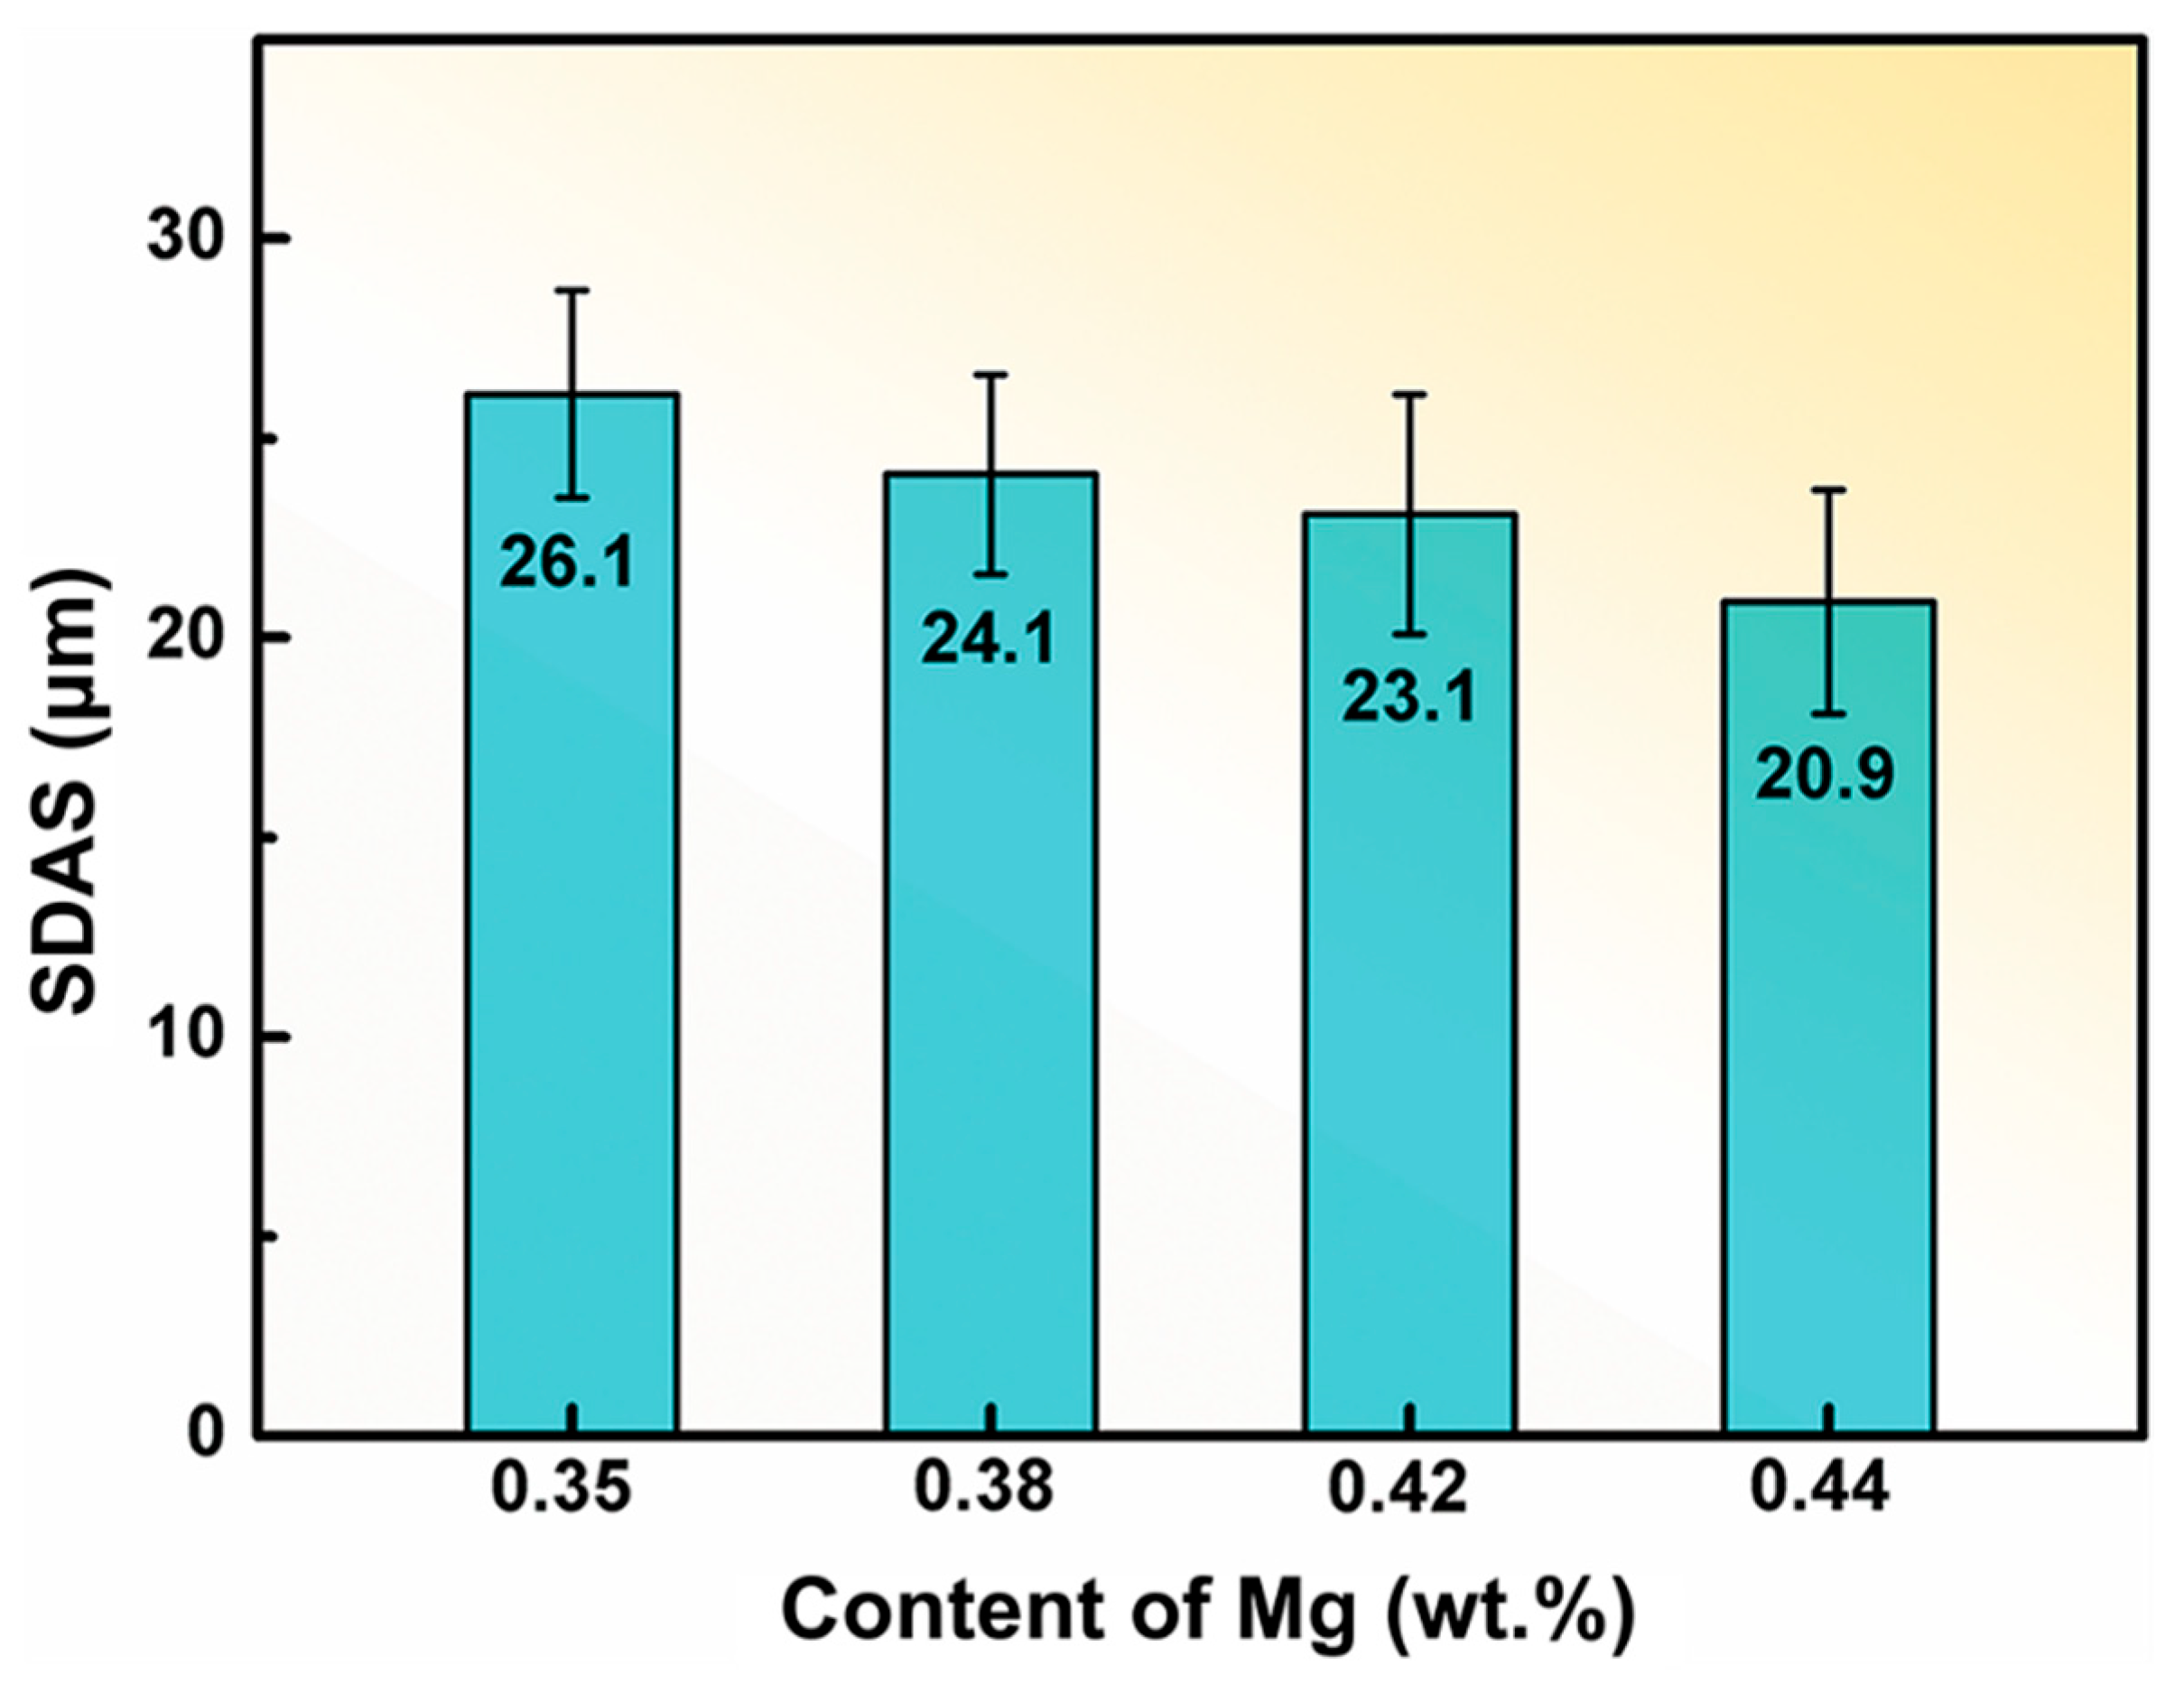
Figure 5 shows the optical micrographs of the as-cast A356.2-0.15Fe alloys containing an optimal Mn/Fe ratio while with different Mg content. The addition of Mg alters the α-Al phases from coarse equiaxed grains to fine equiaxed grains. Meanwhile, SDAS decreases gradually with increasing Mg content as displayed in Figure 6. As reported by Li et al. [39], the actual nucleation temperature of the α-Al phase decreased with the content of Mg increasing, which means that larger undercooling can be achieved with a higher content of Mg. The increased undercooling contributes to grain refinement and decreased SDAS.
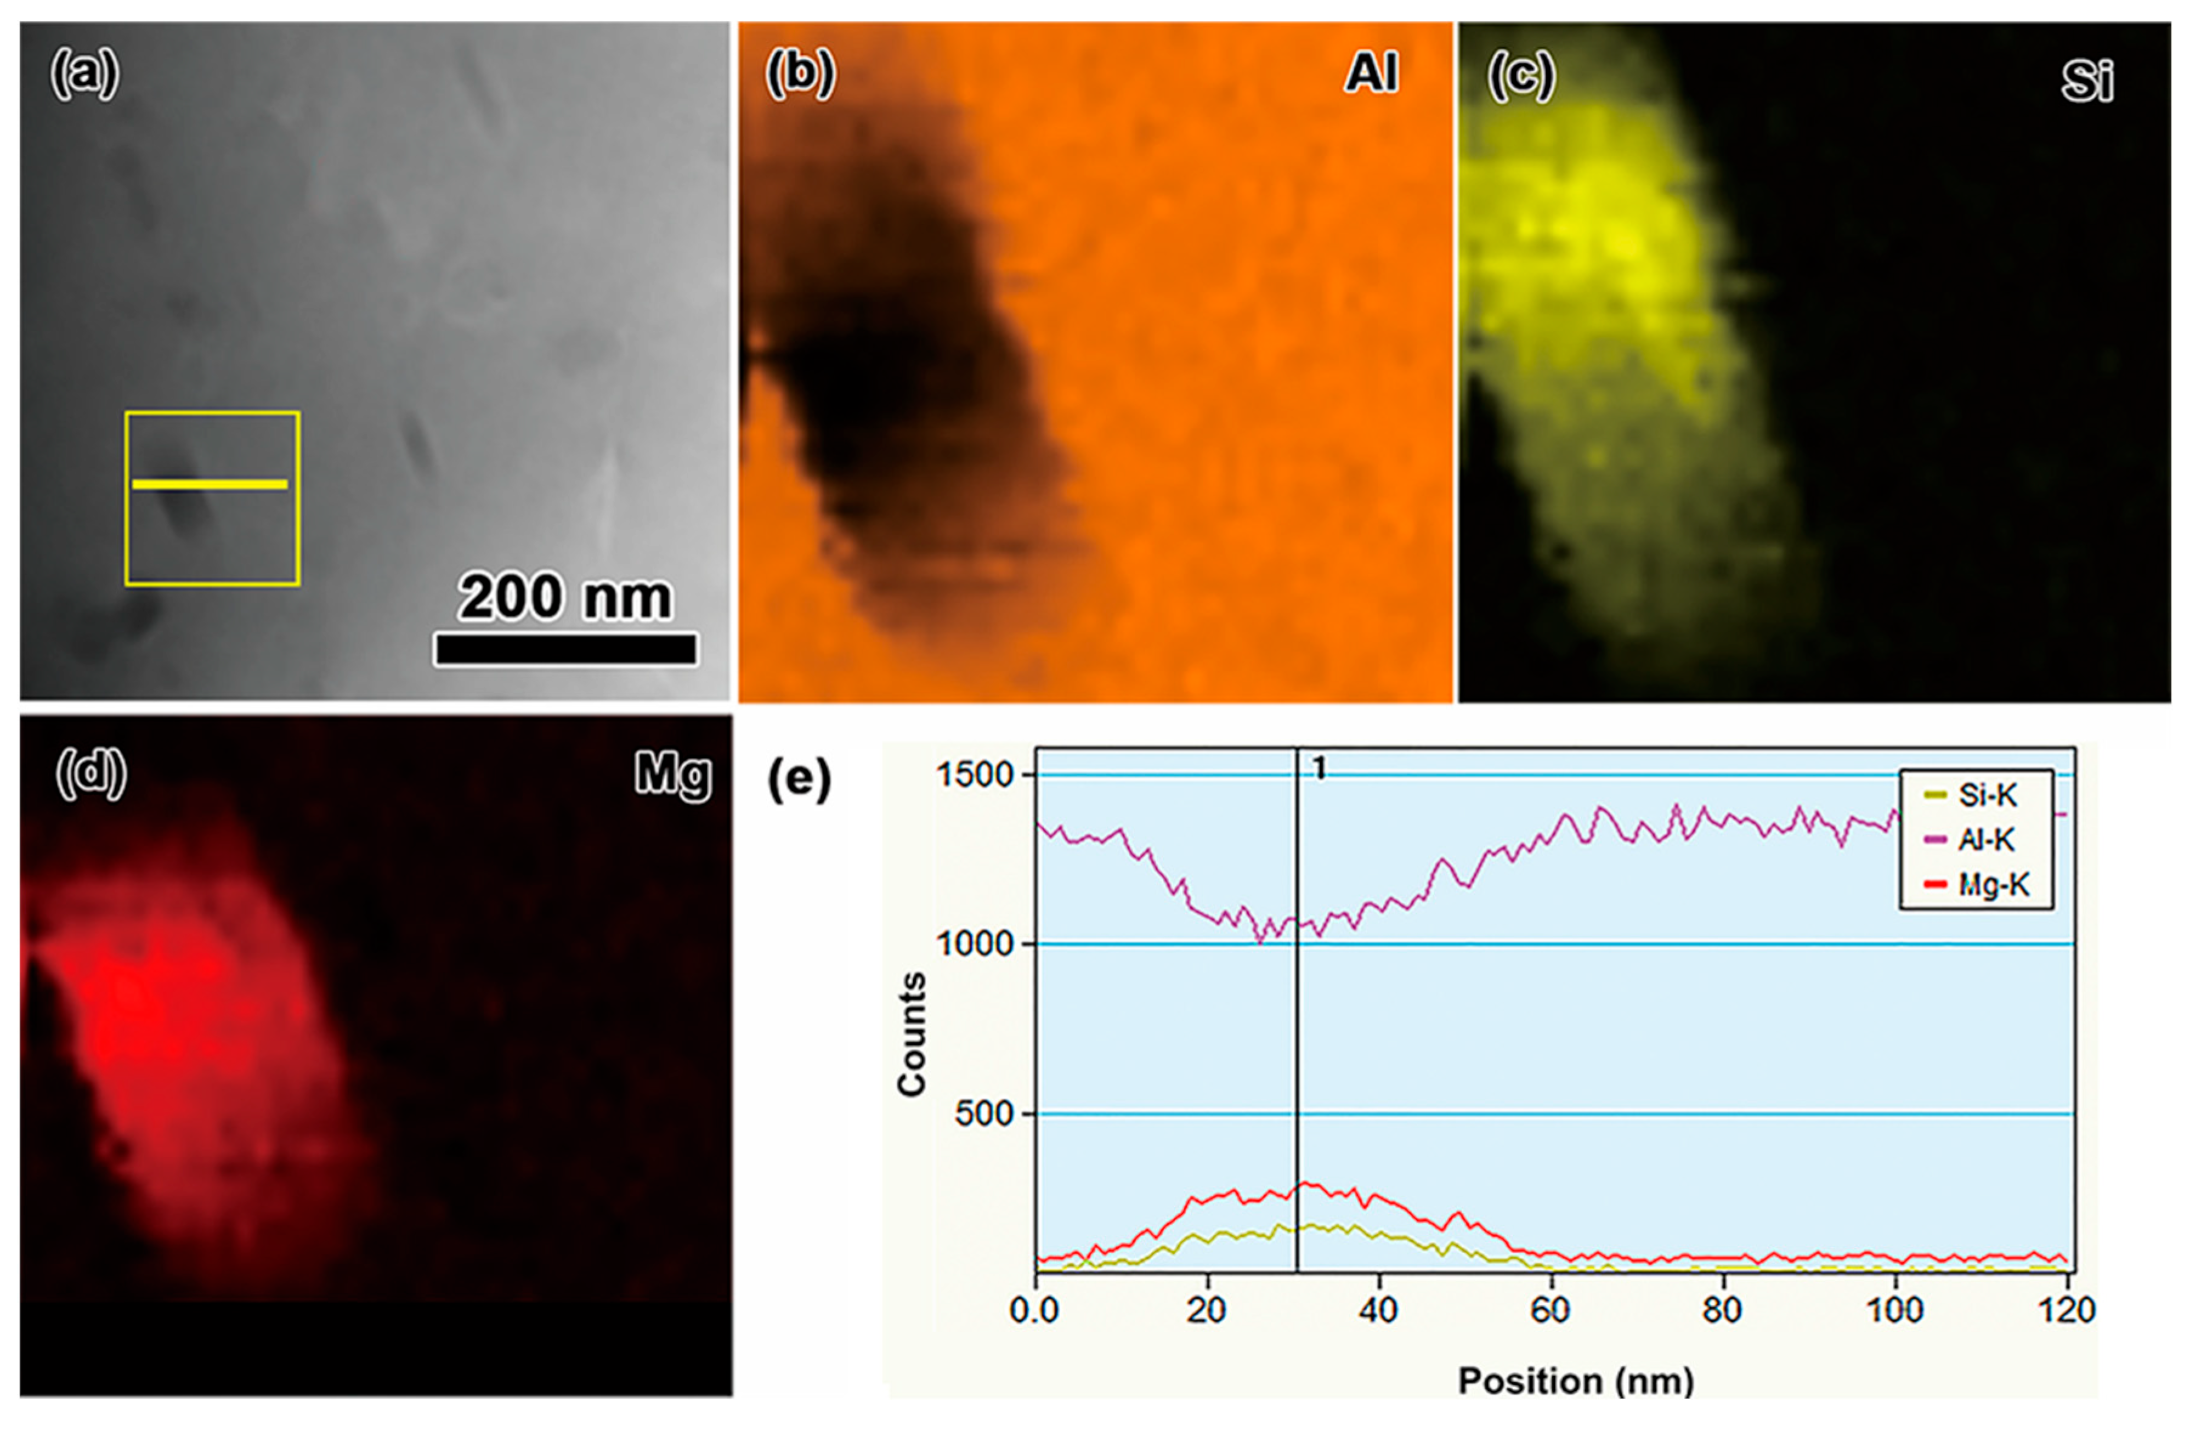
After T6 heat treatment, the addition of Mg also influences the fine precipitates in the alloys. In Figure 7, the area inside the saffron box in Figure 7a is selected for the mapping scan, and Figure 7b–d plot the mapping scan results of Al, Si, and Mg elements in the precipitated phase, respectively. As can be seen from the figures, Mg and Si elements are present in the precipitated phase. The composition of the precipitated phase was analyzed by linear scanning (the vertical line marked 1 in Figure 7e), which indicates that the atomic ratio of Mg and Si is 1.94. Thus, the composition of the precipitated phase in the alloy is Mg1.94Si, which is close to that of the Mg2Si phase.
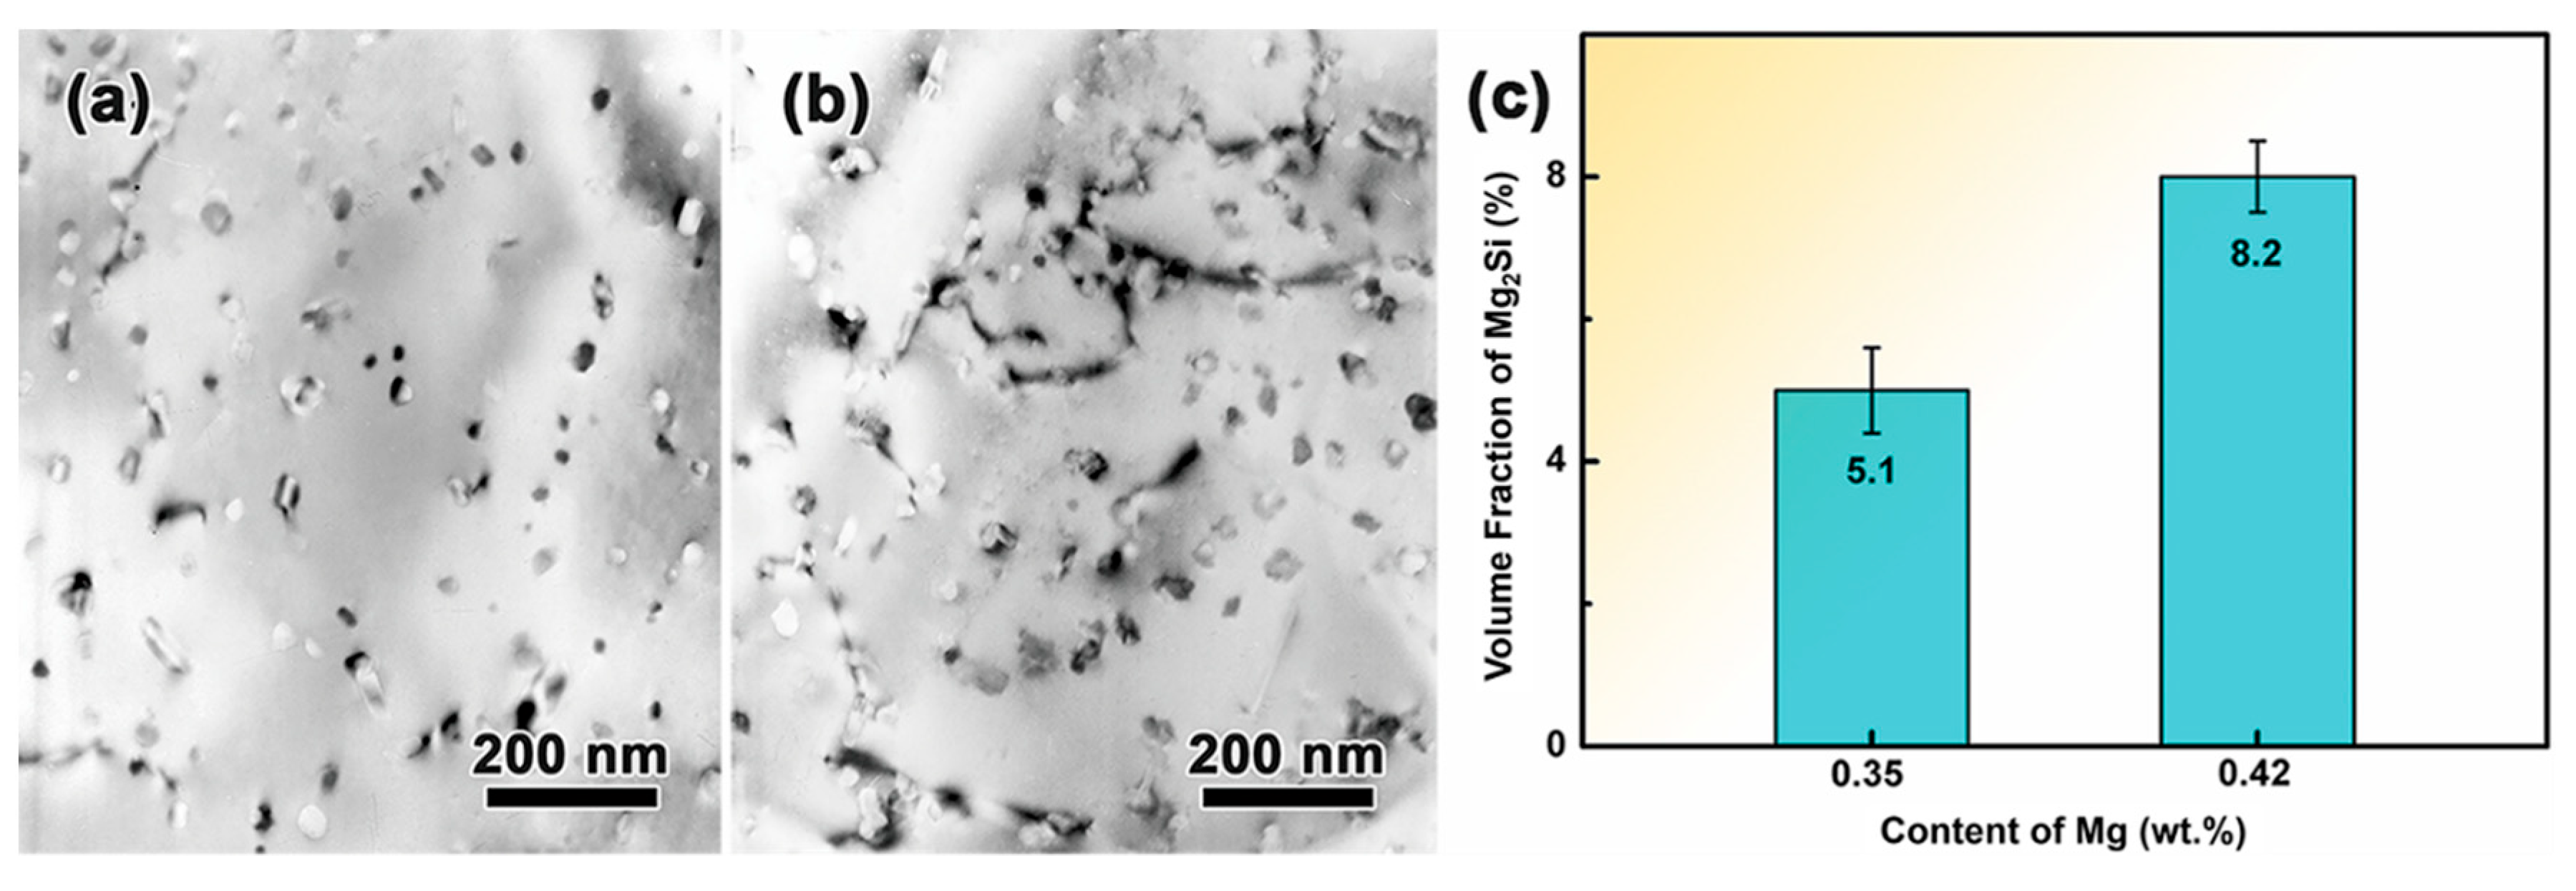
Bright-field micrographs of the precipitated phase in the alloys containing 0.35 wt.% and 0.42 wt.% of Mg are illustrated in Figure 8a,b, respectively. The incident beam direction is (110). The overall three-dimensional morphology of the precipitated phase is rod-shaped. The width of the bulk-shaped precipitated phase is 10–15 nm, and the length of the strip-like precipitated phase is 75–90 nm. The volume fraction of the precipitated phase (as displayed in Figure 8c) in the A356.2-0.15Fe alloy containing 0.42 wt.% Mg is about 8.2%, which is 60% higher than that (5.1%) of the alloy containing 0.35 wt.% Mg.

3.2. Effect of Mn and Mg Co-Addition on Tensile Properties of T6 Treated A356.2-0.15Fe Alloys

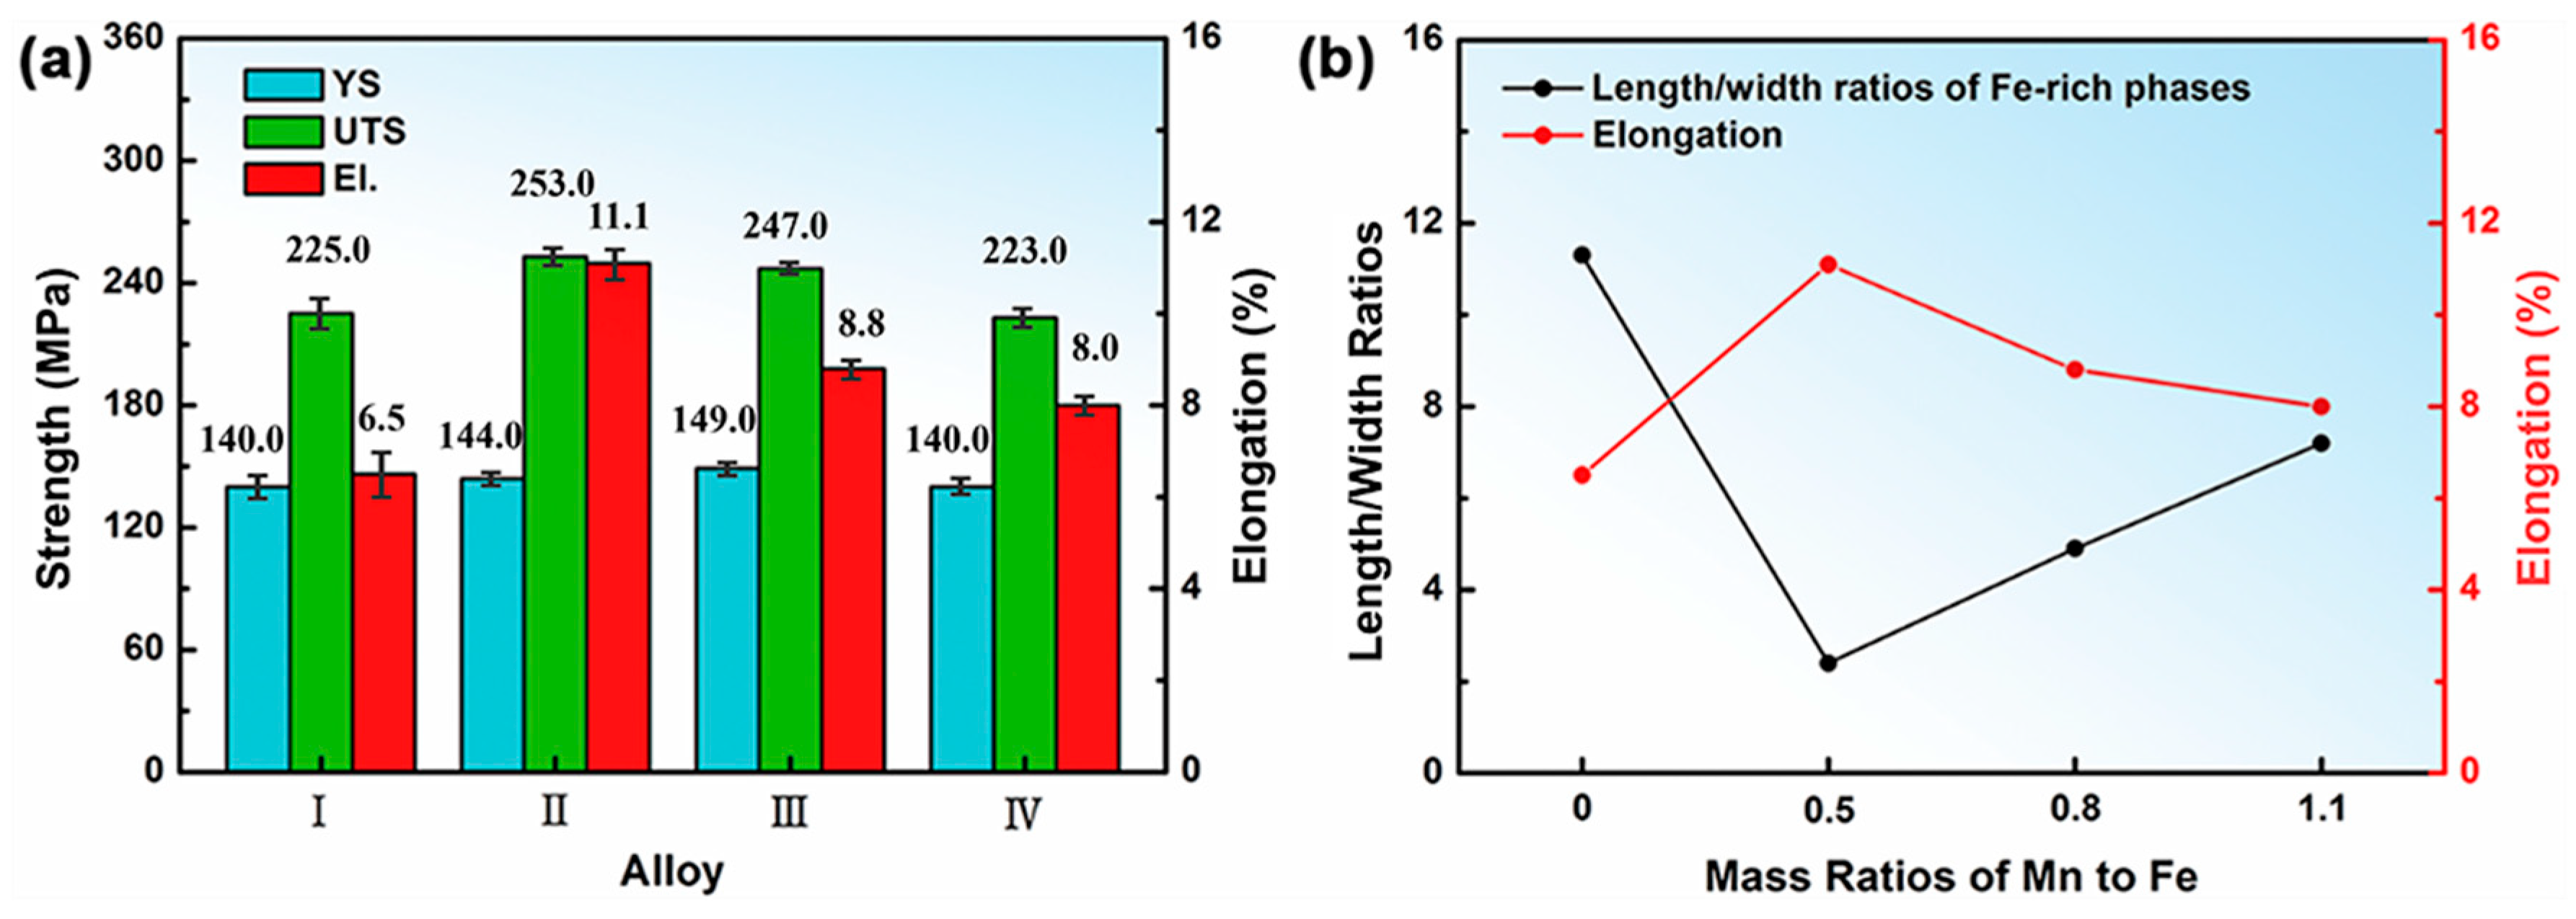
Figure 9 illustrates the tensile properties of T6 heat-treated A356.2 alloys with different Mn/Fe ratios and containing 0.35 wt.% Mg. The yield strength (YS), ultimate tensile strength (UTS), and elongation (El.) of A356.2-0.15Fe alloys with Mn/Fe of 0.5 are 2.9%, 12.4%, and 70.8% higher than that of Mn-free A356.2-0.15Fe alloys, respectively. The toughness is obviously improved due to the morphology change of the Fe-rich phase. The results reported by Eshaghi et al. [40] indicate that the length and length/width ratios of the Fe-rich phase in the aluminum alloy are reduced simultaneously after T6 heat treatment. While the law is the same in the as-cast state and T6 heat-treated state. The relationship between the length/width ratios of Fe-rich phases and elongation for A356.2-0.15Fe alloys with different Mn/Fe ratios is shown in Figure 9b, which indicates that the length/width ratios of Fe-rich phases versus Mn/Fe ratios are roughly the inverse of the elongation versus Mn/Fe ratios. As shown in Figure 2 and Figure 3, the Mn addition in A356.2-0.15Fe alloy changes the morphology of the Fe-rich phase obviously. And length/width ratio of the Fe-rich phase is reduced in different degrees due to Mn addition. When the length/width ratio of the Fe-rich phase is smaller, the modified Fe-rich phase can enhance the stress concentration resistance during the deformation process. Then the crack sources will be fewer caused by the fracture of the Fe-rich phase. Therefore, the smaller the aspect ratio of the Fe-rich phase is achieved, the higher elongation is obtained in A356.2-0.15Fe alloy with different content Mn.
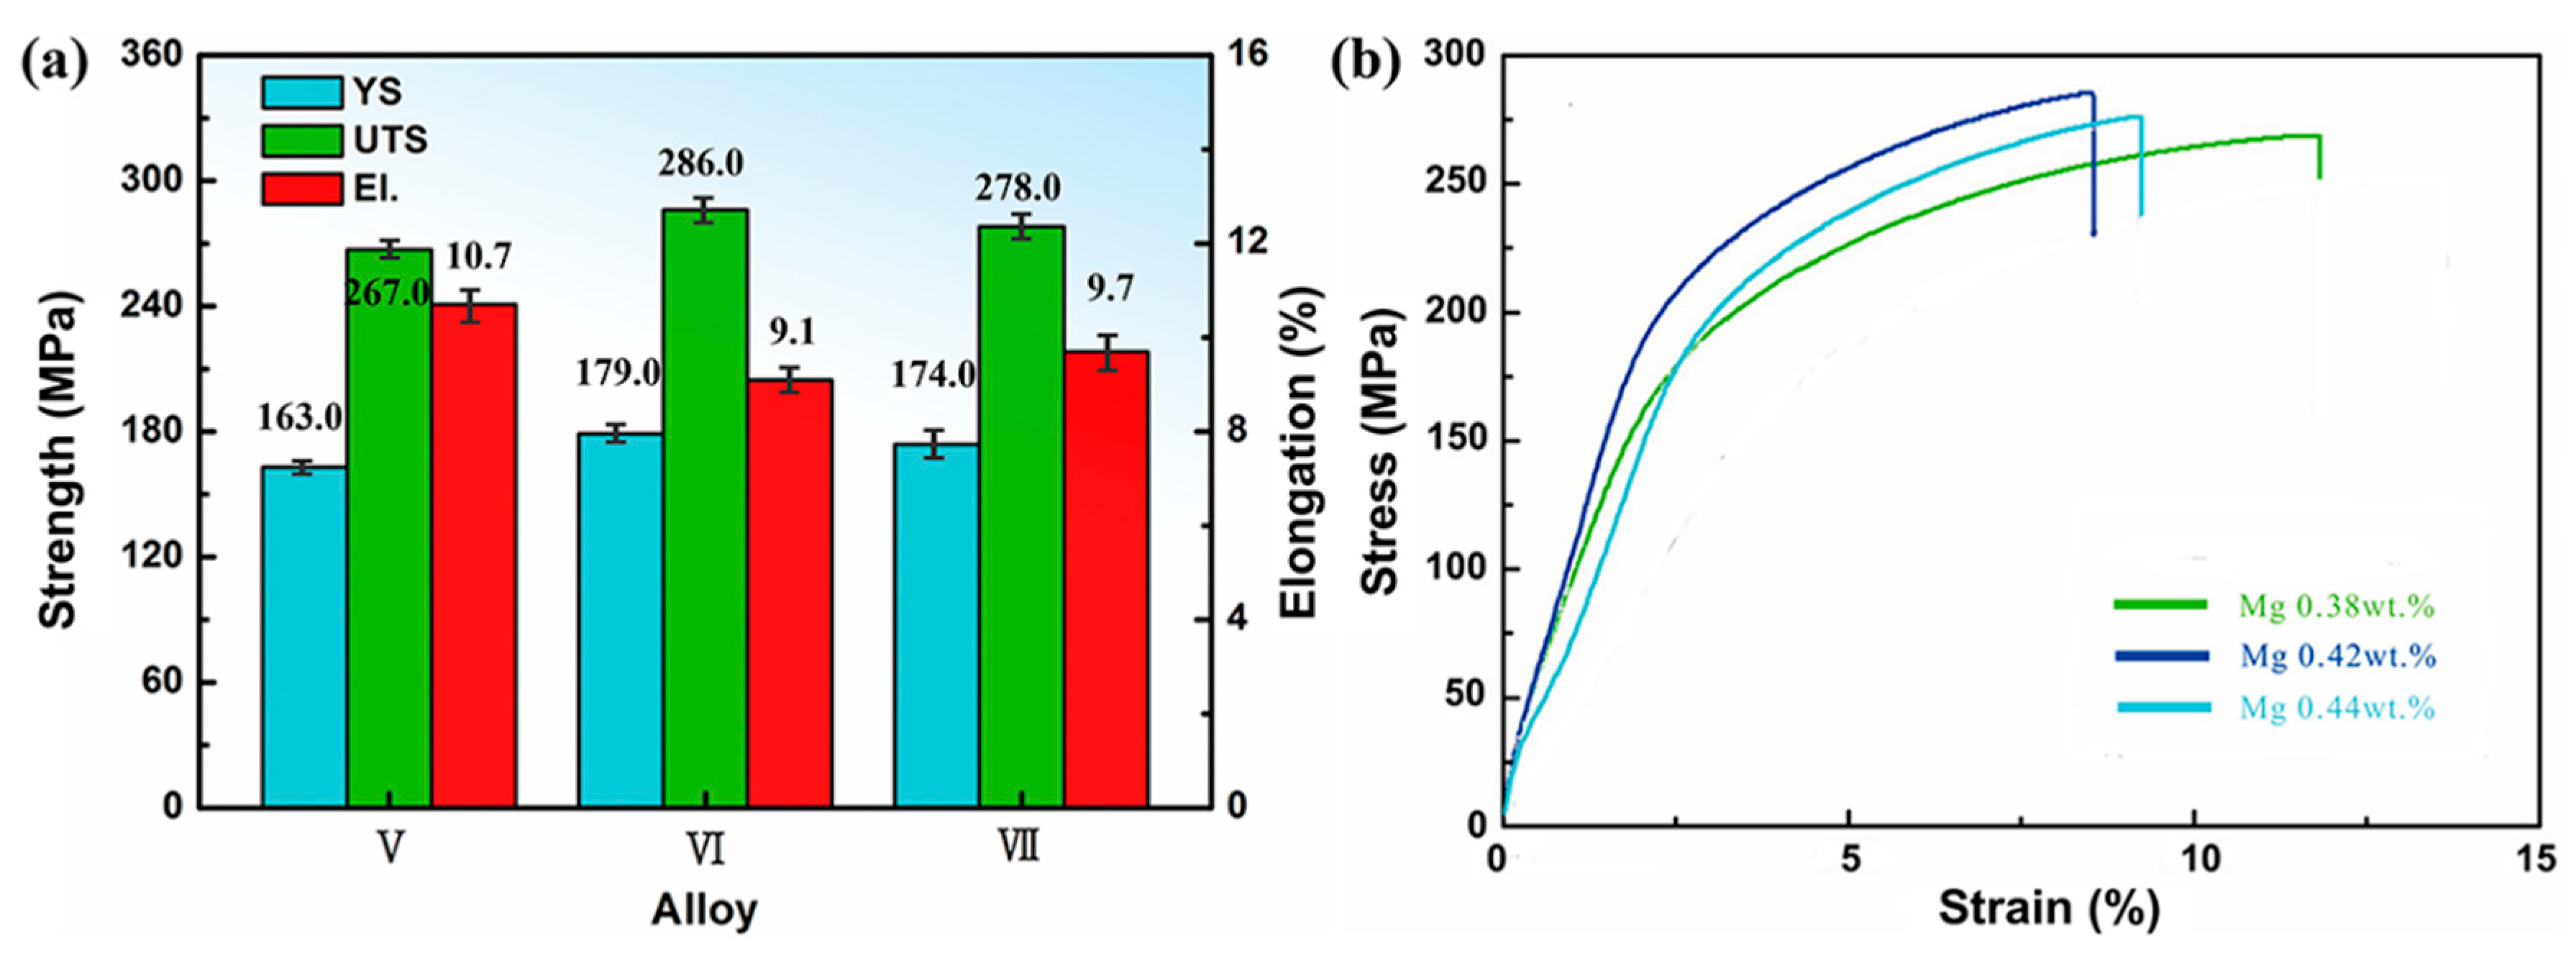
The tensile properties of the T6 heat-treated A356.2-0.15Fe alloy with different Mg content and fixed Mn/Fe ratio of 0.5 are presented in Figure 10a and the corresponding strain-stress curves are displayed in Figure 10b. With the rising of Mg content, the yield strength (YS) and ultimate tensile strength (UTS) of the alloy increase first and then decrease. The alloy containing 0.42 wt.% Mg has the best tensile properties, and its YS (179 MPa), UTS (286 MPa), and El. (9.1%) are 28%, 27%, and 40% higher than those of the alloy containing 0.35 wt.% Mg, respectively. The tensile properties of the alloys containing 0.42 wt.% Mg are similar to those of the alloy containing 0.44 wt.% Mg. Considering from the perspective of cost and tensile properties, the alloy with an Mn/Fe ratio of 0.5 and containing 0.42 wt.% Mg is the best of the seven alloys.
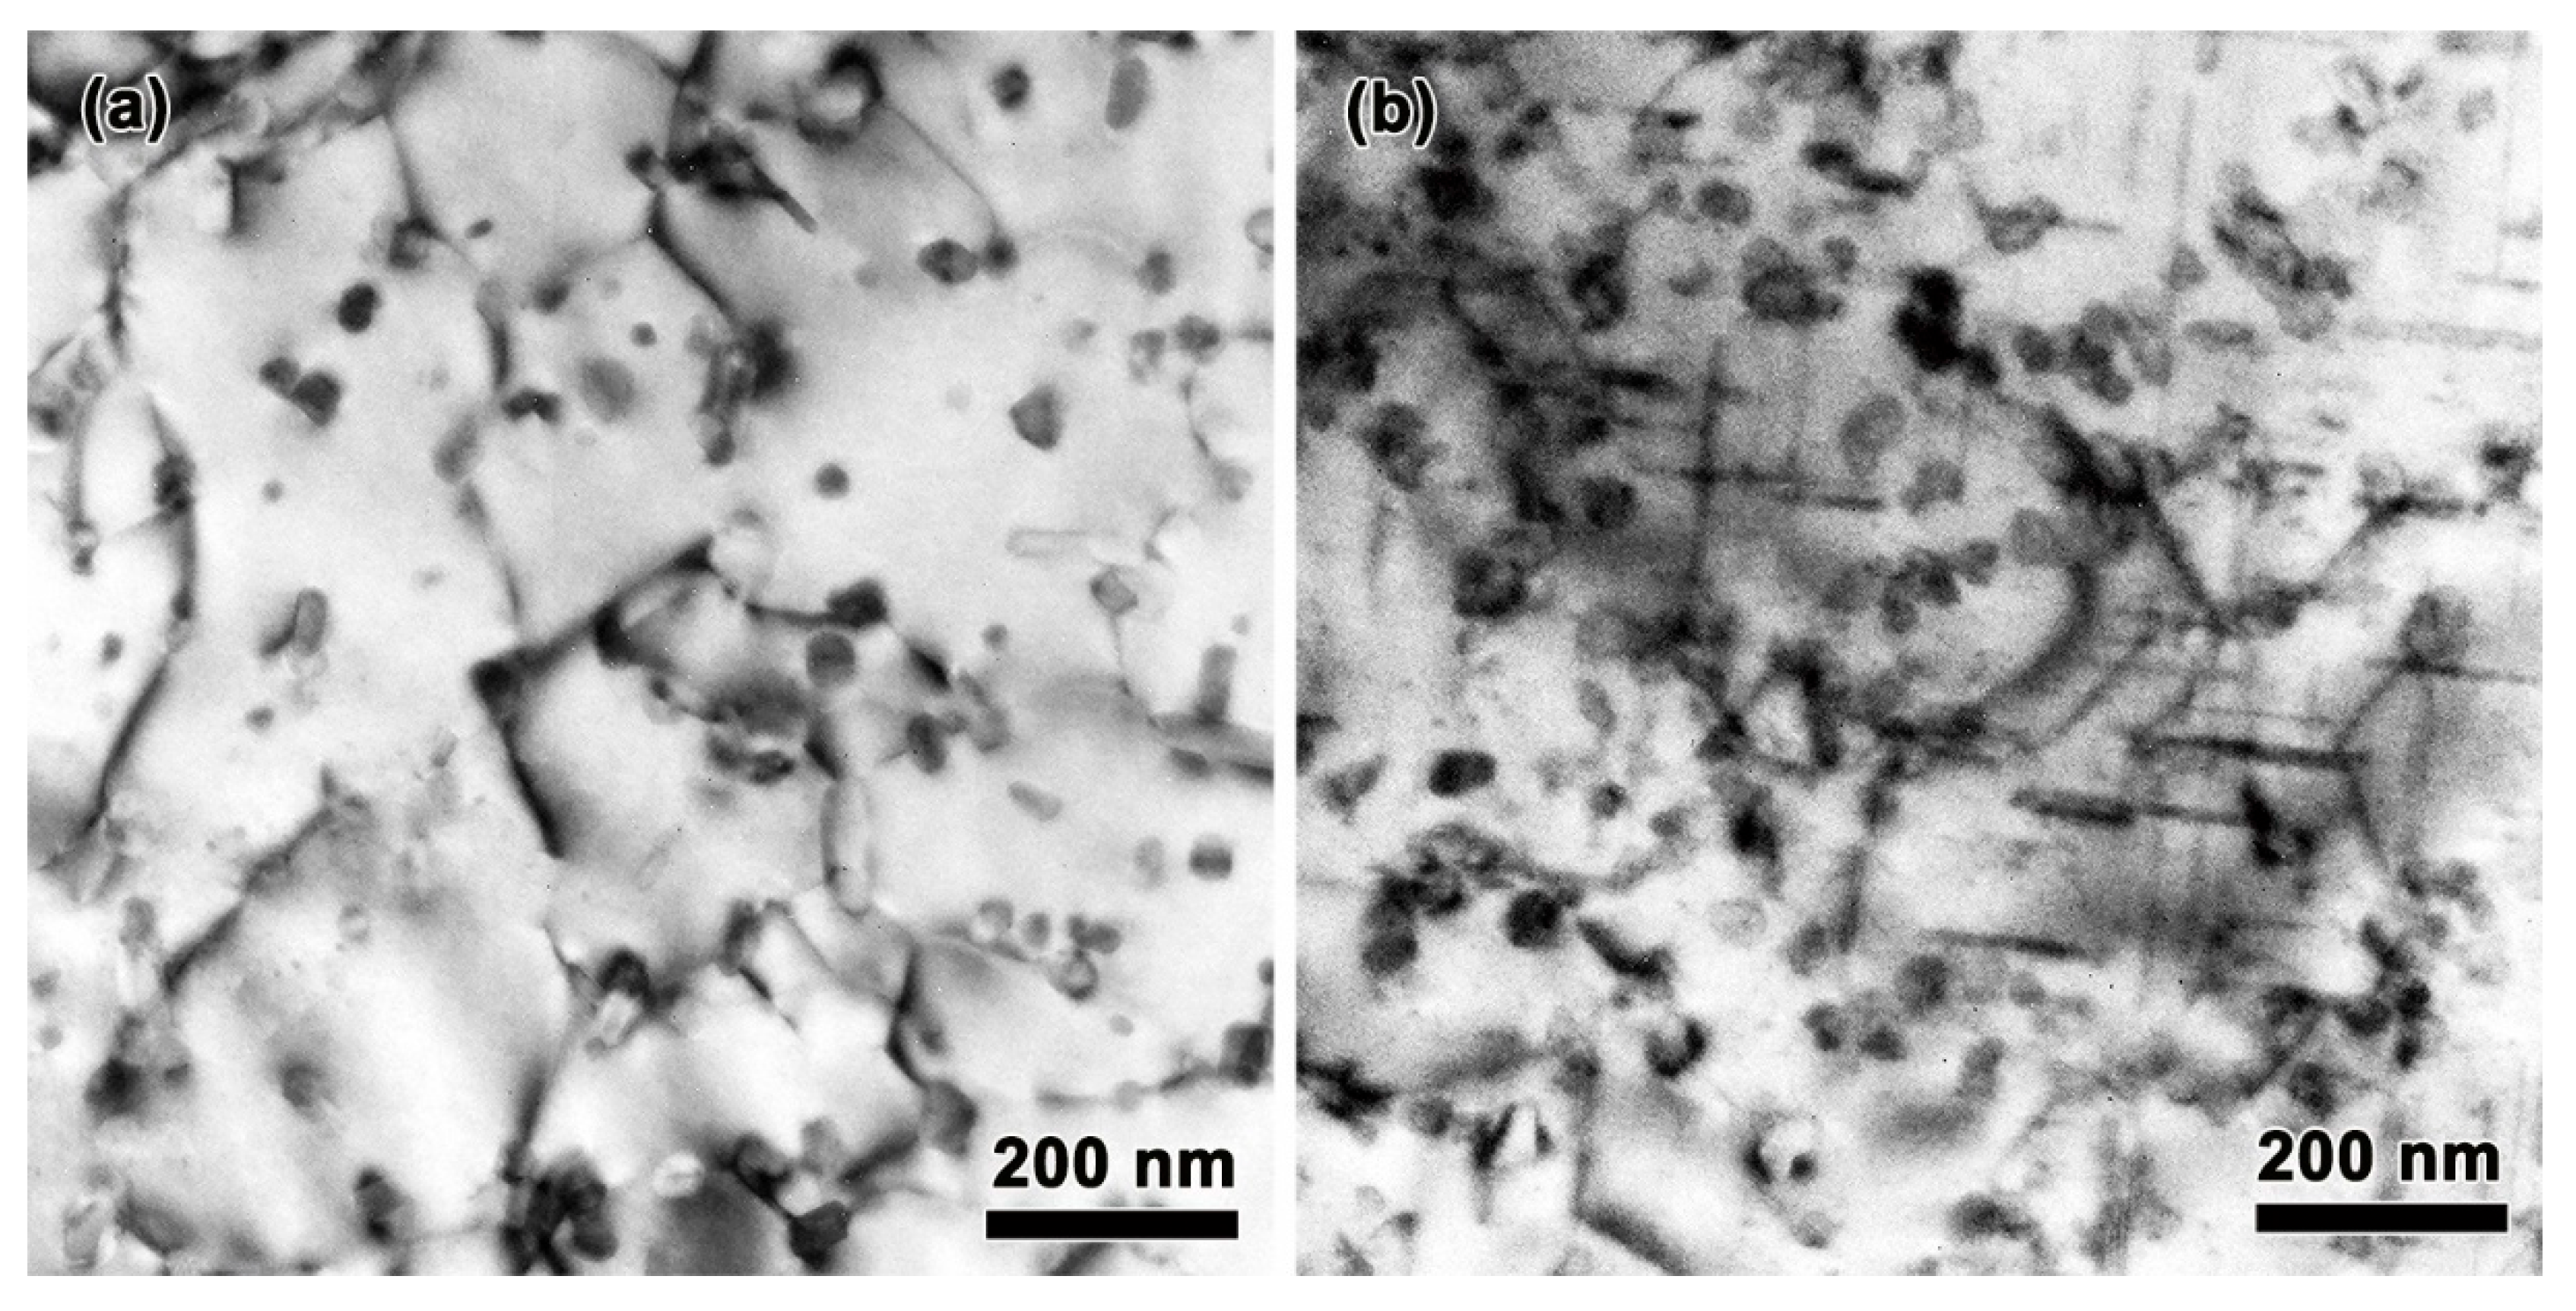
Bright-field micrographs obtained from the tensile tested alloys containing 0.35 wt.% and 0.42 wt.% Mg are displayed in Figure 11a,b, respectively. The dislocation lines are concentrated on the Mg2Si phase as shown in Figure 11, which improves the ultimate tensile strength. The face-centered cubic (FCC) Al matrix has 12 slip systems consisting of {111} slip planes and <110> slip directions. When the resolved shear stress of a slip system is greater than its critically resolved shear stress, dislocations will start to slip on the slip systems during deformation. These moving dislocations will shear the nanoscale Mg2Si phase, and cross-slip will occur among screw dislocations [41]. With increasing the level of deformation, the segments of precipitates were continuously being sheared. When the size of the precipitates is large enough, the dislocation lines will tangle around the precipitated phases. The size and the volume fraction of the precipitated Mg2Si phase is the key factor influencing the ultimate tensile strength of alloys.

4. Conclusions

The microstructure and tensile properties of the A356.2-0.15Fe alloys added with Mn and Mg have been studied in this paper. The following conclusions can be drawn:
The addition of Mn in A356.2-0.15Fe alloy containing a fixed Mg content modifies the Fe-rich phase from an acicular shape (β-Al5FeSi) to a block shape (α-Al(Fe, Mn)Si). The tensile properties of A356.2-0.15Fe alloy are improved obviously due to Mn addition. The optimal Mn/Fe ratio for this kind of alloy is 0.5. The YS, UTS, and El. of A356.2-0.15Fe alloy with an Mn/Fe ratio of 0.5 are 144.0 MPa, 253.0 MPa, and 11.1%, respectively. The elongation of the alloys with an Mn/Fe ratio of 0.5 is increased by 70.8% compared with the Mn-free alloy.
The addition of Mg in A356.2-0.15Fe alloy containing a fixed Mn/Fe ratio could promote the precipitation of the Mg2Si phase and reduce the secondary dendrite arm spacing (SDAS). Compared with the alloy with 0.35 Mg, the volume fraction of the Mg2Si phase of the alloy with 0.42 Mg is increased by 60.8%, and the SDAS decreased by 11.5%.
The A356.2-0.15Fe alloy with an Mn/Fe ratio of 0.5 and containing 0.42 wt.% Mg has good comprehensive tensile properties, with a yield strength of 179 MPa, an ultimate tensile strength of 286 MPa, and an elongation of 9.1%. Compared with the alloy without Mn addition, the yield strength, ultimate tensile strength, and elongation are increased by 27.8%, 27.1%, and 40.0%, respectively.

Author Contributions

J.C. (Jie Cui), literature search, figures, study design, data collection, data analysis, data interpretation, writing; J.C. (Jiayan Chen), literature search, data analysis; Y.L., literature search, figures, study design, data analysis; T.L., study design, data collection, data analysis, writing. All authors have read and agreed to the published version of the manuscript.

Funding

This research was funded by the Science and Technology Program of Dezhou (grant number 2022dzkj077) and by the Scientific Research Allowance of Dezhou University (grant number 2022xjrc103).

Institutional Review Board Statement

Not applicable.

Informed Consent Statement

Not applicable.

Data Availability Statement

Data presented in this study may be requested from the corresponding author.

Conflicts of Interest

The authors declare no conflict of interest.

References

  1. Xi, H.H.; Xu, J.J.; Yuan, X.; Ming, W.Q.; Zhang, Z.; Chen, J.H. The ill-defined π(AlFeMgSi) phase intermetallics formed in an automotive Al-Si-Mg alloy. Mater. Charact. 2023, 199, 112839. [Google Scholar] [CrossRef]
  2. Wazeer, A.; Das, A.; Abeykoon, C.; Sinha, A.; Karmakar, A. Composites for electric vehicles and automotive sector: A review. Green Energy Intell. Transp. 2023, 2, 100043. [Google Scholar] [CrossRef]
  3. Niu, G.; Wang, J.; Ye, J.; Mao, J. Enhancing Fe content tolerance in A356 alloys for achieving low carbon footprint aluminum structure castings. J. Mater. Sci. Technol. 2023, 161, 180–191. [Google Scholar] [CrossRef]
  4. Tuncay, T.; Bayoglu, S. The effect of iron content on microstructure and mechanical properties of A356 cast alloy. Met. Mater. Trans. B 2017, 48, 794–804. [Google Scholar] [CrossRef]
  5. Zhao, Y.; Song, D.; Wang, H.; Jia, Y.; Lin, B.; Tang, Y.; Tang, Y.; Shu, D.; Sun, Z.; Fu, Y.; et al. Revealing the influence of Fe on Fe-rich phases formation and mechanical properties of cast Al-Mg-Mn-Fe alloys. J. Alloys Compd. 2022, 901, 163666. [Google Scholar] [CrossRef]
  6. Wang, Q.G. Microstructural effects on the tensile and fracture behavior of aluminum casting alloys A356/357. Metall Mater. Trans. A. 2003, 34A, 2887–2899. [Google Scholar] [CrossRef]
  7. Rathod, N.; Menghani, J. Detrimental effect of Fe as impurity on A356/TiB2+RE+Sn alloy fabricate via in situ route. Mater. Today Proc. 2021, 44, 1326–1330. [Google Scholar] [CrossRef]
  8. Liu, C.; Jiao, X.; Nishat, H.; Akhtar, S.; Wiesner, S.; Guo, Z.; Xiong, S. Characteristics of Fe-rich intermetallics compounds and their influence on the cracking behavior of a newly developed high-pressure die cast Al–4Mg–2Fe alloy. J. Alloys Compd. 2021, 854, 157121. [Google Scholar] [CrossRef]
  9. Kucharikova, L.; Medvecka, D.; Tillova, E.; Belan, J.; Kritikos, M.; Chalupova, M.; Uhricik, M. The effect of the beta-Al5FeSi phases on microstructure, mechanical and fatigue properties in A356.0 cast alloys with higher Fe content without additional alloying of Mn. Materials 2021, 14, 1943. [Google Scholar] [CrossRef]
  10. Knap, V.; Švecová, I.; Tillová, E.; Kuchariková, L. Influence of iron content on SDAS factor, Al5FeSi intermetallic phases and porosity of the secondary aluminum alloy AlSi7Mg0.6 used in the automotive industry. Transp. Res. Procedia 2021, 55, 814–820. [Google Scholar] [CrossRef]
  11. Dhinakar, A.; Lu, P.Y.; Chen, J.K.; Tang, N.K. Iron Reduction in 356 Secondary Aluminum Alloy by Mn and Cr Addition for Sediment Separation. Int. J. Metalcast. 2021, 15, 182–192. [Google Scholar] [CrossRef]
  12. Gao, T.; Li, Z.; Zhang, Y.; Qin, J.; Liu, X. Evolution of Fe–rich phases in Mg melt and a novel method for separating Al and Fe from Al–Si–Fe alloys. Mater. Des. 2017, 134, 71–80. [Google Scholar] [CrossRef]
  13. Luo, Q.; Cong, M.; Li, H.; Zhu, L.; Chen, H.; Li, Q. Mechanism of Fe removal by Sn addition in Al-7Si-1Fe alloy. J. Alloys Compd. 2023, 948, 169724. [Google Scholar] [CrossRef]
  14. Lin, B.; Li, H.; Xu, R.; Xiao, H.; Zhang, W.; Li, S. Effects of vanadium on modification of iron-rich intermetallics and mechanical properties in A356 cast alloys with 1.5 wt.% Fe. J. Mater. Eng. Perform. 2019, 28, 475–484. [Google Scholar] [CrossRef]
  15. Zhang, Z.J.; Tezuka, H.; Kobayashi, E.; Sato, T. Effects of the Mn/Fe ratio and cooling rate on the modification of Fe intermetallic compounds in cast A356 based alloy with different Fe contents. Mater. Trans. 2013, 54, 1484–1490. [Google Scholar] [CrossRef] [Green Version]
  16. Sanchez, J.M.; Arribas, M.; Galarraga, H.; Garcia de Cortazar, M.; Ellero, M.; Girot, F. Effects of Mn addittion, cooling rate and holding temperature on the modification and purification of iron-rich compounds in AlSi10MnMg(Fe) alloy. Heliyon 2023, 9, e13005. [Google Scholar] [CrossRef] [PubMed]
  17. Song, D.; Zhao, Y.; Jia, Y.; Huang, G.; Zhang, Z.; Zhou, N.; Li, X.; Zheng, K.; Fu, Y.; Zhang, W. Effect of B addition on the formation of Fe-rich phases in Al-Si-Fe alloys. J. Alloys Compd. 2023, 930, 167426. [Google Scholar] [CrossRef]
  18. Tang, Q.; Zhao, J.; Wang, T.; Chen, J.; He, K. The effects of neodymium addition on the intermetallic microstructure and mechanical properties of Al-7Si-0.3Mg-0.3Fe alloys. J. Alloys Compd. 2018, 741, 161–173. [Google Scholar] [CrossRef]
  19. Wan, B.; Chen, W.; Liu, L.; Cao, X.; Zhou, L.; Fu, Z. Effect of trace yttrium addition on the microstructure and tensile properties of recycled Al–7Si–0.3Mg–1.0Fe casting alloys. Mater. Sci. Eng. A Struct. 2016, 666, 165–175. [Google Scholar] [CrossRef]
  20. Wang, B.; Liu, X.; Wang, J.; Li, Q.; Liu, K.; Zhang, M. Uncovering the effects of Ce and superheat temperature on Fe-rich intermetallic and microporosity formation in aluminum alloy. Mater. Charact. 2022, 193, 112226. [Google Scholar] [CrossRef]
  21. Kim, H.Y.; Han, S.W.; Lee, H.M. The influence of Mn and Cr on the tensile properties of A356–0.20Fe alloy. Mater. Lett. 2006, 60, 1880–1883. [Google Scholar] [CrossRef]
  22. Zou, J.; Zhang, H.; Yu, C.; Wu, Z.; Guo, C.; Nagaumi, H.; Zhu, K.; Li, B.; Cui, J. Investigating the influences of Fe, Mn and Mo additions on the evolution of microstructure and mechanical performances of Al–Si–Mg cast alloys. J. Mater. Res. Technol. 2023, 25, 319–332. [Google Scholar] [CrossRef]
  23. Song, D.; Zhao, Y.; Jia, Y.; Li, X.; Fu, Y.; Zhang, W. Synergistic effects of Mn and B on iron-rich intermetallic modification of recycled Al alloy. J. Mater. Res. Technol. 2023, 24, 527–541. [Google Scholar] [CrossRef]
  24. Kuang, W.W.; Wang, H.F.; Li, X.; Zhang, J.B.; Zhou, Q.; Zhao, Y.H. Application of the thermodynamic extremal principle to diffusion-controlled phase transformations in Fe-C-X alloys: Modeling and applications. Acta Mater. 2018, 159, 16–30. [Google Scholar] [CrossRef]
  25. Tian, X.L.; Zhao, Y.H.; Gu, T.; Guo, Y.L.; Xu, F.Q.; Hou, H. Cooperative effect of strength and ductility processed by thermomechanical treatment for Cu-Al-Ni alloy. Mater. Sci. Eng. A Struct. 2022, 849, 11. [Google Scholar] [CrossRef]
  26. Wang, L.W.; Wu, T.; Wang, D.L.; Liang, Z.M.; Yang, X.; Peng, Z.Z.; Liu, Y.; Liang, Y.M.; Zeng, Z.; Oliveira, J.P. A novel heterogeneous multi-wire indirect arc directed energy deposition for in-situ synthesis Al-Zn-Mg-Cu alloy: Process, microstructure and mechanical properties. Addit. Manuf. 2023, 72, 16. [Google Scholar] [CrossRef]
  27. Ma, G.; Li, R.; Li, R. Effect of Mg2Si particles on low-temperature fracture behavior of A356 alloy. Mater. Sci. Eng. A Struct. 2016, 674, 666–671. [Google Scholar] [CrossRef]
  28. Salleh, M.S.; Omar, M.Z.; Syarif, J. The effects of Mg addition on the microstructure and mechanical properties of thixoformed Al–5%Si–Cu alloys. J. Alloys Compd. 2015, 621, 121–130. [Google Scholar] [CrossRef] [Green Version]
  29. Yamamoto, K.; Takahashi, M.; Kamikubo, Y.; Sugiura, Y.; Iwasawa, S.; Nakata, T.; Kamado, S. Effect of Mg content on age-hardening response, tensile properties, and microstructures of a T5-treated thixo-cast hypoeutectic Al–Si alloy. Mater. Sci. Eng. A 2020, 798, 140089. [Google Scholar] [CrossRef]
  30. Kang, J.; Su, R.; Wu, D.Y.; Liu, C.H.; Li, T.; Wang, L.S.; Narayanaswamy, B. Synergistic effects of Ce and Mg on the microstructure and tensile properties of Al-7Si-0.3Mg-0.2Fe alloy. J. Alloys Compd. 2019, 796, 267–278. [Google Scholar] [CrossRef]
  31. Alhawari, K.S.; Omar, M.Z.; Ghazali, M.J.; Salleh, M.S.; Mohammed, M.N. Microstructural evolution during semisolid processing of Al–Si–Cu alloy with different Mg contents. Trans. Nonferr. Metal. Soc. 2017, 27, 1483–1497. [Google Scholar] [CrossRef]
  32. Vandersluis, E.; Ravindran, C. Comparison of measurement methods for secondary dendrite arm spacing. Metallogr. Microstruc. 2017, 6, 89–94. [Google Scholar] [CrossRef]
  33. ASTM E1245-03; Standard Practice for Determining the Inclusion or Second-Phase Constituent Content of Metals by Automatic Image Analysis. ASTM: West Conshohocken, PA, USA, 2016.
  34. GB/T 228.1-2021; Metallic Materials—Tensile Testing—Part 1: Method of Test at Room Temperature. SAC: Beijing, China, 2021.
  35. Murali, S.; Row, T.N.G.; Sastry, D.H.; Raman, K.S.; Murthy, K.S.S. Crystal-structure of Beta-FeSiAl5 and (Be-Fe)-BeSiFe2Al8 phases. Scr. Met. Mater. 1994, 31, 267–271. [Google Scholar] [CrossRef]
  36. Terzi, S.; Taylor, J.A.; Cho, Y.H.; Salvo, L.; Suéry, M.; Boller, E.; Dahle, A.K. In situ study of nucleation and growth of the irregular α-Al/β-Al5FeSi eutectic by 3-D synchrotron X-ray microtomography. Acta Mater. 2010, 58, 5370–5380. [Google Scholar] [CrossRef]
  37. Kim, H.Y.; Park, T.Y.; Han, S.W.; Lee, H.M. Effects of Mn on the crystal structure of α-Al(Mn,Fe)Si particles in A356 alloys. J. Cryst. Growth 2006, 291, 207–211. [Google Scholar] [CrossRef]
  38. Ma, Z.; Samuel, A.M.; Samuel, F.H.; Doty, H.W.; Valtierra, S. A study of tensile properties in Al–Si–Cu and Al–Si–Mg alloys: Effect of β-iron intermetallics and porosity. Mater. Sci. Eng. A Struct. 2008, 490, 36–51. [Google Scholar] [CrossRef]
  39. Li, Q.; Qiu, F.; Dong, B.; Yang, H.; Shu, S.; Zha, M.; Jiang, Q. Investigation of the influences of ternary Mg addition on the solidification microstructure and mechanical properties of as-cast Al–10Si alloys. Mater. Sci. Eng. A Struct. 2020, 798, 140247. [Google Scholar] [CrossRef]
  40. Eshaghi, A.; Ghasemi, H.M.; Rassizadehghani, J. Effect of heat treatment on microstructure and wear behavior of Al-Si alloys with various iron contents. Mater. Des. 2011, 32, 1520–1525. [Google Scholar] [CrossRef]
  41. Yang, M.; Orekhov, A.; Hu, Z.; Feng, M.; Jin, S.; Sha, G.; Li, K.; Samaee, V.; Song, M.; Du, Y.; et al. Shearing and rotation of β″ and β′ precipitates in an Al-Mg-Si alloy under tensile deformation: In-situ and ex-situ studies. Acta Mater. 2021, 220, 117310. [Google Scholar] [CrossRef]
Figure 1. XRD patterns of the alloys with Mn/Fe ratios of 0 and 1.1.
Metals 13 01451 g001
Figure 2. SEM images of Fe-rich phases in the alloys with different Mn/Fe ratios: (a) 0, (b) 0.5, (c) 0.8, and (d) 1.1.
Metals 13 01451 g002
Figure 3. The length/width ratios of Fe-rich phases in alloys with different Mn/Fe ratios.
Metals 13 01451 g003
Figure 4. (a) EPMA micrograph in the A356.2 alloy with an Mn/Fe of 0.5 and containing 0.35 wt.% Mg and its element distribution: (b) Al, (c) Si, (d) Fe, and (e) Mn.
Metals 13 01451 g004
Figure 5. Optical micrographs of alloys with different content of Mg: (a) 0.35 wt.%, (b) 0.38 wt.%, (c) 0.42 wt.%, and (d) 0.44 wt.%.
Metals 13 01451 g005
Figure 6. The SDAS of the alloys with different content of Mg.
Metals 13 01451 g006
Figure 7. (a) The TEM micrograph of the precipitated phase in the alloy with 0.35 wt.% Mg, (bd) the results of mapping scan analysis for the precipitated phase, and (e) the result of linear scanning analysis for the precipitated phase.
Metals 13 01451 g007
Figure 8. TEM micrographs of the alloys with different content of Mg: (a) 0.35 wt.%, (b) 0.42 wt.%, and (c) the volume fraction of Mg2Si phases in alloys with different content of Mg.
Metals 13 01451 g008
Figure 9. (a) Tensile properties of T6 heat-treated A356.2 alloys with different Mn/Fe ratios and containing 0.35 wt.% Mg, and (b) relationship between the length/width ratios of Fe-rich phases and elongation for A356.2-0.15Fe alloys with different Mn/Fe ratios.
Metals 13 01451 g009
Figure 10. (a) Tensile properties of T6 heat-treated A356.2 alloys with Mn/Fe ratio of 0.5 and containing different content of Mg; (b) Stress-strain curves of T6 heat-treated A356.2 alloys with Mn/Fe ratio of 0.5 and containing different content of Mg.
Metals 13 01451 g010
Figure 11. Bright-field images of the tensile tested alloys with different content of Mg: (a) 0.35 wt.% and (b) 0.42 wt.%.
Metals 13 01451 g011
Table 1. Chemical compositions of the tested alloys (wt.%).
AlloySiFeMnMgTiSrAl
I6.950.148-0.350.120.02Bal.
II7.060.1550.0780.350.120.02Bal.
III6.950.1490.1150.340.130.02Bal.
IV7.030.1490.1580.350.110.02Bal.
V7.010.1540.0820.380.120.02Bal.
VI7.050.1560.0830.420.120.02Bal.
VII7.020.1520.0810.440.120.02Bal.
Table 2. EDS results for positions marked in Figure 2 (at.%).
AlloyPositionAlSiFeMn
IA76.9513.5812.47-
IIB73.989.8811.844.30
IIIC76.129.318.605.57
IVD75.7211.487.677.13
Disclaimer/Publisher’s Note: The statements, opinions and data contained in all publications are solely those of the individual author(s) and contributor(s) and not of MDPI and/or the editor(s). MDPI and/or the editor(s) disclaim responsibility for any injury to people or property resulting from any ideas, methods, instructions or products referred to in the content.