Article

Effect of High-Energy Ball Milling Time on the Density and Mechanical Properties of W-7%Ni-3%Fe Alloy

by
Aleksey V. Nokhrin
*,
Nataliya V. Malekhonova
*,
Vladimir N. Chuvil’deev
,
Nikolay V. Melekhin
,
Anatoliy M. Bragov
,
Andrey R. Filippov
,
Maksim S. Boldin
,
Eugeniy A. Lantsev
and
Nikita V. Sakharov
Materials Science Department, Physical and Technical Research Institute, Lobachevsky State University of Nizhny Novgorod, 603022 Nizhny Novgorod, Russia
*
Authors to whom correspondence should be addressed.
Metals 2023, 13(8), 1432; https://doi.org/10.3390/met13081432
Submission received: 17 April 2023 / Revised: 31 July 2023 / Accepted: 4 August 2023 / Published: 10 August 2023

Abstract

:
The present work was aimed at the investigation of the effect of high-energy ball milling (HEBM) time on the sintering kinetics, structure, and properties of the heavy tungsten alloy (HTA) W-7%Ni-3%Fe. The HTA samples were obtained from nanopowders (20–80 nm) using conventional liquid-phase sintering (LPS) in hydrogen and using spark plasma sintering (SPS) in vacuum. The HTA density was shown to depend non-monotonously on the HEBM time that originates from the formation of nonequilibrium solid solutions in the W-Ni-Fe systems during HEBM. The SPS kinetics of the HTA nanopowders was shown to have a two-stage character, the intensity of which depends on the Coble diffusion creep rate and on the intensity of diffusion of the tungsten atoms in the crystal lattice of the γ-phase. The kinetics of sintering of the initial submicron powders has a single-stage character originating from the intensity of the grain boundary diffusion in the γ-phase. The dependencies of the hardness and of the yield strength on the grain sizes were found to obey the Hall–Petch relation. The hardness, strength, and dynamic strength in the compression tests of the fine-grained tungsten alloys obtained using SPS and LPS were studied.

1. Introduction

Heavy tungsten alloys (HTAs) of the W-Ni-Fe system with W content over 85–90% have a number of unique characteristics: simultaneous increased density, strength, and plasticity at room temperature [1,2,3,4,5], high characteristics of dynamic strength [6,7], high radiation resistance, etc. Industrial tungsten alloys with 90–95% W obtained using conventional liquid-phase sintering (LPS) have a density of 17–19 g/cm3, an ultimate strength of up to 1000 MPa, and elongation to failure of up to 25–30% at room temperature [8]. Additional strain strengthening allows for improving the ultimate strength to up to 1400–1600 MPa, preserving satisfactory ductility [8,9,10,11,12]. These features make HTAs interesting for various construction applications as well as interesting objects for investigations of the effect of the interphase boundaries on the mechanical properties of the alloys [13,14,15,16].
It Is worth noting that the technologies of strain hardening of HTAs have approached the limits of their capabilities at present. For further improving the properties of HTA, modern technologies of powder metallurgy are often used [17,18] including additive manufacturing methods [19,20,21] and the microwave sintering method [22]. Modern methods of the fabrication of the nanopowder composition W-Ni-Fe are being developed extensively [5,19,23].
Analysis of the literature shows spark plasma sintering (SPS) to be one of the promising methods of fabricating HTAs [24,25,26,27,28]. An opportunity to vary the main process parameters affecting the microstructure parameters of HTAs, most essentially (the heating rate, the temperature and time of sintering, the magnitude of the pressure applied, etc.) directly in the course of sintering, provides great flexibility to the SPS method in controlling the mechanical properties of the HTAs. The opportunity of sintering the materials at very high heating rates (up to 2500 °C/min) is an important feature of SPS technology, which allows for reducing the grain growth rate [24,28]. The fine-grained HTAs obtained using SPS simultaneously have high strength and hardness [29,30,31,32,33,34,35,36,37,38,39,40,41,42,43,44,45] (Table A1; see Appendix A).
High-energy ball milling (HEBM) is one of the most efficient ways to produce tungsten-based nanopowders [46,47,48,49]. Compared with other production methods such as freeze-drying, [50], wet chemical processes [51], hydrogen annealing of tungsten oxides [52], spray drying [53], and DC arc plasma chemical synthesis [19,23], HEBM is the most efficient and productive process due to the simplicity of its equipment and process procedure. Currently, mechanical milling is widely used as the main method to produce tungsten-based nanopowders [54]. Thus, Malewar et al. [55] demonstrated the effectiveness of HEBM by obtaining high-density HTA samples via sintering at 1790 °C. However, despite the apparent simplicity of the process, the final powder particle size and quality depend on a number of variables. The essential parameters for HEBM are milling time, milling speed, feed ratio, temperature, milling atmosphere, milling media, etc. Depending on the grinding time, the final particle size may vary, and the material of the container and balls may affect the degree of contamination of the resulting powder [56]. An important disadvantage of HEBM technology that needs to be taken into account is the increased agglomerability of tungsten nanopowders. Currently, there are not many data in the literature that explain the nature of the influence of certain mixing parameters on the properties of the powder and the final product. Thus, Kiran et al. [57] showed that milling media play a crucial role in determining the purity of the final powder, and that increasing the milling time can significantly reduce the size of tungsten particles. It was also shown by the authors that increasing the HEBM time increases the density of the final product. In [58], it was shown that introducing additional defects in tungsten particles in the HEBM process makes it possible to reduce the onset temperature for the sintering of powder blanks, as well as to make the microstructure more homogeneous. A nonmonotonic dependence of hardness and fracture resistance on milling time was also observed [58]. Malkin’s group showed that HEBM changes the adsorption properties of tungsten powders [59], changes the heat capacity of tungsten powders [60], and leads to the formation of strong internal stresses and microstrains of the crystal lattice of tungsten powders and increases their reactivity [61]. Thus, HEBM is an effective method for changing the size, structure, and properties of tungsten powders.
Joint application of high-energy ball milling and SPS is one of the promising methods of further improving the mechanical properties of HTAs [1,2,9,10,13,14,15,16,17,18]. This allows for ensuring outstanding increases in the strength and hardness of the HTAs (Table A1; see Appendix A). It is interesting to note that the results of [28,29,34,40] evidence the possibility of the formation of a strongly supersaturated solid solution of tungsten in the γ-phase based on nickel during HEBM that leads to an additional acceleration of sintering of W-based nanopowders. The formation of the supersaturated solid solution of tungsten atoms in the γ-phase leads to the manifestation of some unexpected effects. The effect of the nonmonotonous dependence of the density on the sintering temperature [29,30,36,44,45,62], as well as the effect of the reduction in the activation energy of sintering of the nanopowders [62], deserve a high amount of attention. One should note separately the effect of decreasing the density of tungsten alloys sintered from mechanically activated nanopowders [34,40,62], the nature of which remains unclear now. Also, the effect of nonmonotonous (with a maximum) dependencies of the HTA density on the time of preliminary HEBM of the powders observed in [62] is interesting.
From a practical viewpoint, the results of increases in the hardness, the static strength, and the dynamic strength of the HTAs obtained using SPS are important.
Analysis of the literature shows that the W-7%Ni-3%Fe alloys obtained via SPS from nanopowders (tHEBM = 20 min) have a higher dynamic strength as compared with coarse-grained alloys [43,63]. The decrease in the grain sizes was noted to result in simultaneous increases in the static strength, the dynamic strength, and in the penetration depth of an HTA sample into a steel barrier. At a throwing speed of 1194 m/s, the penetration depth reached 15.2 mm, whereas for coarse-grained HTAs this magnitude varied from 9.4 to 12.8 mm under similar testing regimes [63]. The formation of a strongly supersaturated solid solution in the γ-phase may be one of the origins of the manifestation of increased dynamic strength of the HTAs. In our opinion, this allows for increasing the strength of the interphase (α-γ) boundaries and, as a consequence, ensuring additional increases in the strength of HTAs.
The investigation of the effect of the HEBM time (tHEBM) of the powders on the density, microstructure parameters, and mechanical properties of the heavy tungsten alloy W-7%Ni-3%Fe obtained via SPS was the main goal of the present work.

2. Materials and Methods

The object of investigation was W-7%Ni-3%Fe alloy. The chemical compositions of the initial powders α-W, β-Ni, and α-Fe are presented in Table 1. The mean particle sizes in the initial powders α-W, β-Ni, and α-Fe according to Fischer were R0 = 0.8 μm, 20 μm, and 11 μm, respectively.
The initial coarse-grained compositions were obtained by mixing the powders α-W, β-Ni, and α-Fe in a FRITSCH® Pulverisette 6 planetary ball mill (Idar-Oberstein, Germany). The mixing time was 15 h and the mixing rate was 100 rpm. A preliminary stage of long stirring allows for a homogeneous distribution of β-Ni and α-Fe powders in submicron α-W powders. HEBM of the composition W-7%Ni-3%Fe was performed in APF-3 high-energy planetary mill (Russia). The acceleration of the milling bodies was 60 g and the mixing rate was 1450 rpm. The containers and milling balls of 6–10 mm in diameter were made from industrial alloy W-7%Ni-3%Fe. The mass ratio of the balls and the powders was 10:1. HEBM with durations of 5, 10, 20, and 40 min was performed in argon ambient gas with addition of ethanol. To minimize the heating of the powders, HEBM was performed in several stages, each 5 min long. During HEBM, large and small agglomerates consisting of nanoparticles were formed. The presence of large agglomerates in the powder hinders the sintering process and can lead to the formation of large pores. Large agglomerates of several hundred microns in size were eliminated using a set of sieves with different mesh sizes. The minimum mesh size was 50 μm.
The HTA samples were obtained by conventional sintering in hydrogen (Method I) and by SPS (Method II).
To obtain the HTA samples using Method I, the nanopowders were pressed into samples of 30 mm in diameter and 5–6 mm in height in advance. Uniaxial pressing with a pressure of 150 MPa was performed at room temperature in a steel mold. The powders had a bulk density of ~7 g/cm3 after 20–40 min of HEBM. The density of the green body was ~9 g/cm3. The density was measured by weighing the body and measuring its geometric dimensions. The error in determining the density of the green body was 0.1–0.2 g/m3. The final dimensions of the samples depended on the sintering temperature and density of the sintered material.
The sintering was performed in a two-stage regime: Stage I—heating with the rate 25 °C/min up to 950 °C and holding for 2 h for the reduction of the powders and removing oxygen; Stage II—heating up to the sintering temperature (1250, 1300, 1350, or 1400 °C) in 100 min and holding for ts = 1 h. Sintering of samples was carried out in a hydrogen resistance furnace with a nominal power of 3 kW (380 V, 50 Hz). Heating and holding of samples were carried out in hydrogen. Hydrogen consumption during sintering was 0.2–0.6 m3/h. The sintered pressings were placed on a molybdenum table, on the surface of which aluminum oxide powder was poured to prevent the pressings from sticking to the table. The temperature was measured with tungsten–rhenium thermocouples. The accuracy of measuring the temperature was ±6 °C. After sintering, the samples were subjected to annealing in vacuum (10−5 Torr) at 1000 °C, 2 h. As the reference samples, the coarse-grained alloys W-7%Ni-3%Fe obtained by sintering the coarse-grained powder compositions in hydrogen were used.
Method II was implemented using Dr. Sinter model SPS-625 setup (SPS SYNTEX Inc., Japan). The sintering of samples of 30 mm in diameter and 4–4.5 mm in height was performed in vacuum (6 Pa) when applying a uniaxial pressure of 70 MPa. A single-stage sintering regime was used: heating with a rate of 100 °C/min up to the sintering temperature (1200 °C). The uniaxial pressure was applied simultaneously with the beginning of heating. Holding at the sintering temperature was not performed (ts = 0 min). The temperature was measured with an optical pyrometer, Chino IR-AHS2 (Chino Corporation, Tokyo, Japan), focused onto the surface of the graphite mold. The uncertainty of the temperature measurement was ±5 °C. As the reference samples, nanopowders after HEBM that were subjected to annealing in hydrogen at 900 °C, 1 h in advance (before SPS) were used.
In the course of heating up, the effective shrinkage (Leff, mm) and shrinkage rate (Seff, mm/s) of the nanopowders were measured using a dilatometer. The contribution of the thermal expansion (L0, mm) of the graphite mold and punch was taken into account on the basis of the results of experiments with empty mold. The temperature curves of shrinkage of the nanopowders (L, mm) were calculated according to the following formula: L(T) = Leff(T) − L0(T).
The residual graphite was removed from the surfaces of the sintered samples of 30 mm in diameter via waterjet cleaning. Mechanical grinding was performed using Struers Secotom 10 setup (Struers, Copenhagen, Denmark), and polishing was performed using Buehler Automet 250 setup (Buehler, Braunschweig, Germany). In the course of mechanical treatment, layers of ~300–350 μm, in which an increased carbon concentration can be observed due to high-temperature interaction of the material with the graphite mold, were removed from the sample surfaces [64,65].
The microstructure investigations of the alloys were carried out using Leica IM DRM optical metallographic microscope (Leica Microsystems GmbH, Wetzlar, Germany), Jeol JSM-6490 scanning electron microscope (SEM, Jeol Ltd., Tokyo, Japan), and TESCAN Vega 2 SEM (Tescan Orsay Holding, a.s., Brno, Czech Republic) with Oxford Instruments INCA 350 EDS microanalyzer (Oxford Instruments pls., Oxford, England). The average tungsten grain size (d) was determined with the chord method using GoodGrains 2.0 software (Russia). The density of the samples was measured via hydrostatic weighting in distilled water using Sartorius CPA balance (Sartorius AG, Göttingen, Germany). The uncertainty of the density measurement was ±0.01 g/cm3. The magnitude of the theoretical density was accepted to be equal to ρth = 17.245 g/cm3. The analysis of the chemical compositions was performed using Ultima 2 ICP atomic-emission spectrometer (HORIBA Jobin Yvon Inc., Edison, USA) and Leco RHEN-602 analyzer (LECO Corp., St. Joseph, MI, USA). X-ray diffraction (XRD) phase analysis was performed using Shimadzu XRD-700 diffractometer (Shimadzu, Kyoto, Japan) (CuKα emission, λ = 1.54056 Å, scan rate 0.5 °/min, exposure 2 s, step 0.02°). The phase analysis of the samples was performed using Rietveld method. The contribution of the apparatus broadening into the XRD peaks was taken into account according to [62]. The analysis of internal stresses and calculation of the sizes of coherent scattering regions (CSR) were performed using Williamson–Hall method [66].
To study the mechanical properties of the sintered samples, the stress–relaxation testing technique was used, allowing for determining the magnitudes of the macroelasticity stress (lattice friction stress) (σ0) and of the yield strength (σy) in the compression tests [62]. To measure σ0 and σy, cylindrical samples of 3 mm in diameter and 6 mm in height were used. The uncertainties in measuring σ0 and σy were ±20 MPa. The microhardness (Hv) of the alloys was measured using HVS-1000 hardness tester (INNOVATEST Europe BV, Maastricht, The Netherlands) at a load of 1 kg.
The magnitude of compressive dynamic ultimate strength (Ys) was investigated with Kolsky bar method using Hopkinson split rod at the strain rate of ~103 s−1 [67]. An example of a dynamic strain curve of a tungsten alloy is presented in Figure 1. The ballistic characteristics of the material were determined by measuring the penetration depth (H) of a sample 3 mm in diameter and 25 mm long (Figure 2a) into a steel target of 30 mm in thickness. The samples were accelerated with a 12 mm two-stage gas gun powered by compressed air. The steel hardness was 27–30 HRC. The impact angle of the sample with the steel plate was 90°. The test procedure was described in [63]. The samples for testing were cut out from the central parts of workpieces of 30 mm in diameter by spark cutting in distilled water. The penetration depth of the sample was measured on a metallographic cross-section with Leica IM DRM optical microscope using GoodGrains 2.0 software (Figure 2b). Figure 2b shows a fragment of the cross-section of the target—a steel plate, in which a non-through hole was formed after the test. For convenience of the microstructure investigations, the steel samples were pressed into WEM REM mixture (Cloeren Technology GmbH, Berlin, Germany), the polymerization temperature of which did not exceed 150 °C; the polymerization time was 10 min. The uncertainty of determining the magnitude of H was ±0.1 mm. The increased error in determining the penetration depth H is due to the plastic deformation of the steel target in the impact zone. This resulted in curvature of the flat surface of the steel target and formation of irregularities near the impact area (Figure 2b).

3. Results

3.1. Investigation of the Powders

Figure 3 presents the images of the powders of the W-7%Ni-3%Fe compositions in their initial state, after mixing in the FRITSCH® Pulverisette 6 planetary ball mill (32 h, Figure 3a) and after HEBM for different processing times (Figure 3b–f). Figure 3e shows an image of the surface of the fractured fine agglomerate. Individual submicron tungsten particles are visible on the surface. Figure 3f shows the surface image of an undestroyed fine agglomerate.
As one can see in the images presented in Figure 3, sufficiently large micron-sized agglomerates consisting of several tens of nanoparticles with splinter shapes (Figure 4a) or round shapes (Figure 4b) form in the course of HEBM. The complex morphology of the nanopowder after HEBM is related to the impact of grinding bodies on W-Ni-Fe particles. At a high rotational speed, the grinding bodies impact the powder particles, thereby breaking them into smaller particles, as well as carrying out their intensive plastic deformation. As the milling time increases, the number of impacts of the milling bodies on the particles increases, thereby increasing the degree of fragmentation of the powder particles and increasing the degree of their deformation. The presence of relatively ductile Ni and Fe particles leads to the agglomeration of stronger W particles.
The results of the XRD phase analysis show that a decrease in the intensity and the broadening of the XRD peaks of α-W take place in the course of HEBM (Figure 5a). No peaks corresponding to iron and nickel were visible in the XRD curves. This suggests that a strong fragmentation of the Ni and Fe particles takes place during HEBM.
A shift in the tungsten peaks towards greater diffraction angles was observed (Figure 5b). The (110) α-W peak position in the initial coarse-grained powder corresponds to the diffraction angle 2Θmax = 40.26° ± 0.02°. After HEBM during tHEBM = 40 min, the (110) α-W XRD peak shifted by ~0.08–0.12° up to 2Θmax = 40.34–40.38°. The (211) α-W peak position in the initial as-mixed powder corresponds to the diffraction angle 73.18° ± 0.02°. After HEBM during tHEBM = 40 min, the (211) α-W XRD peak shifted up to 73.30–73.32°. The fact of the X-ray peak shift was additionally confirmed in experiments with increased exposure time (4 s). According to Wulff–Bragg’s equation (2dhkl = nλCu·sin2Θhkl), this evidences that the compressive internal stress fields that form in the tungsten nanoparticles in the course of HEBM lead to a decrease in the interplanar distances dhkl.
It is notable that one can see asymmetry in the tungsten XRD peaks in Figure 5b; the (110) α-W peaks are broadened more strongly towards the greater diffraction angle 2Θ. After HEBM for 40 min, the half width at half maximum (HWHM) of the (110) α-W peak at small diffraction angles was Θ−0.5~0.30–0.32°, whereas the one at large diffraction angles was Θ−0.5~0.42–0.44°. In the initial state, the (110) α-W peaks were highly symmetric (Θ−0.5+0.5~0.06–0.10°). According to [62], this result means that after HEBM, the nanoparticles have a core–shell structure; a strain-induced dissolving of nickel and iron atoms in the surface layers of the α-W nanoparticles takes place during HEBM. This leads to the formation of internal compressive stress fields in the surface layers of the α-W nanoparticles and, as a consequence, to the broadening of the α-W peaks towards greater diffraction angles.
The calculations of the coherent scattering region sizes (DXRD) according to the Williamson–Hall model show DXRD to decrease from ~80–100 nm down to ~20–25 nm with an increase in tHEBM from 5 up to 40 min. The estimates obtained evidence that the agglomerates shown in Figure 3 consist of several tens or hundreds of tungsten particles on average.
It is worthwhile to pay attention to the nonmonotonous character of the dependence of the microstrain of the tungsten crystal lattice (Δε), calculated according to the Williamson–Hall method, on the HEBM time. As one can see in Figure 5c, the maximum value Δεmax~9·10−3 was achieved after 20 min of HEBM. At a further increase in the HEBM time, the magnitude of Δε decreased down to ~6·10−3. So far, one can conclude that essential compressive internal stress fields form in the tungsten nanoparticles in the course of HEBM, leading to a strong distortion of the α-W crystal lattice (see [52]).
The investigations of the chemical compositions show that the oxygen concentration in the nanopowders after HEBM reached 1.5–1.55 wt.%. These results agree qualitatively with the ones in [68], where an increase in the oxygen concentration in the tungsten powders after HEBM was also observed. During HEBM, the particle size decreases and the specific surface area of the powders increases. This leads to an increase in the concentration of oxygen adsorbed on the surface of the tungsten nanopowders. After being annealed in hydrogen at 900 °C (1 h), the oxygen concentration in the nanopowders decreased down to 0.8–0.95 wt.%. The parameters of the XRD peaks of α-W did not change after the nanopowders were annealed in hydrogen.

3.2. Sintering the Nanopowders in Hydrogen

The investigations of the macrostructure of the samples show that the sintering of the nanopowders at 1450 to 1500 °C leads to the formation of large pores (Figure 6). This leads to a decrease in the density of the samples sintered from the mechanically activated nanopowders (Table 2). Sintering at lower temperatures (1250, 1300, and 1350 °C) did not result in the formation of macropores. No macropores were observed when sintering the coarse-grained powders.
The chemical reaction of hydrogen with oxygen adsorbed on the nanopowder particle surfaces is the most probable origin of the macropore formation. This reaction goes with the formation of water vapor: 2H2 + O2 = 2H2O (see [69]). The removal of the water vapor from the nanopowders that were pressed in advance is difficult, leading to an increase in the gas pressure inside the micropores and, as a consequence, to the formation of large macropores at elevated temperatures. The second factor promoting macropore formation could be more intensive diffusion of hydrogen in the nanostructured HTAs. The investigations of the chemical compositions show that the hydrogen concentration in the samples sintered from the nanopowders reached 83–97 ppm (Ts = 1450–1500 °C), while in the samples sintered from the coarse-grained powders, the hydrogen concentration varied from 2.6 to 11 ppm.
We assume that there are several reasons for the formation of large pores at temperatures of 1450–1500 °C. Preliminarily, it should be noted that the formation of large pores occurs at temperatures close to the melting temperature of the γ-phase. Under these conditions, acceleration of diffusion and grain growth processes is observed. Firstly, this can lead to accelerated accumulation of water vapor molecules in triple junctions of grain boundaries, as well as to accelerated diffusion of hydrogen from the furnace working chamber into the surface of the sintered sample. Secondly, intensive migration of grain boundaries leads to an increase in the characteristic scale of diffusion mass transfer. This leads to an increase in the time required for pore elimination by the diffusion mechanism. Thirdly, in the presence of internal gas pressure, the fusion of several small pores can lead to the formation of a larger pore (see [70]).
Table 2 presents the results of investigations of the density and mean grain sizes for the W-7%Ni-3%Fe alloy samples sintered in hydrogen at different temperatures. Figure 7 presents the microstructures of the HTA samples sintered in hydrogen from the nanopowders.
Figure 7 shows that there are no large pores in the samples sintered at lower temperatures (1250–1400 °C). As the sintering temperature increases, grain growth is observed, and the microstructures of the samples become inhomogeneous. Analysis of the metallography results shows that increasing the sintering temperature up to 1250 and 1400 °C results in smooth increases in the mean tungsten particle sizes by up to ~1 μm and ~3–5 μm, respectively. The mean grain sizes in the samples sintered from the nanopowders were smaller than the ones in the samples sintered from the coarse-grained powders, but the alloy microstructure was sufficiently nonuniform.
The macroscopic inhomogeneities in the specimen microstructure were observed at the initial stages of sintering at the sintering temperatures 1150–1200 °C (Figure 8a,b). The degree of the microstructure’s inhomogeneity decreases with increasing sintering temperature (Figure 8c). The presence of such inhomogeneities may be caused by the presence of large agglomerates in the nanopowders after HEBM.
The XRD phase analysis results show that the increase in the sintering temperature results in an increase in the intensity of the α-W XRD peaks; the asymmetry and the broadening of the peaks essentially decrease.
The increase in the mean grain sizes with increasing HTA sintering temperature from 1250 °C up to 1400 °C led to worsening of the mechanical properties of the alloy; the hardness decreased from 7.9 down to 6.9 GPa, the macroelasticity stress decreased from 960 down to 300 MPa, and the yield strength decreased from 1370 down to 620 MPa. It is notable that the mechanical properties of the samples sintered from the nanopowders at Ts = 1250 and 1300 °C were considerably better than those of the samples sintered from the coarse-grained powders (Table 2). Further increasing the annealing temperature (to over 1350 °C) led to a considerable decrease in the differences in the mechanical characteristics of the samples sintered from the coarse-grained powders and nanopowders.

3.3. Spark Plasma Sintering

Figure 9 presents the temperature curves of the shrinkage (Figure 9a,b) and those of the shrinkage rate (Figure 9c,d) of the nanopowders. Table 3 presents the results of investigations of the microstructure, density, and mechanical properties of these powders.
The analysis of the curves L(T) presented in Figure 9a shows the intensive shrinkage of the nanopowders to begin at lower temperatures as compared with the initial coarse-grained powders. The increase in the HEBM time from 5 up to 20 min leads to a shift in the temperature at the beginning of the intensive shrinkage stage from ~780–800 °C down to ~720 °C with a simultaneous increase in the maximum shrinkage Lmax from ~2.6–2.7 mm up to 3.6–3.7 mm. The temperature at the end of the intensive shrinkage stage increases weakly with an increase in tHEBM from 5 up to 20 min. Further increasing the HEBM time up to 40 min leads to an increase in the temperature at the beginning of the intensive shrinkage stage up to ~750 °C and to a decrease in Lmax down to ~3.0–3.1 mm. The similar character of the dependence Lmax(tHEBM) was observed for the annealed nanopowders (Figure 9b).
As one can see in Figure 9b, the increase in the HEBM time leads to a shift in the curve S(T) towards lower temperatures and to an increase in the maximum shrinkage rate Smax. As one can see in Figure 9b, the maximum shrinkage rate for the coarse-grained powders was observed at the temperatures ~1060–1080 °C; the shrinkage rate at those temperatures was Smax ~10−2 mm/s. Increasing the HEBM time up to 20–40 min leads to an increase in Smax of up to~(1.1–1.2) × 10−2 mm/s and to a decrease in the temperature corresponding to the maximum of the curve S(T) of up to 850–890 °C. In the case of the annealed nanopowders, the maximum shrinkage rate Smax~(1.3–1.4) × 10−2 mm/s was observed at the sintering of the nanopowders subjected to HEBM for 20 min.
Annealing in hydrogen affects the curves L(T) strongly and, to a lesser extent, the curves S(T). Comparing Figure 9a,b shows the annealing in hydrogen to result in an increase in the shrinkage of the initial coarse-grained powders. The scale for increasing the maximum shrinkage Lmax for the annealed nanopowders was ~0.1–0.15 mm and depended weakly on the HEBM time. The annealing of the nanopowders in hydrogen leads to an insufficient decrease in the temperature corresponding to the maximum of the curve S(T) and to a weak increase in the maximum shrinkage rate Smax.
It is interesting to note that the densities of the samples depend on the HEBM time non-monotonously. As one can see from Table 3, the increase in tHEBM from 0 up to 20 min leads to a decrease in the density from 16.97 down to 15.68 g/cm3. After HEBM for 40 min, the densities of the samples increased by up to 16.78 g/cm3. The dependence of density on the HEBM time for the samples sintered from the annealed nanopowders has a similar character. It should be stressed here that the annealing resulted in an increase in the densities of the sintered samples by ~0.1–0.2 g/cm3.
The analysis of the results presented in Table 4 shows that increasing the HEBM time leads to a decrease in the mean grain sizes in the alloys sintered at 1200 °C. The mean grain sizes in the alloys sintered from the annealed and nonannealed powders were close to each other (Figure 10).
The HTAs obtained using SPS have a sufficiently uniform microstructure (Figure 10 and Figure 11), in which few large grains are present. These grains are the recrystallized microstructure areas with minimal γ-phase content (Figure 11). Such large grains were observed in the samples obtained from the nanopowders with tHEBM ≥ 10 min most often. The volume fraction and sizes of the abnormally large grains in the samples sintered from the annealed nanopowders were considerably smaller than those in the samples sintered from the nonannealed nanopowders (Figure 10). This result suggests that the presence of the agglomerates after HEBM and increased oxygen concentration in the nanopowders are the most probable origins of the abnormally large grains that appear.
Figure 12 presents the results of XRD phase analysis of the samples obtained with SPS from the nanopowders. The analysis of the XRD curves presented shows the broadening of the α-W peaks in the sintered samples to be much lower than that in the nanopowders after HEBM. The asymmetry of the α-W XRD peaks in the sintered samples was absent, while the peak position 2Θmax was shifted towards smaller diffraction angles as compared with the one in the nanopowder. No essential differences in the characteristics of the (110) α-W peaks for the samples sintered from the nanopowders subjected to HEBM for different times were observed (Figure 12b,c). This evidences that the intragranular stresses formed in the tungsten powders during HEBM relax in the course of sintering.
The low-intensity γ-phase peaks are visible in the XRD curves of the sintered samples. Such peaks were absent in the XRD curves of the nanopowders after HEBM (Figure 5a,b). The characteristics of the XRD peaks from the γ-phase almost do not depend on the HEBM time (Figure 12b,c). No peaks of impurity phases were detected in the XRD curves (see [71]).

4. Discussion

The nonmonotonous dependence of the density of the samples obtained using SPS on the HEBM time (Figure 13) is one of the most interesting results obtained in the present work. Decreases in the alloy density from 98.4% down to 90.9% for the samples sintered from the nonannealed nanopowders and from 98.7% down to 94.6% for the ones sintered from the annealed nanopowders were observed when increasing HEBM time from 0 up to 20 min.
It is notable that large pores were absent in the microstructures of the sintered samples. The comparison of the microstructures of the samples sintered from the coarse-grained powders and from the nanopowders after tHEBM = 20 min (Figure 8 and Figure 9) did not reveal any essential increase in the sizes and volume fraction of the pores. So far, one can conclude that the decrease in the density of the alloy sintered from the nanopowders originates not from the increase in the volume fraction of the pores but from other factors. This conclusion is supported indirectly by the analysis of the curves L(T) and S(T) presented in Figure 7. As has been shown above, the maximum values of the shrinkage Lmax and of the shrinkage rate Smax were observed in the case of SPS of the powders subjected to HEBM for 20 min.
To answer the question of the origin of the nonmonotonous dependence of the density on the HEBM time, we analyze the SPS mechanisms of the W-Ni-Fe nanopowders. First, it is worth noting that the characteristic sintering temperature Ts = 1200 °C is ~0.4 Tm(W) and, according to [72], the diffusion intensity and the strain rate in tungsten are very low. (Here Tm(W) = 3695 K is the melting point of tungsten [72]).
As one can see in Figure 9a,b, the curve L(T) has a usual three-stage character; the shrinkage of the nanopowders is finished almost completely within the intensive shrinkage stage (Stage II) in the temperature range from 750–800 °C to 1000–1050 °C. The intensity of shrinkage of the nanopowders within the third stage of sintering (Ts > 1000–1050 °C), at which the grain growth occurs, is often very low.
Analysis of the compaction kinetics of the nanopowders at Stage II can be made using the Young–Cutler model [73] developed for the analysis of the compaction curves of fine-grained powders in a continuous heating regime. The Young–Cutler model [73] describes the initial stage of nonisothermic sintering of spherical particles in the conditions of simultaneous volume and grain boundary diffusion as well as plastic deformation processes. According to [73], the slope of the dependence ln(T∂ε/∂T) − Tm/T corresponds to the effective activation energy of the nonisothermic sintering process mQs2 where m is a numerical coefficient depending on the diffusion mechanism and Tm = Tm(Ni) = 1723 K is the melting point of the γ-phase [1,2]. Magnitudes of m = 1/3 were found for the case of the grain boundary diffusion, m = 1/2 were found for the case of the volume diffusion in the crystal lattice, and m = 1 were found for the case of the creep of the material [73].
The dependencies ln(T·∂ε/∂T) − Tm/T are presented in Figure 14. As one can see in Figure 14, the dependencies ln(T·∂ε/∂T) − Tm/T have a usual two-stage character that confirms the correctness of application of the Young–Cutler model to analyze the sintering kinetics of the W-Ni-Fe alloy. The values of the effective sintering activation energy at the intensive shrinkage stage (mQs2) are presented in Table 4. The mean uncertainty of determining the activation energy mQs2 was ±0.2 kTm.
In the case of the coarse-grained powders, the magnitude of the effective SPS activation energy mQs2 was close to the activation energy of the grain boundary diffusion in nickel (Qb(Ni) = 115 kJ/mol [72]) at m = 1/3. This suggests that the kinetics of high-speed sintering of the coarse-grained W-7%Ni-3%Fe powders at the intensive shrinkage stage is controlled by the intensity of the grain boundary diffusion in the γ-phase.
A good correspondence of the SPS activation energy of the nanopowders to the data on the activation energy of the diffusion processes reported in the literature was observed for m = 1 (Table 4). The value of m = 1 allows for concluding that the sintering kinetics of the W-7%Ni-3%Fe nanopowders is determined by the Coble creep intensity. This conclusion agrees qualitatively with M.F. Ashby’s deformation-mechanism maps [72], in which the SPS regimes used in the present work correspond well to the creep area for nickel (stress σ = 70 MPa~9·10−4 G where G = 78.9 GPa [72] is the shear modulus for nickel, temperature 1200 °C). In our opinion, the large lengths of the grain boundaries in the sintered materials are the origin of the realization of the Coble creep mechanism in SPS of nanopowders since no intensive grain growth has taken place at this sintering stage yet. It is also notable that a decrease in the grain sizes would lead to an essential increase in the creep rate in the metal materials [74]. It is also notable that Coble creep is one of the main compaction mechanisms in SPS of WC [75], WC-Co [76,77], and YAG:Nd-W [78] nanopowders.
It is notable that, sometimes, lower values of the activation energy of the grain boundary diffusion in fine-grained nickel are reported in the literature as well. In particular, creep activation energy of 110–115 kJ/mol and activation energy of the grain boundary diffusion of ~66 kJ/mol were reported for ultrafine-grained nickel with the grain sizes 0.3–0.5 μm [79].
The annealing of the nanopowders in hydrogen leads to a decrease in the SPS activation energy (Table 4). In our opinion, this originates from, first of all, the reduced concentration of oxygen adsorbed on the nanopowder particle surfaces. This leads to an increase in the diffusion creep rate in the W-7%Ni-3%Fe nanopowders at elevated temperatures. Thin tungsten oxide layers, which can form on the W nanoparticle surfaces when heating in vacuum, can be another origin of decreases in the creep rate. The oxide nanoparticles located at the tungsten grain boundaries can lead to a decrease in the creep rate at the second SPS stage.
In the high-temperature range, the slope of the dependence ln(T·∂ε/∂T) − Tm/T (Figure 14) becomes negative. This means that one has to use another approach to estimate the sintering activation energy in a higher temperature range. According to [80], one can estimate the activation energy at this stage using the model of diffusion and dissolving of pores located near the grain boundaries in fine-grained materials. The correctness of application of this procedure was previously demonstrated in [47,78,81,82]. The activation energy at the nonisothermic sintering stage Qs3 can be determined from the slope of the dependence ρ(T)/ρth in the double logarithmic axes ln(ln(α·ρ/ρth/(1 − ρ/ρth)) − Tm/T where α is the coefficient of compaction when pressing (α = 0.45 for nanopowders α-W) (Figure 15). The mean uncertainty in determining the activation energy Qs3 was ±1.5 kTm. The calculated values of Qs3 are presented in Table 4. For the annealed nanopowders, the value of Qs3 was ~2–3 kTm lower than the one for the mechanically activated nanopowders.
The calculated values of the SPS activation energy are in good agreement with the activation energy of heterodiffusion of tungsten atoms in the γ-phase (taking into account corrections for a decrease in the activation energy of grain boundary diffusion in fine-grained materials [83]). Available data on the activation energy of the sintering of W-Ni-Fe alloys give completely different values; Qs for the W-8.4Ni-3.6Fe alloy is 250 kJ/mol according to [84], while in [85] Qs = 367 kJ/mol for the W-8.4Ni-3.6Fe alloy and 480 kJ/mol for 95W-3Ni-2Fe. It was shown in [86] that the activation energy of SPS for a fine-grained W-5.6%Ni-1.4%Fe alloy depends on the heating rate: at V < 30 °C/min, the value of Qs = 454 kJ/mol, and at V > 200 °C/min the Qs value = 200 kJ/mol. The diffusion activation energy of 181W in the nickel crystal lattice is Qv ~268–309 kJ/mol [9,87]. In the cases of bulk diffusion in the Ni-W system and in the γ-Fe-W system, the Qv values are 295–306 kJ/mol and 268 kJ/mol, respectively [88,89]. So far, it can be concluded that the compaction of W-Ni-Fe nanopowders at high temperatures is determined by the intensity of heterodiffusion of tungsten atoms in the crystal lattice of the γ-phase.
Summarizing the results of this analysis, one should stress that intensive shrinkage of the mechanically activated W-7%Ni-3%Fe nanopowders occurs at low temperatures and is characterized by small values of compaction activation energy. In our opinion, low activation energy of sintering in nanopowder materials is the origin of the reduction in the activation energy of sintering for the W-Ni-Fe nanopowders.
According to the theory of nonequilibrium grain boundaries [83], the increase in the free (excess) volume of the grain boundaries Δα is the origin of the decrease in the activation energy of the grain boundary diffusion in strongly deformed fine-grained metals and alloys. The magnitude of Δα is proportional to the density of orientation mismatch dislocations (OMDs) captured by the grain boundaries during severe plastic deformation. In the course of HEBM, the grinding of the γ-phase particles with the FCC lattice is difficult due to the high ductility of these particles. In the course of HEBM, the grinding of the γ-phase particles and the accumulation of the OMDs at the grain boundaries take place [83]. The diffusion permeability of the γ-phase grain boundaries after HEBM appears to be higher than that of conventional grain boundaries in the γ-phase formed during sintering individual γ-phase particles to each other. The enhanced diffusion permeability of the nonequilibrium grain boundaries results in accelerated diffusion of the tungsten atoms in the γ-phase, and in an enhanced Coble creep rate. These factors lead to a decrease in the SPS activation energy of the W-Ni-Fe nanopowders.
The second factor promoting the decrease in the activation energy of the SPS of nanopowders can be the nonequilibrium state of their crystal lattice.
As has been shown above, an asymmetric distortion of the (110) α-W XRD peak towards higher reflection angles after HEBM was observed. In our opinion, this means that the crystal lattice constant in the surface layers of the W particles appears to be smaller than the one in the central parts of the W particles. So far, the asymmetry of the (110) α-W XRD peak originates from the increase in the concentrations of the Ni and Fe atoms in the surface layers of the α-W particles and from the increase in the concentration of the W atoms in the γ-phase particles with nonequilibrium grain boundaries.
Tungsten is known to have high solubility in nickel. At elevated temperatures, the concentration of the W atoms in the γ-phase can reach 25–28% [4]. Partial dissolving of the α-W nanopowders in the γ-phase takes place during sintering, leading to a decrease in the density of the sintered W-Ni-Fe samples. This process can be accelerated by a larger specific surface area of the α-W nanoparticles, strong distortion of the crystal lattice in the surface layers of the α-W nanoparticles, and high diffusion permeability of the γ-phase nonequilibrium grain boundaries.
Now, we consider the origins of the nonmonotonous dependence of the density of the W-7%Ni-3%Fe alloy on the HEBM time (Figure 13). This effect was observed, in particular, for the nanopowders annealed in hydrogen and, consequently, its nature is not related to the oxidation of the nanopowders in the course of storing.
The primary origin of the decrease in the alloy density is the strain-stimulated dissolving of the W atoms in the γ-phase lattice during HEBM. This effect can have a considerable scale for the W-7%Ni-3%Fe alloy since the volume fraction of the γ-phase in this alloy exceeds 20%. Increasing the HEBM time leads to an increase in the volume fraction of the tungsten particles dissolved in the γ-phase. The decrease in the initial density of the W-Ni-Fe nanopowders would lead to a decrease in the final density of the alloy at given sintering regimes provided all other conditions are equal.
It is worth noting that the acceleration of the grain boundary diffusion processes and the increase in the creep rate should lead to an increase in the rate of solid phase sintering of the W-Ni-Fe nanopowders. This effect would compensate partly for the negative effect of HEBM on the density of the W-7%Ni-3%Fe alloy.
The question of the origins of the increase in the SPS activation energy and density with long HEBM times (tHEBM = 40 min) is more complex. In our opinion, this effect is caused simultaneously by three factors.
First, it is worth noting that the intensity of the strain-induced dissolving of the tungsten particles can decrease at long HEBM times due to the achievement of the solubility limit of W in the γ-phase. In this case, the increase in the HEBM time leads to an increase in the creep rate due to an increase in the nonequilibrium degree of the grain boundaries in the γ-phase and a decrease in the grain sizes in the alloy. This should help increase the density of tungsten alloys.
The XRD phase analysis shows that the microstrain of the α-W crystal lattice begins to decrease after 40 min of HEBM (Figure 5b). This effect can originate from the decrease in the concentrations of the Ni and Fe atoms in the surface layers of the α-W nanoparticles as well as from the decrease in the dislocation density in the α-W particles. The heating of the powders during HEBM is the most probable origin of this effect. The increase in the temperature during HEBM reduces the distortion degree of the α-W crystal lattice and, as a consequence, the tendency of the nanoparticles to dissolve in the strongly deformed γ-phase. This leads to an increase in the density of the tungsten alloy.
The increase in the density of agglomerates after 40 min of HEBM is the third probable origin. The increase in the density of agglomerates can originate from the intensive plastic deformation of the tungsten nanoparticles during HEBM as well as from the heating of the samples. The increase in the packing density of the nanoparticles inside the agglomerates leads to an increase in the initial density of the powder composition W-Ni-Fe and, as a consequence, provides an opportunity to achieve a higher final density of the tungsten alloy when sintering in the same conditions.
Finally, we will discuss briefly the results of investigations into the mechanical properties of the HTAs. As one can see in Figure 16a, the dependencies of hardness and yield strength on the grain size can be described by the Hall–Petch relation with good accuracy. Traditionally, the dependence of the strength characteristics on the grain size in coarse-grained HTAs is suggested to have more complex character. In particular, the magnitudes of the ultimate strength and of the yield strength in the tension tests depend strongly on the volume fraction of the γ-phase particles as well as on the relations of the lengths of the intergranular boundaries W-W and those of the interphase boundaries W-γ [5,12,32,33]. The realization of the Hall–Petch effect in ultrafine-grained HTAs can be a consequence of considerably greater lengths of grain boundaries that lead to a proportional decrease in the sizes (thicknesses) of the interphase boundaries α-W-γ-phase.
Knowing the magnitudes of the yield strength σy, of the macroelasticity stress σ0, and of the average grain size d, one can calculate the Hall–Petch coefficient according to the formula KHP = (σy − σ0)·d1/2 for each alloy, as reflected in Table 2 and Table 3. Figure 16b presents the dependence of KHP on the grain size. As one can see in Figure 16b, increasing the sintering temperature and the grain growth led to an increase in the Hall–Petch coefficient. The maximum magnitudes of KHP were achieved in the HTAs sintered at 1450 and 1500 °C (Table 2). In our opinion, this evidences an increase in the adhesion strength of the interphase boundaries with increasing sintering temperature. The increase in the concentration of the W atoms in the γ-phase can also contribute additionally to the increase in KHP.
No essential differences in the magnitudes of KHP for the alloys obtained from the nonannealed and annealed nanopowders were observed. This suggests that the differences in the strength characteristics of the HTAs are observed to originate from, first of all, the differences in the grain sizes.

5. Conclusions

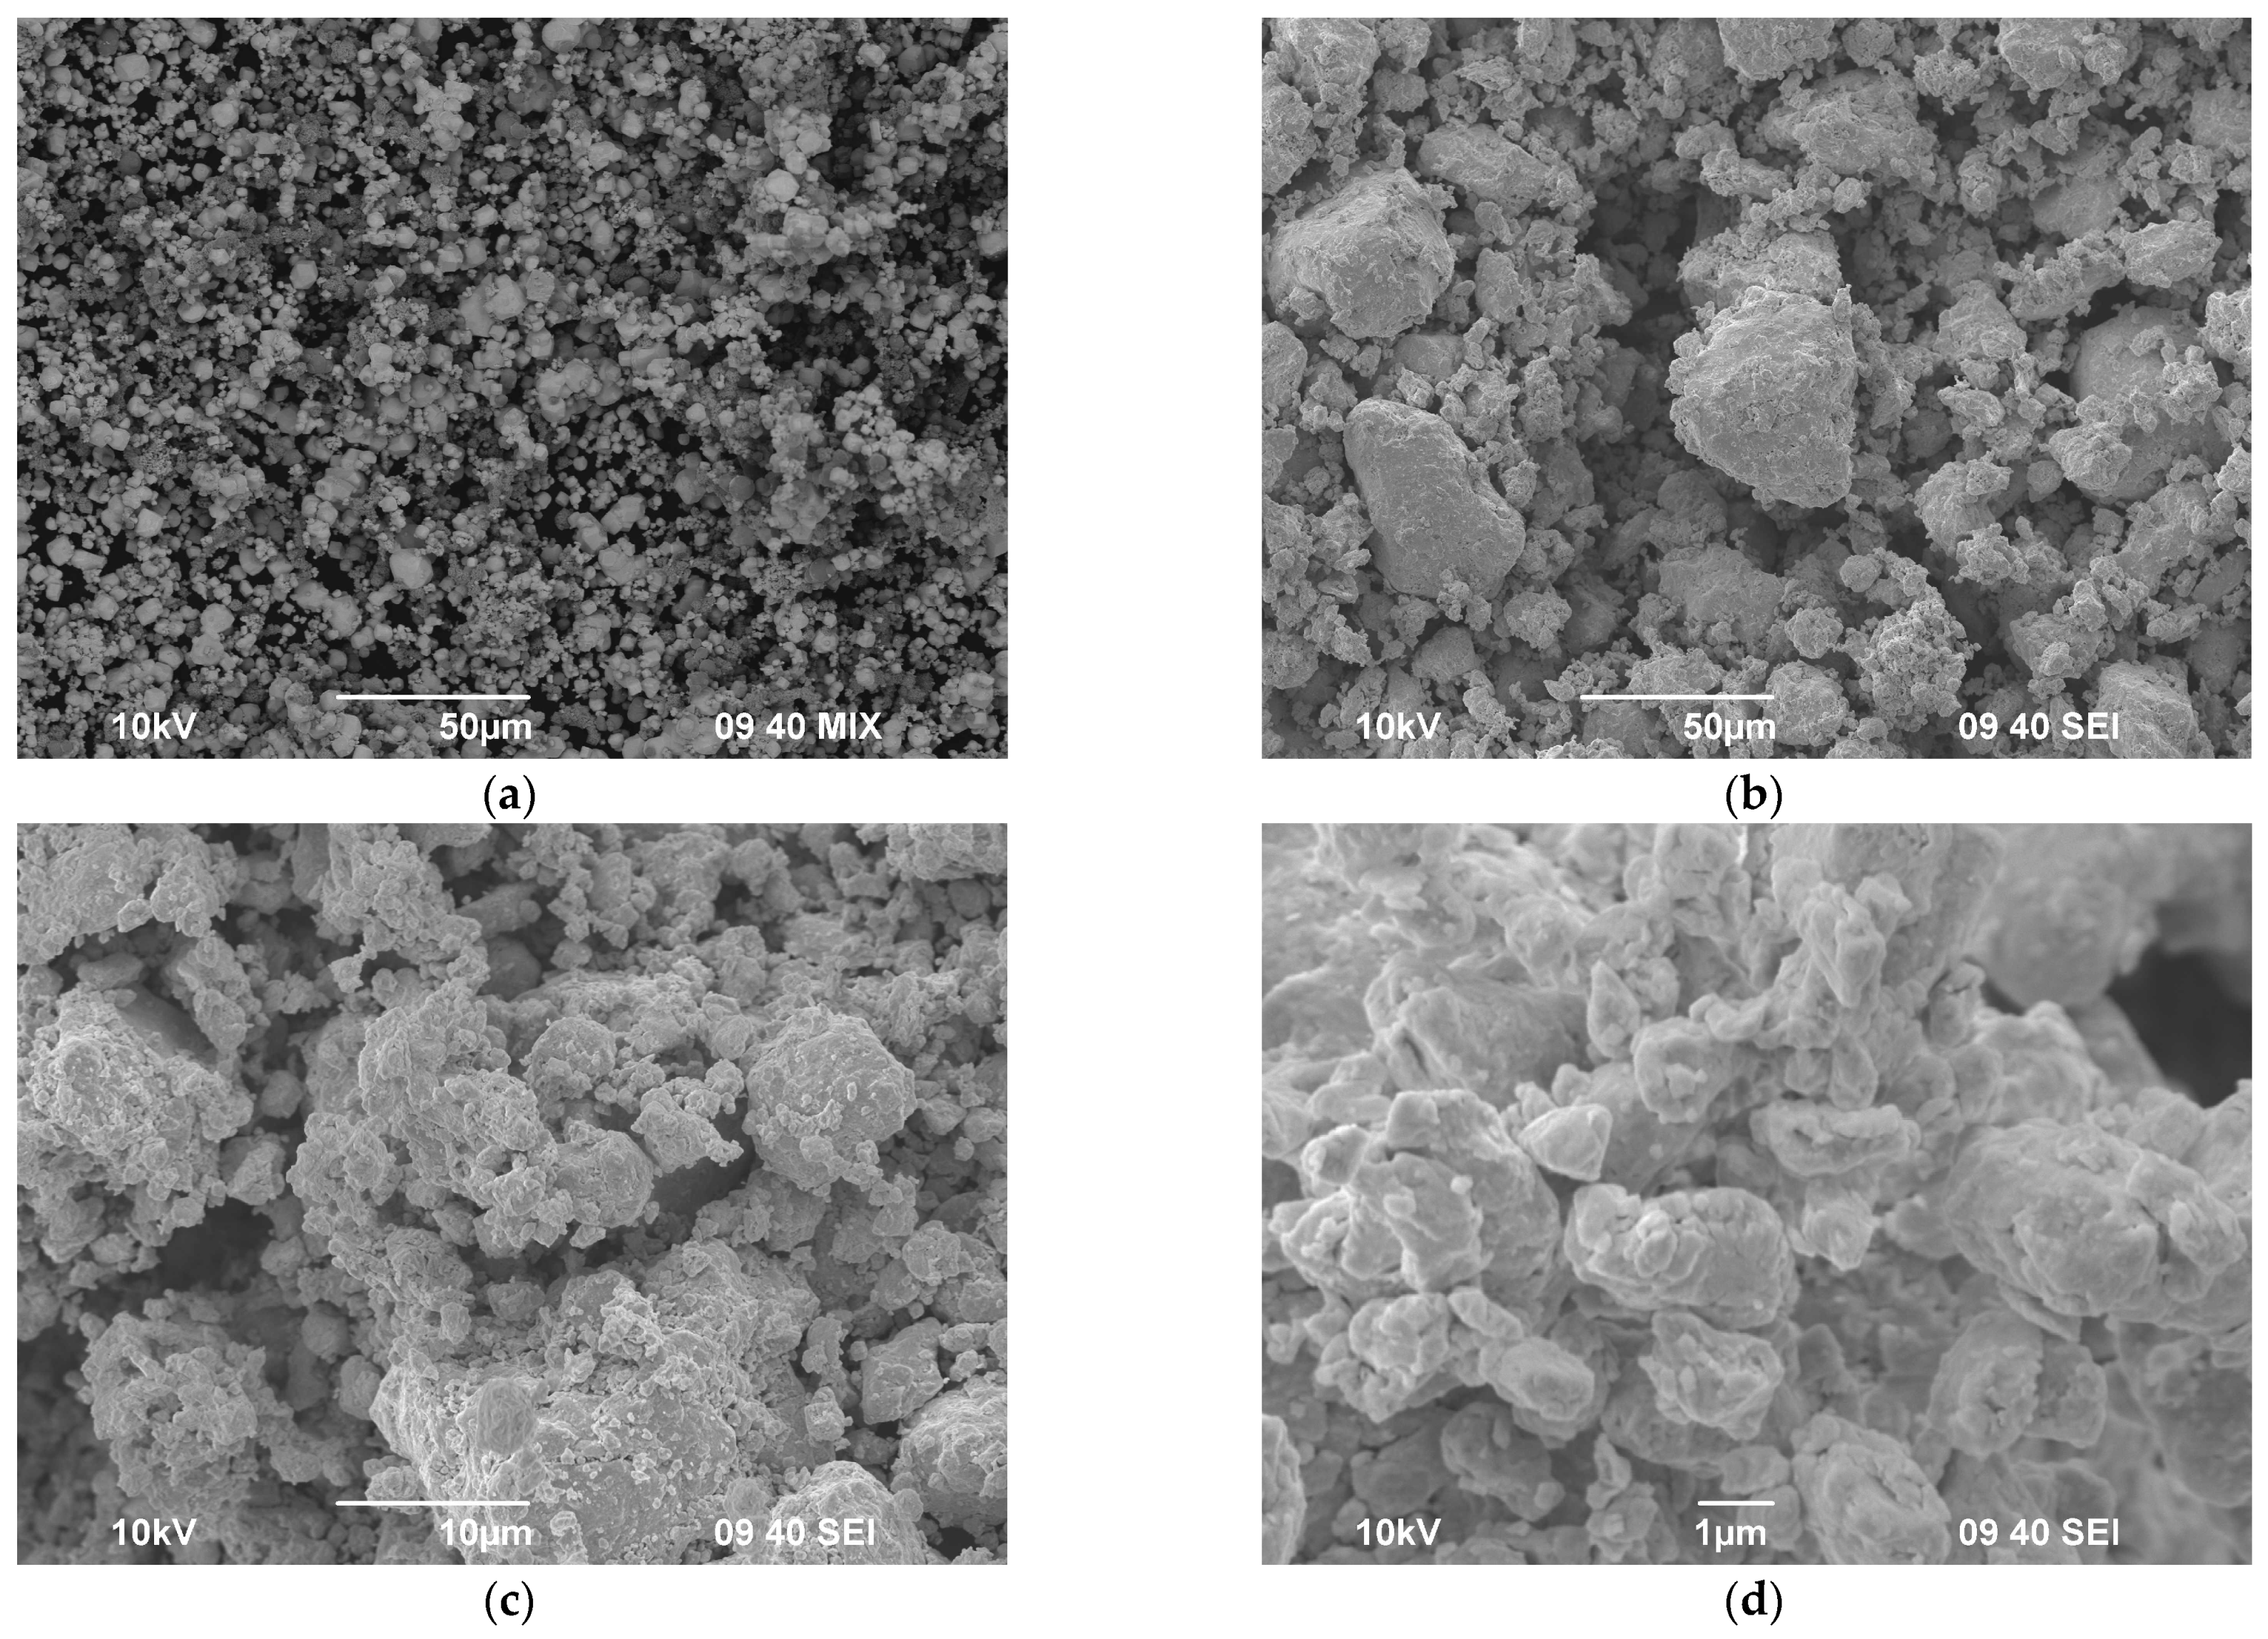
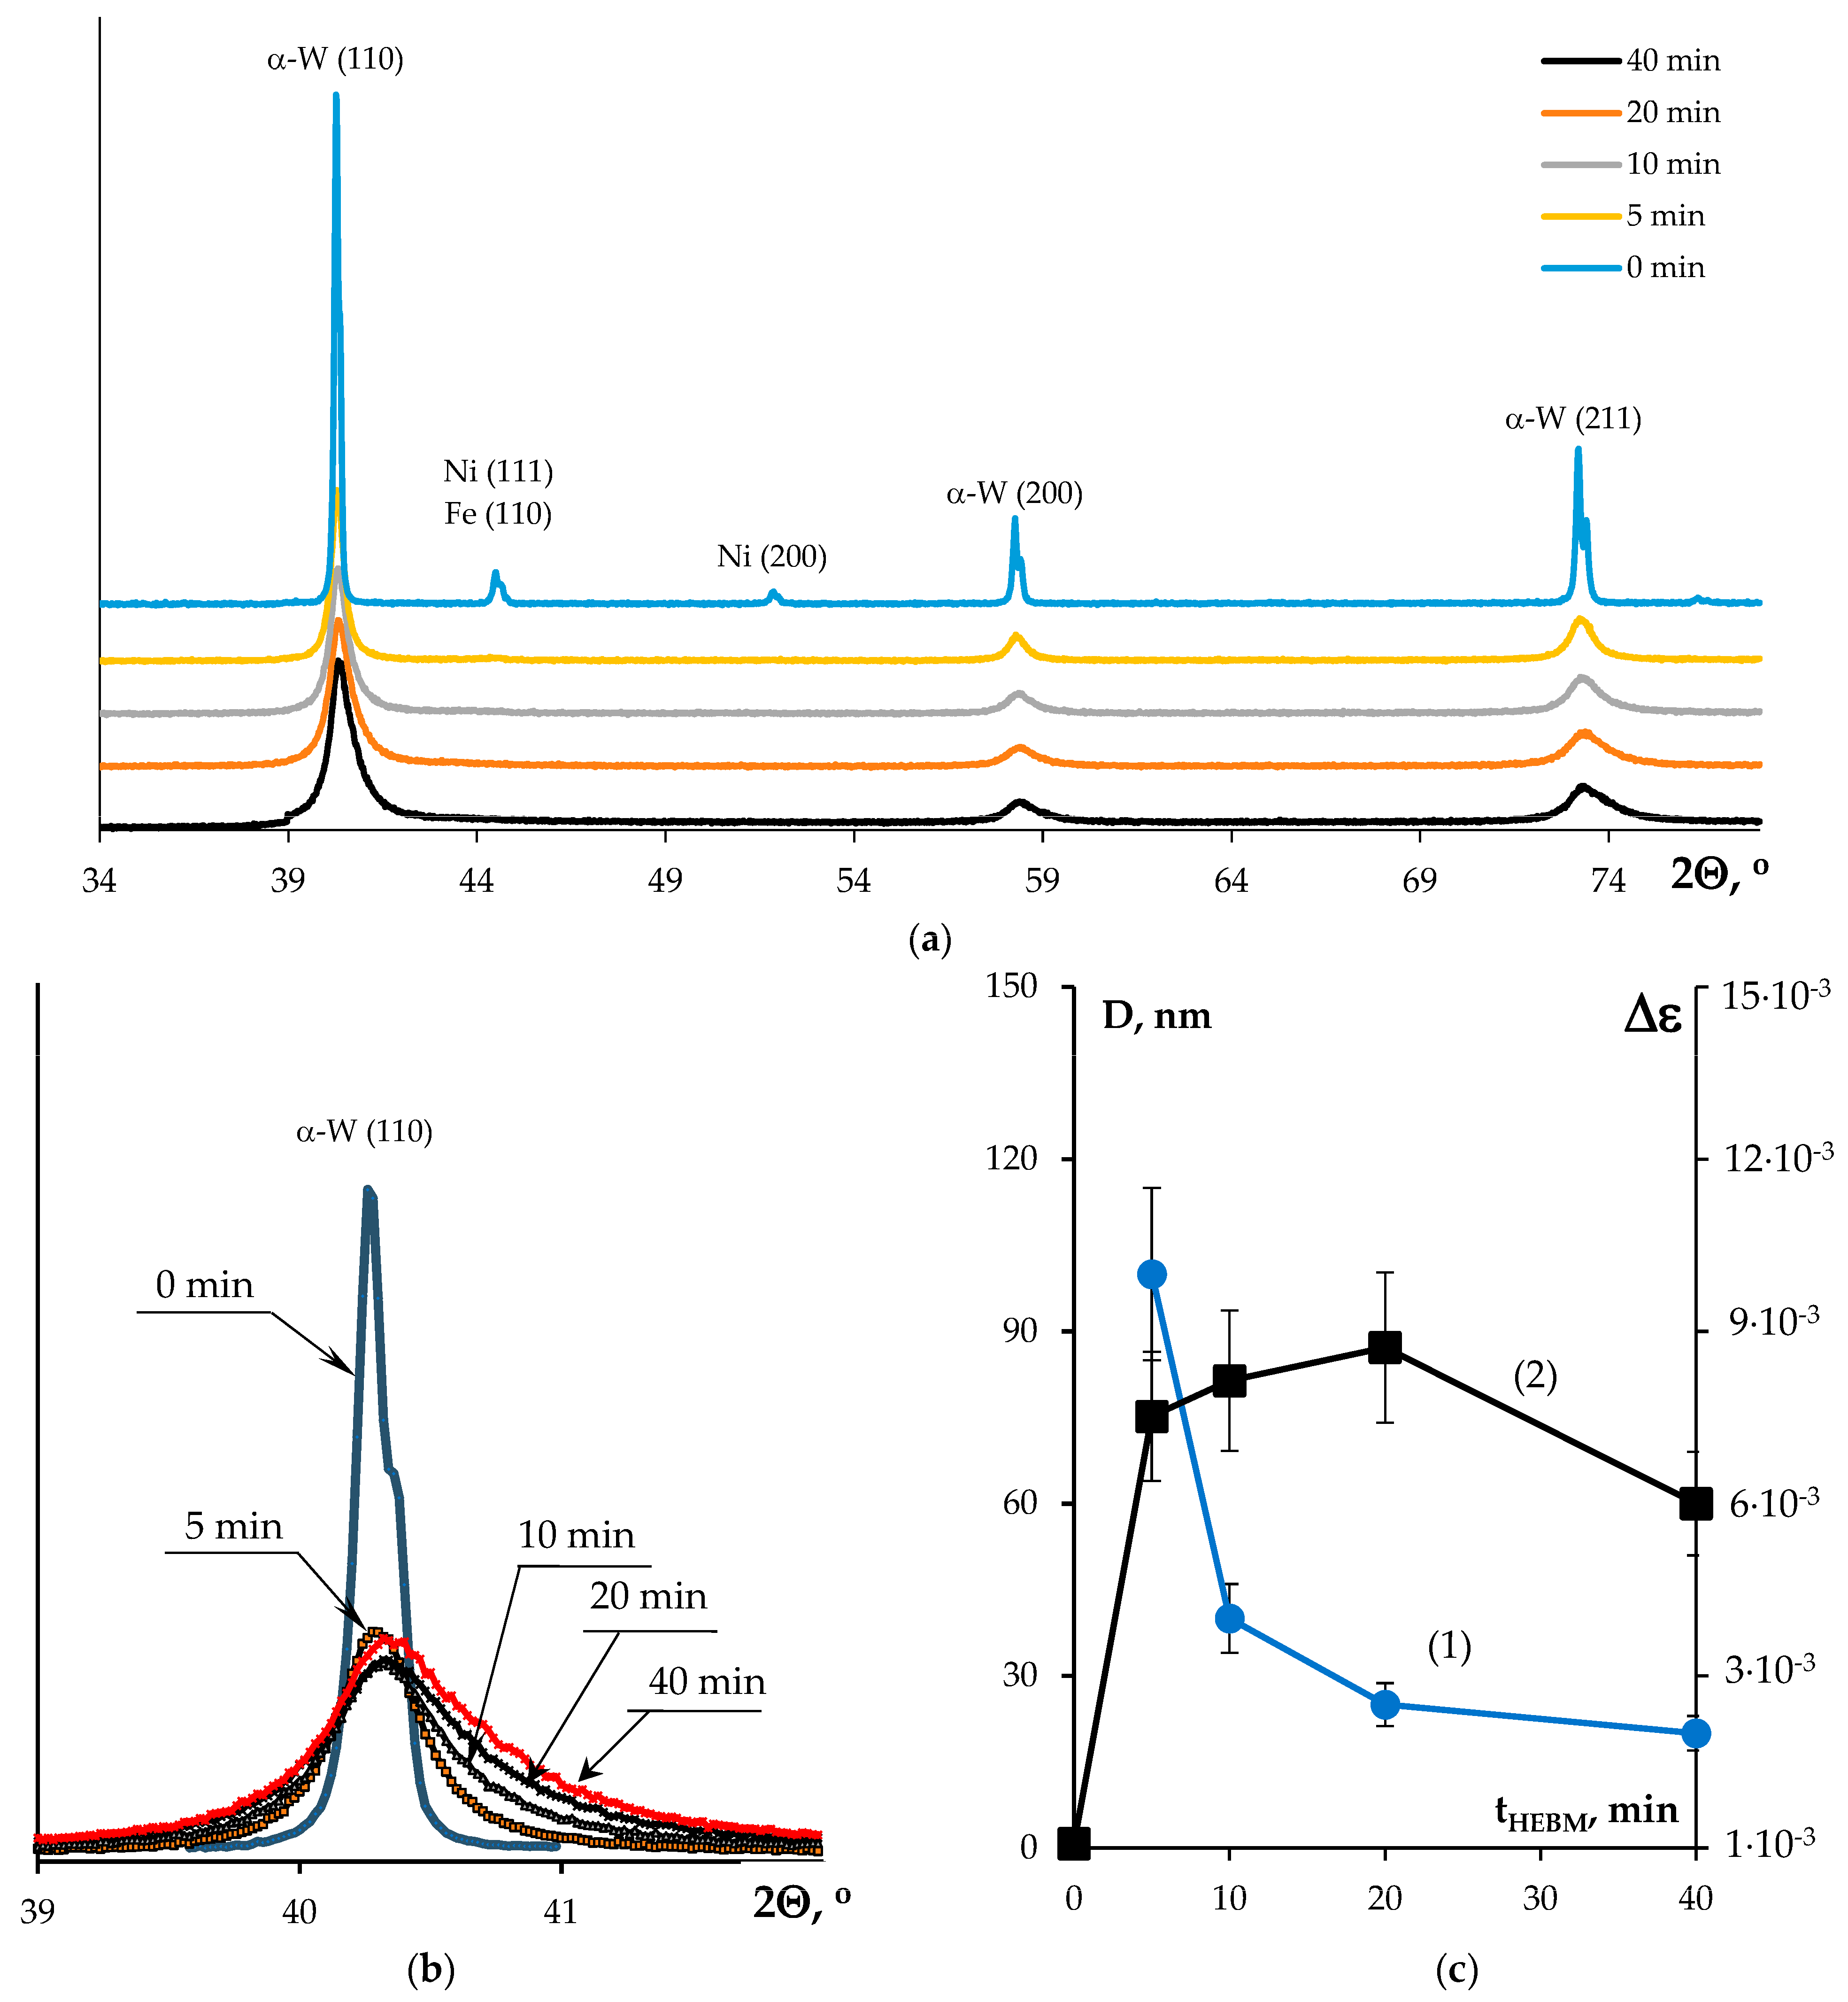
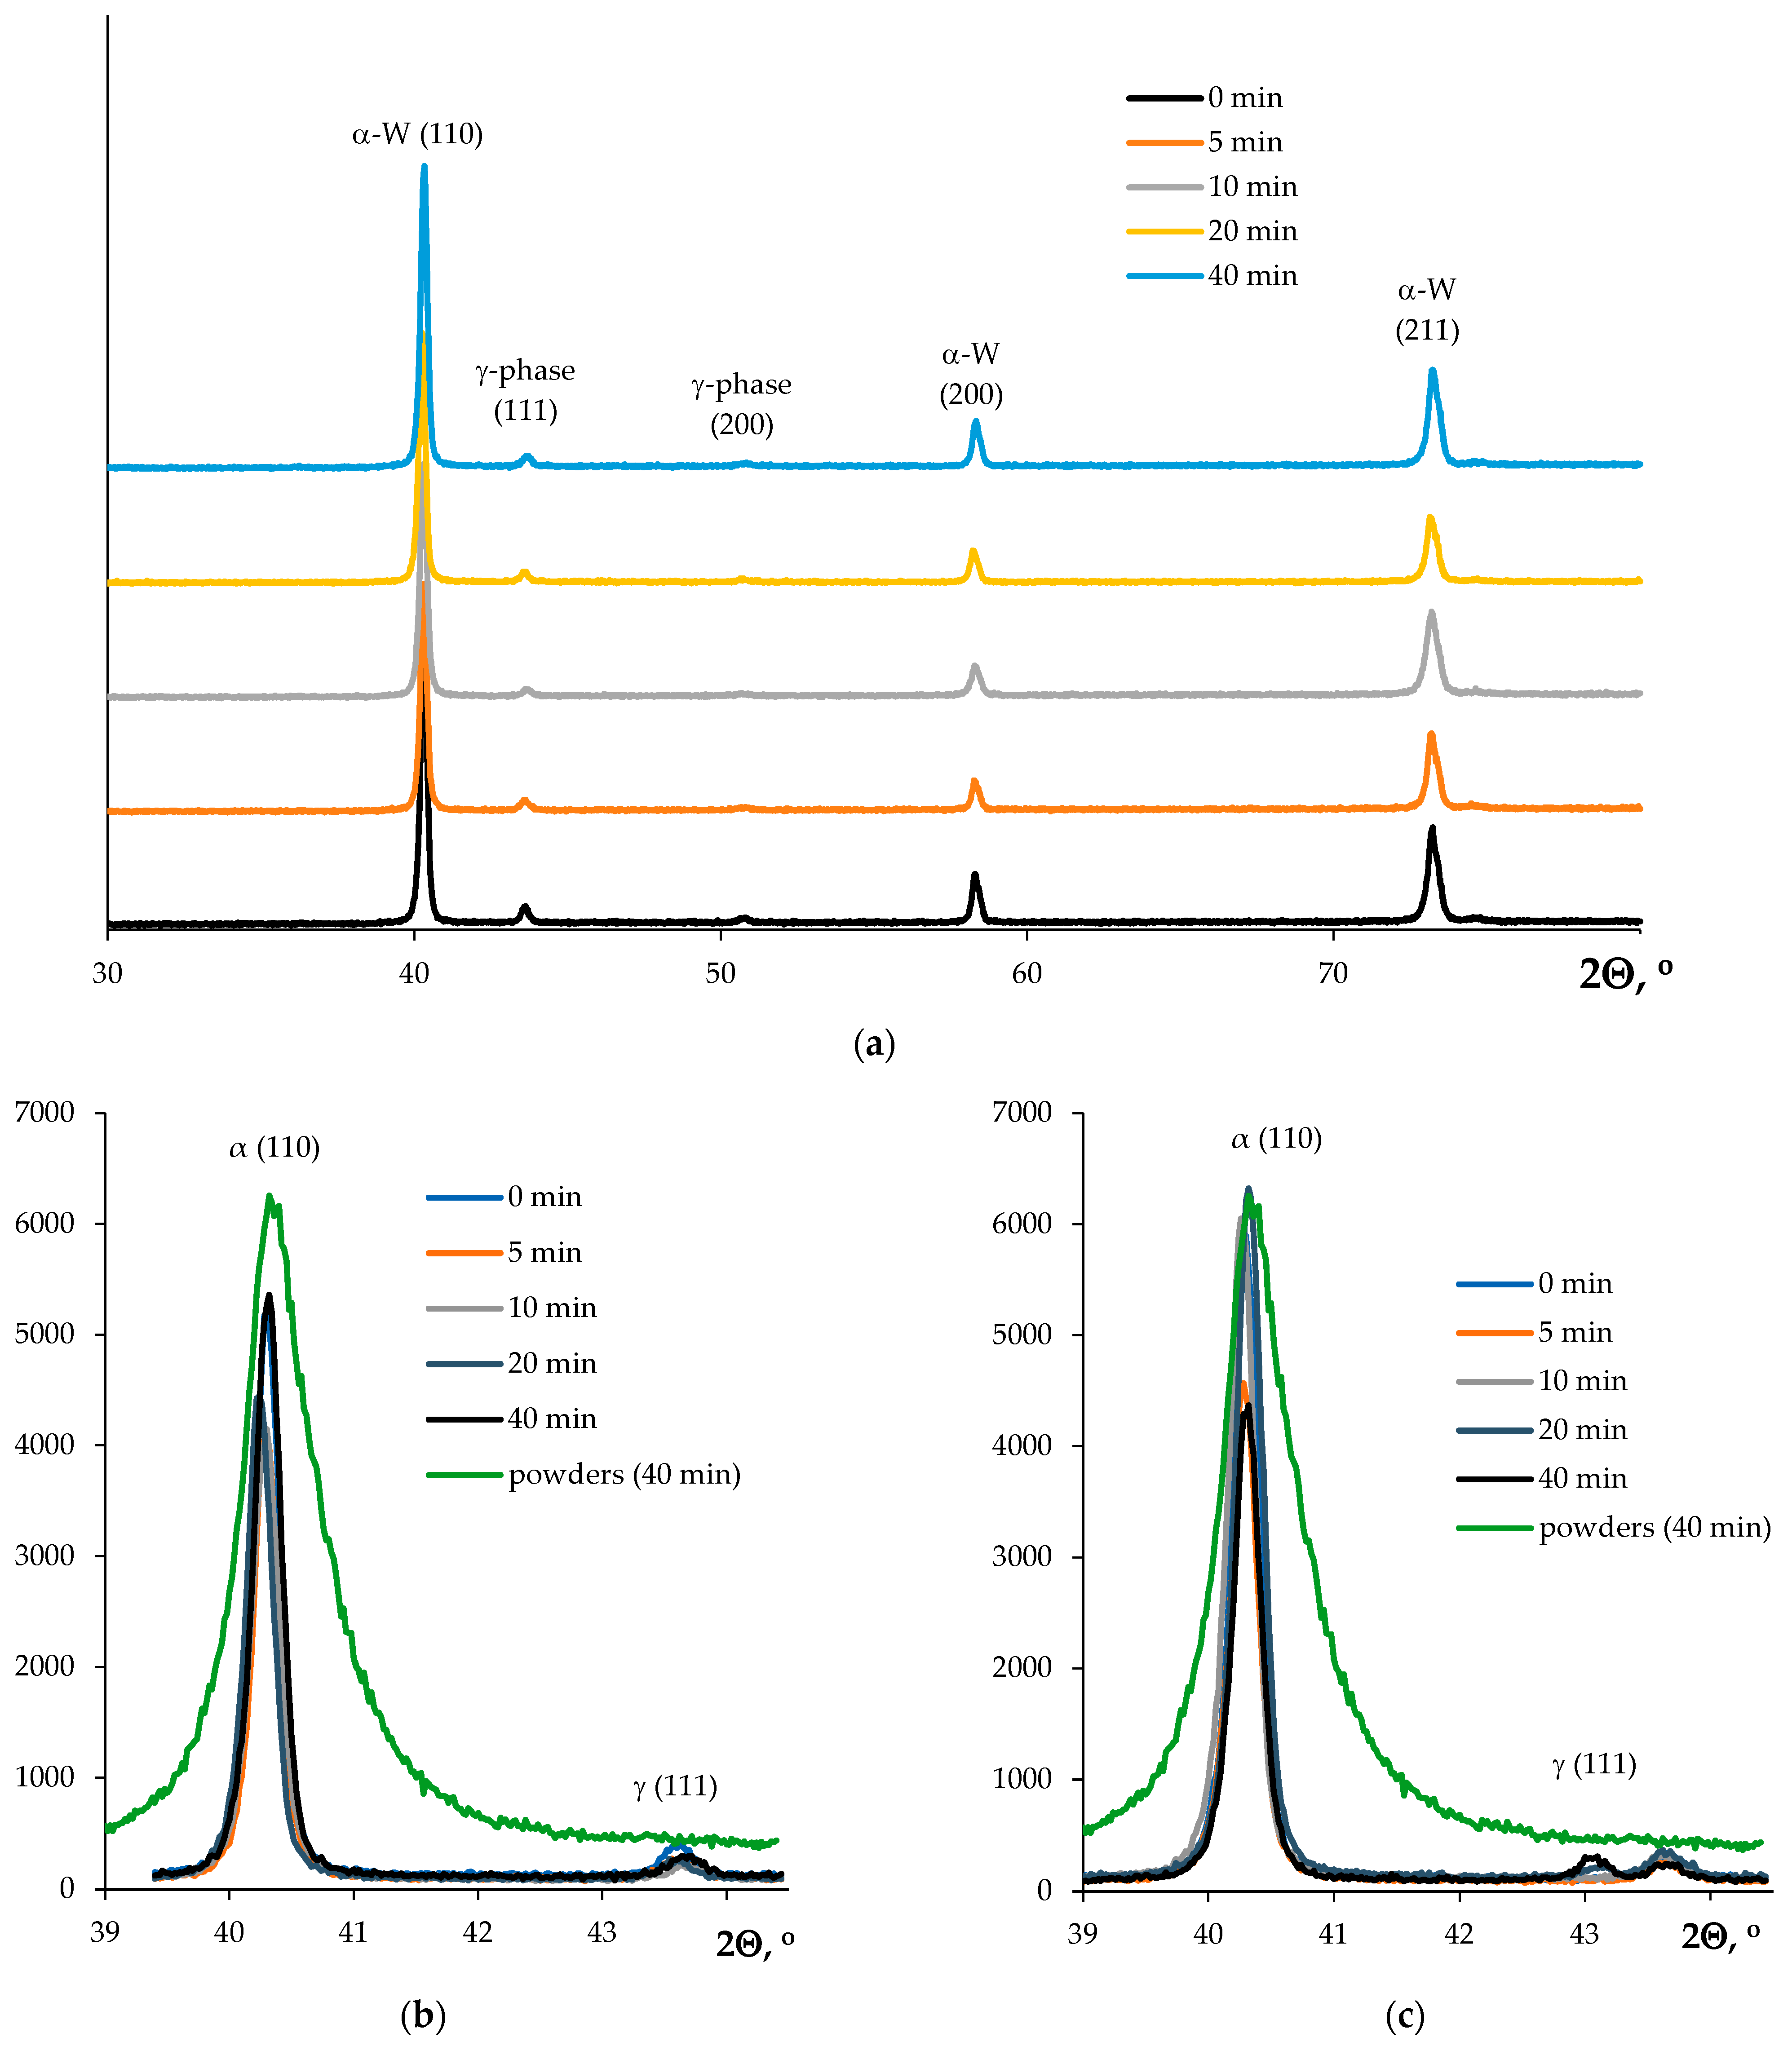
  • High-energy ball milling (HEBM) of W-Ni-Fe powders leads to grinding of the tungsten particles and to the formation of a supersaturated solid solution of W atoms in the γ-phase. After HEBM, the W nanoparticles have core–shell structures, which have high concentrations of Ni and Fe atoms in the surface layers of the α-W nanoparticles. This leads to broadening and asymmetry of the α-W XRD peaks.
  • The SPS kinetics for the initial fine W-7%Ni-3%Fe powders is governed by the intensity of grain boundary diffusion in the γ-phase. SPS was shown to allow obtaining samples with increased density, small grain sizes (~1.2–1.3 μm), and increased hardness (4.2–4.3 GPa) as compared with the samples obtained via conventional sintering of the fine-grained powders in hydrogen.
  • The SPS kinetics of the nanopowders has a two-stage character owing to intensive Coble diffusion creep in the low-temperature range and intensive diffusion of W atoms in the crystal lattice of the γ-phase at elevated temperatures. The SPS activation energy in the low heating temperature range is small and originates from the nonequilibrium state of the grain boundaries in the γ-phase with an increased density of defects arising during HEBM. The recrystallization process in the γ-phase is a possible origin of the change in the diffusion mechanism responsible for the intensity of the nanopowder compaction process in SPS. Reducing the activation energy of sintering will improve the density of the sintered samples.
  • The relative density of HTAs obtained using SPS was shown to depend on the HEBM time non-monotonously (with a minimum). It was suggested that the effect of the reduction in the density is caused by the formation of strongly supersaturated solid solutions of Ni and Fe in the tungsten particles. Increasing the HEBM time leads to a decrease in particle size and an increase in the diffusion coefficient across nonequilibrium grain boundaries. This will contribute to an increase in the creep rate and acceleration of sintering of HTAs, and, as a consequence, will lead to an increase in the density of HTAs.
  • Annealing the nanopowders in hydrogen was shown to result in a decrease in the sintering activation energy and in an increase in the density of the sintered HTAs. This originates from the decrease in the oxygen concentration in the nanopowders and an increase in the Coble diffusion creep rate in SPS.
  • The dependencies of the yield strength and of the hardness on the grain size are described by the Hall–Petch equation with good accuracy. The maximum values of the Hall–Petch coefficient were observed for the alloys sintered in hydrogen at elevated temperatures (1450, 1500 °C). This originates from the high adhesion strength of the interphase boundaries and probably also from the increased concentration of W atoms in the γ-phase.

Author Contributions

Conceptualization, N.V.M. (Nataliya V. Malekhonova) and A.V.N.; methodology, N.V.M. (Nataliya V. Malekhonova) and A.V.N.; formal analysis, N.V.M. (Nataliya V. Malekhonova), V.N.C. and A.V.N.; investigation, N.V.M. (Nataliya V. Malekhonova), N.V.M. (Nikolay V. Melekhin), A.M.B., A.R.F., M.S.B., E.A.L. and N.V.S.; resources, V.N.C.; data curation, N.V.M. (Nataliya V. Malekhonova) and A.V.N.; writing—original draft preparation, N.V.M. (Nataliya V. Malekhonova), V.N.C. and A.V.N.; writing—review and editing, N.V.M. (Nataliya V. Malekhonova), V.N.C. and A.V.N.; visualization, N.V.M. (Nataliya V. Malekhonova) and A.V.N.; supervision, V.N.C.; project administration, N.V.M. (Nataliya V. Malekhonova); funding acquisition, N.V.M. (Nataliya V. Malekhonova). All authors have read and agreed to the published version of the manuscript.

Funding

This research was funded by the Russian Science Foundation (grant number 22-79-10080) and Ministry of Science and Higher Education of the Russian Federation (project H-498-99_2021-2023 of Federal Academic Leadership Program Priority-2030).

Data Availability Statement

Not applicable.

Conflicts of Interest

The authors declare no conflict of interest.

Abbreviations

LPS—conventional liquid-phase sintering; CG—coarse-grained (alloy); GB—grain boundary; CSR—coherent scattering regions; HTA—heavy tungsten alloy; HEBM—high-energy ball milling; OMDs—orientation mismatch dislocations; SEM—scanning electron microscopy; SPS—spark plasma sintering; UFG—ultrafine-grained (alloy); XRD—X-ray diffraction (phase analysis); V—heating rate; T—sintering temperature; ts—holding time at sintering temperature; Tm—melting point; G—shear modulus; tHEBM—HEBM time; ρ—density; ρth—theoretical density; d—average grain size; DXRD—sizes of coherent scattering regions; σ0—macroelasticity stress (lattice friction stress); σy—yield strength; H—depth of sample embedding into steel target; Hv—Vickers hardness; Ys—dynamic yield strength; KHP—Hall–Petch coefficient; L—shrinkage; Lmax—maximum shrinkage; S—shrinkage rate; Smax—maximum shrinkage rate; Qs—activation energy of sintering; Qv—activation energy of volume diffusion; Qb—activation energy of grain boundary diffusion; α—coefficient of compaction when pressing; m—numerical coefficient for the Young–Cutler model; ε—relative shrinkage in the Young–Cutler model; Δε—microstrain of the tungsten crystal lattice.

Appendix A

Table A1. Microstructure parameters and mechanical properties of HTAs obtained with SPS/FAST.
Ref.Alloy (wt.%)SPS ModesCharacteristics of the HTANote 2
Ts,
°C
V,
°C/min
P,
MPa
ts,
min
Density
(ρ)
d, μmMechanical Properties 1
[23]W-4Ni-2Co-1Fe1200–1400-30616.78 g/cm30.3484.3 HRA
σts = 968 MPa
R0 = 120 nm
tHEBM = 15 h, 226 r/min
[24]W-5.6Ni-1.4Fe12309050016.3 g/cm3 (~92%)0.72No dataR0 = 6 nm
tHEBM = 40 h, 226 rpm.
Add: Ni2W4C, Fe6W6C
[25]W-5.6Ni-1.4Fe14109030099.4%~2No dataR0 = 2.44 μm
[26]W-5.6Ni-1.4Fe136038030094.8%6.0σy = 1050 MPa
σb = 1580 MPa
418 HV1
R0 = 2.44 μm
[27]W-5.6Ni-1.4Fe1400105302~98%4.4σb = 1700 MPa
418 HV1
-
+ cyclic heat treatment at 1400 °C~98%~6σb = 1780 MPa
489 HV1
[28]W-7Ni-3Fe115010050896.12%5–10σb = 1020 MPa
68–69 HRA
R0 = 1–3 μm 3
tHEBM = 5 h, 266 rpm.
Add: WC, NiW
[29]W-5.6Ni-1.4Fe132090300–45~96%4–7No dataR0 = 2.44 μm
[30]W-2Mo-7Ni-3Fe120010050896.42%4–5σb = 922 MPa
73.8 HRA
R0 = 1–3 μm 3
tHEBM = 40 h, 800 rpm.
Add: NiW, Ni2W4C, WC
[31]W-8Ni-2Fe100010030080.84%10–20σy = 586 MPa
σb = 975 MPa
63 HRA
D90 = 6.3 μm 3
tHEBM = 40 h, 260 rpm
W-8Ni-2Fe-6Mo84.61%5–20σy = 784 MPa
σb = 1025 MPa
65 HRA
W-8Ni-2Fe-12Mo86.34%10–20σy = 825 MPa
σb = 1120 MPa
68 HRA
W-8Ni-2Fe-18Mo93.12%10–20σy = 950 MPa
σb = 1160 MPa
72 HRA
W-8Ni-2Fe-24Mo94.25%15–20σy = 998 MPa
σb = 1250 MPa
75 HRA
[32]W-7Ni-3Fe110010030268.57%11.45σy = 475 MPa
138 HV0.5
D90 = 6.2 μm 3
tHEBM = 30 min (in the mortar)
W-7Ni-3Fe-0.25La2O387.95%10.66σy = 497 MPa
357 HV0.5
W-7Ni-3Fe-0.50La2O376.83%9.76σy = 822 MPa
370 HV0.5
W-7Ni-3Fe-0.755La2O375.51%8.88σy = 952 MPa
397 HV0.5
W-7Ni-3Fe-1La2O370.44%7.89σy = 1110 MPa
533 HV0.5
[33]W-7Ni-3Fe-0.5SiC140010050593.95%10–20σy = 1068 MPa
443 HV0.5
R0 = 10 μm 3
tHEBM = 1 h + pressed
600 MPa
W-7Ni-3Fe-1SiC90.98%5–20σy = 810 MPa
458 HV0.5
W-7Ni-3Fe-1.5SiC85.05%5–20σy = 708 MPa
532 HV0.5
W-7Ni-3Fe-2SiC82.86%5–10σy = 729 MPa
564 HV0.5
[34]W-7Ni-3Fe1000100508~93%<1σy = 954.5 MPa
79.3 HRA
R0 = 2.3–2.7 μm 3
tHEBM = 40 h, 266 rpm
1250~87%3–5σy = 353.6 MPa
63.8 HRA
[35]W-2Mo-6Ni-2.5Fe
-1.5Co
100010050890.68%~2σb = 595 MPa
76.14 HRA
R0 = 1–3 μm 3
tHEBM = 20 h, 220 rpm
125098.93%5.4σb = 1040 MPa
71.43 HRA
[36]W-5.6Ni-2.4Fe140010030-~84.8%12.3σy = 686 MPa
σt = 975 MPa
385 HV0.5
R0 = 10 μm 3
tHEBM = 1 h
Add: Ni-W
W-5.6Ni-2.4Fe-0.5Co93.36511.56σy = 770 MPa
σt = 961 MPa
455 HV0.5
W-5.6Ni-2.4Fe-1Co~90.5%9.48σy = 1300 MPa
σt = 1508 MPa
467 HV0.5
W-5.6Ni-2.4Fe-1.5Co~87%9.68σy = 1080 MPa
σt = 1330 MPa
471 HV0.5
W-5.6Ni-2.4Fe-2Co~83%11.1σy = 1000 MPa
σt = 1256 MPa
499 HV0.5
[37]W-21Ni-9Fe125010040498.6~10σt = 890 MPa
25.6 HRC
tHEBM = 4 h,
400 rpm
[38]W-5.6Ni-1.4Fe1050–110010050598.120.871σb = 987 MPa
84.3 HRA
R0 = 100 nm 3
tHEBM = 6 h,
300 rpm
[39]W-2Mo-7Ni-3Fe1150100508No data~2σb = 390.1 MPa
69–70 HRA
R0 = 1–3 μm 3
tHEBM = 40 h,
266 rpm
Add: Ni2W4C
1 σts—transverse rupture strength, σb—bending strength, σy—yield strength, σt—tensile strength. 2 R0 is the initial particle size; Add—there are auxiliary phases in the specimens. 3 The initial particle size of the α-W.

References

  1. Green, E.C.; Jones, D.J.; Pitkin, W.R. Developments in high-density alloys. Proc. Symp. Powder Metall. 1954, 58, 253–256. [Google Scholar]
  2. Krock, R.; Shepard, H. Mechanical behavior of the two-phase composite tungsten-nickel-iron. Trans. Metall. Soc. AIME 1963, 227, 1127–1134. [Google Scholar]
  3. Das, J.; Rao, G.A.; Pabi, S.K. Microstructure and mechanical properties of tungsten heavy alloys. Mater. Sci. Eng. A 2010, 527, 7841–7847. [Google Scholar] [CrossRef]
  4. Povarova, K.B.; Makarov, P.V.; Ratner, A.D.; Zavarzina, E.K.; Volkov, K.V. VNZH-90-type heavy alloys. I. Effect of alloying and the conditions of fabricating tungsten powders on their structure and the properties of sintered alloys. Russ. Metall. 2002, 4, 39–48. (In Russian) [Google Scholar]
  5. Sahin, Y. Recent progress in processing of tungsten heavy alloys. J. Powder Technol. 2014, 2014, 764306. [Google Scholar] [CrossRef]
  6. Ishchenko, A.N.; Afanas’eva, S.A.; Belov, N.N.; Burkin, V.V.; Galsanov, S.V.; Kasimov, V.Z.; Kudryavtsev, V.A.; Lipatnikova, Y.D.; Martsunova, L.S.; Rogaev, K.S.; et al. Destruction features of impactors made of a porous alloy based on tungsten with reinforcing filler when interacting with armored obstacles. Tech. Phys. 2020, 65, 414–419. [Google Scholar] [CrossRef]
  7. Luo, R.; Huang, D.; Yang, M.; Tang, E.; Wang, M.; He, L. Penetrating performance and “self-sharpening” behavior of fine-grained tungsten heavy alloy rod penetrators. Mater. Sci. Eng. A 2016, 675, 262–270. [Google Scholar] [CrossRef]
  8. German, R.M. Sintered tungsten heavy alloys: Review of microstructure, strength, densification, and distortion. Int. J. Refract. Met. Hard Mater. 2022, 108, 105940. [Google Scholar] [CrossRef]
  9. Ravi Kiran, U.; Panchal, A.; Sankaranarayana, M.; Nandy, T.K. Tensile and impact behavior of swaged tungsten heavy alloys processed by liquid phase sintering. Int. J. Refract. Met. Hard Mater. 2013, 37, 1–11. [Google Scholar] [CrossRef]
  10. Ravi Kiran, U.; Sambasiva Rao, A.; Sankaranarayana, M.; Nandy, T.K. Swaging and heat treatment studies on sintered 90W-6Ni-2Fe-2Co tungsten heavy alloy. Int. J. Refract. Met. Hard Mater. 2012, 33, 113–121. [Google Scholar] [CrossRef]
  11. Gong, X.; Fan, J.L.; Ding, F.; Song, M.; Huang, B.Y.; Tian, J.M. Microstructure and highly enhanced mechanical properties of fine-grained tungsten heavy alloy after one-pass rapid hot extrusion. Mater. Sci. Eng. A 2011, 528, 3646–3652. [Google Scholar] [CrossRef]
  12. Yu, Y.; Zhang, W.; Chen, Y.; Wang, E. Effect of swaging on microstructure and mechanical properties of liquid-phase sintered 93W-4.9(Ni,Co)-2.1Fe alloy. Int. J. Refract. Met. Hard Mater. 2014, 44, 103–108. [Google Scholar] [CrossRef]
  13. Das, J.; Kiran, U.R.; Chakraborty, A.; Prasad, N.E. Hardness and tensile properties of tungsten based heavy alloys prepared by liquid phase sintering technique. Int. J. Refract. Met. Hard Mater. 2009, 27, 577–583. [Google Scholar] [CrossRef]
  14. Mazilkin, A.A.; Straumal, B.B.; Protasova, S.G.; Bulatov, M.F.; Baretzky, B. Pseudopartial wetting of W/W grain boundaries by the nickel-rich layers. Mater. Lett. 2017, 192, 101–103. [Google Scholar] [CrossRef]
  15. Luo, J.; Gupta, V.K.; Yoon, D.H.; Meyer, H.M. Segregation-induced grain boundary premelting in nickel-doped tungsten. Appl. Phys. Lett. 2005, 87, 231902. [Google Scholar] [CrossRef] [Green Version]
  16. Fortuna, E.; Sikorsky, K.; Kurzydlowski, K.J. Experimental studies of oxygen and carbon segregation at the interfacial boundaries of a 90W-7Ni-3Fe tungsten heavy alloy. Mater. Charact. 2004, 52, 323–329. [Google Scholar] [CrossRef]
  17. Krasovskii, P.V.; Samokhin, A.V.; Fadeev, A.A.; Sinayskiy, M.A.; Sigalev, S.K. Alloying effects and composition inhomogeneity of plasma-created multimetallic nanopowders: A case study of the W-Ni-Fe ternary system. J. Alloys Compd. 2018, 250, 265–275. [Google Scholar] [CrossRef]
  18. Parabhu, G.; Kumar, N.A.; Sankaranarayana, M.; Nandy, T.K. Tensile and impact properties of microwave sintered tungsten heavy alloys. Mater. Sci. Eng. A 2014, 607, 63–70. [Google Scholar] [CrossRef]
  19. Gryaznov, M.; Samokhin, A.; Chuvil’deev, V.; Fadeev, A.; Alekseev, N.; Shotin, S.; Dorofeev, A.; Zavertyaev, A. Method of W-Ni-Fe composite spherical powder production and the possibility of its application in Selective Laser Melting technology. Metals 2022, 12, 1715. [Google Scholar] [CrossRef]
  20. Chen, H.; Ye, L.; Han, Y.; Chen, C.; Fan, J. Additive manufacturing of W-Fe composites using laser metal deposition: Microstructure, phase transformation, and mechanical properties. Mater. Sci. Eng. A 2021, 811, 141036. [Google Scholar] [CrossRef]
  21. Chen, H.; Zi, X.; Han, Y.; Dong, J.; Liu, S.; Chen, C. Microstructure and mechanical properties of additive manufactured W-Ni-Fe-Co composite produced by selective laser melting. Int. J. Refract. Met. Hard Mater. 2020, 86, 105111. [Google Scholar] [CrossRef]
  22. Liu, W.; Ma, Y.; Zhang, J. Properties and microstructural evolution of W-Ni-Fe alloy via microwave sintering. Int. J. Refract. Met. Hard Mater. 2012, 35, 138–142. [Google Scholar] [CrossRef]
  23. Han, Y.; Wu, X.; Jiang, X.; Yang, Y. Powder extrusion printing and sintering densification behaviors of ultrafine 98W-1Ni-1Fe alloy powder. Crystals 2022, 12, 875. [Google Scholar] [CrossRef]
  24. Tokita, M. Progress of Spark Plasma Sintering (SPS): Method, Systems, Ceramics Applications and Industrialization. Ceramics 2021, 4, 160–198. [Google Scholar] [CrossRef]
  25. Mukasyan, A.S.; Rogachev, A.S.; Moskovskikh, D.O.; Yermekova, Z.S. Reactive spark plasma sintering of exothermic systems: A critical review. Ceram. Int. 2022, 48, 2988–2998. [Google Scholar] [CrossRef]
  26. Munir, Z.A.; Anselmi-Tamburini, U.; Ohyanagi, M. The effect of electric field and pressure on the synthesis and consolidation materials: A review of the spark plasma sintering method. J. Mater. Sci. 2006, 41, 763–777. [Google Scholar] [CrossRef]
  27. Olevsky, E.; Dudina, D. Field-Assisted Sintering; Springer Int. Publ.: Berlin/Heidelberg, Germany, 2018. [Google Scholar] [CrossRef]
  28. Chuvildeev, V.N.; Panov, D.V.; Boldin, M.S.; Nokhrin, A.V.; Blagoveshchensky, Y.V.; Sakharov, N.V.; Shotin, S.V.; Kotkov, D.N. Structure and properties of advanced materials obtained by Spark Plasma Sintering. Acta Astronaut. 2015, 109, 172–176. [Google Scholar] [CrossRef]
  29. Li, X.; Xin, H.; Hu, K.; Li, Y. Microstructure and properties of ultra-fine tungsten heavy alloys prepared by mechanical alloying and electric current activated sintering. Trans. Nonferrous Met. Soc. China 2010, 20, 443–449. [Google Scholar] [CrossRef]
  30. Hu, K.; Zheng, D.; Li, Y. SPS densification behavior of W-5.6Ni-1.4Fe heavy alloy powders. Rare Met. 2011, 30, 581–587. [Google Scholar] [CrossRef]
  31. Hu, K.; Li, X.-q.; Yang, C.; Li, Y.-y. Densification and microstructure evolution during SPS consolidation process in W-Ni-Fe system. Trans. Nonferrous Met. Soc. China 2011, 21, 493–501. [Google Scholar] [CrossRef]
  32. Li, Y.; Hu, K.; Li, X.; Qu, S. Fine-grained 93W-5.6Ni-1.4Fe heavy alloys with enhanced performance prepared by spark plasma sintering. Mater. Sci. Eng. A 2013, 573, 245–252. [Google Scholar] [CrossRef]
  33. Li, X.; Hu, K.; Qu, S.; Yang, C. 93W-5.6Ni-1.4Fe heavy alloys with enhanced performance prepared by cyclic spark plasma sintering. Mater. Sci. Eng. A 2014, 599, 233–241. [Google Scholar] [CrossRef]
  34. Xiang, D.P.; Ding, L.; Li, Y.Y.; Chen, G.B.; Zhao, Y.W. Preparation of fine-grained tungsten heavy alloys by spark plasma sintered W-7Ni-3Fe composite powders with different ball milling time. J. Alloys Compd. 2013, 562, 19–24. [Google Scholar] [CrossRef]
  35. Hu, K.; Li, X.; Qu, S.; Li, Y. Spark-Plasma Sintering of W-5.6Ni-1.4Fe heavy alloys: Densification and grain growth. Metall. Mater. Trans. A 2013, 44, 923–933. [Google Scholar] [CrossRef]
  36. Xiang, D.P.; Ding, L.; Li, Y.Y.; Chen, X.Y.; Zhang, T.M. Fabricating fine-grained tungsten heavy alloy by spark plasma sintering of low-energy ball-milled W-2Mo-7Ni-3Fe powders. Mater. Sci. Eng. A 2013, 578, 18–23. [Google Scholar] [CrossRef]
  37. Prasad, B.S.L.; Annamalai, R. A study of molybdenium addition on W-Ni-Fe based heavy alloys sintered with spark plasma sintering. Bulletin of the Polish Academy of Science. Tech. Sci. 2019, 67, 167–172. [Google Scholar] [CrossRef]
  38. AyyappaRaj, M.; Yadav, D.; Agrawal, D.K.; Rajan, R.A.A. Microstructure and mechanical properties of spark plasma-sintered La2O3 dispersion-strengthened W-Ni-Fe alloy. Rare Metals 2020, 40, 2230–2236. [Google Scholar] [CrossRef]
  39. Chaurasia, J.K.; Muthuchamy, A.; Patel, P.N.; Annamalai, A.R. Densification of SiC particle reinforced W-Ni-Fe heavy alloy composites through conventional and Spark Plasma Sintering. Trans. Indian Inst. Met. 2017, 70, 2185–2191. [Google Scholar] [CrossRef]
  40. Ding, L.; Xiang, D.P.; Li, Y.Y.; Li, C.; Li, J.B. Effects of sintering temperature on fine-grained tungsten heavy alloy produced by high-energy ball milling assisted spark plasma sintering. Int. J. Refract. Met. Hard Mater. 2012, 33, 65–69. [Google Scholar] [CrossRef]
  41. Ding, L.; Xiang, D.P.; Pan, Y.L.; Li, Y.Y. Mechanical properties and microstructural evolution of Mo-Co-co-strengthened W-Ni-Fe alloys by spark plasma sintering. J. Alloys Compd. 2017, 712, 593–598. [Google Scholar] [CrossRef]
  42. Senthilnathan, N.; Raja Annamalai, A.; Venkatachalam, G. Microstructure and mechanical properties of spark plasma sintered tungsten heavy alloys. Mater. Sci. Eng. A 2018, 710, 66–73. [Google Scholar] [CrossRef]
  43. Wu, Y.; Li, Y.; Yu, D. Fine-grained W-Ni-Fe heavy alloys prepared by Spark Plasma Sintering. Mater. Sci. Forum 2016, 849, 745–752. [Google Scholar] [CrossRef]
  44. Jingang, Z.; Weimin, W.; Wei, J.; Qianglong, H.; Aiang, W.; Lin, T.; Kai, Y. Ultrafine grain tungsten heavy alloys with excellent performance prepared by Spark Plasma Sintering. J. Wuhan Univ. Technol. Mater. Sci. Ed. 2020, 35, 393–398. [Google Scholar] [CrossRef]
  45. Ding, L.; Xiang, D.P.; Li, Y.Y.; Zhao, Y.W.; Li, J.B. Phase, microstructure and properties evolution of fine-grained W-Mo-Ni-Fe alloy during spark plasma sintering. Mater. Des. 2012, 37, 8–12. [Google Scholar] [CrossRef]
  46. Zhang, F.L.; Wang, C.Y.; Zhu, M. Nanostructured WC/Co composite powder prepared by high energy ball milling. Scr. Mater. 2003, 49, 1123–1128. [Google Scholar] [CrossRef]
  47. Suryanarayana, C. Mechanical alloying and milling. Prog. Mater. Sci. 2001, 46, 1–184. [Google Scholar] [CrossRef]
  48. Jing-lian, F.; Tao, L.; Hui-chao, C.; Deng-long, W. Preparation of fine grain tungsten heavy alloy with high properties by mechanical alloying and yttrium oxide addition. J. Mater. Process. Technol. 2008, 208, 463–469. [Google Scholar] [CrossRef]
  49. Liang, Y.X.; Wu, Z.M.; Fu, E.G.; Du, J.L.; Wang, P.P.; Zhao, Y.B.; Qiu, Y.H.; Hu, Z.Y. Refinement process and mechanisms of tungsten powder by high energy ball milling. Int. J. Refract. Met. Hard Mater. 2017, 67, 1–8. [Google Scholar] [CrossRef]
  50. Hu, W.; Dong, Z.; Yu, L.; Ma, Z.; Liu, Y. Synthesis of W-Y2O3 alloys by freeze-drying and subsequent low temperature sintering: Microstructure refinement and second phase particles regulation. J. Mater. Sci. Technol. 2020, 36, 84–90. [Google Scholar] [CrossRef]
  51. Dong, Z.; Liu, N.; Ma, Z.; Liu, C.; Guo, Q.; Liu, Y. Preparation of ultra-fine grain W-Y2O3 alloy by an improved wet chemical method and two-step spark plasma sintering. J. Alloys Compd. 2017, 695, 2969–2973. [Google Scholar] [CrossRef]
  52. Wu, C. Preparation of ultrafine tungsten powders by in-situ hydrogen reduction of nano-needle violet tungsten oxide. Int. J. Refract. Met. Hard Mater. 2011, 29, 686–691. [Google Scholar] [CrossRef]
  53. Seegopaul, P.; McCandlish, L.E.; Shinneman, F.M. Production capability and powder processing methods for nanostructured WC-Co powder. Int. J. Refract. Met. Hard Mater. 1997, 15, 133–138. [Google Scholar] [CrossRef]
  54. Lassner, E.; Schubert, W.D. Tungsten: Properties, Chemistry, Technology of the Elements, Alloys, and Chemical Compounds; Springer Science & Business Media: Berlin/Heidelberg, Germany, 1999. [Google Scholar]
  55. Malewar, R.; Kumar, K.S.; Murty, B.S.; Sarma, B.; Pabi, S.K. On sinterability of nanostructured W produced by high-energy ball milling. J. Mater. Res. 2007, 22, 1200–1206. [Google Scholar] [CrossRef]
  56. De Castro, C.L.; Mitchell, B.S. The use of polymeric milling media in the reduction of contamination during mechanical attrition. J. Mater. Res. 2002, 17, 2997–2999. [Google Scholar] [CrossRef]
  57. Kiran, U.R.; Kumar, M.P.; Sankaranarayana, M.; Singh, A.K.; Nandy, T.K. High energy milling on tungsten powders. Int. J. Refract. Met. Hard Mater. 2015, 48, 74–81. [Google Scholar] [CrossRef]
  58. Han, Y.; Fan, J.; Liu, T.; Cheng, H.; Tian, J. The effects of ball-milling treatment on the densification behavior of ultra-fine tungsten powder. Int. J. Refract. Met. Hard Mater. 2011, 29, 743–750. [Google Scholar] [CrossRef]
  59. Malkin, A.I.; Fomkin, A.A.; Klyuev, V.A.; Loznetsova, N.N.; Popov, D.A.; Toporov, Y.P.; Shkolin, A.V. The influence of mechanical activation on the adsorption properties of powdered tungsten. Prot. Met. Phys. Chem. Surf. 2015, 51, 81–84. [Google Scholar] [CrossRef]
  60. Malkin, A.I.; Kiselev, M.R.; Klyuev, V.A.; Loznetsova, N.N.; Toporov, Y.P. The effect of mechanical activation on the heat capacity of powdered tungsten. Tech. Phys. Lett. 2012, 38, 509–510. [Google Scholar] [CrossRef]
  61. Savenko, V.I.; Toropov, Y.P.; Chernyshev, V.V.; Malkin, A.I. Microstructure and properties of surface-modified tungsten powders mechanically activated in different media. Phys. Met. Metallogr. 2017, 118, 1066–1072. [Google Scholar] [CrossRef]
  62. Chuvil’deev, V.N.; Nokhrin, A.V.; Boldin, M.S.; Baranov, G.V.; Sakharov, N.V.; Belov, V.Y.; Lantsev, E.A.; Popov, A.A.; Melekhin, N.V.; Lopatin, Y.G.; et al. Impact of mechanical activation on sintering kinetics and mechanical properties of ultrafine-grained 95W-Ni-Fe tungsten heavy alloys. J. Alloys Compd. 2019, 773, 666–688. [Google Scholar] [CrossRef]
  63. Bragov, A.M.; Chuvil’deev, V.N.; Melekhin, N.V.; Filippov, A.R.; Konstantinov, A.Y.; Sakharov, N.V. Dynamic strength of heavy 90W-7Ni-3Fe alloy produced by Spark Plasma Sintering. Phys. Mesomech. 2019, 22, 307–312. [Google Scholar] [CrossRef]
  64. Dudina, D.V.; Bokhonov, B.B.; Ukhina, A.V.; Anisimov, A.G.; Mali, V.I.; Esikov, M.A.; Batraev, I.S.; Kuznechik, O.O.; Pilinevich, L.P. Reactivity of materials towards carbon of graphite foil during Spark Plasma Sintering: A case study using Ni-W powders. Mater. Lett. 2016, 168, 62–67. [Google Scholar] [CrossRef]
  65. Bokhonov, B.B.; Ukhina, A.V.; Dudina, D.V.; Anisimov, A.G.; Mali, V.I.; Batraev, I.S. Carbon uptake during Spark Plasma Sintering: Investigation through the analysis of the carbide “footprint” in a Ni-W alloy. RSC Adv. 2015, 98, 80228–80237. [Google Scholar] [CrossRef]
  66. Williamson, G.K.; Hall, W.M. X-ray line broadening from aluminium and wolfram. Acta Metall. 1953, 1, 22–31. [Google Scholar] [CrossRef]
  67. Kolsky, H. An investigation of the mechanical properties of materials at very high rates of loading. Proc. Phys. Society. Sect. B 1949, 62, 676–700. [Google Scholar] [CrossRef]
  68. Duan, B.; Zhou, T.; Yang, G.; Yang, D.; Wang, D. Microstructures and properties of 90W-4Ni-6Mn alloy prepared by vacuum sintering. Mater. Res. Express 2020, 7, 036522. [Google Scholar] [CrossRef]
  69. Farooq, S.; Kemp, P.B.; German, R.M.; Base, A. Effect of initial oxygen content and sintering atmosphere dew point on the properties of tungsten based heavy alloys. Int. J. Refract. Met. Hard Mater. 1989, 8, 236–243. [Google Scholar]
  70. Rahaman, M.N. Ceramic Processing and Sintering; CRC Press: Boca Raton, FL, USA, 2017; Volume 1. [Google Scholar]
  71. Wang, J.; Ding, J.; Liu, W.; Ma, Y.; Zhu, W.; Meng, S.; Liang, C.; Cai, Q. Effect in situ phase reaction of η M12C and M6C on microstructure and mechanical properties of tungsten heavy alloy via spark plasma sintering. Int. J. Refract. Met. Hard Mater. 2023, 114, 106251. [Google Scholar] [CrossRef]
  72. Frost, H.J.; Ashby, M.F. Deformation-Mechanism Maps; Pergamon Press: London, UK, 1982; 328p. [Google Scholar]
  73. Young, W.S.; Culter, I.B. Initial sintering with constant rates of heating. J. Am. Ceram. Soc. 1970, 53, 659–663. [Google Scholar] [CrossRef]
  74. Coble, R. A model for boundary diffusion controlled creep in polycrystalline materials. J. Appl. Phys. 1963, 34, 1679–1682. [Google Scholar] [CrossRef]
  75. Lantsev, E.A.; Malekhonova, N.V.; Nokhrin, A.V.; Chuvil’deev, V.N.; Boldin, M.S.; Blagoveshchenskiy, Y.V.; Andreev, P.V.; Smetanina, K.E.; Isaeva, N.V.; Shotin, S.V. Influence of oxygen on densification kinetics of WC nanopowders during SPS. Ceram. Int. 2021, 47, 4294–4309. [Google Scholar] [CrossRef]
  76. Lantsev, E.A.; Malekhonova, N.V.; Nokhrin, A.V.; Chuvil’deev, V.N.; Boldin, M.S.; Blagoveshchenskiy, Y.V.; Andreev, P.V.; Smetanina, K.E.; Isaeva, N.V.; Murashov, A.A. Spark plasma sintering of fine-grained WC hard alloys with ultra-low cobalt content. J. Alloys Compd. 2021, 857, 157535. [Google Scholar] [CrossRef]
  77. Lantcev, E.; Nokhrin, A.; Malekhonova, N.; Boldin, M.; Chuvil’deev, V.; Blagoveshchenskiy, Y.; Isaeva, N.; Andreev, P.; Smetanina, K.; Murashov, A. A study of the impact of graphite on the kinetics of SPS in nano- and submicron WC-10%Co powder compositions. Ceramics 2021, 4, 331–363. [Google Scholar] [CrossRef]
  78. Golovkina, L.S.; Orlova, A.I.; Nokhrin, A.V.; Boldin, M.S.; Lantsev, E.A.; Chuvil’deev, V.N.; Sakharov, N.V.; Shotin, S.V.; Zelenov, A.Y. Spark Plasma Sintering of fine-grained ceramic-metal composites YAG:Nd-(W,Mo) based on garnet-type oxide Y2.5Nd0.5Al5O12 for inert matrix fuel. J. Nucl. Mater. 2018, 511, 109–121. [Google Scholar] [CrossRef]
  79. Kolobov, Y.R.; Grabovetskaya, G.P.; Ivanov, K.V.; Girsova, N.V. Effect of the grain-boundary state and grain size on the mechanisms of creep of submicrocrystalline nickel. Phys. Met. Metallogr. 2001, 91, 532–537. (In Russian) [Google Scholar]
  80. Chuvil’deev, V.N.; Boldin, M.S.; Dyatlova, Y.G.; Rumyantsev, V.I.; Ordanyan, S.S. A comparative study of hot pressing and Spark Plasma Sintering of Al2O3-ZrO2-Ti(C,N) powders. Inorg. Mater. 2015, 51, 1047–1053. [Google Scholar] [CrossRef]
  81. Chuvil’deev, V.N.; Blagoveshchenskiy, Y.V.; Nokhrin, A.V.; Boldin, M.S.; Sakharov, N.V.; Isaeva, N.V.; Shotin, S.V.; Belkin, O.A.; Popov, A.A.; Smirnova, E.S.; et al. Spark plasma sintering of tungsten carbide nanopowders obtained through DC arc plasma synthesis. J. Alloys Compd. 2017, 708, 547–561. [Google Scholar] [CrossRef]
  82. Golovkina, L.S.; Orlova, A.I.; Nokhrin, A.V.; Boldin, M.S.; Chuvil’deev, V.N.; Sakharov, N.V.; Belkin, O.A.; Shotin, S.V.; Zelenov, A.Y. Spark Plasma Sintering of fine-grain ceramic-metal composites based on garnet-structure oxide Y2.5Nd0.5Al5O12 for Inert Matrix Fuel. Mater. Chem. Phys. 2018, 214, 516–526. [Google Scholar] [CrossRef]
  83. Segal, V.M.; Beyerlein, I.J.; Tome, C.N.; Chuvil’deev, V.N.; Kopylov, V.I. Fundamentals and Engineering of Severe Plastic Deformation; Nova Science Publishers: New York, NY, USA, 2010; 542p. [Google Scholar]
  84. Blaine, D.C.; Park, S.J.; Suri, P.; German, R.M. Application of work-of-sintering concepts in powder metals. Metall. Mater. Trans. A 2006, 37, 2827–2835. [Google Scholar] [CrossRef] [Green Version]
  85. Park, S.J.; Johnson, J.L.; Wu, Y.; Kwon, Y.-S.; Lee, S.; German, M.R. Analysis of the effect of solubility on the densification behavior of tungsten heavy alloys using the master sintering curve approach. Int. J. Refract. Met. Hard Mater. 2013, 37, 52–59. [Google Scholar] [CrossRef]
  86. Hu, K.; Li, X.; Qu, S.; Li, Y. Effect of heating rate on densification and grain growth during spark plasma sintering of 93W-5.6Ni-1.4Fe heavy alloys. Metall. Mater. Trans. A 2013, 44, 4323–4336. [Google Scholar] [CrossRef]
  87. Larikov, L.N.; Yurchenko, Y.F. Diffusion in Metals and Alloys; Naukova Dumka: Kiev, Ukraine, 1987; 509p. (In Russian) [Google Scholar]
  88. Park, S.M.; Martin, J.M.; Guo, J.F.; Johnson, J.L. Densification behavior of tungsten heavy alloy based on master sintering curve concept. Metall. Mater. Trans. A 2006, 37, 2837–2848. [Google Scholar] [CrossRef] [Green Version]
  89. Seith, W. Diffusion in Mettallen. Platzwechselreaktionen; Springer: Berlin/Heidelberg, Germany, 1955; 381p. [Google Scholar]
Figure 1. Typical stress–strain and strain rate–strain curves for a tungsten alloy sample recorded in a dynamic compression test according to Kolsky bar method.
Metals 13 01432 g001
Figure 2. Tungsten alloy samples for testing (a) and example of measuring the sample penetration depth into the steel target (b). (b): (1) steel target, (2) hole in target from tungsten sample, (3) WEM REM mixture.
Metals 13 01432 g002
Figure 3. SEM images of W-7%Ni-3%Fe powder agglomerates for different HEBM times: (a) 0 min; (b) 5 min; (c) 10 min; (d) 20 min; (e,f) 40 min.
Metals 13 01432 g003aMetals 13 01432 g003b
Figure 4. SEM images of the nanoparticles in the powder agglomerates 90%W-7%Ni-3%Fe for different HEBM times: (a) tHEBM = 10 min; (b) tHEBM = 40 min.
Metals 13 01432 g004
Figure 5. Results of XRD phase analysis of the powders 90%W-7%Ni-3%Fe: (a) overview XRD curves after different HEBM times; (b) effect of the HEBM time on the broadening of the (110) α-W peaks, data from [62]; (c) effect of the HEBM time on the CSR size (1) and on the magnitude of the microstrain Δε of the α-W crystal lattice (2), data from [62].
Metals 13 01432 g005
Figure 6. Appearance of the W-7%Ni-3%Fe alloy samples sintered in hydrogen from the nanopowders obtained using HEBM. Sintering temperature: 1450 °C. Metallography.
Metals 13 01432 g006
Figure 7. Microstructure of W-7%Ni-3%Fe alloy sintered from nanopowders (tHEBM = 20 min). Sintering temperature Ts = 1250 °C (a,b), 1400 °C (c,d). Metallography.
Metals 13 01432 g007aMetals 13 01432 g007b
Figure 8. Microstructure of the W-7%Ni-3%Fe alloy sintered from the nanopowder (tHEBM = 20 min) at the temperatures 1250 °C (a), 1300 °C (b), and 1400 °C (c). Large agglomerates are highlighted with a yellow dashed line in Figure 8 for clarity. SEM.
Metals 13 01432 g008
Figure 9. Temperature curves of shrinkage (a,b) and shrinkage rate (c,d) for the W-7%Ni-3%Fe nanopowders after HEBM (a,c) and after HEBM and annealing in hydrogen (b,d).
Metals 13 01432 g009
Figure 10. Microstructure of the W-7%Ni-3%Fe alloy obtained using SPS at 1200 °C from nonannealed (a,c,e) and annealed (b,d,f) nanopowders. HEBM time: (a,b) 0 min; (c,d) 10 min; (e,f) 40 min. SEM.
Metals 13 01432 g010
Figure 11. Microstructures of the samples obtained using SPS from the annealed (a) and nonannealed (b) nanopowders after HEBM (tHEBM = 40 min). The areas with the abnormally large grains in the microstructure of the W-7%Ni-3%Fe alloy were obtained with SPS at 1200 °C from nonannealed (c) and annealed (d) nanopowders. tHEBM = 40 min. SEM.
Metals 13 01432 g011
Figure 12. Results of XRD analysis of the W-7%Ni-3%Fe alloy obtained using SPS at 1200 °C (a). Effect of the HEBM time on the parameters of the (100) α-W peak in the samples sintered from the nonannealed (b) and annealed nanopowders (c).
Metals 13 01432 g012
Figure 13. Dependencies of relative density of the W-7%Ni-3%Fe alloy sintered at 1200 °C on the HEBM time: (1) densities of the samples sintered from the nonannealed nanopowders; (2) densities of the samples sintered from the annealed nanopowders.
Metals 13 01432 g013
Figure 14. Dependencies (T·∂ε/∂T) − Tm/T for the W-7%Ni-3%Fe alloy. Analysis of the compaction mechanisms of the nonannealed nanopowders at Stage II.
Metals 13 01432 g014
Figure 15. Dependencies ln(ln(α·ρ/ρth/(1-ρ/ρth)) − Tm/T for nonannealed W-7%Ni-3%Fe nanopowders.
Metals 13 01432 g015
Figure 16. Analysis of investigations of the mechanical properties of the HTAs 90%W-7%Ni-3%Fe: (a) dependencies of the hardness and of the yield strength on the grain size; (b) dependence of Hall–Petch coefficient on the grain size. Analysis of the results presented in Table 2 and Table 3.
Metals 13 01432 g016
Table 1. Chemical compositions of initial powders (wt.%).
PowdersOFeCSPNiCoSiCuMoMn
α-W8 × 10−22 × 10−21 × 10−2-5 × 10−31 × 10−2-5 × 10−31 × 10−24.5 × 10−22 × 10−3
β-Ni3 × 10−11.5 × 10−31 × 10−16 × 10−41 × 10−3balance7 × 10−41 × 10−31 × 10−3-3 × 10⁻⁴
α-Fe2 × 10−1balance4.8 × 10−24 × 10−3---1 × 10⁻²---
Table 2. Microstructure characteristics and mechanical properties of the W-7%Ni-3%Fe alloy samples obtained from the nanopowders by sintering in hydrogen.
Characteristics of Alloy Obtained from Coarse-Grained PowdersCharacteristics of Alloy Obtained from Nanopowders
Ts, °Cρ,
g/cm3
d,
μm
σ0,
MPa
σy,
Mpa
Hv,
Gpa
Ys,
Mpa
H,
mm
ρ,
g/cm3
d,
μm
σ0,
Mpa
σy,
Mpa
Hv,
Gpa
Ys,
Mpa
H,
mm
125017.945–1052011504.218303.817.791–396015407.919005.1
130018.02~5–104609904.217004.217.931–3100013407.520504.7
135018.06~102907904.116504.217.951–386012007.218703.7
140018.14~202307404.016404.117.493–53007406.915003.1
145018.1140–452206003.815903.717.05 1~10--6.5--
150018.06~502006903.615803.216.87 1~22--6.2--
1 The density was measured by measuring the mass and geometrical sizes of the samples.
Table 3. Microstructure characteristics and mechanical properties of the W-7%Ni-3%Fe alloy samples obtained with SPS from nanopowders (Ts = 1200 °C).
Characteristics of Alloy Obtained from Nonannealed NanopowdersCharacteristics of Alloy Obtained from Annealed Nanopowders
tHEBM, minρ, g/cm3d, μmσ0, MPaσy, MPaHv, GPaYs, MPaH, mmρ, g/cm3d, μmσ0, MPaσy, MPaHv, GPaYs, MPaH, mm
016.971.392018504.2-4.917.021.2105019304.3-5.1
516.640.9133021604.522805.816.791.0140022704.823505.1
1016.450.8145021804.7-5.716.920.7152023104.9-5.4
2015.680.7150023704.8-5.716.310.6161023505.3-6.6
4016.780.7148023504.724805.617.040.6153023204.926306.1
Table 4. SPS activation energies of W-7%Ni-3%Fe nanopowders.
Nanopowders after HEBMNanopowders after HEBM
and Annealing in Hydrogen
tHEBM,
min
Stage IIStage IIIStage IIStage III
mQs2,
kTm
mQs2,
kTm/kJ/mol
Qs3,
kTm/kJ/mol
mQs2,
kTm
mQs2,
kTm/kJ/mol
Qs3,
kTm/kJ/mol
03.91/311.7/16716.1/2303.21/39.6/13717.2/246
56.516.5/9317.8/2555.915.9/8415.4/221
106.06.0/8619.1/2734.94.9/7014.7/210
205.25.2/7518.9/2714.64.6/6515.8/226
407.07.0/10019.2/2756.46.4/9216.8/240
Disclaimer/Publisher’s Note: The statements, opinions and data contained in all publications are solely those of the individual author(s) and contributor(s) and not of MDPI and/or the editor(s). MDPI and/or the editor(s) disclaim responsibility for any injury to people or property resulting from any ideas, methods, instructions or products referred to in the content.

