Abstract
Quenching and partitioning (Q&P) heat treatments of low-alloy steels with exceptional property combinations are particularly promising. In this study, we characterize for the first time a new low-alloy steel to be processed using Q&P heat treatments. In combined experimental and numerical studies, we design a novel approach that effectively combines the short cycle times of press hardening with the excellent property profiles of Q&P-treated steels. We identify an appropriate austenization temperature of 950 °C and a portioning temperature of 250 °C for Q&P heat treatments through dilatometric studies. We adjust a number of reference conditions with fractions of 2.1 to 6.3 wt.% of retained austenite, resulting in tensile strengths up to 1860 MPa and elongations to failure up to 7%. Initial numerical designs of the process can identify varying temperature profiles and cooling rates depending on the position in the die. The results show that the geometry of the part plays a minor role, but the die temperature of 200 °C is the dominant factor for successful partitioning directly in the press hardening process.
1. Introduction
In the field of forming technology, press hardening of steel sheets has been an established process for the production of complex components for many years [1,2]. In the press hardening process, the sheet is heated in a furnace to the austenitizing temperature, then transferred to the die and formed. During forming, the hot part is quenched by the cold die, and cooling rates of well over 100 K/s can occur locally [3]. This results in an almost completely martensitic microstructure in the part [4]. As a result, the components have high strength and hardness, making them ideal as a lightweight material, especially for automotive applications. Typical press hardening steels are so-called manganese–boron steels, such as the steel 22MnB5 [5]. A disadvantage is that they have relatively low ductility (<5%) after press hardening [6]. This results in a low energy-absorption capacity, for instance, in the case of dynamic impact. Another problem is high brittleness at low temperatures. However, significant improvements in toughness at low temperatures have already been achieved by alloying niobium [7]. In general, there is still a need for new process and material developments in press hardening to provide technological and economic solutions for new lightweight applications.
Quenching and partitioning steels (Q&P-steels) are an interesting option [8,9]. This relatively new group of steels has very low material costs and, with proper heat treatment, very high strengths with uniquely high ductility [10]. Q&P steels have a significantly higher ductility than manganese–boron steels. At strengths of 2000 MPa, elongations at fracture of up to 15% can be achieved [11]. The required heat treatment is shown schematically in Figure 1. The process, first described by Speer et al. [12], consists of austenitizing the steel followed by quenching to a quench temperature (QT) that must necessarily be between the martensite start (Ms) and the martensite finish (Mf) temperatures. Due to the high cooling rates during quenching, martensite forms, but because the target temperature QT is above Mf, the austenite cannot completely transform to martensite, and some retained austenite remains in the martensitic microstructure. The next step, called partitioning treatment (PT), aims to stabilize the existing retained austenite by enriching it with carbon (C). The carbon required for this diffuses from the supersaturated martensite into the adjacent austenite, which has a much higher carbon solubility. For austenite stabilization to work, enough silicon or aluminum must be present in the steel as an alloying element to suppress carbide formation and thus make the carbon available for stabilization. Clarke et al. [13] identified this microstructural process as the dominant mechanism for austenite stabilization, which further results in a local decrease in the Ms temperature. When the Ms temperature drops to room temperature (RT), the austenite present at QT remains as retained austenite during subsequent cooling. Jirková et al. [14] were able to demonstrate that the carbon-enriched austenite and the carbon-depleted martensite are responsible for the high ductility and the high strength of Q&P steels. In a recent in situ study [15], Liehr et al. presented the stress-induced evolution of retained austenite fractions with different morphologies in a low-alloy steel as a function of strain. Frint et al. [16] additionally observed exceptionally high ductility during forming at temperatures around 200 °C after Q&P heat treatment. Their results suggest a diffusion-controlled deformation mechanism at elevated temperatures. The combination of high strength and good ductility makes Q&P steels particularly suitable for use as crash-relevant structural components with maximum energy absorption.
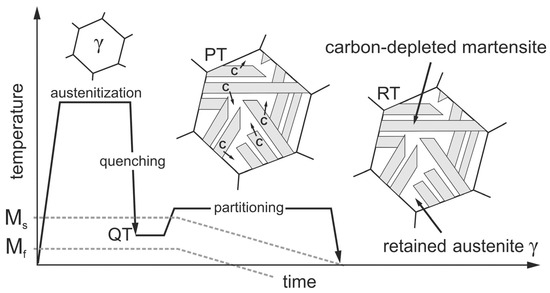
Figure 1.
Schematic representation of the Q&P heat treatment, consisting of quenching to a temperature QT (between Ms and Mf), holding at QT or a slightly elevated partition temperature (PT) to promote carbon diffusion (C) from martensite into adjacent austenite and subsequent cooling. The carbon-enriched austenite becomes stabilized even down to RT.
The results of various studies show that low-alloy heat treatable steels with increased silicon content have a high potential for use in various structural components [17,18,19,20,21]. However, conventional heat treatments, which are almost always performed in an additional furnace, are often quite complex and expensive. Therefore, the integration of Q&P heat treatment directly into the forming process and especially into the industrially very relevant press hardening process is of great interest. Speer et al. [22] provided a first overview of possible industrial applications of Q&P steels. Han et al. [23] showed that the high formability of Q&P steels could be used for high drawing depths, allowing high-quality parts to be produced in a hot forming process. Frohn et al. [24] used incremental bending to produce safety parts from a 42SiCr steel with a Q&P heat treatment. Another process with great potential is hot metal gas forming (HMGF). In this process, a heated profile component (e.g., a tube) was expanded in a closed die with the aid of a gaseous medium (e.g., argon) and also quenched at the die contact [25]. Mašek et al. [26] were able to show that there is enough supersaturated martensite in a component made using HMGF that partitioning can be realized. Jirková et al. [27] investigated the influence of different partitioning times for tubes with a wall thickness of 4 mm. It was shown that times above 10 min could not achieve a significant improvement in mechanical properties. Also, the wall thickness was too high to set sufficiently fast cooling rates in the whole cross-section, so the Q&P heat treatment could not be set completely successfully. Winter et al. [11] numerically determined the local cooling rates in the HMGF process on a part with a wall thickness of 2.6 mm and showed that they ranged from 60 to 280 K/s within the cross-section. This also resulted in locally different mechanical properties and microstructures. In addition, a study by Votava et al. [28] using a special die with differently tempered areas showed that controlled variation of sheet microstructure and mechanical properties can be achieved as a function of the cooling process in the die. These recent results clearly show that detailed knowledge of the local cooling rates throughout the part is necessary to realize the full potential of Q&P heat treatments in a forming process and to later predict part properties with a high degree of confidence.
The aim of the present study is to qualify the new low-alloy steel 37SiB6 for integrated Q&P heat treatment in the press hardening process. For this purpose, the mechanical properties and the microstructure are investigated after different Q&P heat treatments. Based on these experimental results, a five-step numerical simulation of the press hardening process is performed. The focus is on the first numerical determination of the local cooling rates on an industrially relevant thin steel sheet during forming in the press hardening process. In addition, how the local cooling rates change with different die temperatures (50–200 °C) is investigated. The numerical results provide a basis for estimation of the potential of Q&P treatments to be integrated directly in press hardening or so-called press partitioning in an industrial forming process.
2. Materials and Methods
2.1. The New Low-Alloy Q&P Steel 37SiB6
In this study, we used a new low-alloy steel 37SiB6 provided by Volkswagen AG (Wolfsburg, Germany), produced especially for partition heat treatments [29]. Because lightweight automotive structures are mainly spot-welded, the strength of the joints is important for overall crash performance. For better spot-weldability, the amounts of carbon and silicon were limited to the amounts listed in Table 1. The sheet material with a thickness of about 1.5 mm was received in a normalized state (further referred to as the initial condition). The detailed chemical composition after production was verified with glow discharge optical emission spectroscopy using a Spectruma GDA750 (Spectruma Analytik GmbH, Hof, Germany) and is given in Table 1.

Table 1.
Chemical composition (wt.%) of the low-alloy steel as determined by glow discharge optical emission spectroscopy.
Samples of the initial condition were taken from the x-, y-, and z-planes of the sheets (where x corresponds to the rolling direction, RD, and y to the transverse direction, see also Figure 5c) and subjected to a conventional grinding and polishing procedure followed by 1–2-min color etching with Klemm’s II reagent (100 mL stock solution +5 g potassium disulphite). The mean initial grain size was estimated by applying a line intersection method (with eight lines) to three individual optical microscopy images per orientation.
2.2. Determination of Phase Transformation Temperatures and Experimental Heat Treatments
To identify suitable transformation parameters for the new low-alloy steel, small rectangular samples for dilatometric studies (length 10 mm, width 5 mm, corner radius R1) were taken along the rolling direction of the sheets by wire erosion. Dilatometric analyses were performed using a vacuum-assisted Bähr DIL805 deformation dilatometer (TA instruments, Eschborn, Germany) equipped with an induction heater, quartz rods and a linear variable differential transformer measuring head with a resolution of 50 nm. Specimens were heated at a constant rate of 30 K/s to three different austenitizing temperatures of 900, 950 and 1000 °C, held for 5 min and quenched at the same constant rate. For temperature adjustment and monitoring, three thermocouples (type K) were attached to the samples at different positions along the longitudinal axis. Two independent samples were tested at each austenitizing temperature. The critical transformation temperatures in the dilatation curves were obtained by fitting tangents to the dilatation curve near the beginning and end of the phase transition in accordance with the recommendations of ASTM A1033 [30].
Experimental heat treatments at an austenitizing temperature of 950 °C were carried out to establish different reference conditions for further microstructural and mechanical characterization. First, all samples were heated under inert gas atmosphere (Ar) inside a conventional heat treatment furnace at a heating rate of about 5 K/s. After the center of the sheet cross-section reached the temperature of 950 °C (~10 min), they were austenitized for only 5 min to minimize grain growth. Some samples were then quenched in water or quenching oil to room temperature to achieve maximum strength of the material at different exemplary cooling rates. Additional samples were quenched in a salt bath (nitric salt AS 135 of Petrofer S.A.) to 250 °C, partitioned for different holding times: 60 s (Q&P 250 °C 60 s), 300 s (Q&P 250 °C 300 s) and 600 s (Q&P 250 °C 600 s) and finally water-quenched to room temperature. The temperature profile was continuously monitored throughout the heat treatment cycles for all samples with a thermocouple (type K) placed at the center of the sheet.
For hardness measurements (HV1), specimens were taken from the y-plane of the sheets from both the initial and reference conditions and subjected to conventional grinding and polishing preparation. For each condition, fifteen evenly distributed indentations were made across the cross-section of the plate for two independent specimens.
2.3. Microstructural Characterization
Quantitative analysis of the retained austenite fractions was performed using X-ray diffraction (XRD) in the y-plane of the sheets. A Bruker D8 DISCOVER diffractometer (Billerica, MA, USA) with Co-Kα radiation (35 kV, 40 mA) and point focus was used. Measurements were carried out with a total measurement time of approximately 10 h for each sample, using a collimator width of 1 mm and a LynxEye XE-T detector.
Additional samples were taken from the y-plane to characterize the main microstructural features of the heat-treated condition compared to the initial condition. All of these samples were subjected to a conventional grinding and polishing process to 1 µm diamond suspension. The samples were then etched in 2% nital for 3 min, followed by a further polish to 250 nm diamond suspension. A final polishing step was carried out for 3 min with standard colloidal silica suspension (Struers OP-U). The additional polishing procedure results in a slightly etched surface free from preparation-related deformation artifacts. Scanning electron microscopy (SEM) and electron-backscatter diffraction (EBSD) were performed using a Zeiss Neon40EsB field-emission scanning electron microscope equipped with a DigiView IV EBSD camera (EDAX Inc., Mahwah, NJ, USA). EBSD data were recorded in a region of 16 × 16 µm2 with a step size of 200 nm and an acceleration voltage of 20 kV. Raw data were post-processed with the OIM Analysis software (ver. 8.5, EDAX AMETEK, Berwyn, PA, USA) including a slight clean-up using a neighbor confidence index (CI) correlation. In order to estimate the process-relevant austenite grain size prior to the quenching and partitioning procedure, parent grain reconstruction using the Nishiyama–Wassermann orientation relationship was performed for the recorded EBSD data. The reconstruction procedure was carried out in a single iteration with a tolerance angle of 5.0 and a minimum probability ratio of 1.30.
2.4. Characterization of the Tensile Properties
To characterize the deformation behavior of the material for the different heat-treated conditions, tensile specimens with the geometry shown in Figure 2 were machined parallel to the rolling direction of the sheets. To account for the typical anisotropy of sheet materials, an additional sample of each condition was taken at 45° and 90° to the rolling direction. Tensile tests were performed at room temperature using a Schenk PPT 250 K1 servo-hydraulic testing machine (Carl Schenk AG, Darmstadt, Germany) with a strain rate of 100 s−1. This strain rate was selected because it adequately represents strain rates encountered in the industrial forming process considered in this study. Three tensile tests for each heat treatment condition were performed using an external 50 kN load cell. All tensile tests were performed using a special test set-up with a preliminary acceleration section to ensure that a constant cross-head displacement velocity was achieved prior to the start of elongation of the sample, and thus that the sample itself was deformed at a constant strain throughout the tensile test. For all conditions, an additional test was carried out for orientations of 45° and 90° to the rolling direction. Sample deformation was recorded utilizing a Photron SA5 high-speed camera system, and GOM/Zeiss ARAMIS software (ver. 6.3.1, Carl Zeiss GOM Metrology GmbH, Braunschweig, Germany) was used to analyze the resulting strain fields via digital image correlation.
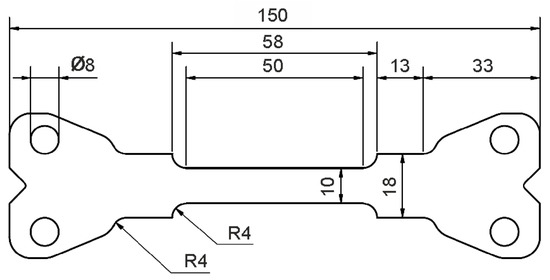
Figure 2.
Tensile specimen used for the characterization of mechanical yield strength, tensile strength and elongation to failure (all dimensions are in mm).
2.5. Simulation Model for Press Partitioning
For the numerical design of press hardening with integrated partitioning, the commercially available FE software LS-DYNA (DYNAmore GmbH, Stuttgart, Germany) with the solver LS-DYNA R12.0 (MPP) was used. In order to reproduce the temperature distribution during the entire press hardening process and to ensure that local temperatures in the component did not fall below the Mf temperature, the simulation consisted of five separately calculated process steps. The process steps (summarized in Figure 3) included heating a sheet (240 × 142.5 × 1.5 mm3) in the furnace (1), transferring the sheet from the furnace to the die (2), inserting the sheet into the die (3), forming the sheet (4) and quenching with partitioning in the die (5). The obtained parameters (e.g., temperature distribution, local strains) of the individual process steps were used as input parameters for the next process step after the calculation was finished. Steps (1) through (3) were calculated implicitly, while steps (4) and (5) were calculated explicitly. As a first-order approximation of material properties, representative data of the steel 22MnB5 (provided as material card in LS-DYNA) were used. Explicit strain rate and temperature-dependent flow curves were used for a ferritic–pearlitic (80% ferrite, 20% pearlite) and an austenitic microstructure. Young’s modulus was also defined as a function of temperature (20 °C = 213 GPa, 500 °C = 158 GPa, 1000 °C = 118 GPa). The heat transfer coefficients for convection and radiation from RT to 1000 °C are taken from [31]. The heat transfer by radiation takes values between 10 and 160 W/(m2 K) between 50 and 1000 °C. Heat transfer by convection is significantly lower and reaches maximum values of approx. 12 W/(m2 K). The heat transfer as a function of the local surface pressure was also considered in steps (4) and (5). The required values were taken from [32]. The thermal conductivity coefficient of the sheet material was assumed to be 30 W/mK and the heat capacity 450 J/kg K.
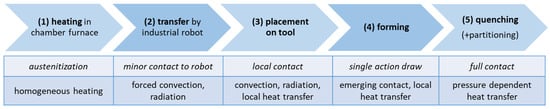
Figure 3.
Summary of the five sequential steps (1)–(5) of the FE simulations (top row). The rows below indicate relevant contact conditions between the sheet and the environment, including the dominant heat transfer contributions.
The sheet was discretized with rectangular shell elements (red, Figure 4a). The edge length was 2.5 mm, and the total number of elements from heating (1) to insertion (3) was 5427. Adaptive remeshing was used in three stages starting from the forming (4). The element size was reduced from 2.5 mm to 1.25 and down to a minimum of 0.6 mm if required by sufficiently high local deformation. The total number of elements in these simulation steps was thus about 32,000. The die for stages (3) to (5) was modeled as a rigid body using shell elements. The upper die (green in Figure 4a) consisted of 7176 elements and the lower die (blue in Figure 4a) of 6076 elements. The shell elements used were 10 mm thick. Therefore, the numerically mapped die had a wall thickness of 10 mm. This is sufficient for the simulation because the heat cannot be dissipated deeper into the material during the short cooling time. In addition, the cooling channels in the real die are located 10 mm below the surface. The wall thickness of the die is reduced in the figures shown for better clarity. Note that the die considered in this study is not symmetrical: there are different flank angles (Figure 4b, 77° and 87°), a slope between the left and right sides of the die (Figure 4b, height difference of 5.4 mm) and a bead in the center. This leads to contact between the die and different locations on the sheet at different times, and thus to locally differing cooling rates in the sheet. The asymmetric tool was designed specifically for these investigations so that samples could be taken from the different areas for further study later in real tests. The heat capacity of the tool was set to 510 J/kg K, which is equivalent to that of the hot work steel 1.2367. The thermal conductivity was set to 25 W/mK. The heat transfer between the sheet and the die itself was controlled by the contact definition. From a distance of 25 mm between the surfaces, it increased gradually; from a distance of one hundredth of a millimeter, the contact was considered “closed” and had a pressure-dependent heat transfer coefficient due to the local surface pressure. The required values were taken from [32]. For the numerical process design, which is the focus of the present study, the die temperature varied between 50 °C, 100 °C, 150 °C and 200 °C to ensure that the component could be partitioned in the die for a sufficient time above the Mf temperature.
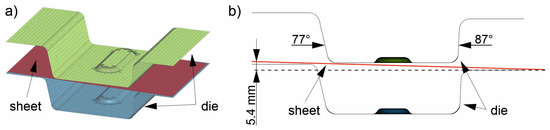
Figure 4.
The used FE model consists of two die halves (green and blue) and the undeformed sheet (red) (a). The die has different flank angles and a height difference to achieve different local cooling rates (b).
3. Results and Discussion
3.1. Initial Microstructure
The microstructure of the initial normalized material, without any further heat treatment, is presented in Figure 5. The micrographs show a homogeneous grain size distribution across the x-, y- and z-planes of the sheets. The material is characterized by uniformly distributed equiaxed grains. In color etching with Klemm’s II reagent, most grains appear randomly distributed (as indicated by different shades), which suggests an almost isotropic mechanical behavior for the initial material. An average diameter of approximately 10.1 ± 0.11 µm was obtained by line intersection (eight lines) analysis based on three individual measurements per orientation. Complex carbides resulting from the normalization heat treatment are also visible as white dots in the micrographs.
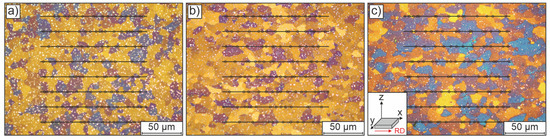
Figure 5.
Optical micrographs of the normalized initial condition of the low-alloy steel, shown in representative sections of (a) the z-plane, (b) the y-plane and (c) the x-plane of the sheet material; the corresponding coordinate system used throughout this paper is shown in the inset in (c). All samples were prepared using short color etching with Klemm’s II reagent. The marked lines and points illustrate the determination of grain sizes by linear intersection method (8 lines in 3 micrographs for each orientation).
3.2. Transformation Temperatures and Heat-Treated Conditions
To design a Q&P heat treatment strategy suitable for integration in the press hardening process, it is necessary to identify the transformation parameters for the new low-alloy steel. Small rectangular specimens were characterized in dilatometric studies for three different austenitizing temperatures of 900, 950 and 1000 °C, respectively, at a constant heating rate of 30 K/s. Figure 6 shows two representative dilatation curves for an austenitizing temperature of Figure 6a 950 °C and Figure 6b 1000 °C. Linear thermal expansion-temperature curves are used to illustrate the procedure for determining transformation temperatures. The corresponding transformation temperatures are indicated by diamond markers. While Ac1 represents the temperature of the beginning austenite formation, Ac3 marks the temperature at which the austenitic phase transformation is completed during heating. The starting temperature of the martensitic phase transformation is denoted by Ms, and Mf marks the temperature at which the martensitic phase transformation is completed during cooling. In the region of the beginning and end of these phase transitions, a tangent (dotted blue lines) was fitted to the curve in a temperature interval of 50 K. The first deviation from these tangents was used to determine the transition temperatures. The results obtained in this way were averaged from the measurements of two samples in each case. Table 2 provides a summary of the results of all measurements. The measurements for austenitization at Figure 6a 950 °C and Figure 6b 1000 °C show similar results; the austenitic phase transformation takes place in the range between about 800 °C to 900 °C. A similar trend was observed for the material when tested up to only 900 °C. However, in this case, due to the more limited temperature range, sufficient linear thermal expansion could not be achieved for a confident determination of the transformation temperature using the tangent method. In addition, the 900 °C austenitization does not ensure that all of the carbon content is sufficiently dissolved and thus available for subsequent stabilization of the retained austenite in subsequent partitioning processes. An incomplete dissolution of pre-existing carbides and borides would directly affect the martensitic transformation temperatures determined subsequently. In fact, the martensitic phase transformation for austenitization at 900 °C shows a slight increase in the critical transformation temperatures (Ms = 365.3 °C, Mf = 198.1 °C) in comparison with all the other experiments. The 950 and 1000 °C tests, on the other hand, show similar values in the 350 °C range within experimental scatter, particularly for the martensite start temperature (Ms). As can be seen from comparing Figure 6a,b), there are larger deviations for the martensite finish temperature ranging from 147.7 °C to 194.3 °C. It is likely that these variations are related to a change in the chemical composition of the austenite in the sheet samples as a result of the different heating temperatures. The higher austenitization temperatures at 950 and 1000 °C are probably responsible for a more effective dissolution of carbides and borides, resulting in a higher content of alloying elements in the austenite and a consequent decrease in Ms and Mf, although the simple tangent method used may be partly responsible for some of the deviations.
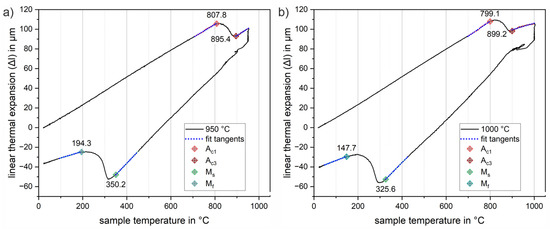
Figure 6.
Representative dilatation curves for austenitization at (a) 950 °C and (b) 1000 °C for 5 min and a constant heating and cooling rate of 30 K/s. The tangent method used for the determination of transition temperatures is illustrated by the blue dotted tangents fitted to the transition regions. Transformation temperatures austenite start Ac1 (orange), austenite finish Ac3 (red), martensite start Ms (green) and martensite finish Mf (blue) are highlighted by diamond markers, respectively.
Table 2.
Transformation temperatures of the low-alloy steel determined from the dilatation curves and derived parameters for press partitioning.
From the measured transition temperatures, values with sufficient temperature differences for experimental heat treatments were derived for a valid and stable design of the subsequent Q&P heat treatment strategies. These parameters are summarized in Table 2. The austenitization temperature of 950 °C was chosen to ensure homogeneous austenitization and complete solution of the entire carbon content, especially for larger sheets in the final press partitioning process with varying contact conditions and transfer times. The temperature of 250 °C was chosen as the partitioning range because it was found to be well below the onset temperature of martensite (Ms) and is also likely to provide a sufficient volume fraction of retained austenite after the Q&P process.
For the purpose of microstructural and mechanical characterization under process-related conditions, exemplary heat treatment routes were defined and explored experimentally. This was achieved by austenitizing the initial condition of the sheets for 5 min at 950 °C in a conventional heat treatment furnace (heating rate approx. 5 K/s, additional 10 min for completely heating up the material after placing it in the furnace). A short austenitization time was chosen to keep the austenite grain size as small as possible, as it directly influences the resulting package size of the resulting martensite structures and hence the mechanical properties [33]. Following austenitization, several quenching scenarios were defined to account for altered quenching conditions that occur in actual dies. Figure 7 shows the results of the subsequent Vickers hardness measurement (HV1) for these conditions. To characterize the highest achievable strength of the material with the highest martensite content, a water-quenched condition (red in Figure 7) was produced. During quenching in water, an experimental cooling rate of approximately 430 K/s was recorded. Compared to the initial condition (178.6 HV1), the water-quenched condition showed a significant increase in hardness of more than 280% to 686.6 HV1. To account for the different cooling rates due to different contact ratios in actual dies, an additional condition was quenched in oil (yellow) with a cooling rate of about 155 K/s. For this condition, an increase in hardness of approximately 261% to 645.3 HV1 was achieved. Moreover, partitioning conditions were established for various exemplary holding times of 60 s (Q&P 250 °C 60 s), 300 s (Q&P 250 °C 300 s) and up to 600 s (Q&P 250 °C 600 s) at a constant salt bath temperature of 250 °C. Direct quenching of the austenitized sample in a salt bath resulted in an average cooling rate of 40 K/s. In comparison to the quenched conditions, the partitioned samples showed a continuous decrease in hardness as a function of holding time (blue). This indicates an increased amount of retained austenite compared to the quenched conditions. Even a short partitioning time of 60 s already led to a significant decrease in hardness to a value of 583.2 HV1. Partitioning for 300 s and 600 s resulted in a further decrease in hardness to 572.7 and 561.5 HV1, respectively.
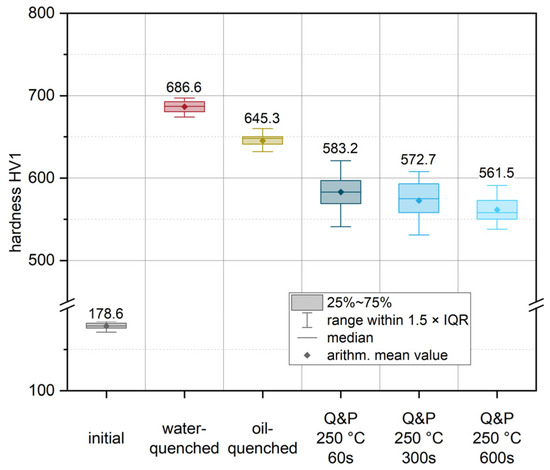
Figure 7.
Hardness (HV1) values after individual heat treatments: initial condition (grey), the austenitized and water-quenched material (red) and the conditions after Q&P heat treatment (blue). In addition, the hardness for a condition quenched in quenching oil (yellow) is given. The arithmetic mean values from all measurements are highlighted by diamond markers and on the basis of the plotted values. The medians are illustrated using horizontal lines. The boxes mark the interquartile range (IQR), while the bars represent all values within in a region of 1.5 × IQR (for easy definition of outliers).
3.3. Microstructure of Heat-Treated Conditions and Retained Austenite Fractions
The amount and morphology of retained austenite have an important influence on the deformation behavior of Q&P heat-treated steels [34,35]. To gain a better understanding of the deformation behavior of the new low-alloy Q&P steel 37SiB6, the microstructure was further investigated in the heat-treated conditions, focusing on the characterization of the former austenite grain boundaries and on retained austenite fractions.
Quantitative analysis of the retained austenite fractions of all conditions were performed by XRD measurements in the y-plane of the sheets. In this way, surface effects (decarburization of the surface layer and temperature gradients between the surface layer and the center of the cross-section) were included in the measurements of all conditions in a comparable manner, giving a realistic impression of the actual sheets. Table 3 summarizes the results of these measurements. In agreement with the optical micrographs, the initial condition also shows an almost completely ferritic microstructure in the XRD measurements. In addition, an orthorhombic phase with a fraction of approximately 1 wt.% was detected for the initial condition. The phase contains both Fe and C and is therefore most likely of the Fe3C type. This correlates well with the finely dispersed initial carbides observed in optical micrographs of the initial condition (see also Figure 5). Compared to the initial condition, quenching in water results in a predominantly martensitic microstructure in the material, which already contains a small amount of retained austenite of about 0.3 wt.%. This is in good agreement with the large hardness increase observed (see Figure 6). Continuously increasing retained austenite contents of 2.1 wt.%, 5.8 wt.% and 6.3 wt.% are found for the partition treatments at 250 °C for the increasing holding times of 60 s, 300 s and 600 s, respectively. This is also consistent with continuously decreasing hardness values for increasing holding times (60 s, 300 s, 600 s).
Table 3.
Quantitative phase fractions determined by Rietveld analysis from the XRD data.
SEM with EBSD detection was used to analyze samples from the water-quenched, Q&P 250 °C 60 s and Q&P 250 °C 300 s conditions. Figure 8 shows representative mappings of these investigations. The first column shows the results of the water-quenched condition. Partitioning results (at 250 °C) with a holding time of 60 s and 300 s are shown in the second and third columns, respectively. Figure 8a–c shows orientation maps (superimposed by image quality) of the microstructure for each of the three conditions. The microstructure consistently features the typical fine lamellae of martensite arranged in blocks and packets of random orientation within the previous austenite grain boundaries. Irrespective of the heat treatment routine used, the blocks and packets appear to be of similar size and morphology. There are a few isolated small voids, presumably due to microstructural components (carbides, retained austenite) that fell out during preparation.
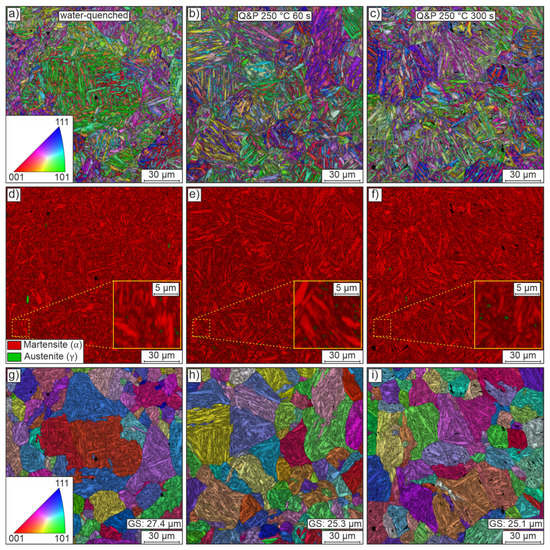
Figure 8.
Representative EBSD data of the heat-treated conditions water-quenched (first column), Q&P 250 °C 60 s (second column) and Q&P 250 °C 300 s (third column) in the y-plane of the sheets. The first row (a–c) shows orientation maps of the microstructure, which is predominantly martensitic. The second row (d–f) shows phase maps to differentiate between martensite and small regions of retained austenite. The third row (g–i) shows orientation maps of parent grains reconstructed from the EBSD data, assuming the validity of the Nishiyama–Wassermann orientation relationship. The band contrast results are superimposed on all maps.
Figure 8d–f shows phase maps using the best-fit lattice structure to distinguish between face-centered cubic austenite (green) and tetragonally distorted body-centered cubic martensite (red). The phase maps of all conditions show a predominantly martensitic matrix (red). This matrix is only very rarely interrupted by small, mostly blocky, austenitic regions. However, the additional detailed views suggest that some of the retained austenite is very likely located in a film-like layer between the laths. Much higher resolution micrographs or postprocessing methods, e.g., neighbor pattern averaging and reindexing, would be required to confidently locate regions of retained austenite [16]. In addition, it is worth noting that EBSD data do not allow an accurate quantification of the absolute amount of retained austenite and are likely to underestimate the austenite fraction, again because of the physical resolution limits. Despite these issues, the very finely distributed small amounts of retained austenite generally and qualitatively agree well with the rather small amounts of retained austenite determined by XRD.
Besides the volume fraction of retained austenite, the pre-quenching austenite grain size distribution is of great interest in the design of an appropriate partitioning strategy because it directly affects the size and orientation of blocks and packets and the resulting mechanical properties. On the basis of the EBSD orientation maps, the parent grains were reconstructed assuming a Nishiyama–Wassermann orientation relationship. Figure 8g–i shows orientation maps (superimposed by image quality) of the parent grains reconstructed from the EBSD data. Randomly oriented, quite globular grains of varying size are observed in all conditions. The mean grain size for all conditions remains at a similar level of about 25 to 27 µm. The reconstructed austenite grain size fits well with the equal heat-up and holding times for the differently quenched conditions. Compared to the initial grain size of about 10 µm, the grain size has more than doubled as a result of heat treatment, which can potentially negatively affect the achievable mechanical strength. When designing the final forming process, one should therefore realize the highest possible heating rates (>5 K/s) with correspondingly short heating times [36].
3.4. Tensile Properties at Room Temperature
Figure 9 shows selected engineering stress–strain curves of the 37SiB6 steel at all heat treatment conditions for the tensile tests at a strain rate of 100 s−1. In addition, Figure 10 summarizes the mechanical parameters (yield strength, tensile strength and elongation at fracture) obtained from all tests to quantify the mechanical behavior. Figure 9a shows representative stress–strain curves of the initial condition for different orientations with respect to the rolling direction (0°, 45°, 90° to RD). The low-alloy steel is characterized by medium strength and achievable elongation at fracture up to 30% in the normalized condition. The elongation at fracture shows slightly reduced values of approx. 25% for the orientations 45° and 90° to the RD, which indicates a minor anisotropy due to a mild rolling texture. The average elongation at fracture (Figure 10c) of the initial condition is 27.5%. The average yield strength of the normalized initial condition is 460.1 MPa (Figure 10a), while the tensile strength is 627.0 MPa (Figure 10b). Figure 9b shows the reproducibility of the heat treatment using the stress–strain curves of three individual samples oriented in RD. Compared to the initial condition, there is a significant increase in strength of 241% to a yield strength of 1568.1 MPa (Figure 10a). Tensile strength increases to an average of 2194.8 MPa (Figure 10b), a 250% increase from the initial condition. The pronounced increase in strength is accompanied by a significant decrease in elongation at fracture to an average of 4.8% (Figure 10c). Both values can be explained by the almost fully martensitic microstructure as determined by XRD and EBSD (see also Table 3 and Figure 8a).
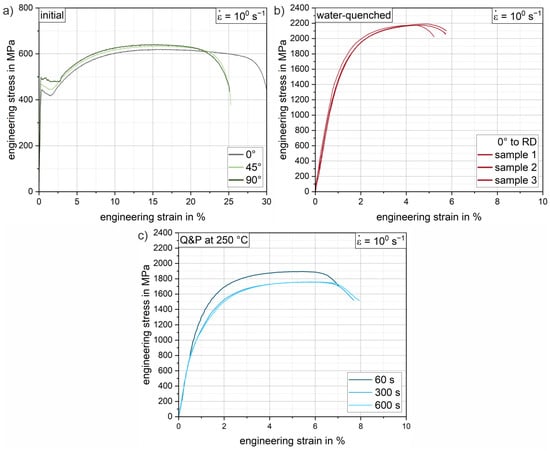
Figure 9.
Exemplary (tensile) engineering stress–strain curves of the low-alloy steel 37SiB6 for a strain rate of 100 s−1: (a) the initial condition for 0° (grey), 45° (light green) and 90° (dark green) orientation to RD; (b) three individual samples (RD) of the austenitized and water-quenched material; (c) conditions after Q&P heat treatment for holding times of 60 s, 300 s and 600 s.
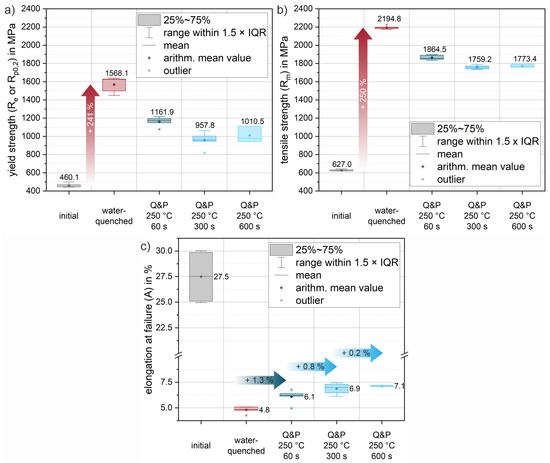
Figure 10.
Evolution of mechanical properties due to heat treatment, calculated from the engineering stress–strain data of tensile tests at a strain rate of 10 s−1: (a) evolution of yield strength; (b) evolution of tensile strength; (c) evolution of the elongation at failure. Arithmetic mean values from all measurements are highlighted by diamond markers and medians by horizontal lines. Arithmetic mean values are additionally given as values. The boxes mark the interquartile range (IQR), while the bars represent all values within in a region of 1.5 × IQR (for easy definition of outliers, marked where needed by an asterisk *).
Figure 9c shows representative Q&P conditions for various increasing holding times of 60 s, 300 s and 600 s for a partitioning heat treatment at a salt bath temperature of 250 °C. Compared to the water-quenched condition, the stress–strain curves of the quenched and partitioned states show a slight decrease in strength and a significant increase in elongation at fracture. In particular, for the first 60 s of the partitioning time, a significant increase in the elongation at fracture of an average of 1.3% is already achieved (see Figure 10c). The yield strength decreases by approximately 26% and the tensile strength by 15% (see Figure 10a,b). Longer holding times of 300 s and 600 s result in further improvements in elongation of 0.8% (Q&P 250 °C 300 s) and 0.2% (Q&P 250 °C 600 s), respectively (see Figure 10c). Since all heat-treated conditions show a similar arrangement of fine martensite lamellae in blocks and packets with a small fraction of blocky and interlamellar retained austenite (Figure 8), the increase in achievable elongation at fracture with increasing partitioning time agrees well with the increase in retained austenite fraction found in the XRD measurements (Table 3). With increasing partitioning time, the strength values appear to converge towards a threshold value of about 1000 MPa for the yield strength and 1800 MPa for the tensile strength. A similar behavior can be observed for the reduction in elongation at fracture. As partitioning time increases, a threshold of approximately 7% (engineering strain) elongation at fracture is approached. While ductility increases only slightly as partitioning time increases, a steady decrease in strength can be observed. Therefore, from a processing perspective, the most significant improvement can already be achieved with the short partitioning time of 60 s.
3.5. Numerical Process Design for Press Partitioning
Figure 11 shows the simulation results obtained for the heating (1) and transfer (2) process steps. The heating process (Figure 11a) in the furnace is linear up to the experimentally determined austenitizing temperature of 950 °C. When the sheet was heated, there was a thermally induced expansion of the sheet by approx. 1%. The dimensions are then 242.6 × 144.1 × 1.516 mm3. The heated sheet results were then applied to the transfer simulation (2). The duration of the transfer into the die was based on experimental data and was set to 10 s. During this time, heat loss occurred due to convection and radiation. The temperature dropped from 950 °C to 780 °C (Figure 11b). The temperature distribution in the sheet was completely homogeneous.
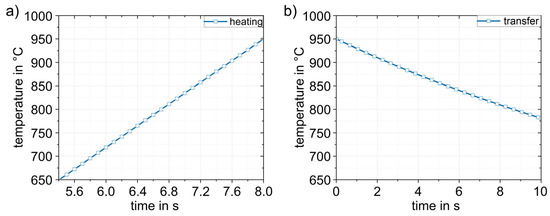
Figure 11.
Numerically determined temperature–time curves in the sheet during (1) heating to 950 °C (a) and (2) during the transfer (in 10 s) to the die (b). The temperature in the sheet is completely homogeneous.
The simulation results for process step (3), insertion into the lower die, are shown in Figure 12. Figure 12a shows the sheet with a final temperature of 780 °C after transfer (2). The time for insertion into the die is 1 s. Figure 12b shows the temperature distribution after 1 s. For better visualization, five points (A–E) were defined at representative areas on the sheet surface for further analysis, and the temperature–time curves were evaluated (Figure 12c). In the insertion process step, it is evident that due to the inclination of the die geometry (5.4 mm height difference between the left and right sides), the initial contact between sheet and die occurs in the area of point B. This results in the most pronounced cooling in this area. The results shown in Figure 12b were obtained for a simulated die temperature of 50 °C. Simulation results for die temperatures of 100–200 °C were almost identical; only the temperatures reached after die contact were slightly different. The largest difference was at point B, where the temperature for the four different die temperatures was between 690 and 712 °C. The results for all simulations with different die temperatures are summarized in Table 4. After simulating the insertion for the four die temperatures, the results were transferred to the forming simulation (4) and used, again, as initial values.
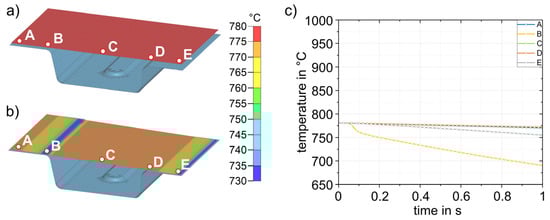
Figure 12.
Sheet (780 °C) with five representative points (A–E) to study the local temperature–time curves before insertion (3) into the die (a). Sheet after insertion into the die and a cooling time of 1 s (b). Temperature–time curves for points A–E (c). Only the lower die is shown.
Table 4.
Temperature at points A–E after insertion (3) into the die for four different die temperatures.
Figure 13 shows exemplary results of forming in the die at a temperature of 50 °C. The forming process and closing of the tool has a total duration of 1 s. During forming, the sheet metal comes into contact with the die at different times at different locations, which consequently leads to strong heat conduction in these areas of the sheet. This is particularly evident in point D. Evaluation of the cooling curves at the five representative points for the four die temperatures in Figure 14 shows that rapid bilateral die contact occurs at point D due to the steep flank angle of 87° (see Figure 3), and thus the temperature drop is most pronounced. The cooling rate at point D is approximately 80–100 K/s. All other points are subjected to cooling rates of about 20–30 K/s. The temperature distribution in the sheet is relatively homogeneous. Only the flanks are cooled to significantly lower temperatures (648–683 °C). Points A, C and E are the last to have tool contact on both sides and therefore exhibit the highest temperatures (723–755 °C). The temperatures obtained after closing (4) the heated die were then transferred to the next simulation step (5) as starting parameters.
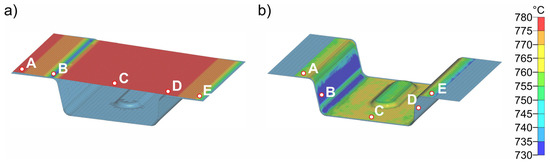
Figure 13.
Temperature distribution before (a) and after (b) forming (4) in the die at a die temperature of 50 °C and a forming time of 1 s. Only the lower die is shown.
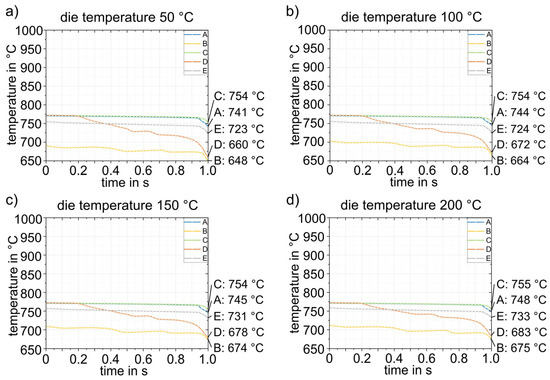
Figure 14.
Temperature–time curves during forming (4) for four different die temperatures (a–d).
Figure 15 and Figure 16 show the results of the simulations of the final process step, closed die quenching (5). This is where heat conduction is highest due to the high surface pressure. This in turn leads to very high cooling rates of >500 K/s in the component. The cooling considered here covers a period of 10 s, after which time the temperature in the component is almost constant. The goal of the entire process design is to be able to partition the part in the die and thus improve the mechanical properties through the Q&P process. Consequently, the temperature of the component must not drop below the experimentally determined Mf temperature of 183 °C at any point. Figure 15 shows the cooling of the part at different times from start at 0 s to 5 s in the die heated to 50 °C. The results demonstrate that the temperature in the component is completely homogenized in a very short time. After 5 s, the temperature in the entire part is already below 100 °C, well below the Mf temperature, which means that this die temperature is not suitable for partitioning. The detailed quenching curves of the four die temperatures are shown in Figure 16. The range between Ms and Mf is also highlighted. At die temperatures up to 100 °C, the temperature drops below the Mf temperature within 1.0 to 1.5 s, making these die temperatures unsuitable for partitioning. From a die temperature of 150 °C, a final temperature of 177 °C can be homogeneously achieved in the component, at least in the calculated 10 s, which is just below the Mf temperature of 183 °C. This shows that even 150 °C is too low for partitioning in the die. At higher die temperatures, partitioning can be realized safely in the process. This is shown in Figure 16d for a die temperature of 200 °C: After 10 s, the temperature (225 °C) is homogeneously distributed throughout the component. This ensures that the material has sufficient time to partition, even with longer partitioning times. The difference between the relevant die temperatures and the target temperature is approximately 25 °C. In summary, a die temperature of >175 °C can be recommended in the experimental die design considered here to ensure partitioning temperatures of at least 200 °C. It should be noted that the geometry of the part is expected to play only a minor role due to the high cooling rates during quenching. The Ms temperature is reached at all die temperatures with a maximum difference of 0.5 s between each area of the part.
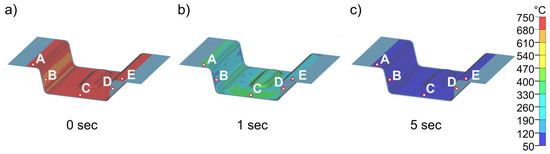
Figure 15.
Temperature distribution in the sheet at different times (a–c) during cooling (5) for a die temperature of 50 °C.
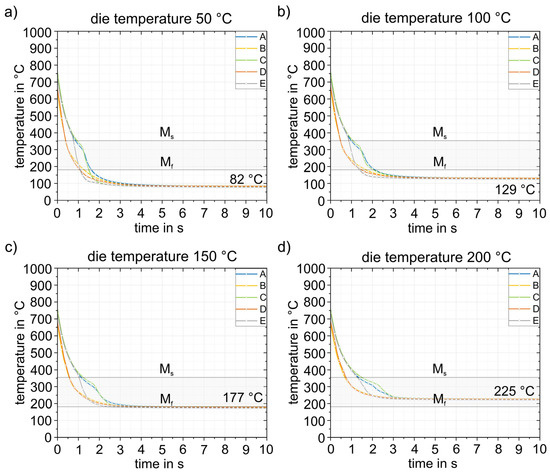
Figure 16.
Temperature–time curves during cooling (5) for four different die temperatures (a–d). The targeted process window between the Ms and Mf temperatures is also shown. Reliable partitioning above the Mf temperature can only be achieved at die temperatures of 200 °C.
4. Summary and Conclusions
In the present study, the new low-alloy steel 37SiB6 was for the first time qualified for Q&P heat treatment directly in the press hardening process. Partitioning times of 60 s, 300 s and 600 s were investigated experimentally. These resulted in variable retained austenite contents (between 2.1 and 6.3%) as determined by XRD. The results demonstrate that from a processing perspective, the most significant improvement in terms of strength and ductility was achieved after 60 s. The boundary conditions and parameters for subsequent numerical simulations were derived from the experimental results. The aim of the simulations was to perform partitioning directly in the process. For this purpose, the cooling rates at different points of a part during the entire press hardening process were investigated numerically. The key findings of our experiments and simulations can be summarized as follows:
- 37SiB6 steel is suitable for Q&P heat treatment. A significant increase in strength and ductility can be achieved by Q&P.
- The most favorable combination of strength and ductility was achieved after 60 s of partitioning at 250 °C.
- Q&P heat treatment in the die is possible due to the short partitioning times.
- Die temperatures >175 °C must be used so that the part does not cool below the Mf temperature.
- Part geometry and various contact locations with the die prior to quenching play only a minor role. The die temperature is the dominant factor in achieving partitioning in the press hardening process.
Our study presents the first results of the qualification of the material for Q&P heat treatment and the numerical design of the press hardening process with special consideration of the local cooling curves. The results clearly demonstrate that this process of press partitioning can be implemented in real-life experimental set-ups. Detailed experimental validation of the process is currently under way.
Author Contributions
Conceptualization, C.I. and S.W.; methodology, C.I., S.W., M.B. and R.H.; simulation, R.H.; validation, C.I., S.W. and R.H.; investigation, C.I. and R.H.; resources, A.H.; writing—original draft, C.I., S.W. and M.F.-X.W.; writing—review and editing, C.I., S.W., R.H., M.F.-X.W. and V.P.; visualization, C.I., M.B., N.R. and S.W.; supervision, V.K., V.P., A.H. and M.F.-X.W.; project administration, C.I. and S.W.; funding acquisition, M.F.-X.W. and V.P. All authors have read and agreed to the published version of the manuscript.
Funding
The research project IFG 22350 BR/P 1573 “ Herstellung höchstfester, duktiler Bauteile aus einem niedriglegierten Vergütungsstahl mittels neuartiger Quenching & Partitioning-Presshärtestrategien” from the Research Association for Steel Application (FOSTA), Düsseldorf, is supported by the Federal Ministry of Economic Affairs and Climate Action of the German Federation of Industrial Research Associations (AiF) as part of the program for promoting industrial cooperative research (IGF) on the basis of a decision by the German Bundestag. The project is carried out at Fraunhofer Institute for Machine Tools and Forming Technology IWU and the Institute of Materials Science and Engineering, Chemnitz University of Technology.
Data Availability Statement
The data presented in this study are available on request from the corresponding author.
Acknowledgments
The authors gratefully acknowledge Marc Pügner and Thomas Mehner for assistance with the XRD measurements, Pierre Landgraf for support with the design and realization of the dilatometric studies, and Philipp Frint for valuable discussions in the early stages of this project.
Conflicts of Interest
The authors declare no conflict of interest.
References
- Tekkaya, A.E.; Ben Khalifa, N.; Grzancic, G.; Hölker, R. Forming of Lightweight Metal Components: Need for New Technologies. Procedia Eng. 2014, 81, 28–37. [Google Scholar] [CrossRef]
- George, R.; Bardelcik, A.; Worswick, M.J. Hot Forming of Boron Steels Using Heated and Cooled Tooling for Tailored Properties. J. Mater. Process Technol. 2012, 212, 2386–2399. [Google Scholar] [CrossRef]
- Neugebauer, R.; Schieck, F.; Polster, S.; Mosel, A.; Rautenstrauch, A.; Schönherr, J.; Pierschel, N. Press Hardening—An Innovative and Challenging Technology. Arch. Civ. Mech. Eng. 2012, 12, 113–118. [Google Scholar] [CrossRef]
- Grydin, O.; Andreiev, A.; Holzweißig, M.J.; Rüsing, C.J.; Duschik, K.; Frolov, Y.; Schaper, M. Short Austenitization Treatment with Subsequent Press Hardening: Correlation between Process Parameters, Microstructure and Mechanical Properties. Mater. Sci. Eng. A 2019, 749, 176–195. [Google Scholar] [CrossRef]
- Yang, H.; Sun, Y.; Tan, C.; Zhao, X.; Chen, B.; Song, X.; Guo, W.; Feng, J. Influence of Al–Si Coating on Microstructure and Mechanical Properties of Fiber Laser Welded and Then Press-Hardened 22MnB5 Steel. Mater. Sci. Eng. A 2020, 794, 139918. [Google Scholar] [CrossRef]
- Karbasian, H.; Tekkaya, A.E. A Review on Hot Stamping. J. Mater. Process Technol. 2010, 210, 2103–2118. [Google Scholar] [CrossRef]
- Jian, B.; Wang, L.; Mohrbacher, H.; Lu, H.Z.; Wang, W.J. Development of Niobium Alloyed Press Hardening Steel with Improved Properties for Crash Performance. Adv. Mat. Res. 2015, 1063, 7–20. [Google Scholar] [CrossRef]
- Guo, W.; Wan, Z.; Peng, P.; Jia, Q.; Zou, G.; Peng, Y. Microstructure and Mechanical Properties of Fiber Laser Welded QP980 Steel. J. Mater. Process Technol. 2018, 256, 229–238. [Google Scholar] [CrossRef]
- Hatscher, A. Design and Potential Analysis of a New Ultra High Strength Steel (1900 MPa) with Q&P Processes for Car Body Applications. In Proceedings of the 7th International Conference on Hot Sheet Metal Forming of High Performance Steel (CHS2), Luleå, Sweden, 2–5 June 2019. [Google Scholar]
- Davies, G. Materials for Automobile Bodies, 2nd ed.; Butterworth-Heinemann: Oxford, UK, 2012; ISBN 978-0-08-096979-4. [Google Scholar]
- Winter, S.; Werner, M.; Haase, R.; Psyk, V.; Fritsch, S.; Böhme, M.; Wagner, M.F.-X. Processing Q&P Steels by Hot-Metal Gas Forming: Influence of Local Cooling Rates on the Properties and Microstructure of a 3rd Generation AHSS. J. Mater. Process Technol. 2021, 293, 117070. [Google Scholar] [CrossRef]
- Speer, J.; Matlock, D.K.; De Cooman, B.C.; Schroth, J.G. Carbon Partitioning into Austenite after Martensite Transformation. Acta Mater. 2003, 51, 2611–2622. [Google Scholar] [CrossRef]
- Clarke, A.J.; Speer, J.G.; Miller, M.K.; Hackenberg, R.E.; Edmonds, D.V.; Matlock, D.K.; Rizzo, F.C.; Clarke, K.D.; De Moor, E. Carbon Partitioning to Austenite from Martensite or Bainite during the Quench and Partition (Q&P) Process: A Critical Assessment. Acta Mater. 2008, 56, 16–22. [Google Scholar] [CrossRef]
- Jirková, H.; Mašek, B.; Wagner, M.F.-X.; Langmajerová, D.; Kučerová, L.; Treml, R.; Kiener, D. Influence of Metastable Retained Austenite on Macro and Micromechanical Properties of Steel Processed by the Q&P Process. J. Alloys Compd. 2014, 615, 163–168. [Google Scholar] [CrossRef]
- Liehr, A.; Wegener, T.; Degener, S.; Bolender, A.; Möller, N.; Niendorf, T. Experimental Analysis of the Stability of Retained Austenite in a Low-Alloy 42CrSi Steel after Different Quenching and Partitioning Heat Treatments. Adv. Eng. Mater. 2023, 2300380, 1–16. [Google Scholar] [CrossRef]
- Frint, P.; Kaiser, T.; Mehner, T.; Bruder, E.; Scholze, M.; Mašek, B.; Lampke, T.; Wagner, M.F.-X. Strain-Rate Sensitive Ductility in a Low-Alloy Carbon Steel after Quenching and Partitioning Treatment. Sci. Rep. 2019, 9, 17023. [Google Scholar] [CrossRef]
- Jirková, H.; Opatová, K.; Jeníček, Š.; Kučerová, L. Combination of Press-Hardening and Isothermal Holding in the Treatment of High-Strength Steels. In IOP Conference Series: Materials Science and Engineering; IOP Publishing: Bristol, UK, 2020; Volume 723, p. 012012. [Google Scholar] [CrossRef]
- Tan, X.; Lu, W.; Guo, N.; Song, B.; Rao, X.; Xu, Y.; Guo, S. Effect of Tempering and Partitioning (T&P) Treatment on Microstructure and Mechanical Properties of a Low-Carbon Low-Alloy Quenched and Dynamically Partitioned (Q-DP) Steel. Mater. Sci. Eng. A 2023, 872, 144968. [Google Scholar] [CrossRef]
- Tkachev, E.; Borisov, S.; Belyakov, A.; Kniaziuk, T.; Vagina, O.; Gaidar, S.; Kaibyshev, R. Effect of Quenching and Tempering on Structure and Mechanical Properties of a Low-Alloy 0.25C Steel. Mater. Sci. Eng. A 2023, 868, 144757. [Google Scholar] [CrossRef]
- Tkachev, E.; Borisov, S.; Borisova, Y.; Kniaziuk, T.; Gaidar, S.; Kaibyshev, R. Strength–Toughness of a Low-Alloy 0.25C Steel Treated by Q& P Processing. Materials 2023, 16, 3851. [Google Scholar] [CrossRef]
- Mishnev, R.; Borisova, Y.; Gaidar, S.; Kniaziuk, T.; Vagina, O.; Kaibyshev, R. Q&P Response of a Medium Carbon Low Alloy Steel. Metals 2023, 13, 689. [Google Scholar] [CrossRef]
- Speer, J.G.; De Moor, E.; Findley, K.O.; Matlock, D.K.; De Cooman, B.C.; Edmonds, D. V Analysis of Microstructure Evolution in Quenching and Partitioning Automotive Sheet Steel. Metall. Mater. Trans. A 2011, 42, 3591–3601. [Google Scholar] [CrossRef]
- Han, X.; Li, Y.; Chen, S.; Tan, S.; Ding, Y.; Chen, J. Research on Q&P Hot Stamping Process Integrated with Fractional Cooling Strategy. Procedia Eng. 2017, 207, 705–710. [Google Scholar] [CrossRef]
- Frohn-Sörensen, P.; Mašek, B.; Wagner, M.F.-X.; Rubešová, K.; Khalaj, O.; Engel, B. Flexible Manufacturing Chain with Integrated Incremental Bending and Q-P Heat Treatment for on-Demand Production of AHSS Safety Parts. J. Mater. Process Technol. 2020, 275, 116312. [Google Scholar] [CrossRef]
- Jiao, X.; Wang, D.; Yang, J.; Liu, Z.; Liu, G. Microstructure Analysis on Enhancing Mechanical Properties at 750 °C and Room Temperature of Ti-22Al-24Nb-0.5Mo Alloy Tubes Fabricated by Hot Gas Forming. J. Alloys Compd. 2019, 789, 639–646. [Google Scholar] [CrossRef]
- Mašek, B.; Vorel, I.; Jirková, H.; Kurka, P. Combination of International High Pressure Forming and Q-P Process for Production of Hollow Products from Ahs Steel. Adv. Mat. Res. 2015, 1127, 9–15. [Google Scholar] [CrossRef]
- Jirková, H.; Jeníček, Š.; Kučerová, L.; Kurka, P. High-Strength Steel Components Produced by Hot Metal Gas Forming. Mater. Sci. Technol. 2021, 37, 693–701. [Google Scholar] [CrossRef]
- Votava, F.; Jirková, H.; Kučerová, L.; Jeníček, Š. Study of Transition Areas in Press-Hardened Steels in a Combined Tool for Hot and Cold Forming. Materials 2023, 16, 442. [Google Scholar] [CrossRef]
- Diekmann, U.; Becker, P.; Dlouhy, J.; Novy, Z.; Hatscher, A. Development and Characterization of New Low Alloyed Ultra-High Strength Steel for Structural Body Components. In Proceedings of the 6th International Conference on Steels in Cars and Trucks, Milan, Italy, 21 June 2022. [Google Scholar]
- ASTM A1033-04; Standard Practice for Quantitative Measurement and Reporting of Hypoeutectoid Carbon and Low-Alloy Steel Phase Transformations. ASTM International: West Conshohocken, PA, USA, 2018.
- Shapiro, A.B. Using LS-Dyna for Hot Stamping; DYNAmore GmbH: Salzburg, Austria, 2009. [Google Scholar]
- Hora, P. Numisheet 2008, 7th International Conference and Workshop on Numerical Simulation of 3D Sheet Metal Forming Processes, Interlaken, Switzerland, 1–5 September 2008. Available online: https://www.tib.eu/en/search/id/TIBKAT%3A584527977/Numisheet-2008-International-Conference-and-Workshop/ (accessed on 1 June 2023).
- Härtel, S.; Awiszus, B.; Graf, M.; Nitsche, A.; Böhme, M.; Wagner, M.F.-X.; Jirkova, H.; Masek, B. Influence of Austenite Grain Size on Mechanical Properties after Quench and Partitioning Treatment of a 42SiCr Steel. Metals 2019, 9, 577. [Google Scholar] [CrossRef]
- De Moor, E.; Lacroix, S.; Clarke, A.J.; Penning, J.; Speer, J.G. Effect of Retained Austenite Stabilized via Quench and Partitioning on the Strain Hardening of Martensitic Steels. Metall. Mater. Trans. A 2008, 39, 2586–2595. [Google Scholar] [CrossRef]
- Tan, X.; Xu, Y.; Yang, X.; Wu, D. Microstructure–Properties Relationship in a One-Step Quenched and Partitioned Steel. Mater. Sci. Eng. A 2014, 589, 101–111. [Google Scholar] [CrossRef]
- Tan, X.; Lu, W.; Rao, X. Effect of Ultra-Fast Heating on Microstructure and Mechanical Properties of Cold-Rolled Low-Carbon Low-Alloy Q&P Steels with Different Austenitizing Temperature. Mater. Charact. 2022, 191, 112086. [Google Scholar] [CrossRef]


Disclaimer/Publisher’s Note: The statements, opinions and data contained in all publications are solely those of the individual author(s) and contributor(s) and not of MDPI and/or the editor(s). MDPI and/or the editor(s) disclaim responsibility for any injury to people or property resulting from any ideas, methods, instructions or products referred to in the content. |
© 2023 by the authors. Licensee MDPI, Basel, Switzerland. This article is an open access article distributed under the terms and conditions of the Creative Commons Attribution (CC BY) license (https://creativecommons.org/licenses/by/4.0/).