Abstract
Reasonable welding speeds are a prerequisite for obtaining high-quality joints by friction stir welding (FSW). In this paper, 2195-T8 Al-Li alloy FSW joints were successfully fabricated at different welding speeds (100–600 mm/min) with a constant rotation speed. The effect of welding speed on the microstructure and mechanical properties was analyzed under different experimental methods. Microstructural characterization was conducted using optical microscopy (OM), scanning electron microscopy (SEM), electron backscattered diffraction (EBSD) and transmission electron microscopy (TEM). Mechanical properties were measured by a hardness test and a tensile test. The results showed that the original T1 precipitates disappeared in the nugget zone (NZ), generating many dislocations. With welding speeds increasing, joints obtained at lower welding speeds developed coarser T1 precipitates in the heat-affected zone. Also, the equiaxed grains with a bigger size and a higher fraction of high angle boundaries (HABs) were detected in the NZ of these joints. As the welding speed increased, the area of hardness value changes gradually shrunk, which was consistent with the trend of the cross-section morphology. A kissing bond and macroscopic cracking were observed in the joints that were fabricated at the higher welding speeds. The appearance of those defects significantly reduced the ultimate tensile strength and elongation of the joints at high welding speeds. Fracture morphologies of the different joints were all characterized in quasi-cleavage fractures.
1. Introduction
Aluminum alloy has the advantages of lighter weight, resistance to stress corrosion, high tensile strength and reasonable thermal conductivity and has become the preferred material in aerospace and transportation applications [1,2,3]. Lithium is well known as the lightest metal (0.534 g/cm3). With the addition of 1% Li, the density of aluminum alloy can be reduced by 3% and the stiffness can be increased by 6% [4]. 2195 Al-Li alloy is a kind of age-strengthened alloy with high strength, low density, improved fatigue resistance, high elastic modulus and fracture toughness, even at cryogenic temperatures [5,6]. As a result, it is known as one of the most promising structural alloys for improving the efficiency and safety stability of spacecraft [7].
A reliable welding joint is essential for the wide application of Al-Li alloys. The conventional welding methods for Al-Li alloys contain tungsten inert gas welding (TIG), metal inert gas welding (MIG) and laser welding (LW) [8]. However, some welding drawbacks, such as coarse grain, microcracks and pores, are easily developed during the welding process, as mentioned above, resulting from high welding temperatures. The presence of pores and hot cracking reduces the load-bearing area of the weld and causes stress concentrations, resulting in a significant drop in the mechanical properties of the joints [9]. Several techniques can be used to improve joint properties, such as heat treatment, mechanical deformation processes and arc melting. However, these methods are not very efficient and cannot make high strength welded joints [10]. In recent years, the application of friction stir welding (FSW) has significantly improved the joint properties by converting the coarsened grains into fine grains [11]. FSW, as a solid-phase joining technology, can effectively avoid the defects formed during fusion welding. The removal of the defects improves the joint performance in FSW, which makes it widely used in the connection of Al alloys. The heat generated between a rotating shoulder and a workpiece enables the material to reach a plasticized state below melting temperature. When the FSW tool moves forward along the welding interface, the plasticized material flows from the advancing side to the retreating side and forms a dense weld under the compression of the shoulder [12,13]. FSW has been described as a metalworking process, with flow progressing through sequential pre-heat, initial deformation, extrusion, forging and cool-down metallurgical processing zones [14]. There have also been some new developments in FSW in recent years, such as friction stir spot welding (FSSW), friction stir vibration process (FSVP) and penetrating friction stir welding (PFSW). Amin used FSSW for the joint of Al to Cu sheets with a nanoparticle interlayer. The results showed that the introduction of nanoparticles in FSSW made the grain finer, which increased the strength and hardness values [15]. Behrouz studied the joint of microstructure, mechanical properties and corrosion behaviors by FSVP. It turned out that better grain refinement formed in the stir zone. Compared with conventional friction stir processing, the tensile strength and hardness increased due to microstructure modification and better reinforcing distribution [16]. Hu reported that a 2219 Al alloy joint was fabricated by PFSW. The results revealed both the grain refinement and dislocation strengthening contributed to the increased microhardness in the weld nugget zone of the PFSW joint [17].
FSW process parameters usually include welding speeds, rotation speeds, force, plunge depth, plunge speed, shoulder profile, shoulder size, probe diameter and probe length, which significantly determine the microstructure and mechanical properties of the joints. Welding speeds and rotational speeds will impact the variation of heat input during the welding process, while a different FSW tool has a variety of applications in production. Proper welding parameters can obtain a joint with good performance without defect [18]. Therefore, researchers have studied the influence of welding parameters on the microstructure and mechanical properties of Al-Li alloy FSW joints. Rajakumar [19] found that at a welding speed of 60 mm/min and a rotational speed of 1400 rpm, the tensile strength of the joints could reach 300 MPa. Chen [20] studied the effect of different rotation speeds on the strengthening mechanism in 2195 Al alloys. The results showed that the yield strength was mainly influenced by dislocation strengthening in a shoulder influence zone, which enhanced as the rotational speeds increased. The strengthening mechanism was mainly grain refinement strengthening in a pin influence zone, which would decrease with the rotational speed increasing. Sahu [21] conducted experiments by using different welding parameters. The results indicated that the maximum temperature (about 533 °C) was observed in the joints with a rotational speed of 1600 rpm and a welding speed of 50 mm/min, while the minimum temperature (about 334 °C) was detected in the joints developed with a rotational speed of 800 rpm and a welding speed of 150 mm/min; the variation in temperature was because of the friction and traversing between tool and sheets. Gupta [22] studied the influence of welding speeds on the microstructure in the 7071 Al alloy FSW joints, which indicated that higher welding speed led to higher yield strength; however, better re-passivation corrosion resistance was always obtained at the lower welding speeds. Zhang [23] investigated the effect of rotation speeds and welding speeds on the microstructure, microhardness distribution and tensile properties in FSW joints of Al-Li alloys. The results showed that both strength and elongation of the joints first increased and then decreased with the increase in rotation speeds.
As all of the above, welding speed is one of the most important process parameters in FSW, which has a great influence on the mechanical properties of the joints [24]. However, few studies have focused on the effect of welding speeds on the microstructure and mechanical properties of 2195-T8 Al-Li alloy FSW joints. The influence of welding speeds on microstructures, precipitates and mechanical properties of the joints is still uncertain. Thus, this study was carried out on 2195-T8 alloy by FSW at different welding speeds (100–600 mm/min), with a constant rotational speed (700 rpm).
2. Material and Experimental Methods
The base material (BM) for FSW in the present experiment was 7.5 mm thick 2195-T8 Al-Li alloy, with its normal compositions of 3.9–4.2 Cu, 0.9–1.2 Li, 0.45 Mg, 0.4 Ag, less than 0.15 Zr, less than 0.1 Fe and balanced Al (wt%). The yield strength, tensile strength and elongation along the rolling direction (RD) at room temperature were 565 MPa, 600 MPa and 5.8%, respectively.
The schematic diagram during FSW is shown in Figure 1. The sheets had lengths and widths of 150 mm and 50 mm, respectively. Two sheets were butt-welded by the equipment (FSW-LM-AM16), with a tilt angle of 2.5°. The welding direction (WD) was parallel to the RD of the plates. The FSW tool consisted of a concave shoulder 18 mm in diameter and a threaded conical probe of 4.2–7.6 mm in diameter. The joints were obtained at a rotation speed of 700 rpm and four welding speeds (100, 200, 300 and 600 mm/min).
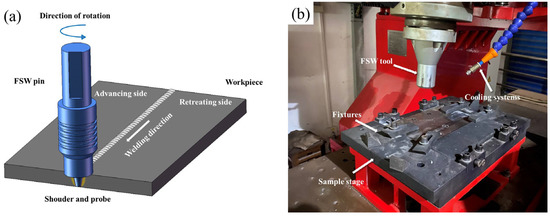
Figure 1.
(a) Schematic illustrations of the FSW process. (b) View of the FSW machine.
After welding, metallographic samples with dimensions of 30 mm × 5 mm × 7.5 mm were obtained along the WD for macroscopic morphology observation (Axiover 40 MAT). The samples were mechanically ground with 400# to 4000# sandpaper to remove surface oxides. Keller’s reagent (3 mL HNO3, 6 mL HCl, 6 mL HF and 150 mL distilled H2O) was used to etch the samples to reveal microstructures. EBSD experiments were used to analyze the grain structure of the welded joints. The samples were obtained at the middle of the joint and were electropolished in a polishing solution (perchloric acid:alcohol = 1:9) for a further 130 s at a limited voltage of constant 20 V and a limited current of about 0.2 A. Etched specimens were examined under a TESCAN MIR3 SEM, while the device equipped with EBSD system was used for EBSD image acquisition. The operating parameters of EBSD were a 70° tilt angle, a high voltage of 20 kV and a step size of 0.65 μm. TEM (TalosF200S) was used to observe the distribution of precipitated phases in various regions of the welded joints. The samples were mechanically thinned to small discs of about 50 μm with a diameter of 3 mm. Electrolytic double spraying was made in MTP-1A with a mixed solution (nitric acid:methanol = 3:7) and controlled at a temperature between −25 °C and −35 °C, with a voltage and current of 12 V and 90 mA, respectively.
The dimensional parameters of the room temperature tensile test samples are shown in Figure 2 (loaded normal to the WD across the weld nugget). Tensile experiments were conducted on the CMT-5105 electronic universal tensile machine at a crosshead speed of 1 mm/min. To ensure the accuracy of the experimental results, three parallel specimens were set up for each group of experiments. The microhardness test was carried out on a YQ81C Vickers microhardness tester, with a load of 500 g for 10 s. The samples were of the same size as the metallographic samples; a test point was taken every 0.5 mm in the vertical and lateral directions of the sample cross-section to make a hardness cloud.
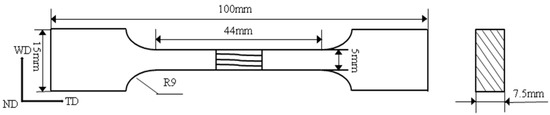
Figure 2.
Size of tensile specimens.
3. Results and Discussion
3.1. The Surface Morphology of the Joint
Figure 3 shows the surface morphology of the joints at the welding speeds of 100 mm/min, 200 mm/min, 300 mm/min and 600 mm/min. The flash defect, which existed on both sides of the weld, gradually disappeared as welding speeds increased. A small amount of spilled flash formed debris under the cutting action of the shoulder, as shown in Figure 3d. The higher volumes of flash would reduce utilization of materials and add additional post-processing. The center of the weld consisted of a corrugated arc pattern, which increased in spacing as the welding speed increased. In addition, no common surface defects were observed in the welds such as cracks, grooves or lack of filler on the surface.
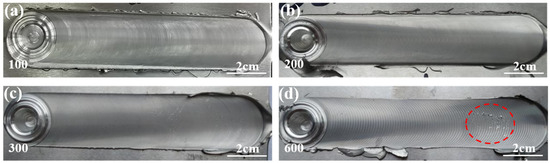
Figure 3.
Surface morphologies of welds at different welding speeds: (a) 100 mm/min, (b) 200 mm/min, (c) 300 mm/min and (d) 600 mm/min.
During the FSW process, the plasticized material spilled out along the shoulder under the pressure of the FSW tool, forming the flash defect during cooling [25]. The faster welding speed meant a shorter contact time between the shoulder and the sheets, which resulted in less material being plasticized by the thermal cycle. Thus, less spillage of flash during the downward pressure movement of the FSW tool was expected. The arc-shaped patterns were related to the stress state and flow behavior [26]. In the welding, the matrix was softened and reached the plasticized state due to the impression of the FSW tool. Plasticized material separation occurred from the shoulder, while the bond was not enough to keep them flowing together; the continuously plasticized material accumulated at the rear to form an arc-shaped texture. When the welding speed was accelerated, the lower heat input made the material hardly flow; the material piled up to the rear at a slower rate and the arc-shaped patterns became rougher.
The cross-section macroscopic morphologies of the welded joints at various welding speeds are shown in Figure 4. The middle region of the weld was the nugget zone (NZ), outwardly in the order of the advancing side-thermo mechanically affected zone (AS-TMAZ), retreating side-affected zone (RS-TMAZ), heat-affected zone (HAZ) and BM. The NZ was all trumpet-shaped, with a broader area of shoulder influence zone at the top of the NZ and a narrower area of pin influence zone at the root part of the NZ. The laminar accumulation of tissue in the pin influence zone was termed as the onion ring. In addition to the joints obtained at 100 mm/min, some undisturbed grains appeared at the root of the NZ. The spacing between onion rings, similar to the arc-shaped patterns, increased with the increase in welding speeds. As the welding speed increased, the size of the NZ gradually converged to the shape of the FSW tool; when the welding speeds reached 600 mm/min, the shape of the pin influence zone was extremely different compared with the other parameters (Figure 4c).
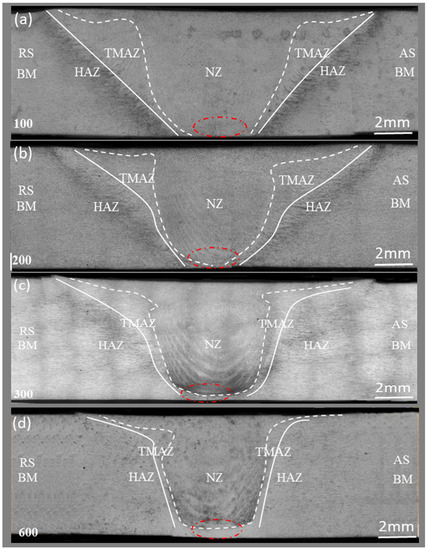
Figure 4.
Cross-sectional morphologies of joints at different welding speeds: (a) 100 mm/min, (b) 200 mm/min, (c) 300 mm/min, (d) 600 mm/min.
During FSW, heat generation mainly depended on the friction action between the shaft shoulder and the sheets [27]. The softening and the flow of the plasticized materials were affected by the diffusion of heat in the thickness direction. Hence, the weld was trumpet-shaped, with a large opening in the cross-section. At the same time, the welding was an extrusion process in which the plastic material flowed under the mechanical pressure provided by the FSW tool and was extruded ahead of it [28]. This material was deposited behind the FSW tool to form an onion ring. The increase in welding speeds would reduce the interaction time between the FSW tool and the sheets. This reduction would result in less frictional heat; a different shape of the joint was formed at the cross-section [21].
Figure 5 shows a partial enlargement of the red circle area at the bottom of Figure 4. No defect was found at the bottom of the joints at the welding speed of 100 mm/min and the plates formed an effective connection between them. But, when the welding speed reached 200 mm/min, it was found that the deformation microstructure was retained as an elongated grain without undergoing dynamic recrystallization and a kissing bond appeared at the root of the joints. The kissing bond mostly consisted of micropores and microcracks; at the same time, the direction of its extension became more and more perpendicular to the horizontal direction. Table 1 illustrates the length of the kissing bond in the joints at different welding speeds. With the welding speed increasing from 100 mm/min to 600 mm/min, the length of the kissing bond grew up to 0.72 mm. Obviously, the length of the kissing bond was proportional to the welding speeds; especially, the joints with the welding speed of 600 mm/min, the kissing bond defect extended into the center of the NZ. The kissing bond was caused by insufficient heat input during welding, resulting in the joints forming a tight contact at the bottom with an ineffective connection [29]. When the joints were subjected to the transverse tensile stress along the weld, it was easy to cause stress concentrations and fractures in the weak regions, which would significantly reduce the mechanical properties of the joints [30].
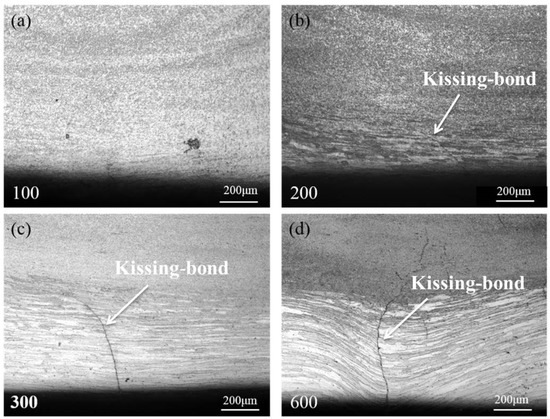
Figure 5.
Magnification of the red circle in Figure 4: (a) 100 mm/min, (b) 200 mm/min, (c) 300 mm/min and (d) 600 mm/min.

Table 1.
The length of the kissing bond defect at the bottom of the joint.
3.2. Microstructure Evolution
Figure 6 shows EBSD maps of the characteristic regions of the joints at different welding speeds. Different colors represent variations in crystallographic orientation, referencing the IPF coloring scheme. The black lines represent HABs with grain boundary misorientation angles over 15°, while the white lines represent low angle boundaries (LABs) with misorientation in the range of 2–15°. The microstructure of BM, HAZ, TMAZ and NZ are observed in Figure 6a–d, with the welding speed of 100 mm/min.
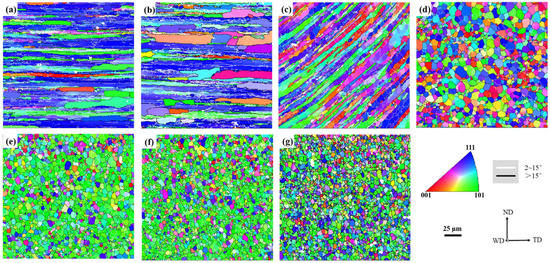
Figure 6.
EBSD maps by different welding speed (a–d) BM, HAZ, TMAZ and NZ at 100 mm/min; (e–g) NZ at 200 mm/min, 300 mm/min and 600 mm/min.
The matrix used in this study was 2195-T8 Al alloy before welding. Hence, the microstructure remained thin and elongated gains were developed with {111} crystal orientation after rolling (Figure 6a). HAZ was relatively far from the NZ without suffering from plastic deformation during the FSW process. Thus, there was no significant change in grain shape in this region compared with the BM and only coarsened elongated gains were noticed under the influence of heat input, as shown in Figure 6b. Figure 6c shows the microstructure of TMAZ, where the grains were still elongated, with an angle of approximately 45°. The material in TMAZ was softened by the thermal effect and then severely bent due to the strong shearing action of the FSW tool. The peak temperature in TMAZ was relatively lower than that in NZ. The grains in the region underwent drastic plastic deformation, which caused them to suffer a reversion process without coarsening or recrystallization. Fine equiaxed grains appeared in the NZ without dominant crystallographic orientation, replacing elongated grains in the BM (Figure 6d). This was because the friction stirring between the shoulders and sheets led to dynamic recrystallization under the influence of thermal cycling and plastic deformation during the FSW process [31]. FSW is a complex process in which different areas of the joint undergo variation heart input and strain as the effect of the FSW tool; thus, the microstructure is composed of different sized and shaped grains without uniform distributions and densities, which will have an impact on the joint properties.
The EBSD maps in the NZ are shown at different welding speeds of 100 mm/min, 200 mm/min, 300 mm/min and 600 mm/min (Figure 6d–g). The microstructure of the NZ was basically made up of equiaxed grains in all joints. Except for the joint at 100 mm/min, the grains of other joints were observed in dominant {101} and {111} orientation. The grain size in the NZ of the joints at different welding speeds is shown in Figure 7. It can be seen that the average grain diameter (AGD) of the joint at welding speeds of 100, 200, 300 and 600 mm/min was 5.02 μm, 4.61 μm, 4.52 μm and 3.75 μm, respectively. Figure 6d shows that the rate of grain size above 10μm was more than that in the joints at high welding speeds. The variation in grain size was inversely proportional to the increase in welding speed, which was the same as the size of NZ in Figure 6d–g.
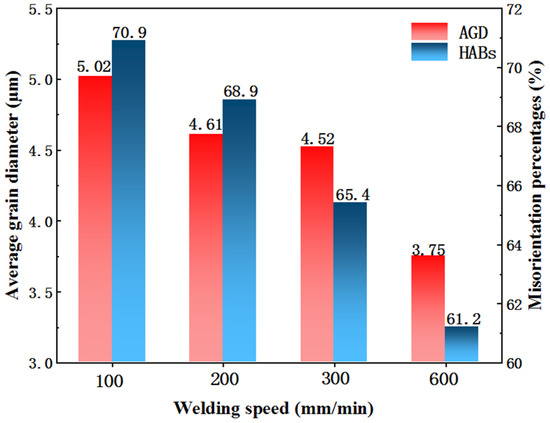
Figure 7.
Average grain diameter and misorientation percentages of HABs in NZ with different welding speed.
The dynamic recrystallization process of the NZ was dominated by thermal cycling and plastic deformation, which can be presented by Equation (1) [15].
where is the average grain size and , , , are constant values. and represent plastic strain and strain rate, respectively. D0 is the original grain size and Q is the activation energy. T is the temperature values. It is clear that the average grain size was related to the temperature in the sheet by this equation. The low welding speed joint prolonged the friction time between them with a fixed rotation speed, which led to the higher peak temperature in FSW. So, the bigger grain size was observed in the joint that was fabricated at the low welding speed (Figure 6d). It has been reported that, when the temperature of Al alloy reaches 40% of its melting point, recrystallization behavior occurs in the deformation zone, making the grain refinement; when it reaches 50%, the grain has enough time to grow [32]. When the four joints reached the conditions for dynamic recrystallization, elongated grains were transformed into equiaxed grains by the grain refinement mechanism in the NZ. During the entire deformation process, the elongated grain underwent recovery and recrystallization; the main difference was that grain growth would occur at the low welding speed joint.
The distribution of the grain boundary in the NZ is illustrated in Figure 7. The fraction of HABs at different welding speeds accounted for up to 70.9%, 68.9%, 65.9% and 61.2%, respectively. It was also found that the percentage of HABs decreased when welding speeds increased. The behavior of grain boundaries is closely related to the recrystallization mechanism. In general, there are three mechanisms for dynamic recrystallization: (1) lattice rotation through the accumulation of dislocation slip; (2) lattice rotation through the accumulation of grain boundary migration; (3) sub-grain growth [33]. The dynamic recrystallization behavior during the FSW process is dominated by the accumulation of grain boundary and dislocation slip that causes rotation of the sub-grain, with the increase of the sub-grain angle, transforming LABs into HABs; finally, fine-equiaxed grains are generated [34]. Recrystallization is a thermal motion process associated with peak temperature and strain rate. The low welding speed joint with a higher peak temperature promotes the degree of dynamic recovery and dynamic recrystallization, making it easier to develop sub-grain. Moreover, the newly formed grains are related to the large angle rotation and severe deformation of LABs [35]; this was consistent with the formation of equiaxed grains, as shown in Figure 6d–g. Hence, the ratio of HABs of a low welding joint was relatively higher, as shown in Figure 7.
Figure 8 shows the pole figures of the NZ. The maximum orientation density values in different joints were 4.12, 6.66, 5.84 and 6.61, respectively. No obvious texture was observed in the joint when welding speeds were 100 mm/min and 300 mm/min. However, Figure 8b,d shows that the texture was dominated by . The stress state of the grains determined the final orientation distribution during the welding process. The material flow of the NZ was modified by the extrusion process in FSW. Therefore, there was no significant change in the maximum orientation value. Montheillet [36] showed that different stress states and temperatures would effect the formation of the texture; the texture appeared on the FCC metals with small strains and a low temperature, while at a middle strain and low temperature, the dominant texture component was . In addition, the type and intensity of the texture was related to the composition, cooling rate and forming technology [37]. It was obvious that a high welding speed joint with a low peak temperature was formed with a texture.
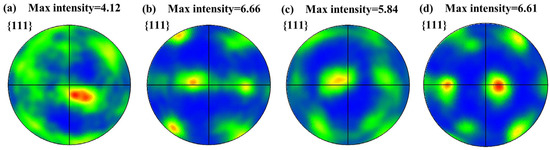
Figure 8.
Pole figures in NZ by different welding speeds: (a) 100 mm/min, (b) 200 mm/min, (c) 300 mm/min and (d) 600 mm/min.
It has to be mentioned that the textural peaks in the pole figures were partially deviated from their ideal position, which may have been related to the FSW tool with 2.5° and threads during the FSW process [17]. This may have been one of the reasons for no obvious orientation density in the low speed joints; the strength of the texture was also too weak to be easily detected.
Figure 9 and Figure 10 show TEM bright field images and selected area electron diffraction (SAED) of different characteristic regions of the joint with welding speeds of 100 and 600 mm/min. A high volume of needle precipitates was observed in the BM (Figure 9a). The diffraction spots lying along the {110} of the Al diffraction image in Figure 9d were from T1 precipitates by SAED, which proved the existence of the T1 precipitates. The angle between the two precipitates was about 109.4°. The bright field images showed no dissolving of the T1 precipitates in the HAZ, while δ′/β′ precipitates with a gray spherical shape were detected in this region (Figure 9b and Figure 10b). Thus, except for T1 precipitate diffraction spots, δ′/β′ precipitate diffraction spots were also observed by SAED in the HAZ. Figure 9c and Figure 10b show the bright field images of the NZ, in which T1 precipitates were completely dissolved into the matrix. The microstructure of the NZ consisted of dislocations and δ′/β′ precipitates (Figure 9f and Figure 10d). However, only the diffraction spots of the Al matrix were detected, which was possibly due to the diffraction intensity of these precipitates being too weak to be detected.
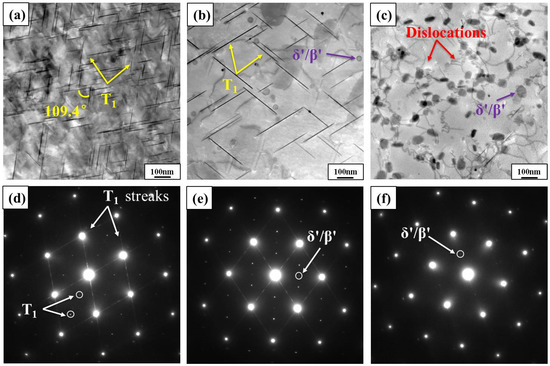
Figure 9.
TEM images in the joint at the welding speed of 100 mm/min: (a–c) bright field micrograph of the BM, HAZ and NZ and (d–f) SAED patterns of {110}Al zone axes in (a–c).
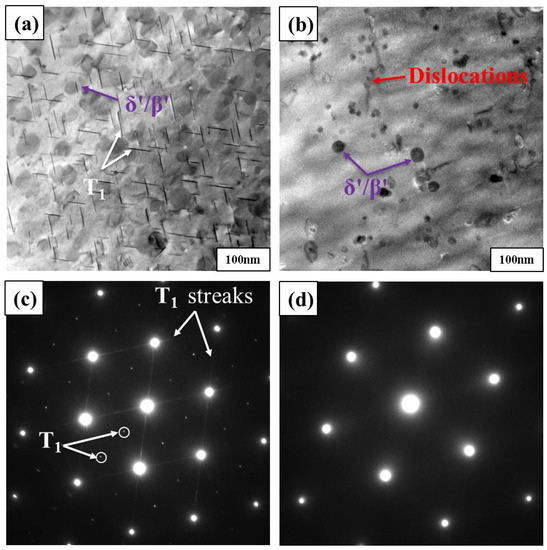
Figure 10.
TEM images in the joint at the welding speed of 600 mm/min: (a,b) bright field micrograph of the HAZ and NZ and (c,d) SAED patterns of {110}Al zone axes in (a,b).
The precipitate distribution was related to the degree of plastic deformation and peak temperature during the FSW process. The temperature of the NZ could reach 420–500 °C, while the T1 precipitates dissolved at about 300 °C [9]. This explained why no T1 precipitates were found in the NZ. The appearance of δ′/β′ precipitates was related to the dissolve of T1 precipitates, which would result in a higher diffusion rate of relevant elements at the grain boundary. The accumulation of more elements would promote the precipitation of δ′/β′ precipitates [38]. In order to understand the change of precipitates with welding speeds, the density and size of T1 precipitates are listed in Table 2. T1 precipitates were the primary strengthening precipitates in 2195-T8 Al-Li alloys. Hence, BM showed the maximum density value. The region of T1 precipitates was coarsened under the influence of heat input in the HAZ. The longer and thicker T1 precipitates were detected in the joints obtained at the higher welding speed, as shown in Table 2.
Table 2.
T1 precipitates distribution in the HAZ and BM at different welding speeds.
3.3. Microhardness Distribution
Figure 11 shows the hardness distribution along the ND-TD plane of the joints. The maximum hardness was located in the BM, where the average hardness exceeded 175 HV. A significant decrease was detected in the HAZ. The lowest hardness value was observed in the transition zone between the HAZ and the TMAZ, which was known as the softened region of the joints in FSW. However, it is worth noting that an obvious increase in the hardness value appeared in the NZ compared with the transition zone. As the welding speed increased, the width of hardness value variation was observed from 30 mm to 20 mm at the top of the joints, as shown in Figure 11a–d. The microhardness of the joints showed a tendency of symmetrical distribution in general, which was consistent with the cross-sectional morphology shown in Figure 4. The changes in hardness were related to the microstructure and grain size of the different areas of the joints. 2195-T8 Al-Li alloy was precipitation phase-strengthened alloys. The main strengthening precipitates were the T1 precipitates, which would determine the highest hardness values appearing in the BM [38]. The reduction in hardness values in the HAZ was associated with the partial dissolution and coarsening of T1 precipitates, as shown in Figure 9b and Figure 10a. The reason for the slight increase in the hardness value in the NZ was mainly the appearance of the dislocations and the formation of the equiaxed grains [39]. The lower welding speed meant that the FSW tools stayed in the sheet for a longer period of time. With an increase in pass numbers, the volume of material flow under the constant shoulder increased, resulting in a higher temperature distribution [15]. Meanwhile, the degree of influence of the shoulder and the pin would also contribute to changes in hardness values along the thickness direction. Therefore, the low welding speed joint would result in an enlarged softening zone under the influences of FSW tools.
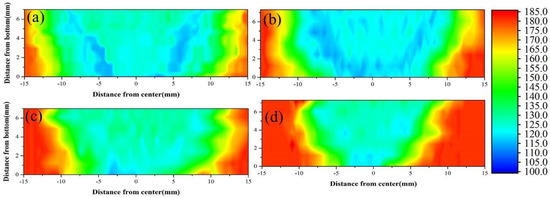
Figure 11.
Cross−sectional microhardness distribution of the joints by different welding speeds: (a) 100 mm/min, (b) 200 mm/min, (c) 300 mm/min and (d) 600 mm/min.
3.4. Tensile Properties and Fracture Morphology
The change in tensile properties with welding speeds is shown in Figure 12. The ultimate tensile strength and elongation was obtained from the stress–strain curve shown in Figure 12a. The welding speeds ranged from 100 mm/min to 600 mm/min, the ultimate tensile strength and elongation at fracture was 401 MPa, 379 MPa, 360 MPa and 342 MPa and 9.6%, 4.1%, 3.6%, 2.9%, respectively. This was approximately 66.8%, 63.7%, 60.0% and 57.0%, respectively, equivalent to that of the BM (600 MPa). The ultimate tensile strength and elongation values were inversely proportional to the welding speeds. It is worth noting that the joints for welding speeds from 100 mm/min to 200 mm/min, ultimate tensile strength and elongation of the joints were decreased by 5.5% and 57.3%.
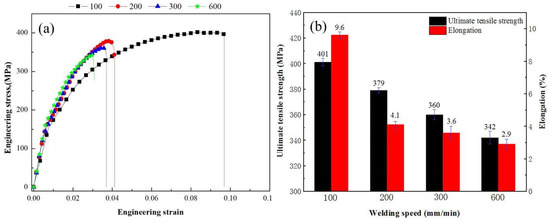
Figure 12.
Tensile properties of the joints by different welding speed: (a) engineering stress–strain curve and (b) ultimate tensile strength and elongation at fracture.
Figure 13 shows macrographs of the fracture surfaces of the joints. A large flat area was observed at the fracture surface in the middle of the joints when the welding speeds were 100 mm/min and 200 mm/min; no obvious defects were detected in the joints. With the increase in welding speed, macroscopic cracks appeared in the joints with a rough surface; especially, the longest cracks inclined about 45° to the bottom of the joint, as shown in Figure 13d. The SEM of the fracture surfaces is illuminated in Figure 14. Dimples and particles with varying shapes and sizes were observed in the fractures of all joints, indicating that the joints underwent plastic deformation prior to fracture. In addition, there were numerous cleavage planes and tear ridges in the fracture surfaces of all joints. The tensile fracture morphology was dominated by quasi-cleavage fractures.
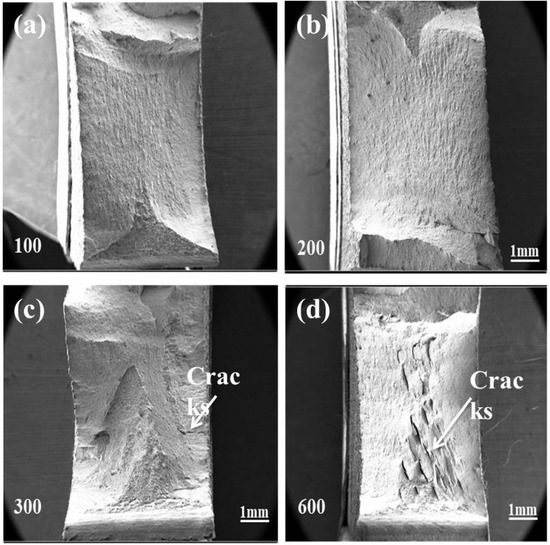
Figure 13.
Macrographs of fracture surfaces of the joints by different welding speeds: (a) 100 mm/min, (b) 200 mm/min, (c) 300 mm/min and (d) 600 mm/min.
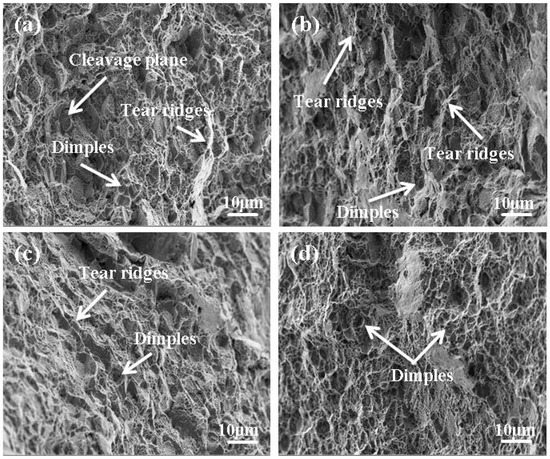
Figure 14.
Micrographs of fracture surfaces of the joints by different welding speeds: (a) 100 mm/min, (b) 200 mm/min, (c) 300 mm/min and (d) 600 mm/min.
The ratio of HAB was related to ductility due to hindering the movement of dislocations [40]. Although the fraction of HABs was inversely proportional to the welding speeds, no obvious changes were found, as shown in Figure 7, which was consistent with the ductility obtained in the stress–strain curve shown in Figure 12a. It has been reported that 83% of the heat input comes from the friction between the shoulder and the workpiece and the rest of energy comes from the friction between the workpiece and the pin in the FSW process [20]. Material softening and flow did not adequately occur in the lower part of the high welding speed joints due to insufficient heat. This process promoted the generation of macroscopic cracks when the joint was subjected to transverse tensile stresses. Dimples and tear ridges were observed in the micromorphology of the fracture, as shown in Figure 14, indicating the joint suffered plastic deformation. But it is worth noting that the kissing bond first appeared in the joint with the welding speed of 200 mm/min; the length of the kissing bond increased as the welding speeds increased, as shown in Figure 5. Meanwhile, the ultimate tensile strength and elongation began to degrade in the same welding parameter, as shown in Figure 12. On the one hand, the appearance of the kissing bond was obviously the main reason for the degradation of the ultimate tensile strength and elongation. The cross-section was reduced by the existence of the kissing bond, where there was a high tendency for stress concentrations to form a source of fracture [17]. On the other hand, the microcracks formed in the middle of the joint due to the plastic materials hardly flowing [41]. Hence, the plastic deformation deteriorated as the welding speeds increased during the tensile test.
4. Conclusions
In this paper, 2195-T8 Al-Li FSW joints were obtained using different welding speeds (100 mm/min, 200 mm/min, 300 mm/min and 600 mm/min), with a constant rotational speed. The correlation of microstructures and mechanical properties of the joints were investigated. The following conclusions were drawn:
- (1)
- The flash defect was observed in all joints. The kissing bond was detected in all joints, except for the joint with a welding speed of 100 mm/min. With the increase in welding speeds, the length of the kissing bond increased and the morphology of the cross-section gradually converged to the shape of the FSW tools.
- (2)
- TMAZ, HAZ and BM showed different shapes and sizes of grains and many fine and equiaxed grains appeared in the NZ due to the dynamic recrystallization behavior. Increasing the welding speed reduced the average grain diameter and the ratio of HABs in the NZ.
- (3)
- Dislocation was observed with T1 precipitates disappearing in the NZ. The reduction in welding speed with higher peak temperatures enlarged the degree of T1 precipitate coarsening.
- (4)
- The maximum hardness was observed in the BM because of the T1 precipitates, while the minimum hardness occurred in the transition region between the TMAZ and the HAZ. The ultimate tensile strength and elongation values were inversely proportional to the welding speeds; especially, the welding speeds from 100 mm/min to 200 mm/min, the joint of ultimate tensile strength and the elongation values decreased by 5.5% and 57.3%, respectively, due to the appearance of the kissing bond.
Author Contributions
Methodology, J.C., R.C. and S.S.; Software, H.L.; Formal analysis, J.C.; Resources, H.L., Y.T. and Z.Z.; Data curation, J.C. and R.C.; Writing—original draft, J.C.; Writing—review & editing, Y.T. and S.L.; Project administration, Z.Z. All authors have read and agreed to the published version of the manuscript.
Funding
This research received no external funding.
Data Availability Statement
The raw processed data required to reproduce these findings cannot be shared at this time as the data also forms part of an ongoing study.
Conflicts of Interest
The authors declare no conflict of interest.
References
- Hajjioui, E.A.; Bouchaâla, K.; Faqir, M.; Essadiqi, E. A Review of Manufacturing Processes, Mechanical Properties and Precipitations for Aluminum Lithium Alloys Used in Aeronautic Applications. Heliyon 2023, 9, e12565. [Google Scholar] [CrossRef]
- Li, Y.; Li, H.; Katgerman, L.; Du, Q.; Zhang, J.; Zhuang, L. Recent Advances in Hot Tearing during Casting of Aluminium Alloys. Prog. Mater. Sci. 2021, 117, 100741. [Google Scholar] [CrossRef]
- Wang, Z.; Li, M.; Han, Q.; Yun, X.; Zhou, K.; Gardner, L.; Mazzolani, F.M. Structural Fire Behaviour of Aluminium Alloy Structures: Review and Outlook. Eng. Struct. 2022, 268, 114746. [Google Scholar] [CrossRef]
- Abd El-Aty, A.; Xu, Y.; Guo, X.; Zhang, S.; Ma, Y.; Chen, D. Strengthening Mechanisms, Deformation Behavior, and Anisotropic Mechanical Properties of Al-Li Alloys: A Review. J. Adv. Res. 2018, 10, 49–67. [Google Scholar] [CrossRef]
- Zhao, X.; Liu, W.; Xiao, D.; Ma, Y.; Huang, L.; Tang, Y. A Critical Review: Crystal Structure, Evolution and Interaction Mechanism with Dislocations of Nano Precipitates in Al-Li Alloys. Mater. Des. 2022, 217, 110629. [Google Scholar] [CrossRef]
- Xiao, R.; Zhang, X. Problems and Issues in Laser Beam Welding of Aluminum–Lithium Alloys. J. Manuf. Process. 2014, 16, 166–175. [Google Scholar] [CrossRef]
- Yin, Q.; Chen, G.; Teng, X.; Huang, Y. Interaction of Dislocation/Compensated Precipitates and Mechanical Property Optimization of Electron Beam Welded Aluminum-Lithium Alloy with Scandium Addition. Mater. Sci. Eng. A 2022, 851, 143662. [Google Scholar] [CrossRef]
- Xie, Y.; Meng, X.; Wang, F.; Jiang, Y.; Ma, X.; Wan, L.; Huang, Y. Insight on Corrosion Behavior of Friction Stir Welded Aa2219/Aa2195 Joints in Astronautical Engineering. Corros. Sci. 2021, 192, 109800. [Google Scholar] [CrossRef]
- Shi, L.; Chen, J.; Wu, C.S.; Fu, L. Analysis of Heat and Mass Transfer in Ultrasonic Vibration-Enhanced Friction Stir Welding of 2195 Al-Li Alloy. Sci. Technol. Weld. Join. 2021, 26, 363–370. [Google Scholar] [CrossRef]
- Mehdi, H.; Mishra, R.S. Study of the Influence of Friction Stir Processing on Tungsten Inert Gas Welding of Different Aluminum Alloy. SN Appl. Sci. 2019, 1, 712. [Google Scholar] [CrossRef]
- Abbasi, M.; Abdollahzadeh, A.; Bagheri, B.; Ostovari Moghaddam, A.; Sharifi, F.; Dadaei, M. Study on the Effect of the Welding Environment on the Dynamic Recrystallization Phenomenon and Residual Stresses during the Friction Stir Welding Process of Aluminum Alloy. Proc. Inst. Mech. Eng. Pt. L-J. Mater.-Des. Appl. 2021, 235, 1809–1826. [Google Scholar] [CrossRef]
- Gibson, B.T.; Lammlein, D.H.; Prater, T.J.; Longhurst, W.R.; Cox, C.D.; Ballun, M.C.; Dharmaraj, K.J.; Cook, G.E.; Strauss, A.M. Friction Stir Welding: Process, Automation, and Control. J. Manuf. Process. 2014, 16, 56–73. [Google Scholar] [CrossRef]
- Meng, X.; Huang, Y.; Cao, J.; Shen, J.; Dos Santos, J.F. Recent Progress on Control Strategies for Inherent Issues in Friction Stir Welding. Prog. Mater. Sci. 2021, 115, 100706. [Google Scholar] [CrossRef]
- El-Sayed, M.M.; Shash, A.Y.; Abd-Rabou, M.; ElSherbiny, M.G. Welding and Processing of Metallic Materials by Using Friction Stir Technique: A Review. J. Adv. Join. Process. 2021, 3, 100059. [Google Scholar] [CrossRef]
- Abdollahzadeh, A.; Bagheri, B.; Vaneghi, A.H.; Shamsipur, A.H.; Mirsalehi, S.E. Advances in Simulation and Experimental Study on Intermetallic Formation and Thermomechanical Evolution of Al–Cu Composite with Zn Interlayer: Effect of Spot Pass and Shoulder Diameter during the Pinless Friction Stir Spot Welding Process. Proc. Inst. Mech. Eng. Part L-J. Mater. Des. Appl. 2022, 237, 1475–1494. [Google Scholar] [CrossRef]
- Bagheri, B.; Abdollahzadeh, A.; Sharifi, F.; Abbasi, M. Recent Development in Friction Stir Processing of Aluminum Alloys: Microstructure Evolution, Mechanical Properties, Wear and Corrosion Behaviors. Proc. Inst. Mech. Eng. Part E-J. Process Mech. Eng. 2023, 38, 1416–1425. [Google Scholar] [CrossRef]
- Hu, Y.; Liu, H.; Li, S.; Du, S.; Sekulic, D.P. Improving Mechanical Properties of a Joint through Tilt Probe Penetrating Friction Stir Welding. Mater. Sci. Eng. A. 2018, 731, 107–118. [Google Scholar] [CrossRef]
- Padhy, G.K.; Wu, C.S.; Gao, S. Friction Stir Based Welding and Processing Technologies—Processes, Parameters, Microstructures and Applications: A Review. J. Mater. Sci. Technol. 2018, 34, 1–38. [Google Scholar] [CrossRef]
- Rajakumar, S.; Muralidharan, C.; Balasubramanian, V. Influence of Friction Stir Welding Process and Tool Parameters on Strength Properties of Aa7075-T-6 Aluminium Alloy Joints. Mater. Des. 2011, 32, 535–549. [Google Scholar] [CrossRef]
- Chen, P.; Zou, S.; Chen, J.; Qin, S.; Yang, Q.; Zhang, Z.; Jia, Z.; Zhang, L.; Jiang, T.; Liu, Q. Effect of Rotation Speed on Microstructure Evolution and Mechanical Properties of Nugget Zone in 2195-T8 Al-Li Alloy Friction Stir Welding Joints. Mater. Charact. 2021, 176, 111079. [Google Scholar] [CrossRef]
- Sahu, S.; Mypati, O.; Pal, S.K.; Shome, M.; Srirangam, P. Effect of Weld Parameters on Joint Quality in Friction Stir Welding of Mg Alloy to Dp Steel Dissimilar Materials. Cirp J. Manuf. Sci. Technol. 2021, 35, 502–516. [Google Scholar] [CrossRef]
- Gupta, S.; Haridas, R.S.; Agrawal, P.; Mishra, R.S.; Doherty, K.J. Influence of Welding Parameters on Mechanical, Microstructure, and Corrosion Behavior of Friction Stir Welded Al 7017 Alloy. Mater. Sci. Eng. A 2022, 846, 143303. [Google Scholar] [CrossRef]
- Zhang, J.; Feng, X.S.; Gao, J.S.; Huang, H.; Ma, Z.Q.; Guo, L.J. Effects of Welding Parameters and Post-Heat Treatment on Mechanical Properties of Friction Stir Welded Aa2195-T8 Al-Li Alloy. J. Mater. Sci. Technol. 2018, 34, 219–227. [Google Scholar] [CrossRef]
- Zamrudi, F.H.; Setiawan, A.R. Effect of Friction Stir Welding Parameters on Corrosion Behaviour of Aluminium Alloys: An Overview. Corros. Eng. Sci. Technol. 2022, 57, 696–707. [Google Scholar] [CrossRef]
- Liu, H.J.; Zhang, H.J. Study of Hybrid Welding Repair Process of Friction Stir Welding Grove Defect. Sci. Technol. Weld. Join. 2012, 17, 169–173. [Google Scholar] [CrossRef]
- Mehta, K.; Astarita, A.; Carlone, P.; Della Gatta, R.; Vyas, H.; Vilaça, P.; Tucci, F. Investigation of Exit-Hole Repairing on Dissimilar Aluminum-Copper Friction Stir Welded Joints. J. Mater. Res. Technol. 2021, 13, 2180–2193. [Google Scholar] [CrossRef]
- Tao, Y.; Zhang, Z.; Xue, P.; Ni, D.R.; Xiao, B.L.; Ma, Z.Y. Effect of Post Weld Artificial Aging and Water Cooling on Microstructure and Mechanical Properties of Friction Stir Welded 2198-T8 Al-Li Joints. J. Mater. Sci. Technol. 2022, 123, 92–112. [Google Scholar] [CrossRef]
- Chu, Q.; Yang, X.W.; Li, W.Y.; Li, Y.B. Microstructure and Mechanical Behaviour of Pinless Friction Stir Spot Welded Aa2198 Joints. Sci. Technol. Weld. Join. 2016, 21, 164–170. [Google Scholar] [CrossRef]
- Zou, Y.; Li, W.; Yang, X.; Su, Y.; Chu, Q.; Shen, Z. Microstructure and Mechanical Properties of Refill Friction Stir Spot Welded Joints: Effects of Tool Size and Welding Parameters. J. Mater. Res. Technol. 2022, 21, 5066–5080. [Google Scholar] [CrossRef]
- Li, B.; Shen, Y.; Hu, W. The Study on Defects in Aluminum 2219-T6 Thick Butt Friction Stir Welds with the Application of Multiple Non-Destructive Testing Methods. Mater. Des. 2011, 32, 2073–2084. [Google Scholar] [CrossRef]
- Gao, C.; Zhu, Z.; Han, J.; Li, H. Correlation of Microstructure and Mechanical Properties in Friction Stir Welded 2198-T8 Al–Li Alloy. Mater. Sci. Eng. A 2015, 639, 489–499. [Google Scholar] [CrossRef]
- Prangnell, P.B.; Heason, C.P. Grain Structure Formation during Friction Stir Welding Observed by the ‘Stop Action Technique’. Acta Mater. 2005, 53, 3179–3192. [Google Scholar] [CrossRef]
- Huang, K.; Loge, R.E. A Review of Dynamic Recrystallization Phenomena in Metallic Materials. Mater. Des. 2016, 111, 548–574. [Google Scholar] [CrossRef]
- Xu, W.F.; Luo, Y.X.; Fu, M.W. Microstructure Evolution in the Conventional Single Side and Bobbin Tool Friction Stir Welding of Thick Rolled 7085-T7452 Aluminum Alloy. Mater. Charact. 2018, 138, 48–55. [Google Scholar] [CrossRef]
- Abdollahzadeh, A.; Bagheri, B.; Shamsipur, A. Development of Al/Cu/Sic Bimetallic Nano-Composite by Friction Stir Spot Welding. Mater. Manuf. Process. 2023, 38, 1416–1425. [Google Scholar] [CrossRef]
- Montheillet, F.; Cohen, M.; Jonas, J.J. Axial Stresses and Texture Development during the Torsion Testing of Al, Cu and A-Fe. Acta Metall. 1984, 32, 2077–2089. [Google Scholar] [CrossRef]
- Hirsch, J.; Al-Samman, T. Superior Light Metals by Texture Engineering: Optimized Aluminum and Magnesium Alloys for Automotive Applications. Acta Mater. 2013, 61, 818–843. [Google Scholar] [CrossRef]
- Qin, H.; Zhang, H.; Wu, H. The Evolution of Precipitation and Microstructure in Friction Stir Welded 2195-T8 Al–Li Alloy. Mater. Sci. Eng. A 2015, 626, 322–329. [Google Scholar] [CrossRef]
- Sun, H.; Xing, S.; Zhao, B.; Jiang, X.; Xu, X. Study on the Influence of Solution Temperature on the Synergistic Effect of Precipitation Strengthening and Fine Grain Strengthening of Aa6061. Mater. Today Commun. 2022, 33, 104312. [Google Scholar] [CrossRef]
- Wu, D.; Li, W.; Liu, X.; Gao, Y.; Wen, Q.; Vairis, A. Effect of Material Configuration and Welding Parameter on Weld Formability and Mechanical Properties of Bobbin Tool Friction Stir Welded Al-Cu and Al-Mg Aluminum Alloys. Mater. Charact. 2021, 182, 111518. [Google Scholar] [CrossRef]
- Zhao, Y.; Zhou, L.; Wang, Q.; Yan, K.; Zou, J. Defects and Tensile Properties of 6013 Aluminum Alloy T-Joints by Friction Stir Welding. Mater. Des. 2014, 57, 146–155. [Google Scholar] [CrossRef]
Disclaimer/Publisher’s Note: The statements, opinions and data contained in all publications are solely those of the individual author(s) and contributor(s) and not of MDPI and/or the editor(s). MDPI and/or the editor(s) disclaim responsibility for any injury to people or property resulting from any ideas, methods, instructions or products referred to in the content. |
© 2023 by the authors. Licensee MDPI, Basel, Switzerland. This article is an open access article distributed under the terms and conditions of the Creative Commons Attribution (CC BY) license (https://creativecommons.org/licenses/by/4.0/).