Article

The Influence of the Tantalum Content on the Main Properties of the TixTa9Nb8Zr2Ag Alloy

1
Faculty of Industrial Engineering and Robotics, Politehnica University of Bucharest, Splaiul Independentei 313, 060042 Bucharest, Romania
2
Institute of Physical Chemistry “Ilie Murgulescu”, Splaiul Independentei 202, 060021 Bucharest, Romania
*
Authors to whom correspondence should be addressed.
Metals 2023, 13(7), 1294; https://doi.org/10.3390/met13071294
Submission received: 24 May 2023 / Revised: 7 July 2023 / Accepted: 13 July 2023 / Published: 19 July 2023
(This article belongs to the Topic Alloys and Composites Corrosion and Mechanical Properties)

Abstract

:
This study presents the influence of different contents of tantalum alloying elements on the mechanical and electrochemical properties of TixTa9Nb8Zr2Ag alloys and their corrosion resistance in a 3% NaCl solution. These alloys exhibit a structure with more than 80% of the beta phase, a Young’s modulus between 82 and 55 GPa close to human bone, and good corrosion resistance, with a corrosion rate between 5 and 47 μm y−1. Furthermore, the excellent corrosion behavior of the TixTa9Nb8Zr2Ag alloy with 10 and 15% tantalum content is highlighted, revealed by a nobler corrosion potential, low corrosion rate, and a high passivation tendency in a 3% NaCl solution. The results reported in this work allow us to consider that titanium alloys TixTa9Nb8Zr2Ag with 10–20% Ta could be a valid alternative for use in orthopedic surgery, and the level of tantalum can be customized depending on the nature of the treated bone and the complexity and difficulty of the implant machining, i.e., of the required optimum hardness.

1. Introduction

The use of metallic materials for surgical devices demands the fulfillment of biocompatibility requirements [1] next to that of corrosion resistance and bioadaptability. The corrosion resistance of metallic materials depends on their thermo-mechanical history but also on the aggressiveness of the contact environment. In the last years, a series of stainless steels [2], titanium-based alloys [3,4], and cobalt-based alloys [5] have been developed with very good corrosion resistance in biological environments. However, a good material for implantology applications must meet all requirements, and bioadaptability is an essential criterion with significant implications on the healing time and functionality of a surgical implant. Thus, the reduction in post-operative stress is an intense concern for doctors and a requirement addressed to researchers in the field of materials, to find formulas and combinations of elements to obtain new alloys, which best meet the criteria of materials used in implantology. It is well known that post-operative stress is generated by the different responses to taking over the mechanical loads at the interface between the implantable device and the bone, which leads to the appearance of the phenomenon of bone resorption. The high density of metallic materials, but also the incompatibility of mechanical properties, compared to those of human bone, are responsible for this unwanted effect. The high value of the Young modulus of various materials such as 190–210 GPa for stainless steels [6], 220 GPa for Co-Cr alloys [6], and 90–110 for titanium and its alloys [6,7], compared to that of human bone (10–40 GPa depending on the nature of the bone and the state of health [8,9]) has the effect of taking over the loads by the implant, protecting the bone and causing bone resorption [10,11]. It is recognized that titanium and its alloys have high biocompatibility for medical applications, and the Ti6Al4V alloy with a biphasic structure (α + β) and an elastic modulus value of about 110 GPa are widely used [12], although Al and V have proven to be toxic to the human body. This aspect determines their replacement with non-toxic beta-stabilizer elements such as Mo, Nb, and Ta [13,14], aiming to obtain a structure with a low content of the alpha phase for a low Young modulus simultaneously. Thus, special attention is given to a new range of alloys in the titanium–niobium–tantalum–zirconium alloy system (TNTZ), with good mechanical properties, a low modulus of elasticity, high corrosion resistance, and good biocompatibility [14,15,16,17]. Moreover, the extensive mechanical properties of these alloys are still to be enhanced in clinical practice. Accordingly, the design concept of these alloys can be used to obtain biomedical alloys with excellent appropriate properties to meet demand.
In addition, another property of tantalum that decides the presence of this element in the titanium–niobium–tantalum–zirconium alloy system is its low magnetic susceptibility, leading to a high quality of images and fewer distortion in post-operative magnetic resonance imaging [10]. In this regard, special attention is paid to a new range of alloys from the titanium–niobium–tantalum–zirconium (TNTZ) system with good mechanical properties, a low modulus of elasticity, high corrosion resistance, and good biocompatibility. In this vein, four alloys with a 10Nb 8Zr 2Ag Ti base were designed with a tantalum content between 10 and 20%, and after the morpho structural characterization, the influence of the Ta content on the electrochemical properties was investigated in the very severe conditions of 3% NaCl, the temperature of 37 °C, and 168 h of immersion in order to identify the alloy with the modulus of elasticity as close as possible to that of human bone (40 GPa) and maximum resistance to corrosion. Many research studies focused on a series of synthetic biofluids used in the field [18,19,20], but this paper presents the results in the most aggressive environment to test the limits of the material from this point of view.

2. Materials and Methods

The alloys were obtained in a vacuum arc melting furnace (VAR) ABD MRF 900 in the form of ingots with a diameter of 10 mm and a length of 150 mm with chemical compositions according to Table 1. The chemical composition of the experimental alloys was determined by energy-dispersive X-ray spectroscopy (EDS, FEI, Eindhoven, The Netherlands). It should be noted that during the EDS analysis, the only elements considered were those of interest, mainly Ti, Nb, Zr, Ta, and Ag. EDS analysis was performed on 5 random regions for each sample, and the average values and standard deviations are presented in Table 1.

2.1. Morphology and Structural Analysis

Morphology and structural analysis was carried out by scanning electron microscopy (SEM) using the FEI Inspect F50 electron microscope (FEI Company, Eindhoven, The Netherlands), and phase analysis was performed with X-ray diffraction (XRD) using an X’PERT-PRO PANalytic diffractometer (Malvern Panalytical Ltd., Malvern, UK) (Kα1 = 1.5405980 Å) with Cu-Kα radiation at 45 kV, 4 mA, and a scan range starting from 10° to 90°.

2.2. The Young’s Modulus

To measure the Young modulus, tensile tests were performed using a Walter + Bai LFV300 universal testing machine, according to [21], and the Vickers hardness was determined with a Shimadzu HMV 2TE hardness tester (Shimadzu Corporation, Kyoto, Japan) using a load of 1.961 N with a holding time of 15 s, according to the [22].

2.3. The Electrochemical Characterization

The electrochemical characterization was carried out by the method of immersion in a 3% NaCl solution at a temperature of 37.5 °C through the following techniques: monitoring the stationary potential for 168 h, the Tafel slopes method for determining corrosion rates, and electrochemical impedance spectroscopy (EIS). The stationary potential, corresponding to the steady state established at the interface between the alloy surface and the NaCl solution was monitored for 168 h, and, after that, the Tafel plots were recorded in the potential range from −0.25 V to + 0.25 V vs. OCP with a scan rate of 2.5 mV s−1. EIS measurements were carried out potentiostatically, at the OCP, with an AC amplitude of 10 mV over the frequency range of 100 kHz to 0.01 Hz, after 168 h of exposure in 3% NaCl solution. EChemAnalyst (Gamry Instruments Inc., Warminster, PA, USA) and ZView specialized software (ZView 3.3, Scribner Associates, Inc., Souther Pines, NC, USA) were used to estimate the electrochemical parameters (Ecor, icor, rcor) and to analyze EIS data.
A Reference 600 Gamry potentiostat/galvanostat (Gamry Instruments Inc., Warminster, PA, USA) with a classic electrochemical cell with three electrodes—a working electrode with a surface of 2 cm2, a platinum counter electrode with a surface of 6 cm2, and as a reference electrode, a Ag/AgCl 3M electrode—was used for all electrochemical measurements. Before the electrochemical tests, the active surfaces of the samples (2 cm2) were processed by mechanical grinding, in stages, until metallographic quality; then, they were cleaned in an ultrasonic field with a degreasing solution, followed by ethanol and double-distilled water washing. The electrical contacts were made of titanium wire and insulated with insulating varnish and Teflon tape like the inactive surfaces. In order to prove reproducibility of the measurements, three specimens for each type of alloy were tested.

3. Results and Discussions

3.1. Microstructure and Morphology Analysis

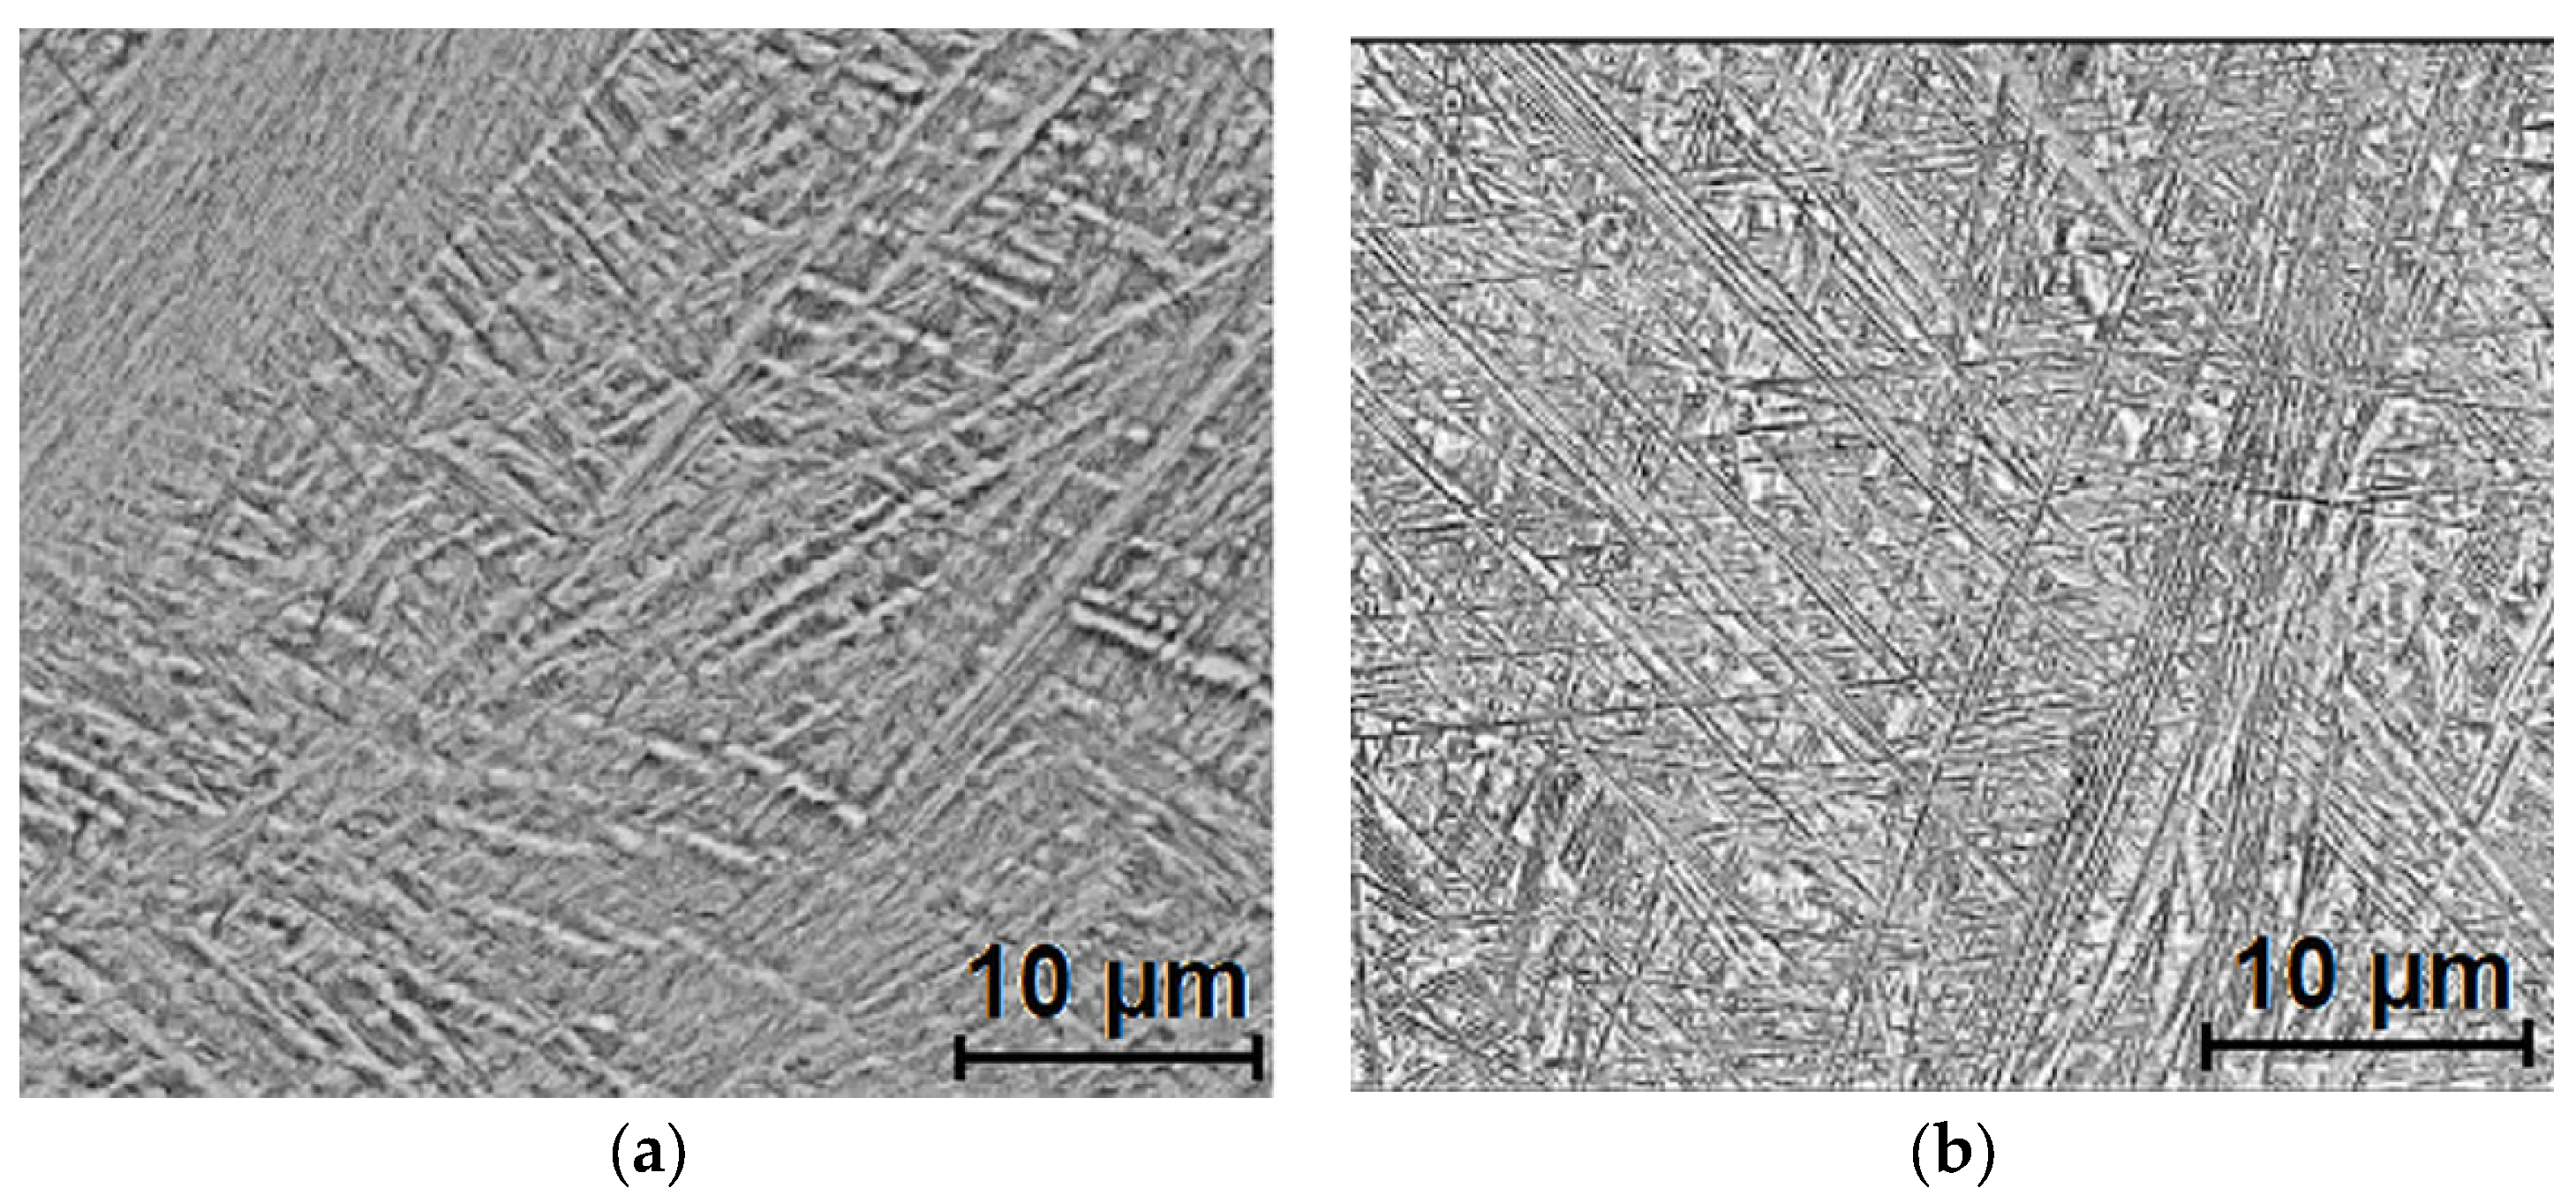
Figure 1 and Figure 2 show the SEM aspects of the microstructures of the analyzed samples. All the samples have specific structures for titanium alloys in the cast state; from a morphological point of view, they are lamellar biphasic, α + β, the proportion of the two phases changing depending on the tantalum content in the alloy. It can be observed that the reference alloy, without tantalum (A0), consists of a mixture of relatively balanced α and β solid solutions (Figure 1a) with α lamellae of considerable thickness. When adding a 9% amount of tantalum, the morphology does not change significantly (Figure 1b sample A10) with the mention that, as the concentration of Ta increases, the thickness of the α lamellae tends to decrease. At a content of 15% Ta, (A15), the morphology changes drastically, the microstructure consists mainly of a beta-solid solution with colonies of thin alpha lamellae mostly grouped at the grain boundaries, as seen in Figure 2a. The structure of the A20 alloy, with 20% Ta, is like A15, the proportion of the α phase decreases, the alloy has a predominantly β structure, over 90% [23], and the α phase is organized mainly in the form of rosettes, which induces changes in the mechanical and electrochemical behavior of alloys (Figure 2b).
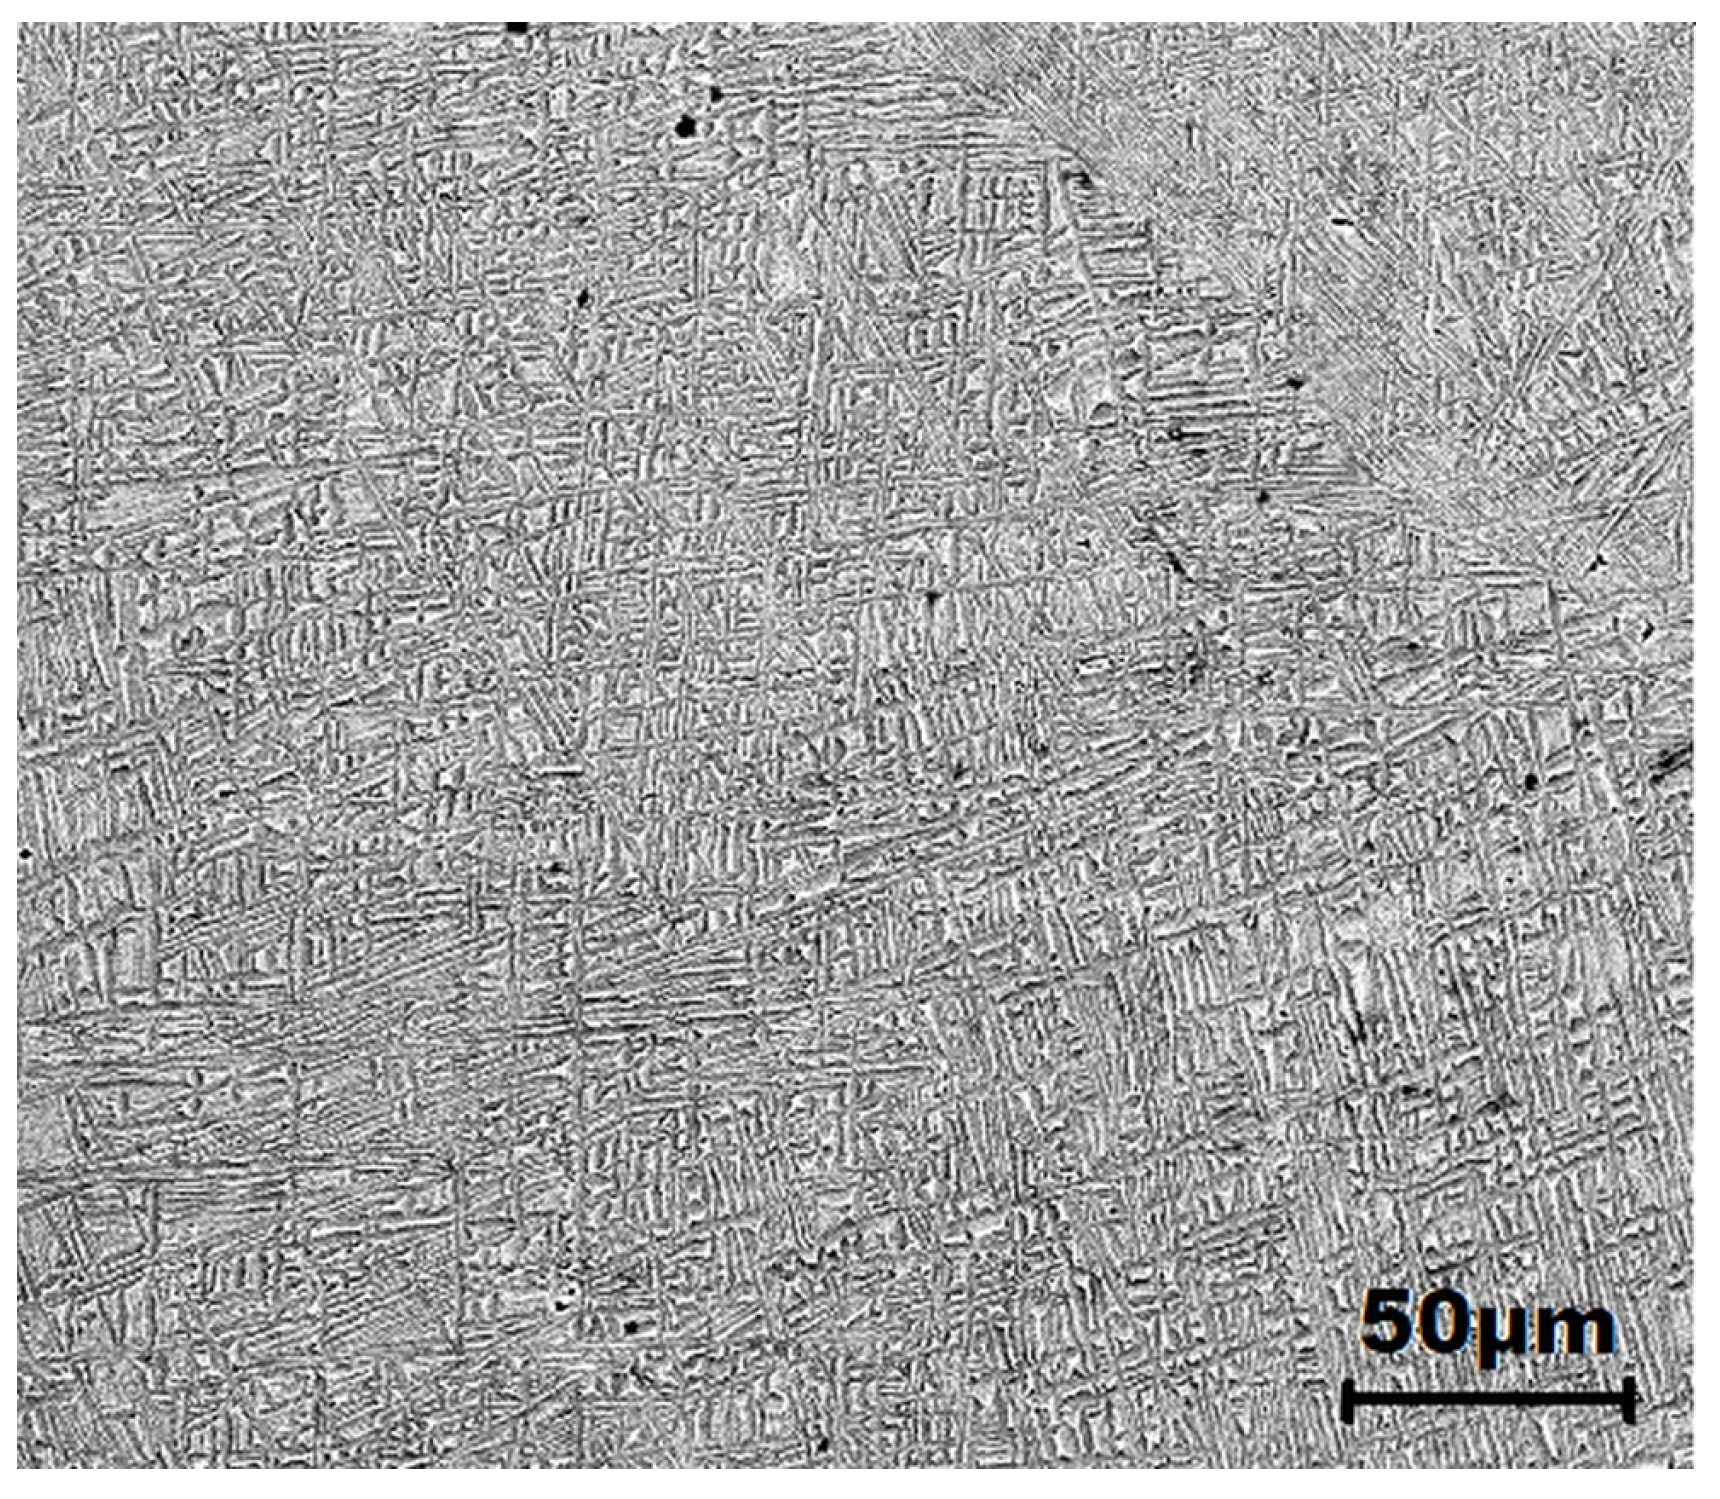
It should be noted that in all cases, the distribution of the phases is relatively disordered, and random, with an insular organization largely like Widmannstätten-type structures similar to those reported by [23,24] for cast titanium alloys (Figure 3 low-magnification overview of sample A10).
The evolution of the alloy structure from biphasic α + β (A0) to the majority β structure (A20) is also highlighted by the XRD analysis (Figure 4), by the decrease in the intensity of signals specific to the α phase until the disappearance of some of them.
The XRD patterns were compared to reference cards JCPDS No: 44-1294 for α Titanium (P63/mmc) and 44-1288 for β Titanium (Im3 m). The experimental peaks were slightly shifted to the left with respect to the ones from the reference cards, suggesting that the lattice parameter has changed by the dissolution of the alloying elements in titanium.
The specific peaks for the β phase are difficult to identify because of the overlapping of α-(002)/β-(110), α-(102)/β-(200), α-(103)/β-(211), and α-(004)/β-(220). In the current configuration of the experimental setup, a quantitative determination is impossible, and because of this aspect, the Rietveld analysis failed to converge or provided erroneous results.
An interesting aspect that could indicate the increase in the β phase proportion with tantalum content resides in the intensity increase for the peak for β-(211) positioned at around 69.95°: as tantalum content increases, so does its intensity, as can be observed in Figure 4. A similar behavior is observed for the peaks present at around 53.03° that correspond to α-(102), they are in the proximity of those for β-(200), and a combined effect can be noticed as well. Regarding the mechanical behavior of the beta titanium alloys studied, the Vickers hardness and the modulus of elasticity were of interest for this study. To measure the Vickers hardness, cylindrical samples were used, according to ISO 6507-1 [22]. The measurements were performed at five points on each sample, and the obtained values were averaged. Figure 5 shows the dependence of the mean Vickers hardness on the tantalum concentration in the alloy.
As the tantalum concentration increases from zero to 15% Ta, a slight increase in Vickers hardness can be observed, in the range of 230–240 Vickers units, followed by a sudden increase in hardness up to 290 units when concentration is 20% by the weight of Ta.
The evaluation of the elasticity moduli of the alloys was based on the results obtained during the tensile tests and presented in Supplementary Materials (Figure S1 and Table S1). The results highlighted that the modulus of elasticity decreases with increasing tantalum content from 100 GPa for alloy A0 to 82 GPa for A10 and 55 GPa for the A20 alloy, which is in full correlation with the evolution of the microstructure from a balanced biphasic beta to a monophasic around 90% β phase [13]. The obtained values are in good agreement with those reported in the specialized literature for the alloys with a much higher content of niobium (35%) [25,26]. These findings are a plus of this research, the elaboration of an alloy with a modulus of elasticity close to that of human bone and with a lower content of niobium, considering the scientific controversies surrounding this alloying element.

3.2. Electrochemical Behavior of Alloys

The electrochemical behavior of the experimentally developed alloys, in a 3% NaCl solution, was studied by monitoring the stationary potential (OCP) for 168 h at a temperature of 37.5 °C, i.e., in a steady state without external polarization, completed with electrochemical impedance measurements (EIS) at the OCP. Corrosion rates were determined by the Tafel slope method in a potential range of ± 250 mV around the corrosion potential. The time evolution of the OCP in the 3% NaCl solution is presented in Figure 6, from which it can be seen that all alloys initially have negative values of the OCP that move slowly, with less than 2 mV/h, toward positive values, which indicates the tendency of passivation in the presence of water. All alloys with tantalum content (A10, A15, A20 samples) have more negative values (with about 150 mV) compared to the alloy without tantalum A0, and this tendency is maintained throughout immersion.
As Figure 6 illustrates, a similar behavior is observed for the A10 and A15 samples, with a tendency to reach a steady state after 168 h, while the A0 and A20 samples show a different response. After 70 h of immersion, for the alloys with 15% and 20% Ta, the stationary potential values are practically identical in spite of dissimilar behavior suggesting that on the A20 sample, the surface of the passive film is an active state. According to literature report [8], this action is due to the preferential adsorption of Cl ions on the passive film grown on the surface during immersion. At the end of the period of immersion, only the alloy with 10% Ta (A10) seems to have reached the steady state; all the others show a relatively monotonously increasing variation, which may mean a consolidation of the passive state of the surface.
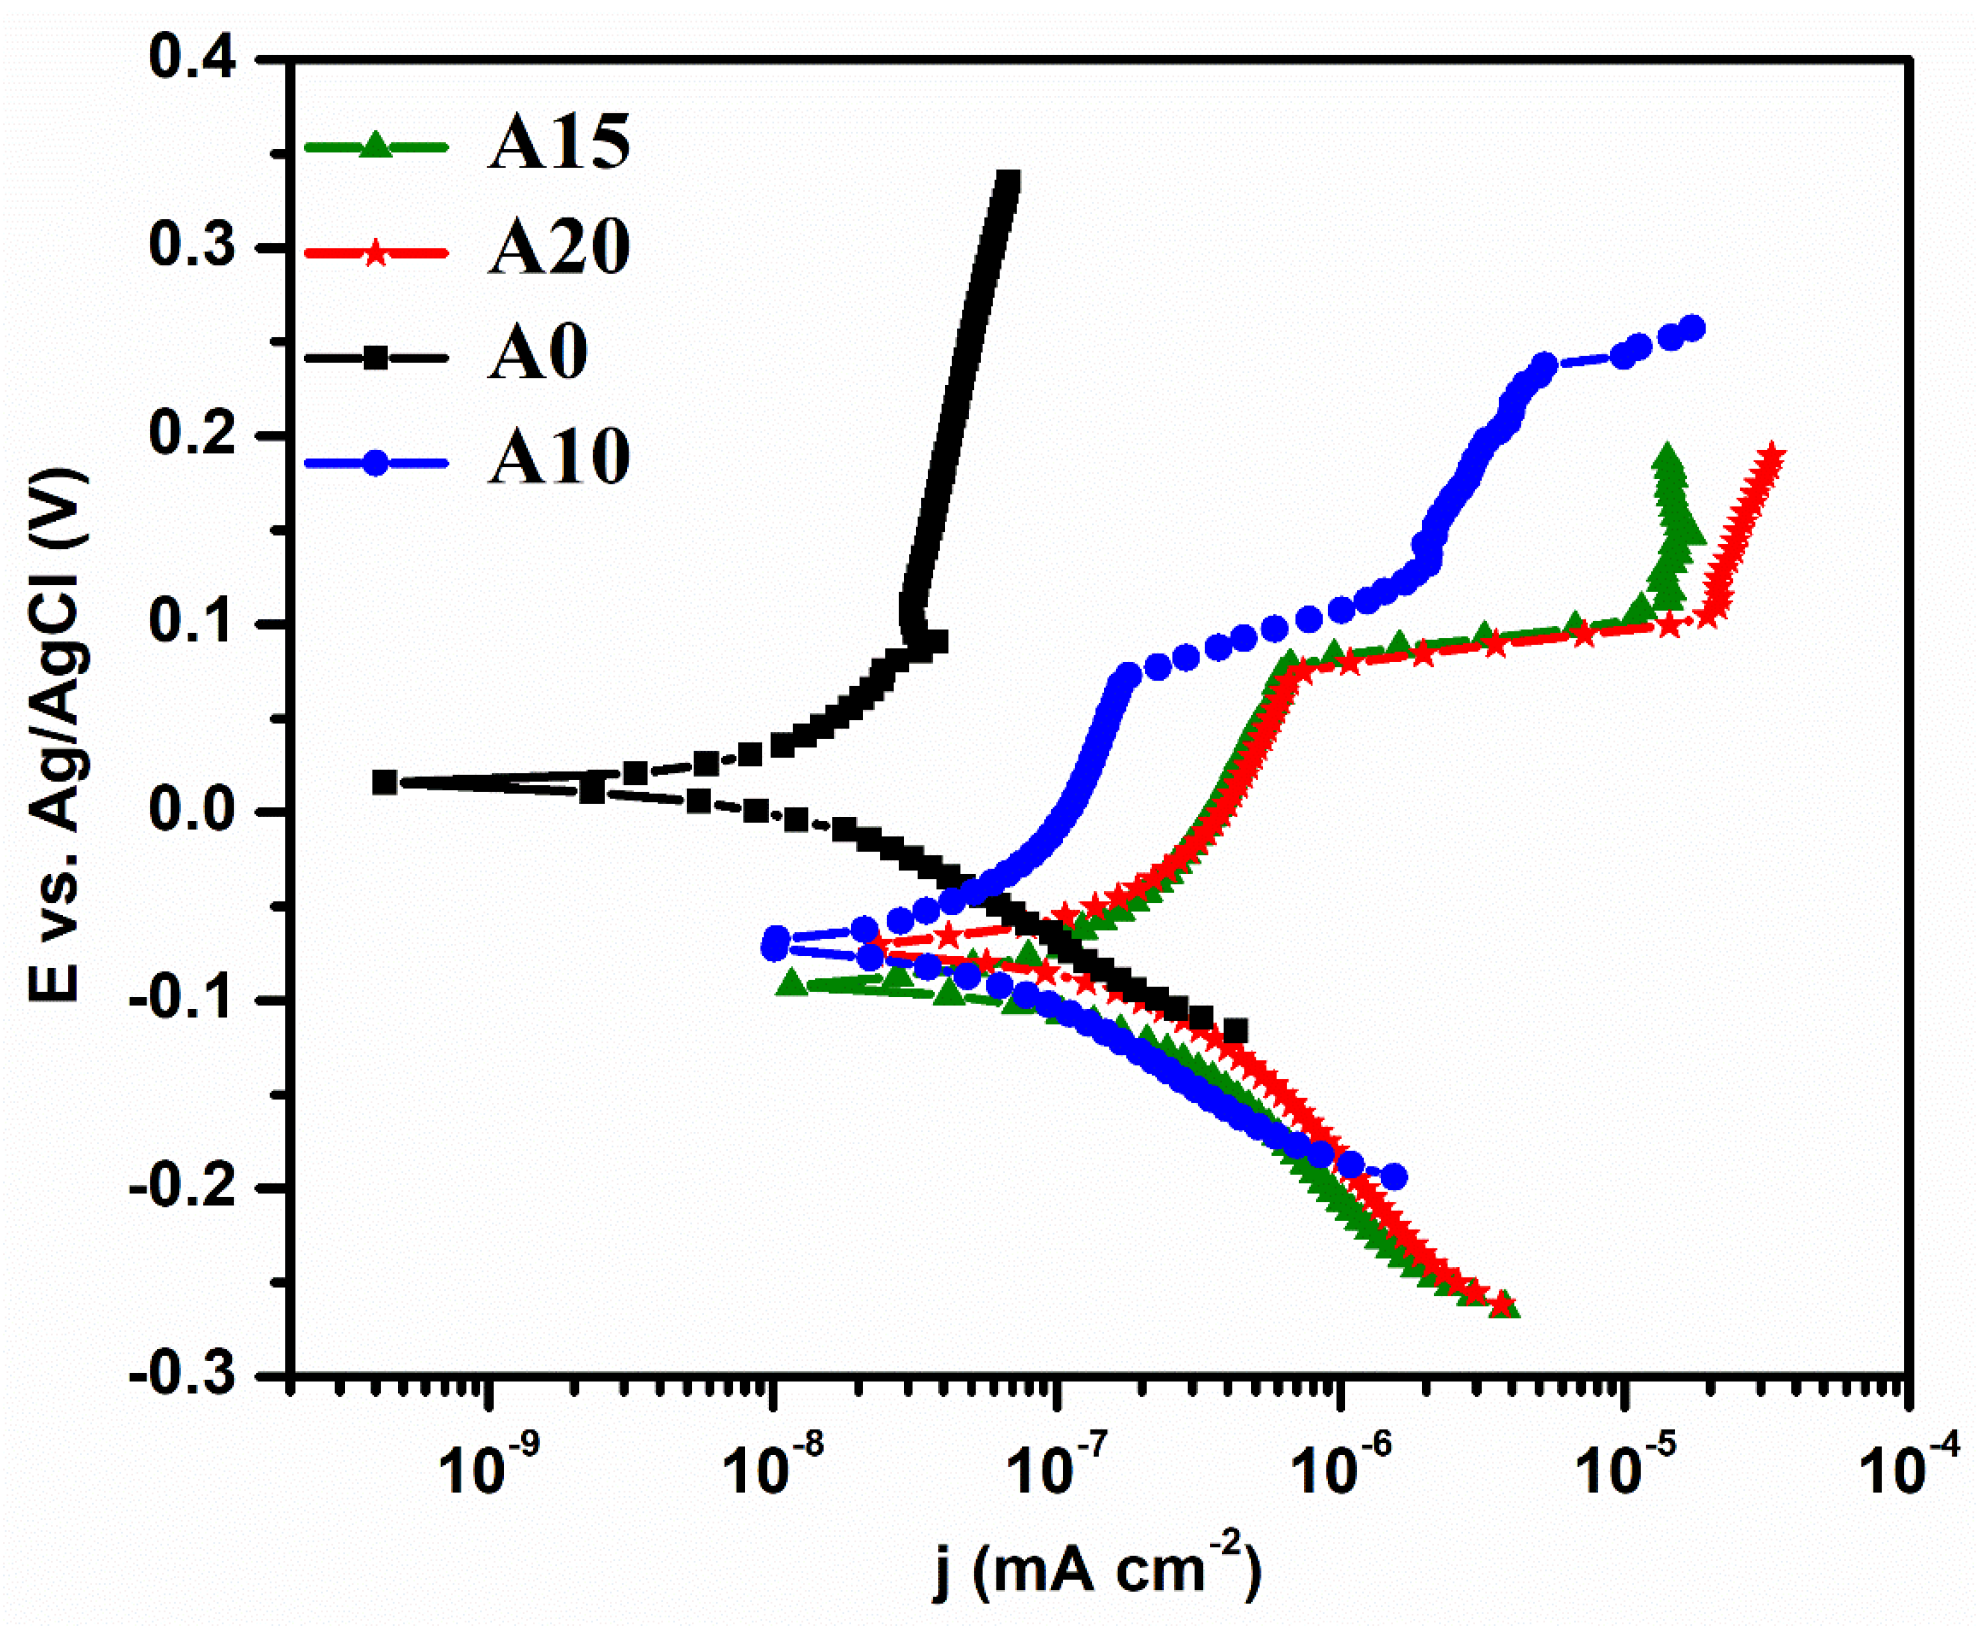
Microscopic analysis of the surface after 168 h of immersion in the 3% NaCl solution did not reveal any localized corrosion, unlike other types of titanium alloys, for example, TiNi which, according to [27], in a 0.9% NaCl solution at 25 °C showed the tendency of depassivation and pitting corrosion, one of the most common forms of corrosion that appear on orthodontic materials [28]. On the other hand, all the potentials have more electropositive values compared to those of other alloys based on titanium TiNi, Ti6Al4V, or even titanium CP [29]. This behavior can be attributed to the spontaneous passivation in the air of the alloys but also to the contribution of silver, the potential of the standard Ag electrode being known to be very electropositive (EAg0 = +0.799 V) according to [30]. Regarding the electrochemical parameters extracted from the Tafel curves (Figure 7) systematized in Table 2, it is observed that after 168 h of immersion in the 3% NaCl solution, the equilibrium potentials of all the alloys are much more electropositive than the corrosion potentials, which means that the alloys are spontaneously in a state of passivity.
Also, it can be observed that the addition of Ta moves the corrosion potential toward more electronegative values, a fact reported by other authors [31]. Regarding the corrosion rates in the NaCl environment with increased aggressiveness and due to the temperature of 37.5 °C, they increase as the tantalum content in the alloy increases but remain at lower values than those reported by [31] for the alloys commonly used in orthopedic surgery, Ti6Al4V. Thus, SK Yen [32] reported corrosion current densities greater than 45.93 μA cm−2 in a 0.6 M NaCl solution at room temperature, while the A 20 alloy with the smallest modulus of elasticity showed icor = 1.1 μA cm−2 at a temperature of 37.5 °C. The superior corrosion behavior of these alloys can also be attributed to the beneficial influence of silver, explained in the literature also by catalyzing the oxygen reduction reaction and favoring passivation [33]. Concerning the corrosion rates, although they increase with the increase in the concentration of tantalum in the alloy, they remain at relatively low values between 5 μm y−1 and 47 μm y−1. Moreover, the preliminary research carried out on these materials in artificial saliva highlights a relatively similar influence of tantalum on the electrochemical parameters (Table 2).
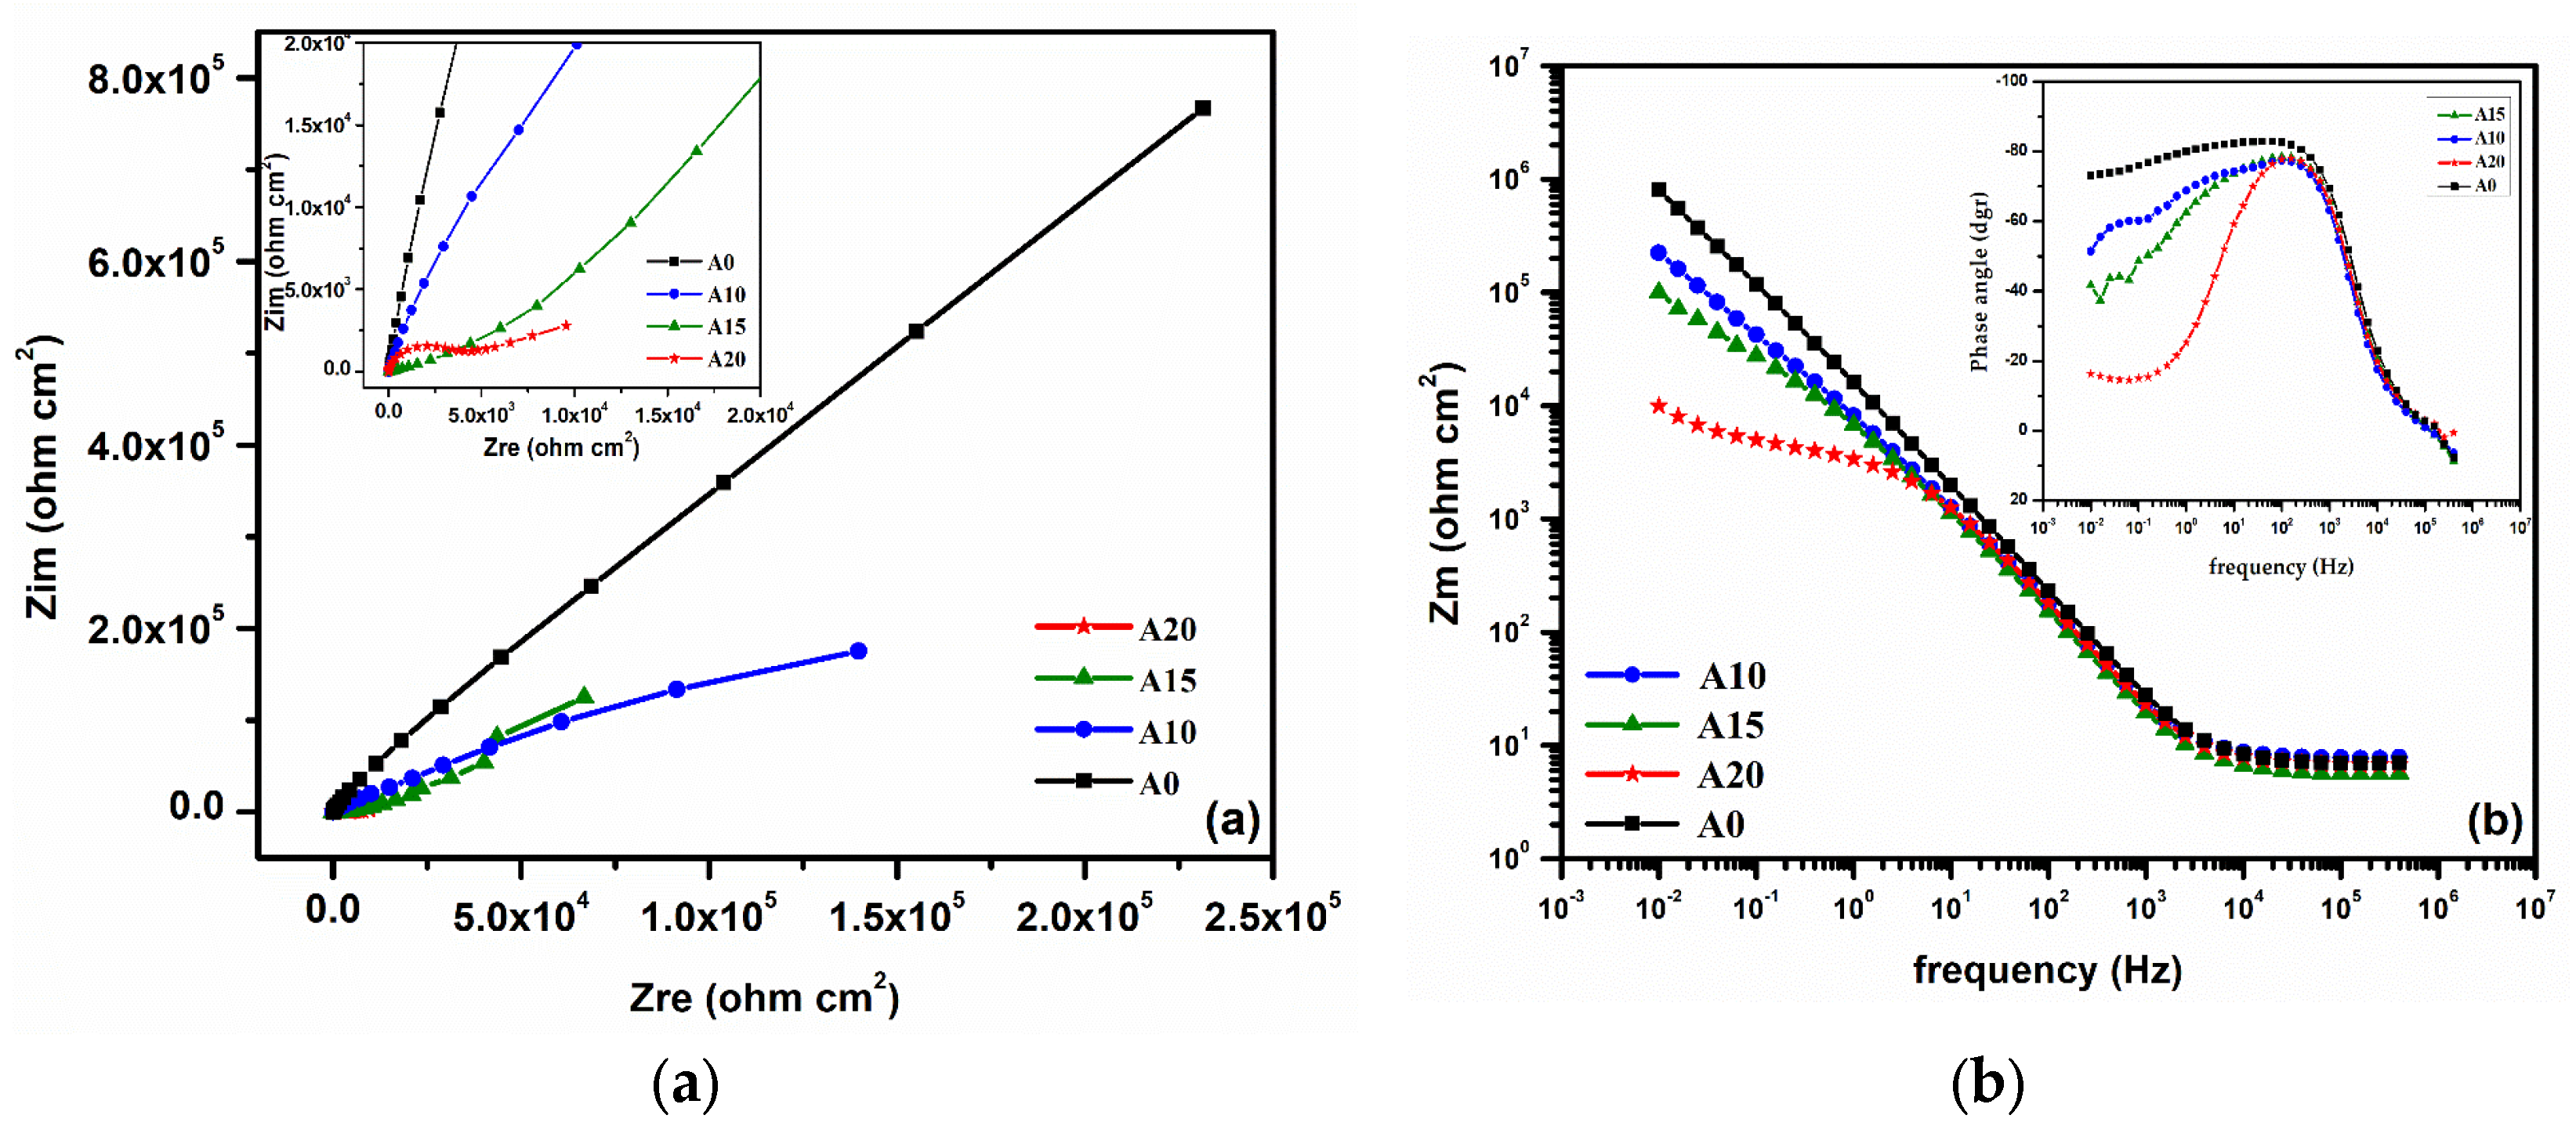
The electrochemical behavior of the alloys discussed above was also confirmed by the EIS tests whose response is presented in the form of Nyquist and Bode curves (Figure 8). Figure 8a corresponding to Nyquist plots discloses the decrease in polarization resistance with the increase in tantalum content in the alloy, simultaneously with the increase in resistive behavior. Samples A0, A10, and A15 showed similar behavior, while for the A20 sample, a significant difference is evidenced (Figure 8a inset). However, it is important to notice that the A0, A10, and A15 samples present higher impedance related to good corrosion resistance, while for the A20 sample with a high content of tantalum, more susceptibility to corrosion in a NaCl solution was observed. From Bode plots (Figure 8b), the presence of two-time constants can be seen, one at high frequencies due to the non-compensation of the ohmic drop in the electrolyte according to [34], and in the low-frequency range, the second time constant appears because of the reaction or diffusion of the species, especially of the chlorine ions, through the oxide film formed. This behavior is much more obvious at the A15 and A20 alloys, while the A10 alloy, in which the phase angle at low frequencies (Figure 8b inset) remains relatively constant at a value close to 80°, showing a pseudocapacitive character of surface passivation [35,36]. Instead, the lower phase angle of the A20 sample reveals a defective capacitor, a less protective layer that inherently decreases the corrosion resistance of the alloy with a high content of tantalum.
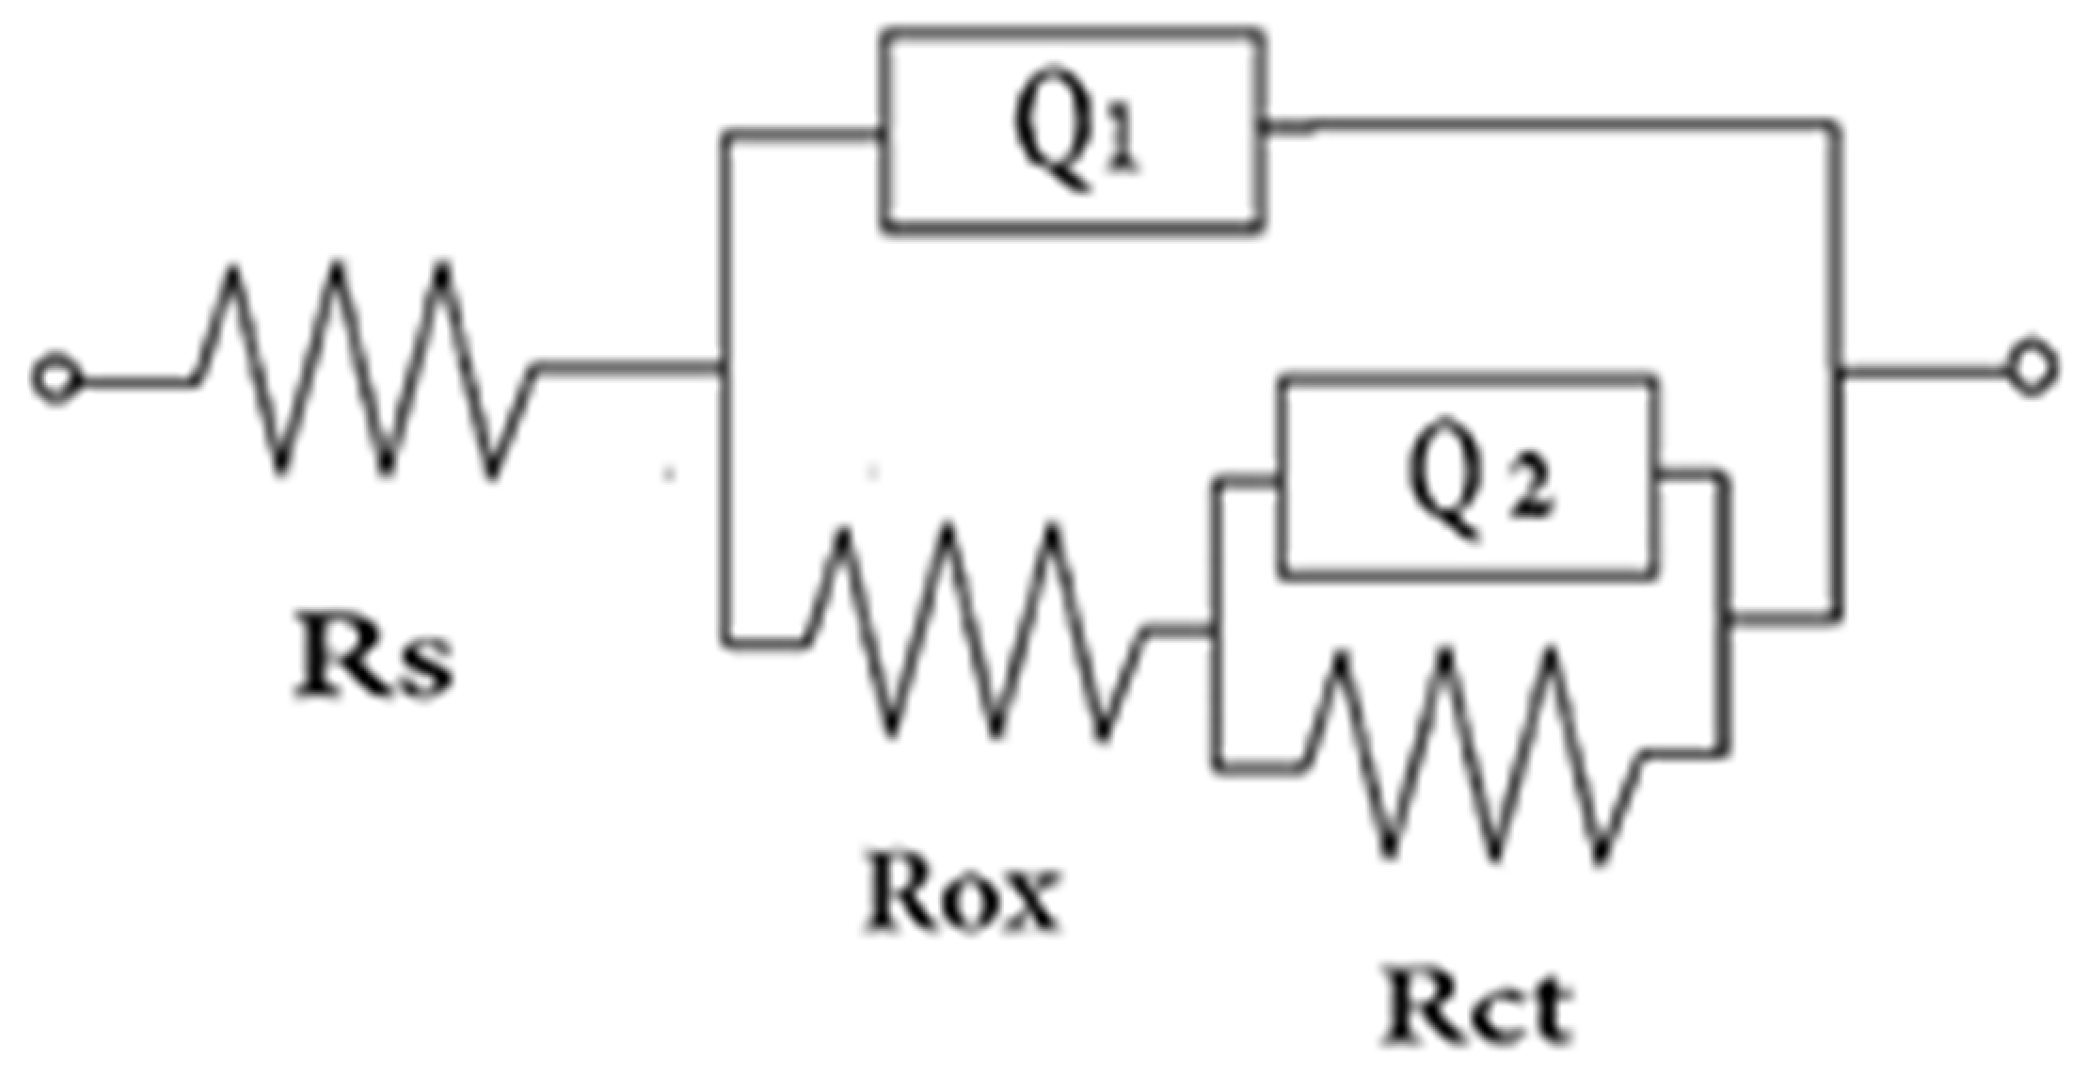
In order to go deeper, the EIS spectra of all samples were fitted using an electric equivalent circuit model (EEC) illustrated in Figure 9. The equivalent circuit herein used consists of Rs, Rox, Rct, Q1, and Q2 where Rs represents the resistance of the electrolyte, the system Rox and Q1 simulates the processes that take place through the oxide film, and Rct simulates the charge transfer resistance, respectively, a constant-phase element Q2 instead of a capacitance that describes the capacitive characteristic of the oxide layer. Since the oxide layers formed on Ti-based alloys regularly exhibit a duplex structure that resides in a barrier-type thin compact inner one and a porous external one [37], the Q elements, which describe the deviation of the electrochemical reaction from the ideal capacitive behavior, are more suited for better fitting the EIS spectra.
The results of fitting the experimental data with the proposed EEC are shown in Table 3. As a general remark, the higher Rox or Rct values are an indicator of better surface protection [38]. From the parameters presented in Table 3, one may estimate that the Rox and Rct of the A10 sample (i.e., 9.5 KΩ cm2 and 258.2 KΩ cm2) are superior to those of the A15 (i.e., 8.1 KΩ cm2 and 82.1 KΩ cm2) and A20 samples (i.e., 2.2 KΩ cm2 and 5.04 KΩ cm2), respectively. On the other hand, the alpha-exponent of the constant-phase element for all samples has values of about 0.9, which indicates a behavior close to an ideal capacity of the film formed on titanium alloys [34] and confirms the tendency of titanium alloys to passivate [38].
These results suggest a better corrosion resistance of the sample with a lower content of tantalum in chemical compositions which is in line with literature reports [4,18].
It is known that an aggressive environment with a high concentration of chloride ions (Cl) furthers the corrosion processes, leading to a decrease in the corrosion resistance of the alloys. The corrosion parameters estimated for the alloys presented in this study highlighted good resistance corrosion after 168 h of immersion in a 3% NaCl solution, placing these alloys in the very stable (A10 sample) and stable (A15 and A20 samples) corrosion resistance classes according to [39]. This good resistance corrosion of TixTa9Zr8Nb2Ag alloys might also occur due to a large content of the β phase in the alloy structure evidenced by the XRD results, which are in agreement with literature report [40]. Moreover, from EIS results, which evidenced higher Rct and Rox for the A10 sample and a lower corrosion rate (<10 μm y−1), one may state that the Ti10Ta9Zr8Nb2Ag alloy provides better corrosion resistance in a 3% NaCl solution. Furthermore, a low value of the elasticity modulus obtained for the Ti10Ta9Zr8Nb2Ag alloy (A10 sample) close to that of human bone makes it suitable for surgical application.
In summary, the results presented in this study highlighted the influence of the tantalum content in the chemical composition of the alloy on the mechanical properties, as well as on corrosion resistance, and point out that the Ti10Ta9Zr8Nb2Ag alloy might be successfully used for medical implants.

4. Conclusions

The alloying of the Ti9Zr8Nb2Ag alloy with tantalum significantly changes its structure in the cast state, in the sense of increasing the proportion of the beta phase.
The alloy with 20% tantalum contains around 90% of the β phase and can be considered monophasic.
Structure changing produces a change in the mechanical and electrochemical properties of alloys.
After adding 10% tantalum to the alloy, the modulus of elasticity decreased by 18% from 100 GPa to 83 GPa, and at a content of 20% Ta, it reached the value of 55 GPa, closer to the modulus of human bone compared with most used alloys such as CoCr or Ti-6Al-4V.
Vickers hardness increases with the tantalum concentration increasing in alloys.
Tantalum shifts the stationary potential in a 3% NaCl solution at 37.5 °C toward more electronegative values by approximately 150–180 mV.
Alloys with a Ta content between 10 and 20% show, in a 3% NaCl solution, stationary potentials that are more electropositive than corrosion potentials, which highlights the passivation tendency.
The corrosion rates increase with the increase in the concentration of tantalum in the alloy, but they remain at relatively low values between 5 μm y−1 and 47 μm y−1.

Supplementary Materials

The following supporting information can be downloaded at https://www.mdpi.com/article/10.3390/met13071294/s1, Figure S1: Stress—strain curves for a selection of test samples. On the chart plots showing the linear—elastic region of elastic moduli of 100 GPa, 50 GPa and 20 GPa are presented; Table S1: Strength parameters for the experimental alloys.

Author Contributions

G.D.—Methodology, Investigation, and Formal Analysis; A.B.—Writing Original Draft, Writing–Review and Editing, Supervision; C.D.—Investigation and Formal Analysis; M.M.—Conceptualization, Writing–Review. All authors have read and agreed to the published version of the manuscript.

Funding

This research was funded by the European Social Fund from the Sectoral Operational Program Human Capital 2014–2020, through the Financial Agreement with the title “Training of PhD students and postdoctoral researchers in order to acquire applied research skills—SMART” grant number 13530/16.06.2022—SMIS code: 153734.

Data Availability Statement

No new data were created or analyzed in this study. Data sharing does not apply to this article.

Conflicts of Interest

The authors declare that they have no known competing financial interests or personal relationships that could have appeared to influence the work reported in this paper.

References

  1. Davis, J.R. Handbook of Materials for Medical Devices, Overview of Biomaterials and Their Use in Medical Devices; Davis, J.R., Ed.; ASM International: Detroit, MI, USA, 2003. [Google Scholar]
  2. Banu, A.; Radovici, O.; Marcu, M. The Alloying Influence on Corrosion Behaviour of Chromium Surgical Alloys. Rev. Roum. Chim. 2008, 53, 947–953. [Google Scholar]
  3. Ijaz, M.F.; Vasilescu, C.; Drob, S.I.; Osiceanu, P.; Marcu, M.; Kim, H.Y.; Miyazaki, S. Electrochemical characterization of the superelastic (Ti-Zr)-Mo-Sn biomedical alloy displaying a large recovery strain. Mater. Corros. 2017, 68, 1220–1227. [Google Scholar] [CrossRef]
  4. Li, Z.; Lai, W.; Wang, B.; Tong, X.; You, D.; Li, W.; Wang, X. A novel Ti42.5Zr42.5Nb5Ta10 multi-principal element alloy with excellent properties for biomedical application. Intermetallics 2022, 151, 107731. [Google Scholar] [CrossRef]
  5. Banu, A.; Marcu, M.; Juganaru, C.; Osiceanu, P.; Anastasescu, M.; Capra, L. Corrosion behavior of CoCrMoW cast alloy in lactic environment. Arab. J. Chem. 2019, 12, 2007–2016. [Google Scholar] [CrossRef]
  6. Kaur, M.; Singh, K. Review on titanium and titanium-based alloys as biomaterials for orthopaedic applications. Mater. Sci. Eng. C 2019, 102, 844–862. [Google Scholar] [CrossRef]
  7. Yang, W.; Pang, S.; Liu, Y.; Wang, Q.; Liaw, P.K.; Zhang, T. Design and properties of novel Ti–Zr–Hf–Nb–Ta high-entropy alloys for biomedical applications. Intermetallics 2022, 141, 107421. [Google Scholar] [CrossRef]
  8. Cui, Y.-W.; Chen, L.-Y.; Chu, Y.-H.; Zhang, L.; Li, R.; Lu, S.; Wang, L.; Zhang, L.-C. Metastable pitting corrosion behavior and characteristics of passive film of laser powder bed fusion produced Ti–6Al–4V in NaCl solutions with different concentrations. Corros. Sci. 2023, 215, 111017. [Google Scholar] [CrossRef]
  9. Guo, L.; Naghavi, S.A.; Wang, Z.; Varma, S.N.; Han, Z.; Yao, Z.; Wang, L.; Wang, L.; Liu, C. On the design evolution of hip implants: A review. Mater. Des. 2022, 216, 110552. [Google Scholar] [CrossRef]
  10. Thampi, A.; Ramanathan, S. Corrosion behavior of anodized Ti-Ta binary surface alloys in various physiological fluids for implant applications. Corros. Sci. 2023, 219, 111233. [Google Scholar] [CrossRef]
  11. Hua, N.; Wang, W.; Wang, Q.; Ye, Y.; Lin, S.; Zhang, L.; Guo, Q.; Brechtl, J.; Liaw, P.K. Mechanical, corrosion, and wear properties of biomedical Ti-Zr-Nb-Ta-Mo high entropy alloys. J. Alloys Compd. 2021, 861, 157997. [Google Scholar] [CrossRef]
  12. Banu, A.; Preda, L.; Marcu, M.; Dinca, L.L.; Maxim, M.E.; Dobri, G. Electrochemical behavior of SLM Ti-6Al-4V alloy after long time of immersion in lactic acid environment. Met. Mater. Trans. A 2022, 53, 2060–2070. [Google Scholar] [CrossRef]
  13. Biesiekierski, A.; Wang, J.; Abdel-Hady Gepreel, M.; Wen, C. A new look at biomedical Ti-based shape memory alloys. Acta Biomater. 2012, 8, 1661–1669. [Google Scholar] [CrossRef] [PubMed]
  14. Zareidoost, A.; Yousefpour, M. A study on the mechanical properties and corrosion behavior of the new ascast TZNT alloys for biomedical applications. Mater. Sci. Eng. C 2020, 110, 110725. [Google Scholar] [CrossRef] [PubMed]
  15. Wong, K.-K.; Hsu, H.-C.; Wu, S.-C.; Hung, T.-L.; Ho, W.-F. Structure, Properties, and Corrosion Behavior of Ti-Rich TiZrNbTa Medium-Entropy Alloys with β+α″+α′ for Biomedical Application. Materials 2022, 15, 7953. [Google Scholar] [CrossRef] [PubMed]
  16. Rossi, M.C.; Ventura, B.N.; Milián, L.; Escuder, A.V.; Borrás, V.A. Study of Electrochemical and Biological Characteristics of As-Cast Ti-Nb-Zr-Ta System Based on Its Microstructure. Metals 2022, 12, 476. [Google Scholar] [CrossRef]
  17. Feng, J.; Wei, D.; Zhang, P.; Yu, Z.; Lui, C.; Lu, W.; Wang, K.; Yan, H.; Zhang, L.; Wang, L. Preparation of TiNbTaZrMo high-entropy alloy with tunable Young’s modulus by selective laser melting. J. Manuf. Process. 2023, 85, 160–165. [Google Scholar] [CrossRef]
  18. Vasilescu, C.; Drob, S.I.; Osiceanu, P.; Calderon Moreno, J.M.; Prodana, M.; Ionita, D.; Demetrescu, I.; Marcu, M.; Popovici, I.A.; Vasilescu, E. Microstructure, Surface characterization and electrochemical behavior of new Ti-Zr-Ta-Ag alloy in simulated human electrolyte. Metall. Mater. Trans A 2017, 48, 513–523. [Google Scholar] [CrossRef]
  19. Gurel, S.; Yagci, M.B.; Bal, B.; Canadinc, D. Corrosion behavior of novel Titanium-based high entropy alloys designed for medical implants. Mater. Chem. Phys. 2020, 254, 123377. [Google Scholar] [CrossRef]
  20. Chen, Y.H.; Chuang, W.S.; Huanga, J.C.; Wang, X.; Chou, H.S.; Lai, Y.J.; Lin, P.H. On the bio-corrosion and biocompatibility of TiTaNb medium entropy alloy films. Appl. Surf. Sci. 2020, 508, 145307. [Google Scholar] [CrossRef]
  21. ISO 6892-1; Metallic materials—Tensile Testing—Part 1: Method of Test at Room Temperature. ISO: Geneva, Switzerland, 2019.
  22. ISO 6507-1; Metallic Materials—Vickers Hardness Test—Part 1: Test Method. ISO: Geneva, Switzerland, 2018.
  23. Dobri, G.; Berbecaru, A.; Paraschiv, A.; Geanta, V.; Ciuca, S.; Banu, A. The effect of tantalum content on microstructure and vickers hardness of TiNbZrTaAg alloy. U.P.B. Sci. Bull. Ser. B 2023, 85, 167–178. [Google Scholar]
  24. Preisler, D.; Strasky, J.; Harcuba, P.; Kosutova, T.; Dopita, M.; Janovska, M.; Hajek, M.; Janecek, M. Phase transformations in Ti-Nb-Zr-Ta-O β titanium alloys with high oxygen and reduced Nb and Ta content. Acta Crystallogr. A 2021, 77, C1251. [Google Scholar] [CrossRef]
  25. Yang, Y.; Songxiao, H.; Wenjun, Y.; Baiking, X. Mechanical properties and microstructure of an α + β titanium alloy with high strength and fracture toughness. Rare Met. 2009, 28, 346. [Google Scholar] [CrossRef]
  26. Zhong, C.; Liu, J.; Zhao, T.; Schopphoven, T.; Fu, J.; Gasser, A.; Schleifenbaum, J.H. Laser Metal Deposition of Ti6Al4V—A Brief Review. Appl. Sci. 2020, 10, 764. [Google Scholar] [CrossRef] [Green Version]
  27. Yang, W.; Pang, S.-J.; Wang, G.; Liu, Y.; Liaw, P.K.; Zhang, T. Ti–Zr–Hf–Nb–Ta–Sn high-entropy alloys with good properties as potential biomaterials. Rare Met. 2022, 41, 2305–2315. [Google Scholar] [CrossRef]
  28. Hansen, A.W.; Fuhr, L.T.; Antonini, L.M.; Villarinho, D.J.; Marino, C.E.B.; Malfatti, C.D.F. The Electrochemical Behavior of the NiTi Alloy in Different Simulated Body Fluids. Mat. Res. 2015, 18, 184–190. [Google Scholar] [CrossRef] [Green Version]
  29. Vasilescu, C.; Osiceanu, P.; Calderon Moreno, J.M.; Drob, S.I.; Preda, S.; Popa, M.; Dan, I.; Marcu, M.; Prodana, M.; Popovici, I.A.; et al. Microstructure, surface characterization and long-term stability of new quaternary Ti-Zr-Ta-Ag alloy for implant use. Mater. Sci. Eng. C 2017, 71, 322–334. [Google Scholar] [CrossRef]
  30. Sargeant, A.; Goswami, T. Hip implants: Paper V. Physiological effects. Mater. Des. 2006, 27, 287–307. [Google Scholar] [CrossRef]
  31. Sherif, E.-S.M.; Bahri, Y.A.; Alharbi, H.F.; Ijaz, M.F.; Alnaser, I.A. Influence of Tantalum Addition on the Corrosion Passivation of Titanium-Zirconium Alloy in Simulated Body Fluid. Materials 2022, 15, 8812. [Google Scholar] [CrossRef]
  32. Yen, S.K.; Huang, T.Y. Characterization of the electrolytic ZrO2 coating on Ti-6A1-4V. Mater. Chem. Phys. 1998, 56, 214–221. [Google Scholar] [CrossRef]
  33. Oh, K.-T.; Joo, U.-H.; Park, G.-H.; Hwang, C.-J.; Kim, K.-N. Effect of Silver Addition on the Properties of Nickel–Titanium Alloys for Dental Application. J. Biomed. Mater. Res. B Appl. Biomater. 2006, 76, 306–314. [Google Scholar] [CrossRef]
  34. Tamilselvi, S.; Murugaraj, S.R.; Rajendran, N. Electrochemical impedance spectroscopic studies of titanium and its alloys in saline medium. Mater. Corros. 2007, 58, 113–120. [Google Scholar] [CrossRef]
  35. Preda, L.; Negrila, C.; Lazarescu, M.F.; Enache, M.; Anastasescu, M.; Toader, A.M.; Ionescu, S.; Lazarescu, V. Ga and As Competition for Thiolate Formation at p-GaAs(111) Surfaces. Electrochim. Acta 2013, 104, 1–11. [Google Scholar] [CrossRef]
  36. Chelariu, R.; Bolat, G.; Izquierdo, J.; Mareci, D.; Gordin, D.M.; Gloriant, T.; Souto, R.M. Metastable beta Ti-Nb-Mo alloys with improved corrosion resistance in saline solution. Electrochim. Acta 2014, 137, 280–289. [Google Scholar] [CrossRef]
  37. Xie, F.X.; He, X.B.; Cao, S.L.; Lu, X.; Qu, X.H. Structural characterization and electrochemical behavior of a laser-sintered porous Ti–10Mo alloy. Corros. Sci. 2013, 67, 217–224. [Google Scholar] [CrossRef]
  38. Assis, S.I.; Wolynek, S.; Costa, I. Corrosion characterization of titanium alloys by electrochemical techniques. Electrochim. Acta 2006, 51, 1815–1819. [Google Scholar] [CrossRef]
  39. ISO 8044; Corrosion of Metals and Alloys—Basic Terms and Definitions. ISO: Geneva, Switzerland, 2020.
  40. Yang, J.; Yang, H.; Yu, H.; Wang, Z.; Zeng, X.A. Corrosion Behavior of Additive Manufactured Ti6Al4V Alloy in NaCl Solution. Metall. Mater. Trans. A 2017, 48, 3583–3593. [Google Scholar] [CrossRef]
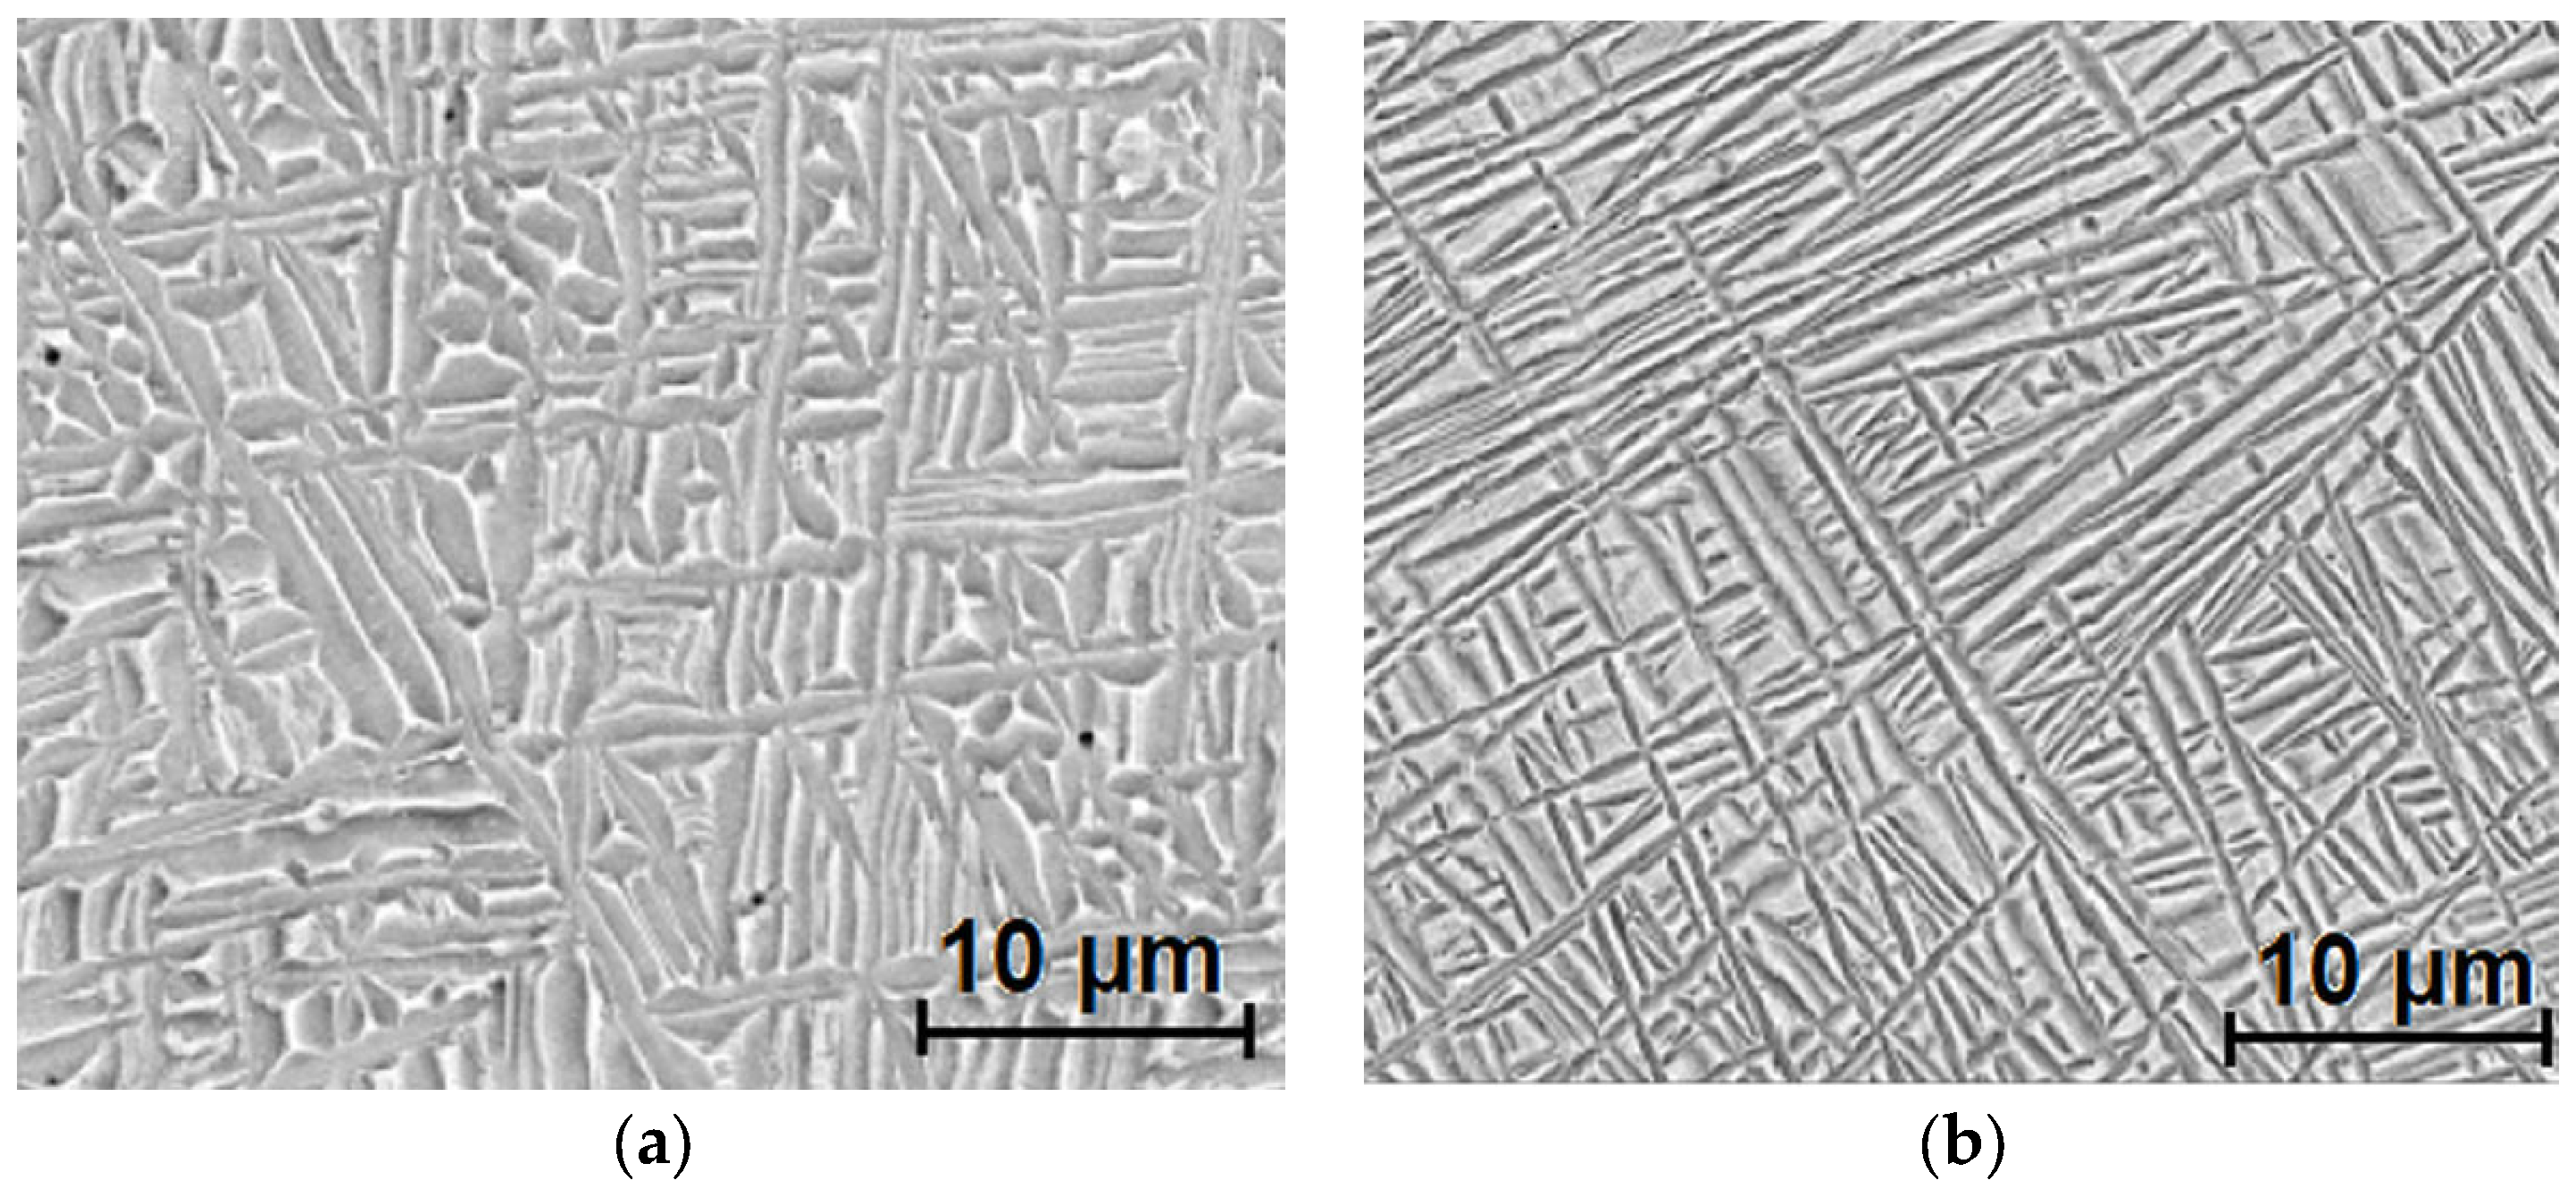
Figure 1. Scanning electron micrographs of the experimental alloys: (a) A0; (b) A10.
Metals 13 01294 g001
Figure 2. Scanning electron micrographs of the experimental alloys: (a) A15; (b) A20.
Metals 13 01294 g002
Figure 3. Microstructure of sample A10 at small magnification.
Metals 13 01294 g003
Figure 4. XRD patterns of experimental titanium alloys.
Metals 13 01294 g004
Figure 5. Vickers hardness dependence on tantalum concentration in alloys.
Metals 13 01294 g005
Figure 6. Time evolution of the OCP of the experimental alloys immersed in 3% NaCl solution at a temperature of 37.5 °C for 168 h.
Metals 13 01294 g006
Figure 7. Tafel curves of tested alloys after 168 h of exposure in 3% NaCl solution at temperature of 37.5 °C.
Metals 13 01294 g007
Figure 8. EIS plots obtained after 168 h of immersion in 3% NaCl solution at 37.5 °C on all samples: (a) Nyquist plots (inset: magnification of plots at high frequency); (b) Bode plots (inset: phase angle).
Metals 13 01294 g008
Figure 9. Equivalent electrical circuit model.
Metals 13 01294 g009
Table 1. The chemical composition (% wt. and standard error) of experimental ingots.
Specimen% Nb% Zr% Ag% Ta% Ti
A09.22 ± 0.418.28 ± 0.191.86 ± 0.160.0Balance
A1010.26 ± 0.687.95 ± 0.281.97 ± 0.098.94 ± 0.36Balance
A159.23 ± 0.257.80 ± 0.121.87 ± 0.0915.57 ± 0.60Balance
A209.01 ± 0.167.88 ± 0.171.92 ± 0.0820.02 ± 0.64Balance
Table 2. Electrochemical parameters after 168 h of immersion in 3% NaCl solution and artificial saliva at temperature of 37.5 °C (Tafel curves).
Specimen3% NaClArtificial Saliva
Ecorr, mVicor,
μA cm−2
rcor, μm y−1Eoc, mVEcorr, mVicor,
μA cm−2
rcor, μm y−1Eoc,
mV
A014.30.0270.913511.50.0110.41−10.5
A10−69.80.135570.0020.094.60.002
A15−90.30.518−120.0080.1517.20.008
A20−72.81.147−100.01142.25340.011
Table 3. The obtained EIS parameters from fitting experimental data on the proposed equivalent electrical circuit (Figure 9).
SpecimenRs
(Ω cm2)
Rox
(KΩ cm2)
Q1
−1 cm−2 sn)
n1Rct
(KΩ cm2)
Q2
−1 cm−2 sn)
n2Chi
A03.09376.6 × 10−60.62102211.5 × 10−60.90.4
A103.49.52.68 × 10−60.72258.212.68 × 10−60.880.335
A152.88.113.37 × 10−60.6982.197.03 × 10−60.890.538
A204.62.2861 × 10−60.605.04821.9 × 10−60.920.439
Disclaimer/Publisher’s Note: The statements, opinions and data contained in all publications are solely those of the individual author(s) and contributor(s) and not of MDPI and/or the editor(s). MDPI and/or the editor(s) disclaim responsibility for any injury to people or property resulting from any ideas, methods, instructions or products referred to in the content.