Abstract
The environmental resistance of pure iron was evaluated by an oxygen and hydrogen sensor installed after an oxidation furnace. The amount of introduced oxygen was precisely controlled by the oxygen pump sensor at the front stage of the oxidation furnace, and the reaction with hydrogen was analyzed. Thus, when oxygen was supplied, a reaction between hydrogen and oxygen occurred; however, when the supplied oxygen was not sufficient, a hydrogen-vapor environment was created, and oxidation was not accelerated. Conversely, when the amount of supplied oxygen was excessive, the environment became an oxygen–steam environment, and oxidation was accelerated. Therefore, this explained how the oxidation caused by oxygen was dominant under the oxygen–water vapor environment, and the oxidation weight gain increased. In addition, the border of the region dominated by oxygen oxidation and steam oxygen was clarified by precisely controlling the amount of oxygen supplied by the oxygen pump sensor.
1. Introduction
Concern over the increasing seriousness of climate change is growing as the greenhouse gas concentration increases. A high volume of greenhouse gases is emitted from the energy conversion sector that uses fossil fuels, such as thermal power plants and the burning of aircraft jet engines. Therefore, we must move away from fossil fuels to halt the emission of greenhouse gases. Thus, using hydrogen from renewable energy instead of fossil fuels as an energy source could reduce greenhouse gas emissions and help resolve climate change [1,2,3]. However, when hydrogen fuel is being used, the high-temperature atmosphere to which components are exposed differs from that of fossil fuels; hence, the deterioration behavior of components in the case of hydrogen fuel due to high-temperature oxidation remains mostly unknown. It is assumed that combustion gas contains hydrogen, oxygen, water vapor, and so on. In addition, experiments on combustion environments where hydrogen and oxygen react together are difficult to conduct. As a result, the reaction behavior of gas species in an environment where the partial pressure of hydrogen and oxygen gases is precisely controlled is still unknown. Thus, the present authors developed equipment that electrochemically supplies oxygen with high precision (oxygen pump-sensor) and regulates the reaction amounts of hydrogen and oxygen on electrode surfaces [4,5,6,7]. Furthermore, the authors examined the reaction behavior of hydrogen and oxygen, and the oxidation behavior of Ni-based alloys in cases of hydrogen fuel use [8]. However, in an environment with hydrogen, oxygen, and water vapor, hydrogen behavior must be measured accurately.
Although there have been many reports on the oxidation behavior of metals in mixed atmospheres of hydrogen, oxygen, and water vapor [9,10,11,12,13,14,15,16,17,18,19,20,21,22,23,24,25,26,27], there are no reports on the measurement of hydrogen behavior in situ. Water vapor and oxygen are both involved in oxidation and generate similar oxides. Therefore, it is not possible to decipher whether oxidation is caused by oxygen or water vapor, and the oxidizing species that causes oxidation is unknown [23].
In oxygen atmospheres, oxidation progresses due to the reaction expressed in Equation (1)
Fe + 1/2O2 → FeO
In this case, oxygen in the atmosphere is consumed in the reaction with Fe (iron), lowering the partial pressure of oxygen. However, in environments that contain water vapor, the reaction shown in Equation (2) occurs in addition to Equation (1).
Fe + H2O → FeO + H2
Thus, hydrogen is generated in a reaction with water vapor, increasing the partial pressure of hydrogen in the atmosphere. Therefore, it is important to measure the partial pressures of oxygen and hydrogen in oxidizing atmospheres, making it possible to distinguish between oxidation by oxygen and water vapor.
In this study, we used an oxygen pump-sensor, which is oxygen supply equipment, in Ar–H2 to precisely control the amount of oxygen supplied to Ar–H2. We then observed behaviors of hydrogen and oxygen in situ using the hydrogen and oxygen sensors and performed a separate analysis of oxygen and water vapor involved in the oxidation of Fe by water vapor.
2. Experimental Procedure
As the base material, we used Fe (99.99%). The sample was a square with an area of 2 cm2. The sample surface was polished with emery paper with a grit of 800 and ultrasonically cleaned.
Figure 1 shows a schematic diagram of the equipment used in this experiment. For the step before the electric furnace, we installed oxygen supply equipment, i.e., the oxygen pump sensor. Using this oxygen pump sensor, we supplied oxygen and induced a reaction between hydrogen and oxygen. The introduction gas was Ar–10% H2, and the flow rate was 30 mL min−1. We used the oxygen pump sensor to regulate the reaction of oxygen and hydrogen. In this study, we performed an experiment with a constant current with the objective of clarifying the amount of oxygen supply. We placed samples in a vertical electric furnace from Siliconit (SILICONIT CO. LTD, Tokyo, Japan) and heated them to 900 °C over one hour. This temperature was maintained for four hours, and then the furnace was cooled. We also installed a tubular hydrogen sensor and an oxygen sensor in the next step after the electric furnace to measure the partial pressures of hydrogen and oxygen in the emitted gas atmosphere.
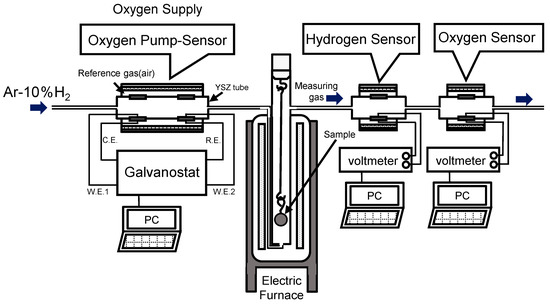
Figure 1.
Experimental setup of the oxidation experiment using the hydrogen and oxygen sensors.
Figure 2 shows a schematic diagram of the oxygen pump sensor from Figure 1. Platinum (Pt) was applied to the inside and outside of a yttria-stabilized zirconia tube, which was the electrolyte for the oxygen pump sensor. Subsequently, Pt was used for the electrodes of the oxygen pump and oxygen sensor. The sensor temperature was 850 °C.
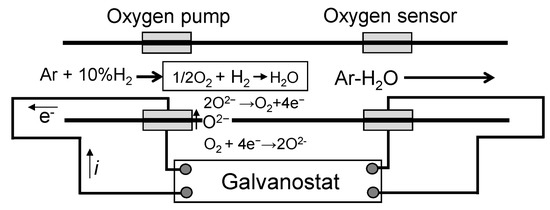
Figure 2.
Schematic depicting the principle of the oxygen pump-sensor.
For the oxygen sensor, we substituted the measured electromotive force to calculate the partial pressure of oxygen () according to Nernst Equation (3).
Here, R = gas constant (J K−1 mol−1), T = temperature (K), F = the Faraday constant (A s mol−1), E = measured electromotive force (E), and = reference gas (atmosphere: 0.21 atm). By applying current to the area between the two electrodes attached to the electrolyte tube, oxide ions could be moved within the oxygen pump. As Equation (4) shows, oxygen was generated on the anode side. Oxygen was supplied to the electrolyte tube using this mechanism.
Outside of the tube: O2 + 4e− → 2O2−, inside of the tube: 2O2 → O2 + 4e−
When this oxygen and hydrogen in the atmosphere go through an electrochemical reaction on the surface of the Pt electrodes, water vapor is generated. By precisely controlling the oxygen supply, the reaction of hydrogen in the atmosphere with oxygen can be regulated.
We then measured the current applied during supplying of oxygen, I, and calculated the amount of oxygen supplied, J, by substituting it into Faraday’s law shown in Equation (5).
Here, F = the Faraday constant (A s mol−1), I = applied current (A), and J = the amount of oxygen (mol s−1) supplied to the tube by the oxygen pump. Therefore, the amount of the supplied oxygen can be accurately controlled with this current value.
Figure 3 shows a schematic diagram of (a) the hydrogen sensor and (b) the oxygen sensor. The hydrogen and oxygen sensors are both annular. The hydrogen sensor has a length of 200 mm, an outer diameter of 10 mm, and an inner diameter of 7.0 mm. The oxygen sensor has a length of 250 mm, an outer diameter of 10 mm, and an inner diameter of 8.5 mm. We applied 10 mm-wide bands of Pt on the inside and outside of the sensor and used these as electrodes. Pt was applied with a width of approximately 3 mm from the inner and outer electrodes to the outer terminals to conduct electricity. As the hydrogen sensor, we used a CaZr0.9In0.1O3−α tube, which is a proton conductor. As the oxygen sensor, we used a yttria-stabilized zirconia tube (8 mol% Y2O3–ZrO2), which is an oxide ion conductor.
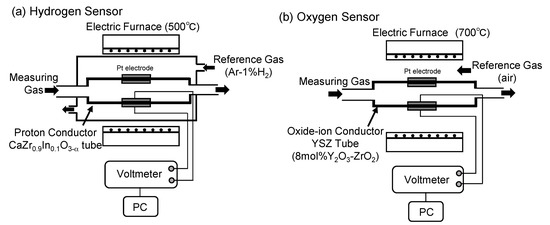
Figure 3.
Schematic of the hydrogen (a) and oxygen (b) sensors.
Electromotive force measured by the hydrogen and oxygen sensors was substituted into the Nernst Equations (6) and (7) to calculate the partial pressures of oxygen and hydrogen.
Here, R = gas constant (J K−1 mol−1), T = temperature (K), F = the Faraday constant (A s mol−1), E = measured electromotive force (V), = reference gas (atmosphere, 21% O2, 0.21 atm), and = reference gas (Ar–1.09% H2, 0.01 atm). Due to the properties of the sensors, the electrode with a higher partial pressure of hydrogen became the negative electrode for the hydrogen sensor, while the electrode with a higher partial pressure of oxygen became the positive electrode for the oxygen sensor. The hydrogen and oxygen sensors were operated at 500 °C and 700 °C, respectively.
First, we confirmed that proton conductors can accurately detect hydrogen concentrations at 500 °C. Figure 4 shows the relationship between the hydrogen partial pressure set using Ar–H2 gas with a known concentration and hydrogen pressure, which was obtained by measuring the electromotive force with sensors and substituting it into Equation (6). The result showed that hydrogen partial pressures calculated from known Ar–H2 gas and from the electromotive force measured with the hydrogen sensor were consistent. Thus, we confirmed that it was operating accurately.
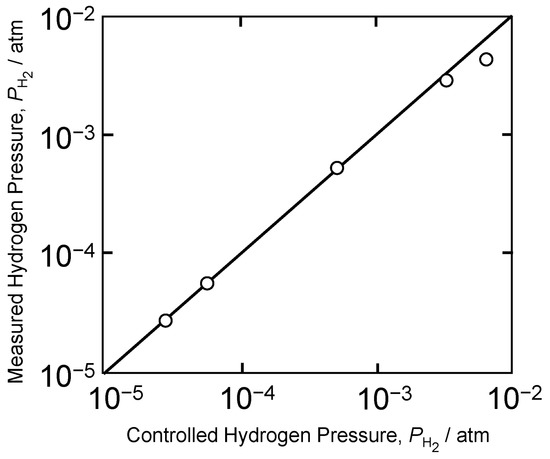
Figure 4.
Relationship between the standard gas and the measured hydrogen partial pressures.
Subsequently, we calculated the amount of generated gas from the measured gas partial pressure. If we treat the measured gas as an ideal gas and assume that Charles’s law holds, the following also holds:
where P = gas pressure, Vr = gas flow volume measured at temperature Tr, n = amount of gas generated, and Tr = temperature at which flow rate was measured, which was 25 °C for this study.
P(dVr/dt) = (dn/dt)RTr,
First, the oxidation reaction of Equation (1) progresses with Fe and oxygen. Under a low-oxygen partial pressure, H2O dissociates with the reaction (9).
H2O = H2 + 1/2O2
Thus, in water vapor under low-oxygen partial pressure, the oxidation reaction of Equation (2) progresses due to the reactions of Equations (1) and (9). The amount of oxygen consumed in the reaction of Equation (1) is obtained from changes in oxygen partial pressure, :
where and are oxygen partial pressures of gas before and after the reaction. The amount of hydrogen generated in the reaction of Equation (2) is obtained from changes in hydrogen partial pressure,
where and are hydrogen partial pressures of gas before and after the reaction.
To calculate the oxidation rate, we first calculated the mol of generated gas per unit time, dn/dt, by substituting and to the pressure term of Equation (8) and converted this to mass. This value was divided by the sample surface area to obtain the oxidation rate. The oxidation rate calculated from changes in oxygen partial pressure represents oxidation by oxygen, while the oxidation rate calculated from changes in hydrogen partial pressure represents oxidation by water vapor.
For samples used for evaluation of environmental resistance, the generated oxide phase was identified with X-ray diffraction (RIGAKU RINT2200V, Tokyo, Japan). Furthermore, we used a field emission scanning electron microscope and electron probe microanalyzer (JEOL, JSM-7800F, Tokyo, Japan) to observe and analyze sample cross-sections.
3. Results
3.1. Amount of Oxygen Supply with Changes in Oxygen and Hydrogen Partial Pressure
Figure 5 shows the time dependence of oxygen partial pressure measured with the oxygen sensor. It shows that in atmospheres without an oxygen supply, the oxygen partial pressure was 10−20 atm. This can be considered as a reducing atmosphere where pure iron was not oxidized.
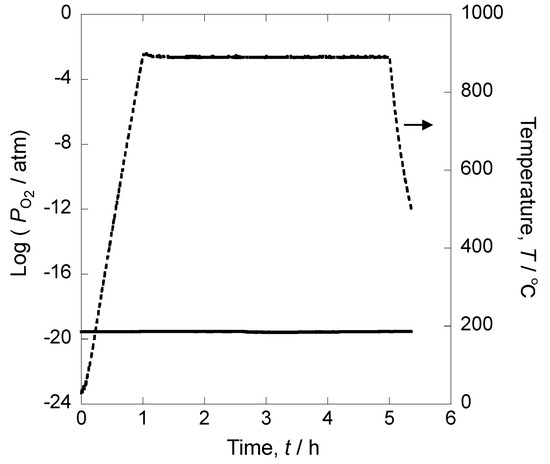
Figure 5.
Time dependence of oxygen partial pressure without oxygen supply.
Figure 6 shows the relationship between time and oxygen supply, which was calculated by applying a current with the pump of the oxygen pump-sensor to supply oxygen and then using the current value for Faraday’s law. One can observe that a constant amount of oxygen was supplied from the oxygen pump sensor during the oxidation experiment. As this supplied oxygen and hydrogen in the atmosphere react, the atmosphere can be regulated. With a current of 350 mA, oxygen was supplied at 2.05 × 10⁻² mL s−1 to the pipe. The amount of supply increased with the applied current, and at 450 mA, oxygen was supplied at 2.63 × 10⁻² mL s−1. Thus, the amount of oxygen supplied can be precisely regulated by the oxygen pump sensor.
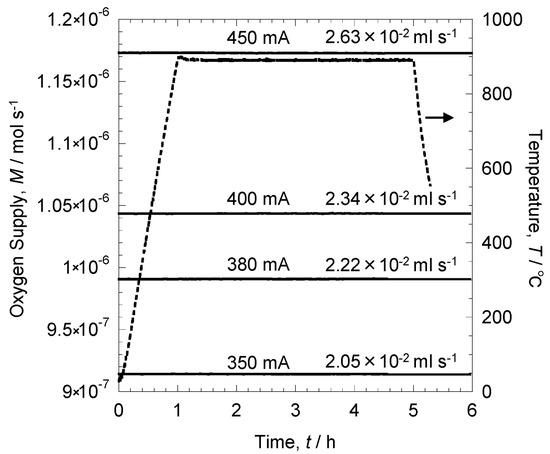
Figure 6.
Time dependence on the amount of oxygen supply.
Figure 7 shows the result of oxygen partial pressures measured with the oxygen sensor and hydrogen partial pressures measured with the hydrogen sensor when a current was applied after the step using the oxidation furnace. The experiment was conducted without the Fe sample. Conditions for the applied current were as follows: 0 mA with no oxygen supply, and 350 mA, 380 mA, 400 mA, and 450 mA with oxygen supply. The current was applied and maintained at the same level for 30 min and subsequently changed. Under an atmosphere with no current (0 mA) and no oxygen supply, oxygen and hydrogen partial pressures were 10−19.5 atm and 10−1 atm, respectively. Since Ar–10% H2 was used for gas, one can see that the hydrogen sensor operated accurately. Since oxygen partial pressure was 10−19.5 atm, this reduced the atmosphere. Since iron oxide, FeO, is generated at 900 °C and 10−15.7 atm, we assumed that iron oxide would not be generated in this environment [28]. We applied current to this environment to supply oxygen. At 350 mA, the oxygen and hydrogen partial pressures were 10−16 atm and 10−3 atm, respectively. In other words, with an oxygen supply, hydrogen in the atmosphere reacted, and hydrogen partial pressure decreased. However, when a current of 380 mA was applied, oxygen partial pressure rapidly increased while hydrogen partial pressure rapidly decreased. This behavior means that with oxygen supply from the current of 380 mA, all hydrogen in the atmosphere reacted with oxygen. When the current was further increased, oxygen partial pressure increased, and hydrogen partial pressure decreased, indicating that oxygen exceeding the hydrogen–oxygen reaction was supplied. By precisely regulating the oxygen supply by controlling the current, oxygen and hydrogen partial pressures can be changed.
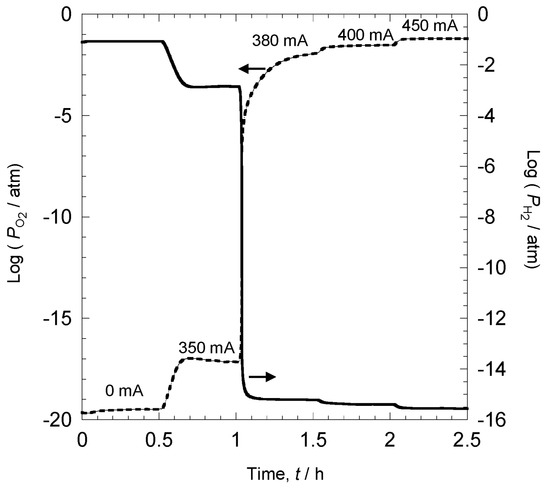
Figure 7.
Relationship between oxygen partial pressure, hydrogen partial pressure, and applied current.
Figure 8 shows changes in oxygen and hydrogen partial pressures when the current was continuously changed from 0 mA to 450 mA. The sweep speed of the current was 1.875 mA min−1. Without current, oxygen and hydrogen partial pressures were the same as that shown in Figure 5. By applying current to supply oxygen, the oxygen partial pressure gradually increased. However, up to close to 350 mA, the increase in oxygen partial pressure was limited, and oxygen partial pressure at 350 mA was 10−18 atm. Since oxygen partial pressure was low, it is likely that hydrogen remained in the atmosphere. When the current exceeded 350 mA, oxygen partial pressure rapidly increased, indicating that all hydrogen in the atmosphere began reacting with oxygen at a current of around 350 mA. When the current exceeded 350 mA, all hydrogen reacted, resulting in excess oxygen in the atmosphere. At 450 mA, oxygen partial pressure increased to 10−1 atm. Meanwhile, the initial hydrogen partial pressure was 10−1 atm; however, with the application of the current, hydrogen partial pressure gradually decreased. Similar to the oxygen partial pressure, there was no notable drop in hydrogen partial pressure until 350 mA, decreasing to approximately 10−3 atm. However, when the current exceeded 350 mA, hydrogen partial pressure rapidly dropped. Thus, by measuring hydrogen partial pressure, the amount of hydrogen in the atmosphere can be accurately measured, and the reaction behavior of hydrogen and oxygen can be analyzed.
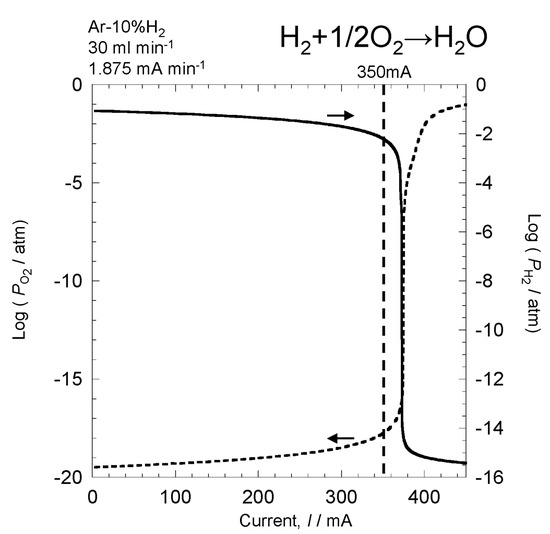
Figure 8.
Changes in oxygen partial pressure and hydrogen partial pressure when the current is changed continuously.
3.2. Oxygen Partial Pressure and Hydrogen Partial Pressure in Oxidation Experiments
Figure 9 shows temporal changes in oxygen and hydrogen partial pressures when Fe was oxidized under each atmosphere. Oxygen partial pressure (a) was constant at 0 mA, indicating that there was virtually no oxidation by oxygen. At 350 mA, oxygen partial pressure before holding the high temperature increased more than that at 0 mA. While holding 900 °C, oxygen partial pressure dropped to 10−18 atm though no major change was observed. Meanwhile, at 380 mA, 400 mA, and 450 mA, oxygen partial pressure was high before holding the high temperature. While it barely changed as temperature increased, it rapidly dropped to 900 °C. This indicates that oxygen in the atmosphere and pure iron were reacting. Subsequently, at 380 mA, oxygen partial pressure maintained a value of 10−17 atm while the temperature was held at 900 °C. At 400 mA, oxygen partial pressure gradually increased. At 450 mA with a high oxygen supply, oxygen partial pressure rapidly increased after 20 min. In contrast, hydrogen partial pressure (b) was high at 0 mA and 350 mA before the high temperature and hardly changed while the temperature was held at 900 °C. However, at 380 mA, 400 mA, and 450 mA, where the oxygen supply was high, hydrogen partial pressure rapidly increased when the oxidation temperature reached 900 °C. This indicates that hydrogen was generated due to oxidation. At 380 mA, hydrogen partial pressure remained high while the temperature was held at 900 °C. After the oxidation test, hydrogen partial pressure returned to the value observed before applying the high temperature. At 400 mA and 450 mA, hydrogen partial pressure rapidly dropped after 30 min and 10 min, respectively. Thus, at 400 mA and 450 mA, oxidation by water vapor was suppressed during oxidation.
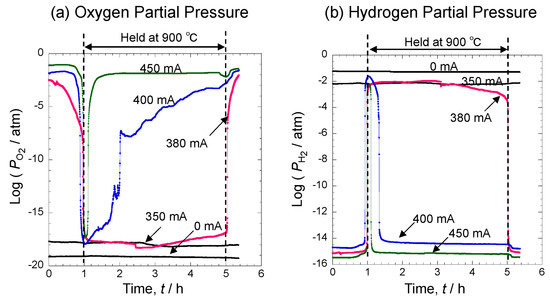
Figure 9.
Changes in oxygen partial pressure (a) and hydrogen partial pressure (b) when pure iron is oxidized.
3.3. Oxidation Rate under Each Atmosphere
Figure 10 shows the time dependence of oxidation rates at 380 mA, 400 mA, and 450 mA. Black parts indicate oxidation by water vapor, while gray parts indicate oxidation by oxygen. The calculation method is shown under experimental methods. The oxidation rate at the boundary between oxidation by oxygen and by water vapor was 0.04 mg cm−2 min−1, 0.15 mg cm−2 min−1, and 0.75 mg cm−2 min−1 at 380 mA, 400 mA, and 450 mA, respectively. This difference was caused by the difference in initial oxygen partial pressure, indicating that when oxygen partial pressure was high, was high, which led to a high rate of oxidation by oxygen at the boundary. Though the oxidation rate was low at 380 mA, oxidation by water vapor occurred at a higher proportion than oxidation by oxygen. However, at 400 mA, oxidation by oxygen occurred as the temperature increased, and when the temperature reached 900 °C, both oxidation by oxygen and water vapor occurred. Subsequently, oxidation by water vapor disappeared, leaving only oxidation by oxygen. Thus, by using the oxygen and hydrogen sensors, it is possible to analyze oxidation by differentiating oxidation by oxygen and oxidation by water vapor. At 450 mA with a large amount of oxygen supply, oxidation by oxygen occurred during temperature increase, and oxidation by water vapor also progressed once the temperature reached 900 °C. However, the proportion of oxidation by water vapor was limited, where much of the oxidation was dominated by oxygen. In addition, the oxidation rate was higher at 450 mA with an oxygen supply. Thus, it was demonstrated that the oxidation rate increases with an increasing amount of oxygen supply.
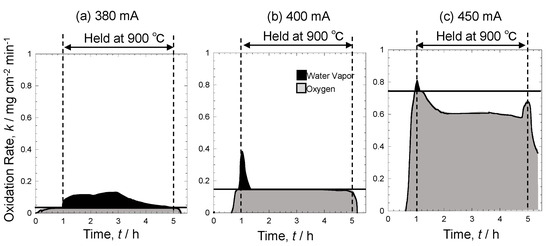
Figure 10.
Time dependence of oxidation rate at 380 mA (a), 400 mA (b), and 450 mA (c).
3.4. Cross-Sectional Structure after Environmental Resistance Evaluation
Figure 11 shows the cross-sectional structure of samples oxidized at 0 mA (a), 350 mA (b), and 400 mA (c) for 5 h. At 0 mA, no oxidation occurs. At 350 mA with a limited oxygen supply, the generated oxide was a single layer of FeO. As the results of oxygen partial pressure in Figure 7 suggest, oxygen partial pressure during oxidation was 10−17 atm, which is why a single layer of FeO formed. Meanwhile, the oxide became a multi-layered structure at 400 mA with a high oxygen supply. From the base, FeO and Fe3O4 formed, with a thin film of Fe2O3 toward the surface. In addition, the FeO was thick, indicating the occurrence of accelerated oxidation. The result of oxygen partial pressure in Figure 7 shows that it gradually increased during oxidation, generating Fe3O4 and Fe2O3. Therefore, a difference in oxygen supply led to different forms of oxides.
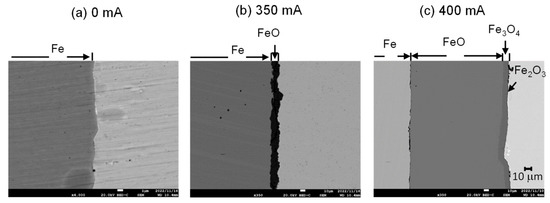
Figure 11.
Cross-sectional microstructure after oxidation at 0 mA (a), 350 mA (b), and 400 mA (c). (Magnification 4000 (a), 350 (b), and (c), Accelerating Voltage 20 kV).
4. Discussion
4.1. Relationship between Supplied Oxygen and Atmosphere
Figure 12 shows changes in oxygen partial pressure (Figure 8) and an enlargement of the section from 2.5 h to 3.5 h. At 350 mA, oxygen partial pressure was low; however, when the current exceeded 350 mA, oxygen partial pressure rapidly increased. The amount of current applied to the oxygen pump sensor was 350 mA. The amount of oxygen supply calculated from this value using Faraday’s law was 2.0 × 10⁻² mL s−1. The flow rate of Ar–10% H2 in this experiment was 30 mL min−1. Therefore, when converted to hydrogen flow, the value obtained was 5.0 × 10⁻² mL s−1. Since the value of hydrogen was twice that of oxygen, all supplied oxygen reacted with hydrogen to generate water vapor under the oxygen supply condition of 350 mA. This indicates that an environment with a current lower than 350 mA is a hydrogen–water vapor environment, and an environment with a current higher than 350 mA is an oxygen–water vapor environment. When the oxygen supply is low, oxidation by water vapor is dominant, and when the oxygen supply is high, oxidation by oxygen is dominant. Therefore, environmental resistance dramatically changes according to the oxygen supply.

Figure 12.
Relationship between oxygen partial pressure, water vapor generation, and applied current.
Figure 13 shows the hydrogen partial pressure calculated from the applied current by using Equation (12). The equation of the gas state can be expressed as Equation (12) using Faraday’s law.
where P = hydrogen partial pressure (atm), I = current (A), R = gas constant (0.082 atm L K−1 mol−1), T = flow rate measurement temperature (K), n = mass of gas (mol), F = the Faraday constant (A s mol−1), and V = flow rate (L s−1).
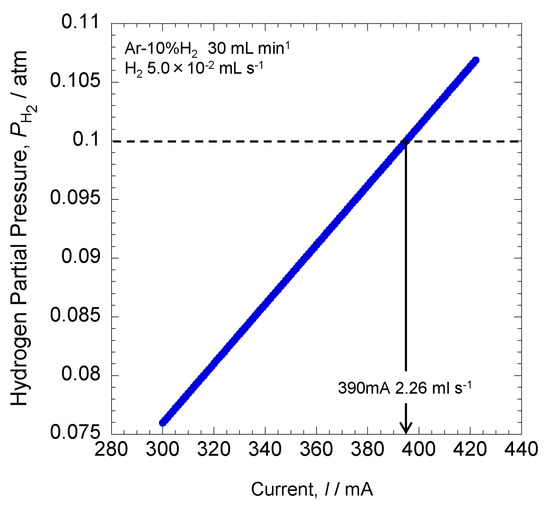
Figure 13.
Relationship between the applied current and the hydrogen partial pressure.
The hydrogen partial pressure on the vertical axis completely reacts with oxygen due to the application of current on the horizontal axis. The calculation shows that at 390 mA, hydrogen partial pressure was 0.1 atm. This indicates that all hydrogen–oxygen reactions occurred at 390 mA. In this experiment, the oxygen partial pressure rapidly increased at 380 mA, while hydrogen partial pressure decreased. Thus, the present result was consistent with the calculation. The error was likely from changes in the flow rate of Ar–10% H2 gas during the experiment.
4.2. Relationship between the Amount of Oxygen Supply and Increase in Oxidation
Figure 14 shows changes in mass gain at each current. The horizontal axis shows the applied current, and the vertical axis shows the mass gain. At 0 mA, there was no mass gain, indicating that there was no oxidation of pure iron. At 350 mA, the mass gain was approximately 3.5 mg cm−2 and is assumed to be oxidation by water vapor only. At 380 mA, oxidation by oxygen joined oxidation by water vapor, which led to a rapid increase in mass gain. The reason for further mass gain at 400 mA and 450 mA was likely to be the atmosphere becoming an oxygen–water vapor environment, leading to oxidation by oxygen being the dominant oxidation (Figure 8), which, in turn, increased mass gain. In other words, oxidation by water vapor does not have a notable impact on environmental resistance. However, when oxygen is added to the environment, materials exhibit accelerated oxidation. In this experiment, oxygen supply at 400 mA and 450 mA was 2.34 × 10⁻² mL s−1 and 2.63 × 10⁻² mL s−1, respectively. The present experiment showed that this difference of 2.9 × 10⁻³ mL s−1 dramatically changed oxidation behavior.
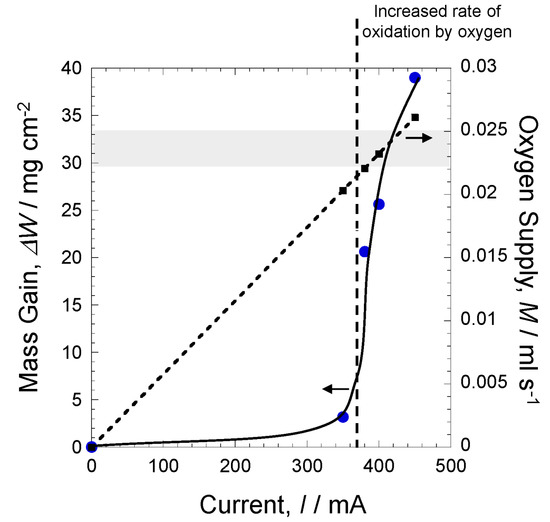
Figure 14.
Relationship between the mass gain and the applied current.
Figure 15 shows the schematic diagram of oxidation mechanisms at each current. At 350 mA, hydrogen and oxygen partial pressures were 10−3 atm and 10−17 atm. Since this was a reducing environment, only oxidation by water vapor occurred. At 380 mA and 400 mA, oxygen partial pressure increased, and hydrogen partial pressure decreased; thus, oxidation by oxygen and water vapor were both occurring. With a further increase in current, oxidation by oxygen became dominant. At 450 mA, only oxidation by oxygen occurred.
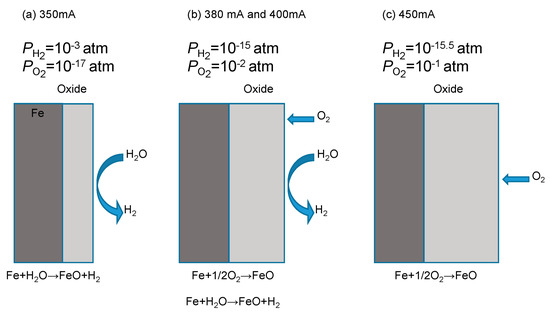
Figure 15.
Oxidation behavior at each current: 350 mA (a), 380 mA, 400 mA (b), and 450 mA (c).
Therefore, by controlling the hydrogen–oxygen reaction and analyzing the gas after oxidation, it was possible to differentiate and analyze oxidation by oxygen as opposed to oxidation by hydrogen.
5. Conclusions
- (1)
- Using the oxygen pump sensor, we accurately regulated the amount of oxygen supply. The result showed that at 350 mA, oxygen was supplied at 2.05 × 10⁻² mL s−1. By increasing the current to 450 mA, oxygen was supplied at 2.63 × 10⁻² mL s−1;
- (2)
- We examined the reaction mechanism of hydrogen and oxygen with oxygen supply using the hydrogen and oxygen sensors. The result showed that at 350 mA, oxygen and hydrogen partial pressures were 10−17 atm and 10−3 atm. At this point, all hydrogen in the atmosphere reacted with oxygen;
- (3)
- We conducted an oxidation experiment by changing the amount of oxygen supply to the atmosphere and found that oxygen and hydrogen partial pressures did not change notably when the oxygen supply was low. However, as the amount of oxygen supply increased, oxygen and hydrogen partial pressures dramatically changed with oxidation;
- (4)
- We differentiated and analyzed oxidation by water vapor and oxygen by using hydrogen and oxygen sensors and found that oxidation by oxygen was dominant in an environment with a high oxygen supply;
- (5)
- With results for current and oxygen partial pressure obtained from the oxygen pump sensor, we clarified the oxygen supply necessary for hydrogen–oxygen reactions.
Author Contributions
Conceptualization, M.F., and H.T.; Formal analysis, S.H.; Investigation, S.H.; Resources, M.F.; Data curation, S.H.; Writing—original draft, M.F.; Writing—review and editing, H.T.; Visualization, M.F.; Supervision, M.F.; Project administration, M.F.; Funding acquisition, M.F. All authors have read and agreed to the published version of the manuscript.
Funding
This research received no external funding.
Data Availability Statement
Data sharing is not applicable to this article.
Conflicts of Interest
The authors declare no conflict of interest.
References
- Momirlan, M.; Veziroglu, T.N. The properties of hydrogen as fuel tomorrow in sustainable energy system for a cleaner planet. Int. J. Hydrogen Energy 2005, 30, 795–802. [Google Scholar] [CrossRef]
- Matsuo, Y.; Endo, S.; Nagatomi, Y.; Shibata, Y.; Komiyama, R.; Fujii, Y. A quantitative analysis of Japan’s optimal power generation mix in 2050 and the role of CO2-free hydrogen. Energy 2018, 165, 1200–1219. [Google Scholar] [CrossRef]
- Trattner, A.; Klell, M.; Radner, F. Sustainable hydrogen society–vision, findings and development of a hydrogen economy using the example of Austria. Int. J. Hydrogen Energy 2022, 47, 2059–2079. [Google Scholar] [CrossRef]
- Fukumoto, M.; Kawamori, Y.; Sonobe, H.; Hara, M.; Kaneko, H. Investigation of high-temperature oxidation in steam for Ni-Al alloys using the combination of a hydrogen sensor and an oxygen pump-sensor. Oxid. Met. 2018, 89, 357–373. [Google Scholar] [CrossRef]
- Fukumoto, M.; Kawamori, Y.; Hara, M. Investigation of cyclic oxidation in Ar-H2O for NiAl containing Hf or Zr by the combination of a hydrogen sensor and an oxygen pump-sensor. Corros. Sci. 2019, 149, 68–74. [Google Scholar] [CrossRef]
- Fukumoto, M.; Nakajima, K.; Kawamori, Y. Investigation of alumina formation and oxidation rate of Ni-5 wt%Al-X wt%Cr alloy using hydrogen sensor and oxygen pump sensor. Oxid. Met. 2020, 94, 191–204. [Google Scholar] [CrossRef]
- Fukumoto, M.; Nakajima, K. Effect of oxygen on water vapor oxidation of Fe by oxygen partial pressure control using gas sensor. High Temp. Corros. Mater. 2023, 99, 47–61. [Google Scholar]
- Fukumoto, M.; Hara, S.; Nakajima, K.; Takahashi, H.; Murakami, H. Effect of oxygen on the oxidation of Ni-base alloy in a hydrogen environment. In Proceedings of the 2022 International Symposium on High-Temperature Oxidation and Corrosion, Takamatsu, Japan, 16–21 October 2022; pp. 195–196. [Google Scholar]
- Mikkelsen, L.; Linderoth, S. High temperature oxidation of Fe-Cr alloy in O2-H2-H2O atmospheres; microstructure and kinetics. Mater. Sci. Eng. 2003, 361, 198–212. [Google Scholar] [CrossRef]
- Dudziak, T.; Łukaszewicz, M.; Simms, N.; Nicholls, J. Analysis of high temperature steam oxidation of superheater steels used in coal fired boilers. Oxid. Met. 2016, 85, 171–187. [Google Scholar] [CrossRef]
- Fujii, C.T.; Meussner, R.A. The mechanism of the high-temperature oxidation of iron-chromium alloys in water vapor. J. Electrochem. Soc. 1964, 111, 1215–1221. [Google Scholar] [CrossRef]
- Asteman, H.; Svensson, J.-E.; Norell, M.; Johansson, L.-G. Influence of water vapor and flow rate on the high-temperature oxidation of 304L; effect of chromium oxide hydroxide evaporation. Oxid. Met. 2000, 54, 11–26. [Google Scholar] [CrossRef]
- Laverde, D.; Gómez-Acebo, T.; Castro, F. Continuous and cyclic oxidation of T91 ferritic steel under steam. Corros. Sci. 2004, 46, 613–631. [Google Scholar] [CrossRef]
- Żurek, J.; Wessel, E.; Niewolak, L.; Schmitz, F.; Kern, T.-U.; Singheiser, L.; Quadakkers, W. Anomalous temperature dependence of oxidation kinetics during steam oxidation of ferritic steels in the temperature range 550–650 °C. Corros. Sci. 2004, 46, 2301–2317. [Google Scholar] [CrossRef]
- Ehlers, J.; Young, D.; Smaardijk, E.; Tyagi, A.; Penkalla, H.; Singheiser, L.; Quadakkers, W. Enhanced oxidation of the 9%Cr steel P91 in water vapour containing environments. Corros. Sci. 2006, 48, 3428–3454. [Google Scholar] [CrossRef]
- Essuman, E.; Meier, G.H.; Żurek, J.; Hänsel, M.; Singheiser, L.; Quadakkers, W.J. Enhanced internal oxidation as trigger for breakaway oxidation of Fe-Cr alloys in gases containing water vapor. Scr. Mater. 2007, 57, 845–848. [Google Scholar] [CrossRef]
- Essuman, E.; Meier, G.H.; Żurek, J.; Hänsel, M.; Quadakkers, W.J. The effect of water vapor on selective oxidation of Fe-Cr alloys. Oxid. Met. 2008, 69, 143–162. [Google Scholar] [CrossRef]
- Pujilaksono, B.; Jonsson, T.; Halvarsson, M.; Panas, I.; Svensson, J.-E.; Johansson, L.-G. Paralinear oxidation of chromium in O2 + H2O environment at 600–700 °C. Oxid. Met. 2008, 70, 163–188. [Google Scholar] [CrossRef]
- Saunders, S.R.J.; Monteiro, M.; Rizzo, F. The oxidation behaviour of metals and alloys at high temperatures in atmospheres containing water vapour: A review. Prog. Mater. Sci. 2008, 53, 775–837. [Google Scholar] [CrossRef]
- Othman, N.K.; Othman, N.; Zhang, J.; Young, D.J. Effects of water vapour on isothermal oxidation of chromia-forming alloys in Ar/O2 and Ar/H2 atmospheres. Corros. Sci. 2009, 51, 3039–3049. [Google Scholar] [CrossRef]
- Othman, N.K.; Zhang, J.; Young, D.J. Temperature and water vapour effects on the cyclic oxidation behaviour of Fe-Cr alloys. Corros. Sci. 2010, 52, 2827–2836. [Google Scholar] [CrossRef]
- Pujilaksono, B.; Jonsson, T.; Heidari, H.; Halvarsson, M.; Svensson, J.-E.; Johansson, L.-G. Oxidation of binary FeCr alloys (Fe-2.25Cr, Fe-10Cr, Fe-18Cr and Fe-25Cr) in O2 and in O2+H2O environment at 600 °C. Oxid. Met. 2011, 75, 183–207. [Google Scholar] [CrossRef]
- Jonsson, T.; Pujilaksono, B.; Heidari, H.; Liu, F.; Svensson, J.-E.; Halvarsson, M.; Johansson, L.-G. Oxidation of Fe-10Cr in O2 and O2 + H2O environment at 600 °C: A microstructural investigation. Corros. Sci. 2013, 75, 326–336. [Google Scholar] [CrossRef]
- Hooshyar, H.; Jonsson, T.; Hall, J.; Svensson, J.-E.; Johansson, L.G.; Liske, J. The effect of H2 and H2O on the oxidation of 304L-stainless steel at 600 °C: General behaviour (part I). Oxid. Met. 2016, 85, 321–342. [Google Scholar] [CrossRef]
- Cheng, L.; Sun, B.; Du, C.; Gao, W. High-Temperature Oxidation Behavior of Fe-10Cr Steel under Different Atmospheres. Materials 2021, 14, 3453. [Google Scholar] [CrossRef]
- Chyrkin, A.; Cossu, C.; Svensson, J.-E.; Froitzheim, J. Internal Oxidation of a Fe-Cr Binary Alloy at 700–900 °C: The Role of Hydrogen and Water Vapor. Oxid. Met. 2022, 98, 273–289. [Google Scholar] [CrossRef]
- Chen, J.; Shen, Z.; Zhang, J. Effect of Water Vapor and Oxygen Partial Pressure on Oxidation of Fe and Fe-Cr Alloys. High Temp. Corros. Mater. 2023, 99, 15–46. [Google Scholar] [CrossRef]
- Saito, Y.; Atake, T.; Maruyama, T. High-Temperature Oxidation of Metals, 3rd ed.; Uchida Rokakuho Publishing Co., Ltd.: Tokyo, Japan, 1997; p. 10. [Google Scholar]
Disclaimer/Publisher’s Note: The statements, opinions and data contained in all publications are solely those of the individual author(s) and contributor(s) and not of MDPI and/or the editor(s). MDPI and/or the editor(s) disclaim responsibility for any injury to people or property resulting from any ideas, methods, instructions or products referred to in the content. |
© 2023 by the authors. Licensee MDPI, Basel, Switzerland. This article is an open access article distributed under the terms and conditions of the Creative Commons Attribution (CC BY) license (https://creativecommons.org/licenses/by/4.0/).