Abstract
Gas–liquid intermittent flow is a kind of flow pattern that distinguishes itself from the conventional flow by the apparent non-steady feature, which causes serious corrosion issues, including localized corrosion. Although it widely exists in wet gas pipelines, how the gas–liquid intermittent flow influences CO2 corrosion of pipeline steels remains a problem to be clarified. In this work, a testing device that enables good simulation of gas–liquid intermittent flow in wet gas pipelines under various conditions was developed and used to perform experimental studies, combining electrochemical tests and corrosion morphology observations. The result shows that flow velocity and gas–liquid ratio act together to affect the CO2 corrosion behavior of X70 steel in typical intermittent flow conditions. The flow velocity has a more profound effect on the corrosion rate, while the gas–liquid ratio is associated with the occurrence of localized corrosion. The effect of the gas–liquid ratio on corrosion behavior was discussed.
1. Introduction
Corrosion is always a significant safety threat for low-carbon steel pipelines in the oil and natural gas industry. Wet gas pipelines have experienced more frequent corrosion issues due to the mixed phase of gas and liquid flow in the pipelines [1,2,3]. In wet gas pipelines, water and acidic gases, such as CO2, constitute a corrosive environment. Due to factors including the pipeline geometry, water content, water/gas flow velocity, etc. [4,5,6,7,8], gas and liquid in the wet gas pipeline would have various gas–liquid flow patterns, making the corrosion problem more complex. Despite a relatively good understanding of corrosion in a single-phase flow, corrosion in the gas–liquid flow remains an important but challenging problem to solve.
Currently, a few studies have proved that the complex gas–liquid flow regime can lead to more severe corrosion problems than the conventional single-phase flow [9,10,11,12]. Slug flow is one of the typical gas–liquid flow regimes [8] that draws wide attention and has been studied a lot. Villarreal et al. [12] illustrated that the corrosion process in the slug flow is enhanced by turbulence. Cui et al. [9] studied the CO2 corrosion of pipeline steel in multiphase flow and suggested that the complexity of slug flow is associated with variable pipeline wall shear stress and the state of wall wetting, and a combination of erosion and corrosion undermines the pipeline. Zheng et al. [11,13] suggested that slug flow has particular hydrodynamics that causes larger fluctuations of mass transfer coefficient and wall shear stress, significantly increasing the corrosion rate. At the same time, the corrosion product film on the steel surface is slowed or undermined. As a result, the corrosion product film is not fully covered and non-protective. In addition, cavitation resulting from the collapse of bubbles in the slug flow was also assumed to contribute to the breakdown of the corrosion product film [14,15]. Differences in the protectiveness of corrosion film on the local area of the steel surface could then cause localized corrosion due to the galvanic effect [16].
Gas–liquid intermittent flow shares the same unsteady feature as the slug flow, but it has not been able to draw so much attention from the researchers. For one thing, it is because the gas–liquid intermittent flow is not well defined. Herein, we refer to the state that the gas and liquid alternatively flow past the pipeline surface as the intermittent gas–liquid flow. Under gas flow conditions, the pipeline surface is not dry but covered by a thin water film. From this aspect, the pipeline surface experiences a flow that changes between bulk flow and thin water film in gas flow. Until now, no suitable parameters have been used to describe this flow condition. For another, the gas–liquid intermittent flow emerges as a portion of the slug flow in horizontal or slightly inclined pipelines or happens at the climbing section of the water accumulation zone of wet gas pipelines. Although corrosion in the climbing section is more severe than that in the other sections [1,17,18], previous studies always neglect the gas–liquid intermittent flow condition and try to explain the phenomenon with parameters commonly used in steady flow conditions. The experimental setup and the corrosion testing methods used can also not support systemic and detailed studies. By referring to the wet–dry cyclic corrosion in atmospheric conditions and marine corrosion in the splash zone, it is essential to consider the unsteady feature, i.e., the alternation of bulk flow and thin water film. According to previous studies, the thin water film has a distinct effect on the diffusion of species joining in the electrochemical reactions and corrosion product film formation [19,20,21]. However, this effect has never been considered in the gas–liquid two-phase flow, not to mention the gas–liquid intermittent flow. Studies focusing on the gas–liquid intermittent flow and incorporating all possible affecting mechanisms are urgently required.
To study the specific gas–liquid intermittent flow, an apparatus that can simulate the specific flow pattern and enables electrochemical testing is necessary. Given the alternation of wetting–drying in atmosphere corrosion and marine corrosion, designs used to study the corrosion in wet–dry cycle conditions can provide helpful guidance for the design of apparatus for the research work. A review of the literature shows that a commonly used apparatus in wet–dry cycle corrosion studies can be separated into two types: corrosion coupons are fixed while the height of the solution is adjusted relative to the corrosion coupon periodically [22], and corrosion coupons periodically enter and leave the solution by adjusting its height [23] or moving in a circular motion [24]. The first type is more consistent with the actual corrosion environment in this work, i.e., gas and liquid intermittently flow through a pipe section. Yang [25] studied the CO2 corrosion of X65 steel under different surface wetting conditions with a specially designed device, with which the wetting condition was controlled by adjusting the height of the solution while the steel sample was fixed. This work is the first trial to explore CO2 corrosion in intermittent wetting conditions, and the results were different from those in conventional full immersion conditions. However, this device did not consider the flow condition in an actual pipeline, so a new design is essential for the experimental study of steel corrosion in a real gas–liquid intermittent flow.
In this work, a testing device that enables controlling temperature, flow velocity, and especially the intermittent flow of gas and liquid was assembled. A unique design was utilized to simulate the gas–liquid intermittent flow by letting the water solution and gas take turns flowing separately in the testing section so that the gas–liquid intermittent frequency/gas–liquid ratio is controllable. This design was then combined with electrochemical corrosion tests and corrosion morphology observations to study the CO2 corrosion behavior of X70 steel under typical gas–liquid intermittent flow conditions.
2. Experimental
2.1. Material
High-strength pipeline steels, such as X80 and X100, have been produced for a long time, but they are only used in isolated projects or installed for demonstrations. X70 steel, however, keeps extending its application worldwide in the oil and gas industry due to its relatively higher strength, lower cost, less manufacturing requirement, and better weldability. So, X70 steel was used as the working electrode material, and its chemical composition is shown in Table 1. The X70 steel was machined into a cylindrical shape with a diameter of 10 mm and a height of 10 mm. The electrode was then used in electrochemical tests and corrosion morphology characterization. A carbon rod with a diameter of 25 mm was used as the counter electrode. A high-purity zinc (99.98%) wire with a diameter of 1 mm was used as the reference electrode, as its potential was found to become stable very quickly after exposure to the CO2-containing solution [19].

Table 1.
Chemical composition of X70 steel (wt. %).
The X70 steel electrode was first welded to a copper wire, then solidified with the high purity zinc electrode by epoxy to form an assembly electrode. The assembly electrode had a working surface area of 0.785 cm2, and the distance between the working electrode and the zinc reference electrode was 2 mm. The assembly electrode was grounded by waterproof abrasive papers from 200 sequentially up to 1000 grit, and then it was cleaned with acetone and deionized water, dried with flowing cold air, and stored in a desiccator before being used.
2.2. Solution
The solution used in the tests was 1 wt% NaCl, which was made of deionized water (its resistivity was 0.78 MΩ·cm) and analytical grade agent NaCl. Gas bubbling for the solution with pure CO2 gas (99.95%) was performed at least 4 h before all the tests and maintained throughout the test.
2.3. Experimental Setup
A testing device that enables CO2 corrosion electrochemical tests under gas–liquid intermittent flow conditions was designed and assembled, as shown in Figure 1. The device includes a corrosion electrochemical testing cell, an environmental chamber, a gas pump, a timing controller, a liquid pump, a supersonic flow meter, a heating element, a temperature controller, and pipes and fittings that connect each component. The timing controller was frequently switched between the liquid pump and gas pump so that only one works at a time and creates the intermittent gas–liquid flow that flows through the testing cell. The electrochemical testing cell enables in situ 3-electrode electrochemical tests under different flow conditions. The dimension of the cross-section of the electrochemical testing cell was 20 mm × 20 mm. The inclination angle of the electrochemical testing cell is adjustable between −30° and 30°, and a 0° inclination angle (i.e., the electrochemical testing cell is horizontally placed) was maintained for the experimental study in this work. The heating element, the thermal sensor, and the temperature controller can control the temperature according to the specific requirement of an experimental test.
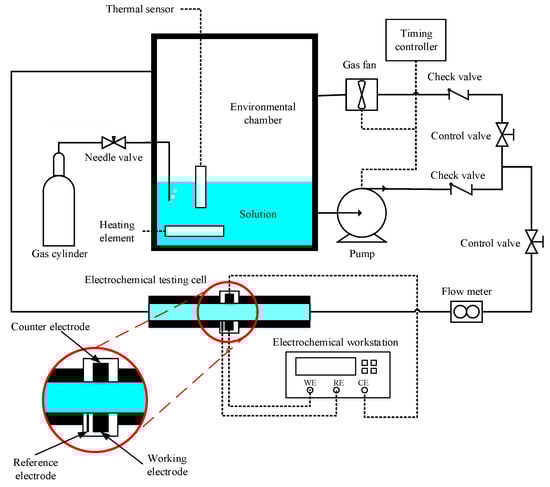
Figure 1.
A schematic diagram of the testing device.
2.4. Experimental Procedure and Corrosion Tests
Various experimental studies were performed with the testing device. According to the standard NACE SP0110, wet gas is defined as gas containing condensable hydrocarbons or water below their dew points (i.e., free liquids exist) [17]. This work currently only considers free water that accumulates and flows in the horizontal pipeline. The liquid flow rate was initially set to 0.5 m/s and increased (to 1 m/s, 1.5 m/s, and 2 m/s) when required. The gas flow velocity was always controlled to be the same as the liquid. In each cycle, the water solution would first flow through the testing cell for a particular time, and then it was switched to the gas flow. The time ratio for gas flow and water solution flow was treated as the gas–liquid ratio. Four ratios were studied in this work, including 5:1, 2:1, 1:1, and 0:1. The total time for each cycle was initially set to 30 min to simulate a relatively low-frequency gas–liquid intermittent flow, and the whole time for each experiment was 12 h. The temperature was maintained at 40 °C [26]. Electrochemical tests and corrosion morphology observation were performed after each experiment.
Electrochemical tests include open circuit potential (OCP), Electrochemical Impedance Spectroscopy (EIS), and potentiodynamic polarization. A stable potential, which varied within 2 mV over 5 min, was obtained during the OCP test. A perturbation amplitude of 10 mV was applied in the EIS test, and the test frequency range was 10−2~105 Hz. The scan range for potentiodynamic polarization tests was −0.25~0.25 V (versus OCP), and the scan rate was 0.333 mV/s.
After gas–liquid intermittent flow condition exposure tests, steel samples were taken out and dried carefully, and then, a Nova Nano SEM 450 Scanning Electron Microscope (SEM) was used to observe the corrosion morphology of the sample working surface, and an Energy Dispersive X-ray Spectroscopy (EDS) was used to characterize the composition of the corrosion product.
3. Results and Discussion
3.1. Potentiodynamic Polarization Test
Potentiodynamic polarization tests of X70 steel under different gas-liquid ratios were performed; the results are shown in Figure 2. At the low liquid flow velocity, i.e., 0.5 m/s, the liquid ratio significantly affects both anodic and cathodic current density. However, only cathodic current densities are affected by the gas–liquid ratio at the liquid flow velocity of 2 m/s. For all conditions, the anodic behavior is featured as being under activation control. The diffusive limiting cathodic current density is observed over a specific cathodic potential range. This result means the mass transfer of cathodic reactive species is the rate-determining step in the corrosion process. At the liquid flow velocity of 0.5 m/s, the diffusive limiting cathodic current density increases with the increasing gas–liquid ratio. At the liquid flow velocity of 2 m/s, the diffusive limiting cathodic current density, however, decreases on the whole as the gas–liquid ratio increases.
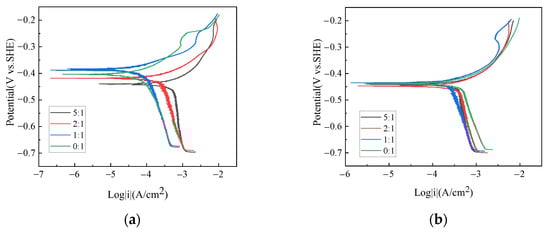
Figure 2.
Potentiodynamic polarization plots of X70 steel under different gas–liquid ratios and at the liquid flow velocity of (a) 0.5 m/s and (b) 2 m/s.
3.2. EIS Tests
Figure 3 shows the EIS plots of X70 steel under different gas–liquid ratio conditions at the liquid flow velocity of 0.5 m/s and 2 m/s, respectively. For all test conditions, the plots include a capacitive loop in the high-frequency range and an inductive loop in the low-frequency range, so the corrosion mechanism for all conditions is, by and large, the same. The size of the capacitive loop varies with gas–liquid ratios. This shows that corrosion velocities are different under different conditions. For the liquid flow velocity of 0.5 m/s, the largest capacitive loop is seen with the gas–liquid ratio of 0:1, and the smallest one is seen with the gas–liquid ratio of 5:1. For the liquid flow velocity of 2 m/s, however, the largest capacitive loop is seen with the gas–liquid ratio of 1:1, and the smallest one is seen with 0:1.
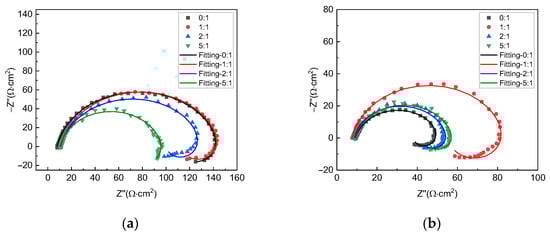
Figure 3.
EIS plots of X70 steel under different gas−liquid ratios and at the liquid flow velocity of (a) 0.5 m/s and (b) 2 m/s.
To further quantitively study the corrosion behavior, the EIS plots were fitted with the equivalent circuit diagram shown in Figure 4. In this figure, RS is the solution resistance between the reference electrode and the working electrode. CPE is the constant phase element and can be calculated as ZCPE = Y0−1 (jω)−1. Rct is the charge transfer resistance. L is the inductance, and RL is the inductance resistance. Rct is inverse to the corrosion rate, so a large Rct corresponds to a low corrosion rate.
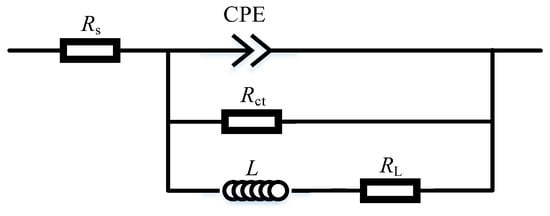
Figure 4.
Equivalent circuit diagram.
The fitting result of Figure 3, i.e., Rct, is plotted versus the gas–liquid ratio, as shown in Figure 5. It shows that Rct at the liquid flow velocity of 0.5 m/s is always larger than that at the liquid flow velocity of 2 m/s, indicating that the corrosion rate at the flow velocity of 0.5 m/s is lower. In addition, at the liquid flow velocity of 0.5 m/s, Rct decreases with the gas–liquid ratio. The trend is slightly different at the liquid flow velocity of 2 m/s. When the gas–liquid ratio increases, Rct increases first and then decreases, so the effect of the gas–liquid ratio on the corrosion behavior also depends on the flow velocity.
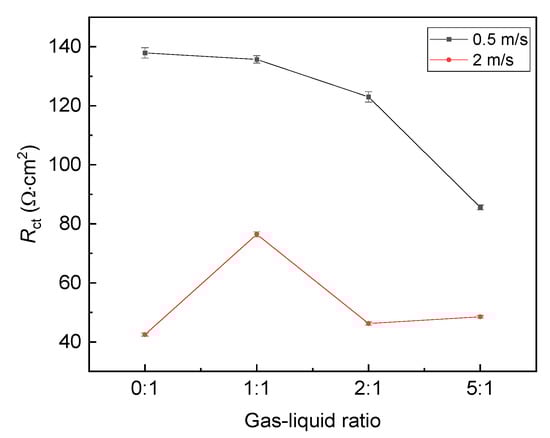
Figure 5.
Fitting result of EIS plots under different gas–liquid ratios.
Figure 6 shows EIS plots of X70 steel under different fluid flow velocities at the gas–liquid ratios of 5:1 and 0:1, respectively. For the gas–liquid ratio of 0:1, the size of the capacitive loop decreases when the flow velocity increases. This result is attributable to the enhanced mass transfer [27] at the steel surface and the high wall shear stress at a higher velocity. For the gas–liquid ratio of 5:1, however, the size of the capacitive loop decreases at first and then increases with the increasing flow velocity, so both the gas–liquid ratio and the flow velocity affect the corrosion behavior.
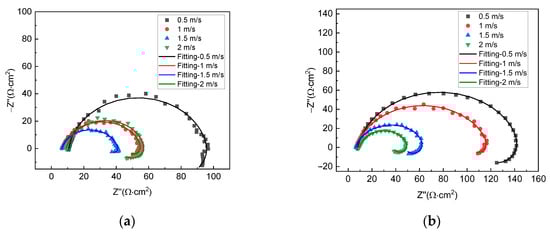
Figure 6.
EIS plots of X70 steel under different liquid flow velocities and gas–liquid ratios: (a) 5:1 and (b) 0:1.
EIS plots in Figure 6 were also fitted, and the fitting result of Rct versus the flow velocity is shown in Figure 7. For the gas–liquid ratio of 0:1, Rct decreases monotonously with the increasing flow velocity. This illustrates that corrosion rate is enhanced at a higher flow velocity. For the gas–liquid ratio of 5:1, Rct decreases at first and then increases, so the effect of flow velocity on corrosion rate can be reshaped by the gas–liquid intermittent flow. In addition, except for the liquid flow velocity of 2 m/s, at other flow velocities, Rct for the gas–liquid ratio of 0:1 is always larger than that of 5:1, showing that a higher gas–liquid ratio is capable of enhancing the corrosion rate to some extent at relatively small flow velocities.
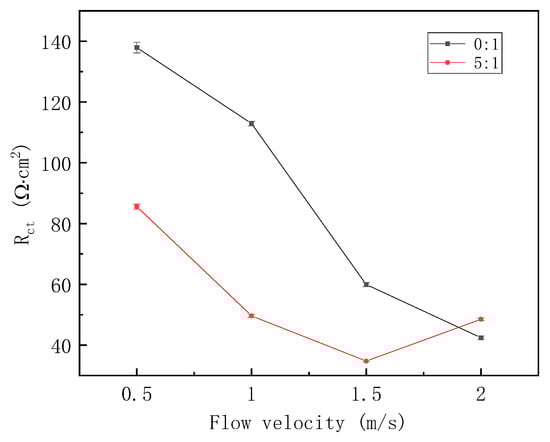
Figure 7.
Fitting result of EIS plots under different fluid flow velocities.
3.3. Corrosion Morphology Observation
Figure 8 shows the SEM plots of X70 steel under the liquid flow velocity of 0.5 m/s and different gas–liquid ratios. It is seen that corrosion products are formed on the steel surface. However, the morphology of the products on the steel surface depends on the gas–liquid ratio. For the gas–liquid ratio of 5:1, corrosion products on the steel surface are relatively uniform but seem very porous. Corrosion products formed on the steel surface at the gas–liquid ratio of 0:1 are not uniform over the entire area; i.e., some areas are covered with corrosion products while others are not. Moreover, cracks are found in the corrosion products.
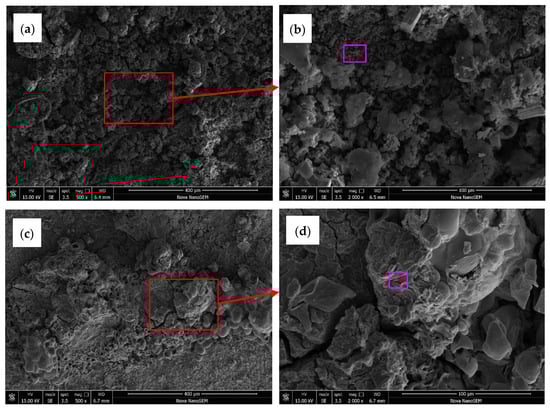
Figure 8.
SEM plots of X70 steel under the liquid flow velocity of 0.5 m/s and different gas–liquid ratios: (a,b) 5:1 and (c,d) 0:1. (Note: (b) and (d) are the enlargement of local area of (a,c), respectively, as indicated by the red rectangle. The purple rectangles in (b,d) represent EDS detection area).
When the liquid flow velocity was increased to 2 m/s, the SEM plots of X70 steel under different gas–liquid ratios are shown in Figure 9. It shows that corrosion products formed on the steel surface are much less than at the liquid flow velocity of 0.5 m/s. This could be due to the erosion effect of water flow on the corrosion film. For the gas–liquid ratio of 5:1, the corrosion products in different areas vary in quantity and compactness. Craters are found to exist between the corrosion products in a localized area. For the gas–liquid ratio of 0:1, the bare substrate with minor corrosion products on the surface is seen.
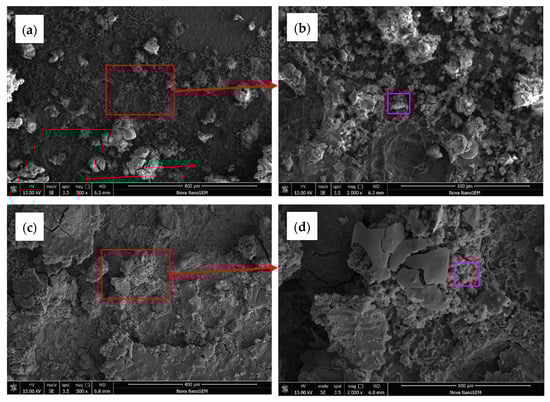
Figure 9.
SEM plots of X70 steel under the velocity of 2 m/s and different gas–liquid ratios: (a,b) 5:1 and (c,d) 0:1. (Note: (b) and (d) are the enlargement of local area of (a,c), respectively, as indicated by the red rectangle. The purple rectangles in (b,d) represent EDS detection area).
EDS results of the corrosion product on the steel surface (for the detection area, refer to the purple rectangular area in Figure 8 and Figure 9) are shown in Table 2. It shows that Fe, C, and O are the major elements of the corrosion product film on the steel surface, and Na and Cl constitute the balance. Different elements’ atomic number percentage varies at different velocities and gas–liquid ratios. For the gas–liquid ratio of 5:1, the ratio of O to C is always around 3, indicating that FeCO3 could be the corrosion product. However, for the gas–liquid ratio of 0:1, the ratio is only a bit larger than 1, which indicates the corrosion product could be a mix of FeCO3 and Fe3C.
Table 2.
Atomic number percentage under different flow conditions.
The X70 steel samples, after exposure to various flow conditions, were chemically cleaned with hydrochloric acid and hexamethylene tetramine solution [28] and observed with a stereomicroscope. The morphology of the steel surface is shown in Figure 10 (note that the reddish-brown color is the color of the steel matrix after chemical cleaning and drying in the air). For the liquid flow velocity of 0.5 m/s, corrosion craters are found on a local area of the electrode working surface at the gas–liquid ratio of 5:1. At the gas–liquid ratio of 0:1, corrosion craters are relatively uniformly distributed on the entire electrode working surface. Furthermore, the size of craters at the gas–liquid ratio of 0:1 seems smaller than that at the gas–liquid ratio of 5:1. This phenomenon is more profound for the velocity of 2 m/s. At the liquid flow velocity of 2 m/s and the gas–liquid ratio of 0:1, the corrosion morphology is typical of uniform corrosion. At the same liquid flow velocity but a higher gas–liquid ratio, i.e., 5:1, the corrosion morphology denotes a sign of localized corrosion with deeper and non-uniformly distributed craters.
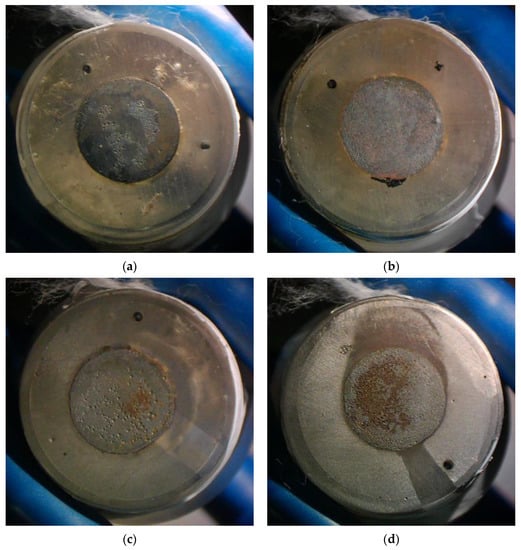
Figure 10.
Surface morphology of the samples substrate after exposure to different flow conditions: (a) 0.5 m/s-5:1, (b) 0.5 m/s-0:1, (c) 2 m/s-5:1, (d) 2 m/s-0:1.
4. Discussion
4.1. CO2 Corrosion Mechanism
For the corrosion of X70 steel in the saturated CO2 environment, the anodic reaction is the oxidation of iron, and the chemical reaction is as follows:
In this oxidation process, FeOHads is formed as the intermediate product [20] and is responsible for the occurrence of the inductance loop in the EIS plots. Cathodic reactions in the saturated CO2 environment depend upon the solution pH. As the solution pH is 3.98, the reduction of hydrogen ions and carbonic acid could be the dominant cathodic reactions as [29]:
The reduction reaction of hydrogen ions and carbonic acid is so fast that the relatively slow transportation process of hydrogen ions and carbonic acid from the solution to the metal surface becomes the rate-controlling process. This is responsible for diffusive limiting current density at the cathodic branch of the potentiodynamic polarization curves.
A comparison of potentiodynamic polarization curves under intermittent flow (gas–liquid ratio of 5:1) and full immersion flow (gas–liquid ratio of 0:1) shows that the intermittent flow will not affect the electrochemical reaction mechanism but affect the reaction kinetics or the corrosion rate. The extent of effect depends on the flow velocity and the gas–liquid ratio.
Formation of iron carbonate scale (FeCO3), as shown in Equation (4), is the process that makes CO2 corrosion complicated [30].
FeCO3 will not form only if the product of [Fe2+] and [] exceeds the solubility of FeCO3 (Ksp) or the supersaturation of FeCO3 () [31] is greater than 1. As the formation of FeCO3 film includes two consecutive subprocesses [32], i.e., nucleation and growth, the rate of each subprocess is also dependent on the value of . The formation rate and morphology of the corrosion film and its protection on the steel corrosion rate can be different for different values of . For the rapid formation of FeCO3 film on the steel in bulk solution, a high temperature, e.g., 80 °C or higher, is necessary. However, for the thin water film conditions, FeCO3 film can be formed more quickly [33,34] as FeCO3 has a higher formation rate for the same supersaturation level. Equation (5) [35] was used to represent the formation rate (Rp) of FeCO3, which is a function of the activation energy, the surface area-to-volume ratio (S/V), Ksp, and (FeCO3 film can form only when is larger than 1). Due to the small volume of thin water film, S/V for a thin water film condition could be much higher than that for the bulk water solution.
where A and B are constants, R is the gas constant, and Tk is the temperature.
Once formed, FeCO3 could be destroyed by mechanical forces and/or chemical dissolution [36,37]. Many discussions have been about whether water flow can destroy the corrosion film. Corrosion film may be locally removed by micro-turbulence, by which localized corrosion would then be initiated [38]. However, Li et al. [39] showed that even for the slug flow, the highest measured values were the orders of 100 Pa (the maximum wall shear stress value was about 2 to 4 times higher than the mean wall shear stress), which is insufficient to damage the protective FeCO3 film mechanically. Han et al. [38] believed that the chemical “grey zone”, in which the electrode surface area maintains a state that is neither highly supersaturated nor undersaturated, is essential for the localized corrosion to propagate. Singer [33] stated that the condensation rate could control the corrosion and the overall aggressiveness of the environment by resulting in fluctuation in the water chemistry, during which the corrosion product formation rate and continuity are affected. The alternation of gas and liquid flow will also lead to a state similar to the water condensation process [40]. As a result, the water chemistry in the vicinity of the steel surface could be significantly affected, thus affecting the FeCO3 film on the steel surface.
4.2. Effect of Flow Velocity
Under steady flow conditions, there exists a diffusion sublayer [29], the thickness of which is inversely proportional to flow velocity and could be the main factor affecting the mass transfer rate. A thinner diffusion sublayer benefits the fast mass transfer and thus a high cathodic reaction rate. As a result, the corrosion rate at high flow velocities is higher than that at smaller flow velocities, which is the reason for the experimental result seen in Figure 7. Moreover, a high flow velocity is also associated with a higher mass transfer rate and wall shear stress, which is adverse to the rapid formation of compact FeCO3 film. By comparing Figure 8 and Figure 9 at the full emersion condition (gas–liquid ratio of 0:1), it is apparent that less and porous corrosion film is seen for high flow velocity conditions. For the gas–liquid intermittent flow with a gas–liquid ratio of 5:1, the corrosion rate of X70 steel follows the same trend for the gas–liquid ratio of 0:1 on the whole; i.e., the corrosion rate increases with the increasing liquid flow velocity. Nevertheless, the corrosion rate decreases when the liquid flow velocity continually increases to 2 m/s. For this phenomenon, the effect of intermittent flow should be considered.
A correlation analysis was made by which the Spearman correlation coefficient between Rct and flow parameters was determined, using the package scikit-learn (Version 1.2.0) with Python, as shown in Table 3. It shows that Rct negatively correlates with the flow velocity and the gas–liquid ratio. Based on each correlation coefficient’s absolute value, flow velocity has a more profound effect on the Rct and the steel corrosion rate than the gas–liquid ratio.
Table 3.
Correlation coefficient between Rct and flow parameters.
4.3. Effect of Gas–Liquid Ratio
In this work, the gas–liquid ratio was arbitrarily used to quantitively describe the state of the gas–liquid intermittent flow. The flow regime affects the CO2 corrosion behavior of the X70 steel. Furthermore, this flow regime can be separated into two stages, i.e., bulk water solution flow and gas flow. For the flow of bulk water solution, the steel surface is fully immersed in the solution. A thin water film exists on the steel surface when gas flows in the pipe. As indicated in previous studies, in terms of mass transfer [19,21] and water chemistry [41], corrosion behavior in the water film can be very different from that in the bulk flow. Undoubtedly, the alternation between bulk water and thin water film leads to more complex corrosion that is different from the corrosion in a single flow condition.
As shown in Figure 2, the gas–liquid ratio could affect the cathodic and/or anodic reactions depending on the flow velocity. The enhanced cathodic reaction rate is associated with the enhanced mass transfer of reactive species, i.e., H+ and H2CO3. The thin water film at the steel surface and the stirring effect during the alternation between bulk water flow and gas flow could contribute to the enhanced mass transfer. At the low flow velocity, due to the formation of Fe3C and FeCO3 on the steel surface [11], the local anodic reaction rate was accelerated due to the galvanic effect [42]. Additionally, this galvanic effect may also be responsible for pits on the steel surface. At the high flow velocity, the enhanced mass transfer and high wall shear stress hinder the formation of FeCO3 scale and remove the isolated Fe3C on the steel surface, so the corrosion products are less on the steel surface. The corrosion rate is always very high, with fresh substrate directly exposed to the corrosive solution. Nonetheless, at high gas–liquid ratios, FeCO3 could also form at the local area of the steel surface, providing some protection to the steel and reducing the corrosion rate at the high flow velocity.
Due to the alternation of bulk water and thin water film, except for the varied wall shear stress and mass transfer, water chemistry in the vicinity of the steel surface is also considerably influenced. For the thin water film condition, FeCO3 can get saturated more quickly due to the high anodic dissolution rate and small volume of solution, promoting the growth of FeCO3 scale on the steel surface. When the thin water film condition is changed to the bulk water solution condition, the ion concentration will be diluted, and the formed FeCO3 scale could be dissolved with a small FeCO3 supersaturation. Thus, growth and dissolution of FeCO3 are repeated during the gas–liquid intermittent flow, FeCO3 only forms at the local area of the steel surface. As a result, the area formed with FeCO3 is protected, while the other area with no FeCO3 can experience an enhanced corrosion rate resulting from the galvanic effect between the two areas.
5. Conclusions
With the self-designed and -assembled testing device, CO2 corrosion of X70 pipeline steel in the simulated typical gas–liquid intermittent flow was studied with electrochemical tests and corrosion morphology observations. The conclusions were drawn as follows:
- (1)
- The flow velocity has a more profound effect on the corrosion rate than the gas–liquid ratio. Overall, the corrosion rate of X70 pipeline steel increases with the flow velocity, with the highest gas–liquid ratio (i.e., 5:1) studied in this work as an exception.
- (2)
- The effect of gas–liquid ratio on the corrosion rate of X70 pipeline steel depends on the flow velocity. At a low flow velocity, the corrosion rate always increases with the gas–liquid ratio, as both the anodic and cathodic reaction rates are enhanced at higher gas–liquid ratios. At a high flow velocity, the corrosion rate appears to slightly decrease with the gas–liquid ratio on the whole, and the smallest corrosion rate is seen with the gas–liquid ratio of 1:1.
- (3)
- An intermittent flow with a high gas–liquid ratio promotes localized corrosion, regardless of the flow velocity.
- (4)
- The intermittent flow with high gas–liquid ratios promotes the non-uniform formation of FeCO3 scale on the steel surface. The Galvanic series, once formed between the surface with compact FeCO3 scale and the bare steel substrate, stimulates the anodic reaction rate on the steel surface and leads to localized corrosion.
Author Contributions
Conceptualization, Q.L. and W.D.; methodology, Q.L. and W.J.; software, K.Y.; validation, W.D. and B.L.; formal analysis, Q.L. and B.L.; investigation, Q.L.; data curation, W.J.; writing—original draft preparation, Q.L.; writing—review and editing, W.D.; visualization, K.Y.; supervision, W.D.; funding acquisition, Q.L. All authors have read and agreed to the published version of the manuscript.
Funding
This research was funded by the Natural Science Foundation of Shandong Province, grant number No. ZR2019BEE040 and the Fundamental Research Funds for the Central Universities, grant number No. 18CX02001A.
Data Availability Statement
Data will be made available upon request.
Conflicts of Interest
The authors declare no conflict of interest.
References
- Ge, P.L.; Gao, D.L.; Liu, Q.S.; Xu, Y.Y.; Xiao, W.W.; Jia, X.D. Failure analysis on corrosion perforation of sulfur-containing wet gas pipeline in Tahe Oilfield. Pet. Tubul. Goods Instrum. 2021, 7, 79–83. (In Chinese) [Google Scholar]
- Dong, Z.Q.; Xia, Y.; Zhang, J.X. Corrosion perforation failure analysis of a natural gas pipeline in service. Pet. Tubul. Goods Instrum. 2019, 5, 75–78. (In Chinese) [Google Scholar]
- Luo, P.; Zhang, Y.L.; Cai, P.P.; Guo, Z.H.; Chen, H.Y.; Chen, W.B. Analysis and countermeasures of natural gas transmission pipeline internal corrosion accidents. Total Corros. Control 2010, 24, 16–21. (In Chinese) [Google Scholar]
- Zhang, H.Q.; Sarica, C. Low liquid loading gas/liquid pipe flow. J. Nat. Gas Sci. Eng. 2011, 3, 413–422. [Google Scholar] [CrossRef]
- Guan, X.R.; Jin, Y.H.; Wang, J.; Zhang, D.L.; Li, H. Progress in investigating gas-liquid flow and CO2 corrosion in gas transmission pipelines with low liquid loading. Chem. Mach. 2017, 44, 245–251. (In Chinese) [Google Scholar]
- Wang, R.; Lee, B.A.; Lee, J.S.; Kim, K.Y.; Kim, S. Analytical estimation of liquid film thickness in two-phase annular flow using electrical resistance measurement. Appl. Math. Model 2012, 36, 2833–2840. [Google Scholar] [CrossRef]
- Li, J.; Wang, S.; Chen, H.; Xu, H. Numerical simulation of slug formation characteristics of the liquid loading in the gas-liquid multiphase pipeline in rolling terrain. Oil-Gas Field Surf. Eng. 2017, 36, 12–16. (In Chinese) [Google Scholar]
- Liu, X.; Li, Y.; Li, S.; Yuan, Z. Liquid holdup distribution laws and critical inclination angle model of undulating wet gas pipelines. Transp. Storage 2017, 36, 177–184. (In Chinese) [Google Scholar]
- Cui, M.W. Study on CO2 Internal Corrosion and Residual Strength of Multiphase Offshore Pipeline. Ph.D. Thesis, China University of Petroleum (East China), Qingdao, China, 2014. (In Chinese). [Google Scholar]
- Jepson, W.P.; Kang, C.; Wilkens, R. The Effect of Slug Frequency on Corrosion in High Pressure, Inclined Pipelines. In Proceedings of Corrosion 96, Houston, TX, USA, 26 August 1996. [Google Scholar]
- Zheng, D.H.; Che, D.E.; He, L.; Lu, M.X. Effect of slug flow on CO2 corrosion of pipeline in oil and gas industry. Corros. Prot. 2007, 28, 77–81. (In Chinese) [Google Scholar]
- Villarreal, J.; Laverde, D.; Fuentes, C. Carbon-steel corrosion in multiphase slug flow and CO2. Corros. Sci. 2006, 48, 2363–2379. [Google Scholar] [CrossRef]
- Zheng, D.; Che, D.; Liu, Y. Experimental investigation on gas–liquid two-phase slug flow enhanced carbon dioxide corrosion in vertical upward pipeline. Corros. Sci. 2008, 50, 3005–3020. [Google Scholar] [CrossRef]
- Feng, Z.; Cui, M. Influence of Slug Flow on Local Corrosion of Pipelines. Surf. Rev. Lett. 2019, 27, 1950147. [Google Scholar] [CrossRef]
- Li, J.H.; Wang, D.; Xie, F. Failure analysis of CO2 corrosion of natural gas pipeline under flowing conditions. Eng. Fail. Anal. 2022, 137, 106265. [Google Scholar] [CrossRef]
- Wang, W.; Sun, Y.; Wang, B.; Dong, M.; Chen, Y. CFD-Based Erosion and Corrosion Modeling of a Pipeline with CO2-Containing Gas–Water Two-Phase Flow. Energies 2022, 15, 1694. [Google Scholar] [CrossRef]
- SP0110-2018-SG; Wet Gas Internal Corrosion Direct Assessment Methodology for Pipelines. NACE International: Houston, TX, USA, 2018.
- Liu, E.; Li, D.; Zhao, W.; Peng, S.; Chen, Q. Correlation analysis of pipeline corrosion and liquid accumulation in gas gathering station based on computational fluid dynamics. J. Nat. Gas Sci. Eng. 2022, 102, 104654. [Google Scholar] [CrossRef]
- Li, Q.; Zhang, Y.Y.; Liu, G.; Zhu, T.Y.; Tang, X.; Li, Y. CO2 corrosion mechanism of pure Fe under action of uniform water film. J. China Univ. Pet. 2020, 44, 155–161. (In Chinese) [Google Scholar]
- Qian, S.; Cheng, Y.F. Corrosion of X52 steel under thin layers of water condensate in wet gas pipelines. J. Nat. Gas Sci. Eng. 2019, 68, 102921. [Google Scholar] [CrossRef]
- Qian, S.; Cheng, Y.F. Corrosion of steel in a CO2-containing solution droplet generated in wet gas pipelines studied by scanning Kelvin probe. J. Pipeline Sci. Eng. 2022, 2, 71–77. [Google Scholar] [CrossRef]
- Lu, Y.; Wang, R.; Han, Q.; Yu, X.; Yu, Z. Experimental investigation on the corrosion and corrosion fatigue behavior of butt weld with G20Mn5QT cast steel and Q355D steel under dry–wet cycle. Eng. Fail. Anal. 2022, 134, 105977. [Google Scholar] [CrossRef]
- Gong, K.; Wu, M.; Liu, G. Comparative study on corrosion behaviour of rusted X100 steel in dry/wet cycle and immersion environments. Constr. Build. Mater. 2020, 235, 117440. [Google Scholar] [CrossRef]
- Zhao, J.L.; Tang, J.N.; Deng, Y.M.; Luo, J.X.; Zhu, K.J. A Rotary Dry-Wet Cycle Experimental Setup. China Patent 201,420,305,193.1, 31 December 2014. (In Chinese). [Google Scholar]
- Yang, Y. CO2 corrosion of offshore wet-gas flowlines under different surface wetting conditions. Ph.D. Thesis, Southwest Petroleum University, Chengdu, China, 15 June 2019. (In Chinese). [Google Scholar]
- Mansoori, H.; Mirzaee, R.; Esmaeilzadeh, F.; Vojood, A.; Dowrani, A.S. Pitting corrosion failure analysis of a wet gas pipeline. Eng. Fail. Anal. 2017, 82, 16–25. [Google Scholar] [CrossRef]
- Paolinelli, L.D.; Nesic, S. Calculation of mass transfer coefficients for corrosion prediction in two-phase gas-liquid pipe flow. Int. J. Heat Mass Tran. 2021, 165, 120689. [Google Scholar] [CrossRef]
- ASTM G1-03; Standard Practice for Preparing, Cleaning, and Evaluating Corrosion Test Specimens. ASTM International: West Conshohocken, PA, USA, 2011.
- Yang, G.; Song, W.; Zhu, Z.; Ma, Y.; Hao, Y. Effect of liquid flow velocity on corrosion behavior of 20# steel at initial stage under gas-liquid two-phase plug flow condition. Anti-Corrs. Method M. 2020, 67, 415–425. [Google Scholar]
- Barker, R.; Burkle, D.; Charpentier, T.; Thompson, H.; Neville, A. A review of iron carbonate (FeCO3) formation in the oil and gas industry. Corros. Sci. 2018, 142, 312–341. [Google Scholar] [CrossRef]
- Sun, Y.; Nesic, S. A parametric study and modeling on localized CO2 corrosion in horizontal wet gas flow. In Proceedings of Corrosion 2004, New Orleans, LA, USA, 28 March–1 April 2004. [Google Scholar]
- Islam, M.M.; Pojtanabuntoeng, T.; Gubner, R. Corrosion of carbon steel under condensing water and monoethylene glycol. Corros. Sci. 2018, 143, 10–22. [Google Scholar] [CrossRef]
- Singer, M. Study of the localized nature of top of the line corrosion in sweet environment. Corros. Eng. Sect. 2017, 73, 1030–1055. [Google Scholar] [CrossRef]
- Li, Q.; Cheng, Y.F. Modeling of corrosion of steel tubing in CO2 storage. Greenh. Gases 2016, 6, 797–811. [Google Scholar] [CrossRef]
- Sun, W.; Nešić, S. Kinetics of Corrosion Layer Formation: Part 1—Iron Carbonate Layers in Carbon Dioxide Corrosion. Corros. Eng. Sect. 2008, 64, 334–346. [Google Scholar] [CrossRef]
- Tan, Z.; Yang, L.; Zhang, D.; Wang, Z.; Cheng, F.; Zhang, M.; Jin, Y. Development mechanism of internal local corrosion of X80 pipeline steel. J. Mate. Sci. Technol. 2020, 49, 186–201. [Google Scholar] [CrossRef]
- Matamoros-Veloza, A.; Barker, R.; Vargas, S.; Neville, A. Mechanistic insights of dissolution and mechanical breakdown of FeCO3 corrosion films. ACS Appl. Mater. Interfaces 2021, 13, 5741–5751. [Google Scholar] [CrossRef]
- Han, J. Galvanic Mechanism of Localized Corrosion for Mild Steel in Carbon Dioxide. Ph.D. Thesis, Ohio University, Athens, OH, USA, 2009. [Google Scholar]
- Li, W.; Pots, B.F.M.; Brown, B.; Kee, K.E.; Nesic, S. A direct measurement of wall shear stress in multiphase flow—Is it an important parameter in CO2 corrosion of carbon steel pipelines? Corros. Sci. 2016, 110, 35–45. [Google Scholar] [CrossRef]
- Al-Moubaraki, A.H.; Obot, I.B. Top of the line corrosion: Causes, mechanisms, and mitigation using corrosion inhibitors. Arab. J. Chem. 2021, 14, 103116. [Google Scholar] [CrossRef]
- Islam, M.M.; Pojtanabuntoeng, T.; Gubner, R. Condensation corrosion of carbon steel at low to moderate surface temperature and iron carbonate precipitation kinetics. Corros. Sci. 2016, 111, 139–150. [Google Scholar] [CrossRef]
- Sun, J.B.; Zhang, G.A.; Liu, W.; Lu, M.X. The formation mechanism of corrosion scale and electrochemical characteristic of low alloy steel in carbon dioxide-saturated solution. Corros. Sci. 2012, 57, 131–138. [Google Scholar] [CrossRef]


Disclaimer/Publisher’s Note: The statements, opinions and data contained in all publications are solely those of the individual author(s) and contributor(s) and not of MDPI and/or the editor(s). MDPI and/or the editor(s) disclaim responsibility for any injury to people or property resulting from any ideas, methods, instructions or products referred to in the content. |
© 2023 by the authors. Licensee MDPI, Basel, Switzerland. This article is an open access article distributed under the terms and conditions of the Creative Commons Attribution (CC BY) license (https://creativecommons.org/licenses/by/4.0/).